tuning thermally activated delayed fluorescence through ... · tuning thermally activated delayed...
TRANSCRIPT
Tuning Thermally Activated Delayed Fluorescence
through the Solid State Solvation Effect
Dannielle McCarthy
Benjamin Cotts, Milan Delor, Rodrigo Noriega, Naomi Ginsberg
December 2016
Abstract
Solid state solvation (SSS) is applied to an organic light emitting diode emitter molecule,
and SSS is found to be a delicate control over the peak emission, prompt lifetime, delayed
lifetime, and quantum yield of the emitter molecules. This control results from a complex
interaction between SSS from a camphoric acid anhydride (CA) co-dopant and thermally ac-
tivated delayed fluorescence (TADF) of phenoxazine-2, 5-diphenyl-1, 3, 4-oxadiazole (2PXZ-
OXD), the OLED emitter molecule. A significant red shift in emission along with an increase
in prompt lifetime concurrent with a decrease in delayed lifetime was observed. These results
combined with a complicated trend in quantum yield suggest an optimum concentration of 7.5
wt% of the co-dopant molecules. Lifetime results from Optical Heterodyne Detected Optical
Kerr Effect and Transient Absorption spectroscopies provide salient evidence for the proposed
mechanism of SSS.
1
1 Introduction
Climate change is one of the most prominent issues of our century. The production of greenhouse
gases in the environment is a primary contributor to climate change. Coal burning releases harmful
greenhouses gases into the environment and produces byproducts that cause additional pollution
upon disposal. Currently, coal burning is the most popular method for generating electricity in the
US[1], and thus, decreasing overall energy consumption, and particularly decreasing electricity us-
age, is crucial for the efforts to minimize the harm to the environment caused by energy production
and usage.
Since lighting and displays account for eleven percent of the total electricity usage in the US[2],
improving the efficiency of lighting and displays to reduce total energy usage will play an important
role in protecting the planet. In order to address the challenge of climate change head on, we must
focus on researching electronics with exceptional efficiencies that can be easily manufactured so
that these alternative electronic materials can be readily adopted. Organic electronics have proven
to be a promising, new form of efficient electronics. Most prominently, organic light emitting
diodes (OLEDs) have been shown to be an exciting alternative to traditional lighting since they can
outperform other materials used for lighting and displays in terms of efficiency and brilliance while
being cheaper and easier to make than most other luminescent materials.[3] A better understanding
of the basic science behind the properties of OLED emitters will enable OLED devices to be
inexpensively and easily implemented on a large scale using solution-processable materials and
will inform work on other organic electronic systems.
Although OLEDs are a very promising new technology, there are still some hurdles to over-
come to enable complete adoption of high efficiency OLEDs. OLEDs produce luminescence
through a process called electroluminescence, which occurs when two electrical charges combine
and emit light. Due to spin statistics, when the charges combine, triplet states, states where the
electron and hole have the same spin, are produced in a three to one ratio to singlet states, states
where the electron and hole have opposite spins. Since triplet states are generally only strongly
emissive at very low temperatures, the internal quantum efficiency (IQE) of traditional OLEDs
2
at standard operating temperatures is limited to a mere twenty-five percent. In order to realize
an OLED with a one hundred percent IQE, most designs introduce a heavy metal center, such
as iridium or platinum, into the emitter. This change in design increases the spin-orbit coupling
within the emitter molecule through the heavy atom effect, and as a result, the nonradiative triplet
state becomes radiative.[4] Unfortunately, most metals used are expensive rare earth metals, and
since these heavy metals are toxic to most organisms, disposal of the manufacturing byproducts
and of the OLED devices themselves is also costly and potentially harmful to the environment.[4]
In addition, in order to make high quality OLED lights and displays, OLEDs of red, green, and
blue colors must be robust. Unfortunately, OLEDs with a heavy metal center typically make poor
quality blue OLEDs.
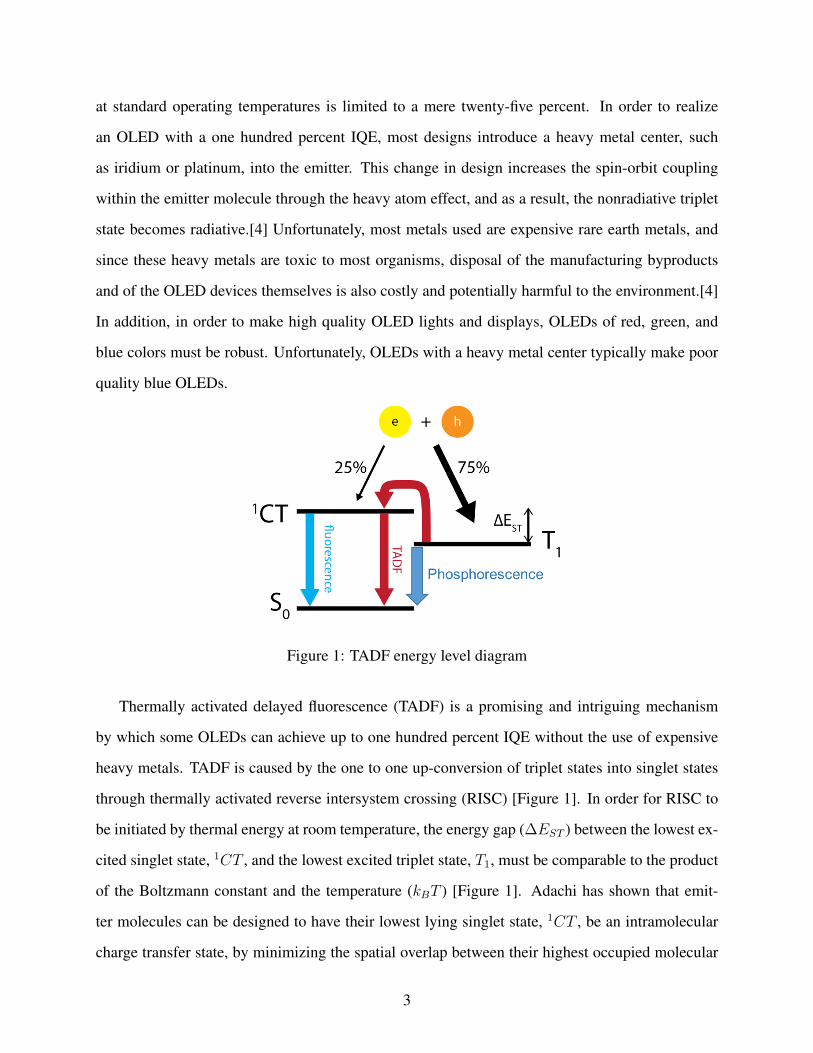
Figure 1: TADF energy level diagram
Thermally activated delayed fluorescence (TADF) is a promising and intriguing mechanism
by which some OLEDs can achieve up to one hundred percent IQE without the use of expensive
heavy metals. TADF is caused by the one to one up-conversion of triplet states into singlet states
through thermally activated reverse intersystem crossing (RISC) [Figure 1]. In order for RISC to
be initiated by thermal energy at room temperature, the energy gap (∆EST ) between the lowest ex-
cited singlet state, 1CT , and the lowest excited triplet state, T1, must be comparable to the product
of the Boltzmann constant and the temperature (kBT ) [Figure 1]. Adachi has shown that emit-
ter molecules can be designed to have their lowest lying singlet state, 1CT , be an intramolecular
charge transfer state, by minimizing the spatial overlap between their highest occupied molecular
3
orbital (HOMO) and lowest unoccupied molecular orbital (LUMO). This small overlap decreases
∆EST by lowering the exchange interaction between the orbitals.[3] Although much has been
done to probe how to induce TADF, the photophysics and dynamics of TADF have not been ex-
tensively explored; understanding the basic science involved in TADF will enable OLED device
engineers to design highly-efficient, long-lasting OLEDs of all colors using inexpensive organic
emitter molecules.
Bulovic demonstrated that the peak emission, and thus the color, of a dye molecule could be
controlled in the solid state through the addition of a small polar co-dopant molecule to the host
system.[5] He postulated that the co-dopant molecule, camphoric anhydride (CA), rotates in the
solid matrix to solvate the dye molecule much like a solvent molecule would rotate to solvate a
solute in the liquid phase. This process, which he coined the solid state solvation (SSS) effect, was
previously only demonstrated on laser dye molecule systems. However, in this work, we show that
SSS is also possible for a TADF system. Adachi has shown that phenoxazine-2, 5-diphenyl-1, 3,
4-oxadiazole (2PXZ-OXD) is a model TADF molecule with up to 14.9 percent external quantum
efficiency.[6] The fluorescence lifetime of 2PXZ-OXD has two components called prompt and
delayed. The prompt component is caused by the immediate emission from the initial population
of the 1CT state, whereas the delayed originates from later emission from the same 1CT state after
excitations cross to the triplet state and return to the singlet state by RISC at delayed times. To
probe how SSS affects a TADF system, we utilized bulk absorbance and fluorescence spectroscopy
to explore how the spectral features are changed by SSS; Time Correlated Single Photon Counting
(TCSPC) and Multichannel Scaling (MCS) mode time resolved spectroscopies were used to study
the trends in the OLED prompt and delayed fluorescence lifetimes; an integrating sphere was
employed to determine the quantum yield.
In TCSPC spectroscopy, a pulsed light source excites a transition in the sample, and single
photons emitted during relaxation are binned according to the time of their detection in a histogram
over the course of a preset detection window. This technique can be used to study the lifetime of
samples on the order of nanoseconds to microseconds. MCS spectroscopy can be used to measure
longer lifetimes. In this mode, the sample is excited with a long burst of light usually on the
4

order of a microsecond. The photons emitted by the sample are then detected in a similar way to
the detection procedure in TCSPC mode. Quantum yield measurements were conducted with an
integrating sphere following the method detailed by de Mello et. al.[7]
Although Bulovic proposed a plausible hypothesis of the SSS, he did not show evidence that
confirms the rotation of the CA in the solid state. Indeed, substituents in the solid state are typically
believed to have greatly hindered motion. Our work illustrates the potential for rotational motion in
a solid matrix. We use Optical Heterodyne Detected Optical Kerr Effect (OHD-OKE) spectroscopy
to explore the rotational motion of camphoric anhydride in the solid state. OHD-OKE spectroscopy
is a powerful, nonresonant technique that can be used to study materials that are non-absorptive.
Previously, OHD-OKE was primarily used on liquid samples[8]; however, in this work, I will show
that it can also be used on amorphous solid samples.
Like a typical pump probe experiment, an OHD-OKE experiment begins with pulses of light
that are generated by an oscillator. These pulses are amplified by a regenerative amplifier before
being split into a high power pulse, which is the pump pulse, and a low intensity pulse, which is
the probe pulse. The probe pulse can be delayed relative to the pump pulse by increasing the probe
path length with a delay stage. The pump pulse induces a transient dipole alignment in the sample,
which makes the sample birefringent, or in other words, makes the sample have a polarization
dependent refractive index. The probe pulse becomes circularly polarized by passing through a
linear polarizer and a quarter wave plate. The parallel and perpendicularly polarized components
of the probe interact with the sample differently. The perpendicular component of the pulse is
used to track the randomization of the dipoles in the sample, and it is separated from the parallel
component by a polarizer. Indeed, since this perpendicular component is parallel to the induced
electric field in the sample, the perpendicular component of the probe light amplifies the signal
strength, or heterodynes, with the sample signal by acting as a local oscillator. Thus, OHD-OKE
spectroscopy offers the necessary signal to noise ratio to detect the complex motions of the co-
dopant molecules due to the increased signal caused by heterodyne detection.[8] The heterodyne
signal can be detected by a photodiode, and the lifetime of the sample can be extracted from traces
of signal versus delay time.
5
Assigning the lifetimes from the OHD-OKE data to a specific process can be challenging,
but combining those measurements with resonant pump-probe experiment can facilitate assigning
a lifetime to a certain dynamical process. As a result, we also conducted Transient Absorption
(TA) measurements to aid in analysis of the OHD-OKE data. TA involves detecting the change in
transmission of a sample. First, the sample is optically pumped on resonance, and an additional
pulse, the probe pulse, also excites the sample at controlled time delays relative to the pump pulse.
Since the pump pulse is exciting some transition from the ground state to the excited state, the
pump pulse should have a low-bandwidth. However, by using a white light pulse for the probe
pulse, changes in transmission can be detected across the sample’s absorption spectra. Spectra are
collected both with and without the pump pulse in order to determine the change in transmission
caused by the pump pulse. The changes in spectra as the delay between the pump and probe pulses
is varied can be assigned to lifetimes in the OHD-OKE spectra of a similar order of magnitude.
Thus, TA can be used to corroborate results from OHD-OKE measurements.
The remainder of this thesis is organized as follows. In the results and discussion section, I
recount our exciting results from each of the experimental techniques detailed above and discuss
what these results suggest about our TADF system and about the mechanism of SSS. I put these
conjectures in context in the conclusion section and suggest what future work should be done
most urgently. Finally, in the methods section, I specify the sample preparation, instruments, and
experimental procedures used in our experiments.
2 Results and Discussion
2.1 Liquid Sample Experiments
2.1.1 Absorbance and Fluorescence
Our initial studies were conducted on liquid samples in order to determine the OLED characteristic
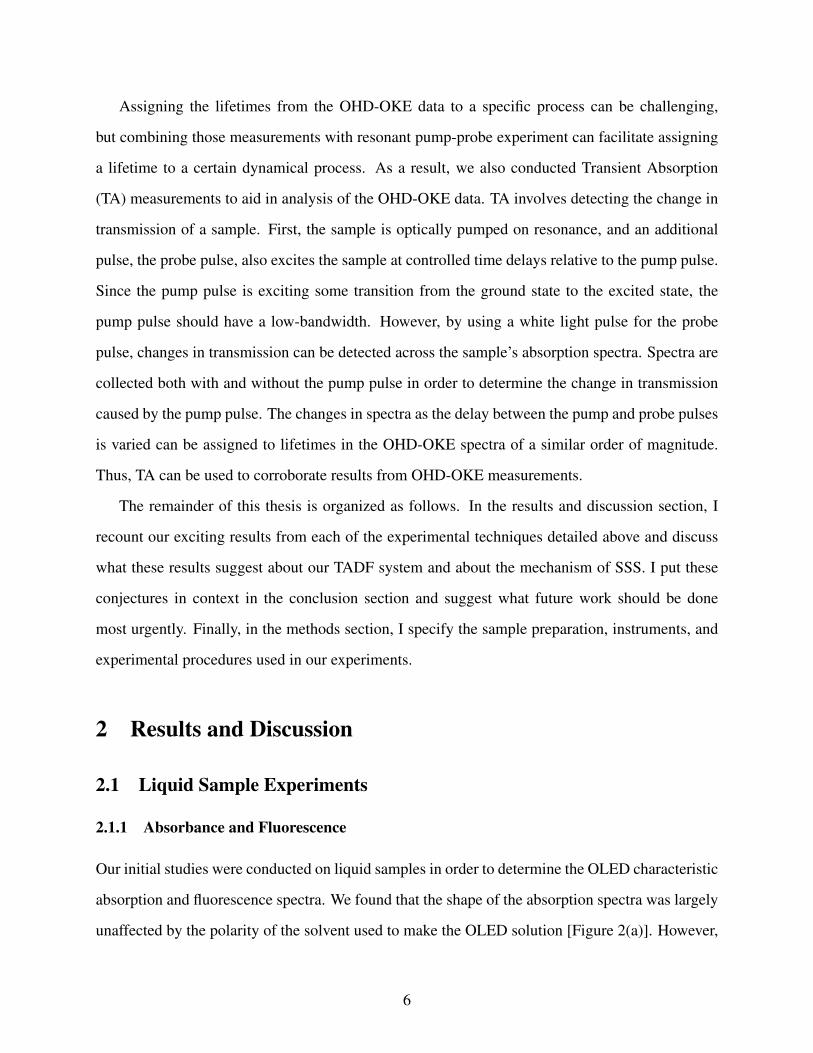
absorption and fluorescence spectra. We found that the shape of the absorption spectra was largely
unaffected by the polarity of the solvent used to make the OLED solution [Figure 2(a)]. However,
6
(a) (b)
Figure 2: (a) Absorbance spectra of 2PXZ-OXD in various solvents. (b) Fluorescence spectra of
2PXZ-OXD in various solvents.
as expected, the fluorescence spectra clearly red shifts as the polarity of the solvent is increased
[Figure 2(b)].
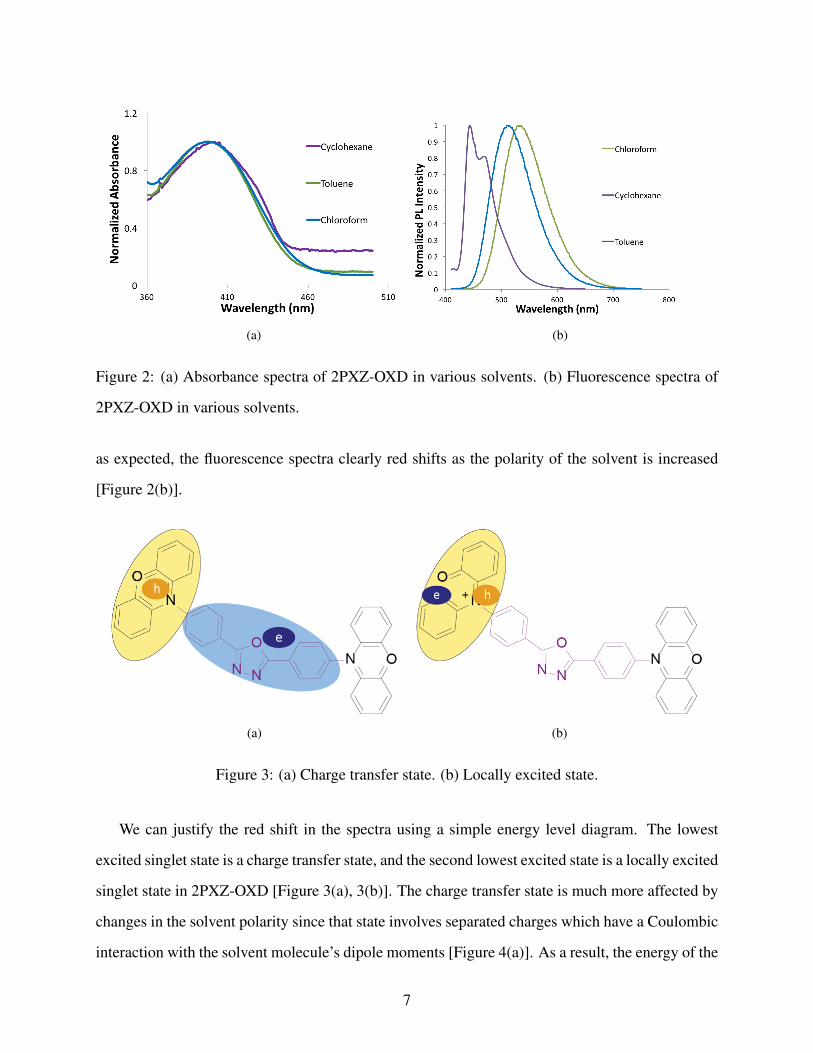
(a) (b)
Figure 3: (a) Charge transfer state. (b) Locally excited state.
We can justify the red shift in the spectra using a simple energy level diagram. The lowest
excited singlet state is a charge transfer state, and the second lowest excited state is a locally excited
singlet state in 2PXZ-OXD [Figure 3(a), 3(b)]. The charge transfer state is much more affected by
changes in the solvent polarity since that state involves separated charges which have a Coulombic
interaction with the solvent molecule’s dipole moments [Figure 4(a)]. As a result, the energy of the
7
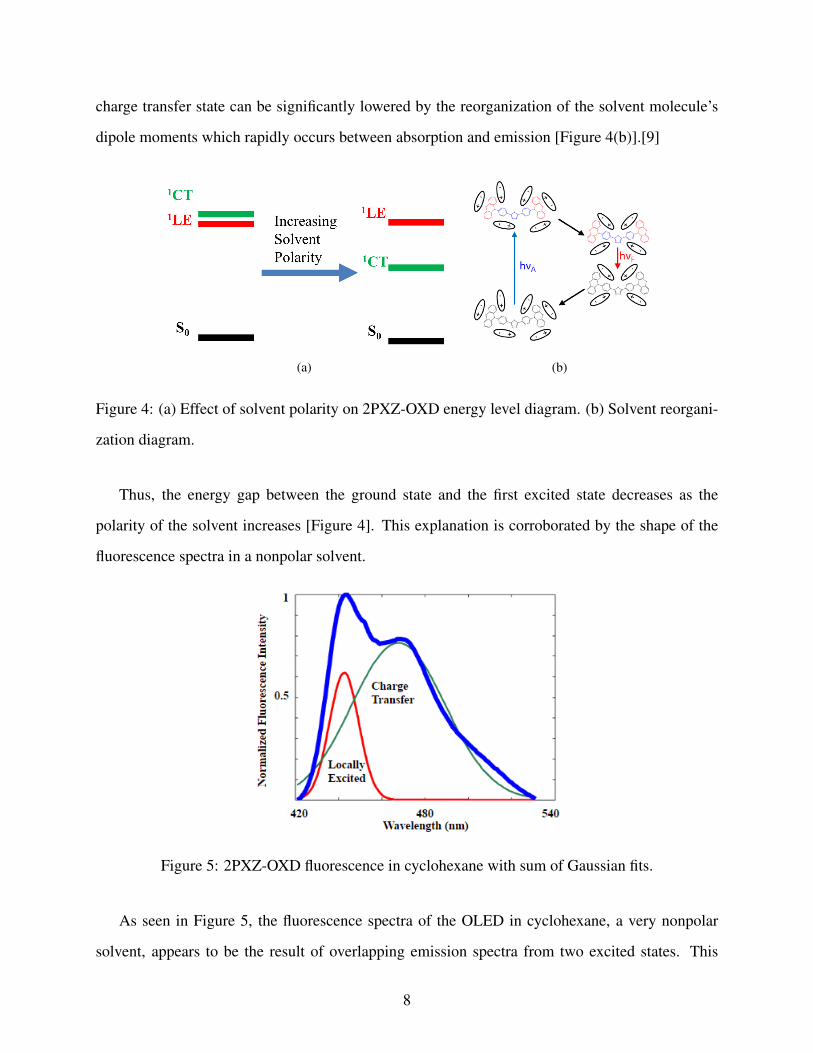
charge transfer state can be significantly lowered by the reorganization of the solvent molecule’s
dipole moments which rapidly occurs between absorption and emission [Figure 4(b)].[9]
(a) (b)
Figure 4: (a) Effect of solvent polarity on 2PXZ-OXD energy level diagram. (b) Solvent reorgani-
zation diagram.
Thus, the energy gap between the ground state and the first excited state decreases as the
polarity of the solvent increases [Figure 4]. This explanation is corroborated by the shape of the
fluorescence spectra in a nonpolar solvent.
Figure 5: 2PXZ-OXD fluorescence in cyclohexane with sum of Gaussian fits.
As seen in Figure 5, the fluorescence spectra of the OLED in cyclohexane, a very nonpolar
solvent, appears to be the result of overlapping emission spectra from two excited states. This
8
observation is in agreement with cyclohexane’s relative inability to change the energy level of the
charge transfer state. As a result of minimal lowering of the charge transfer state energy, emission
can occur from both the charge transfer state, 1CT , and the locally excited state, 1LE, since they
are very close in energy [Figure 4(a)].
2.1.2 Lifetime Measurements
In agreement with the energy level model introduced above, we found that the magnitude of the
prompt lifetime of the liquid samples increased with increasing solvent polarity. The increase in
prompt lifetime results from the increased stability of the emissive charge transfer state as the
polarity of the solvent increases. The OLED prompt lifetime in toluene was 14.09 ± 0.014 ns,
which is an order of magnitude longer than the OLED prompt lifetime in cyclohexane of 2.233 ±
0.004 ns.
2.2 Film Sample Experiments
2.2.1 Absorption and Fluorescence
Our absorbance and fluorescence measurements of solid film samples suggest that the behavior of
the co-dopant molecule may mimic that of solvent molecules in a liquid sample. The films were
made in a polystyrene (PS) host with camphoric anhydride (CA) co-dopant, and the ratio of the CA
to PS was adjusted analogously to changing the polarity of the solvent in the previous study. The
weight percent of 2PXZ-OXD was kept constant at 6 wt%, which is the typical concentration of
OLED emitter molecules in the emitter layer of a real OLED device.[10] The CA wt% was varied
from 0 up to 40 wt%, and PS accounted for the remaining material in the films [Figure 6(a)].
The shape of the absorbance spectra of the films is unaffected by the presence of CA in the films
[Figure 7], and thus, we can conclude that CA does not cause a chemical change, such as a chemical
reaction, with 2PXZ-OXD. By contrast, the fluorescence spectra red shifts and broadens as the CA
wt% is increased [Figure 6(c)]. The red shift can be attributed to the lowering of the charge transfer
state energy caused by the CA molecules spatially rotating to solvate the excited state [Figure 6(b)].
9
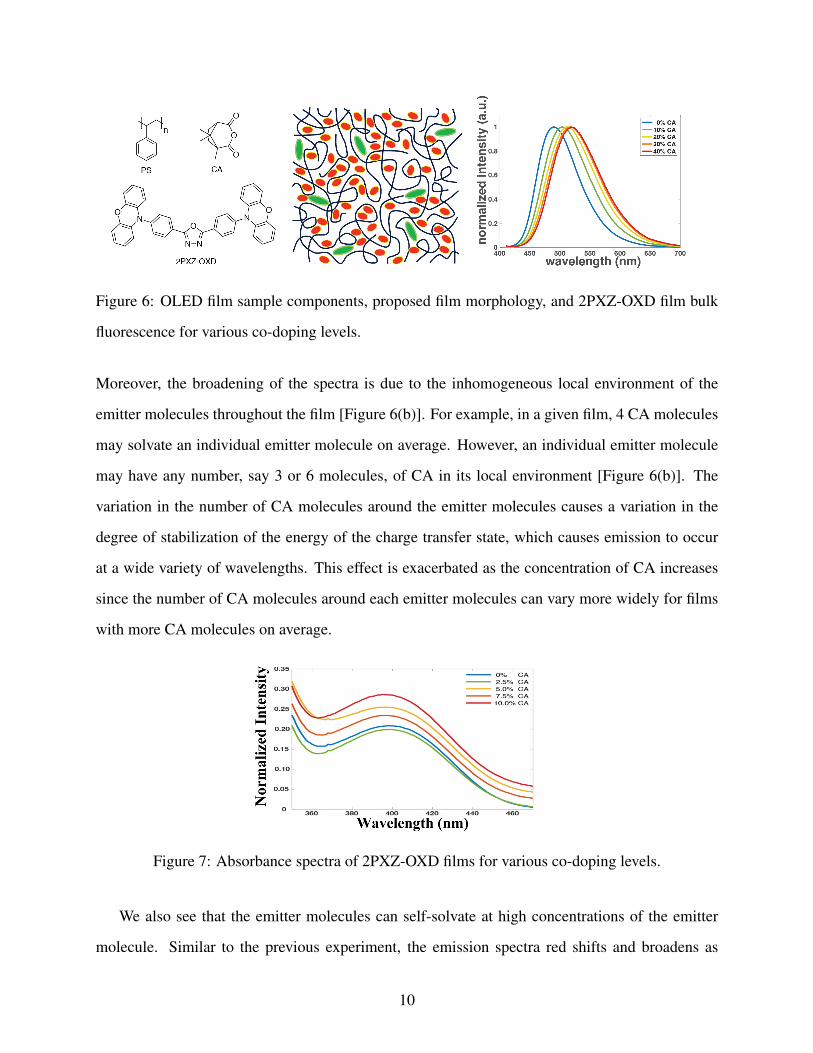
Figure 6: OLED film sample components, proposed film morphology, and 2PXZ-OXD film bulk
fluorescence for various co-doping levels.
Moreover, the broadening of the spectra is due to the inhomogeneous local environment of the
emitter molecules throughout the film [Figure 6(b)]. For example, in a given film, 4 CA molecules
may solvate an individual emitter molecule on average. However, an individual emitter molecule
may have any number, say 3 or 6 molecules, of CA in its local environment [Figure 6(b)]. The
variation in the number of CA molecules around the emitter molecules causes a variation in the
degree of stabilization of the energy of the charge transfer state, which causes emission to occur
at a wide variety of wavelengths. This effect is exacerbated as the concentration of CA increases
since the number of CA molecules around each emitter molecules can vary more widely for films
with more CA molecules on average.
Figure 7: Absorbance spectra of 2PXZ-OXD films for various co-doping levels.
We also see that the emitter molecules can self-solvate at high concentrations of the emitter
molecule. Similar to the previous experiment, the emission spectra red shifts and broadens as
10
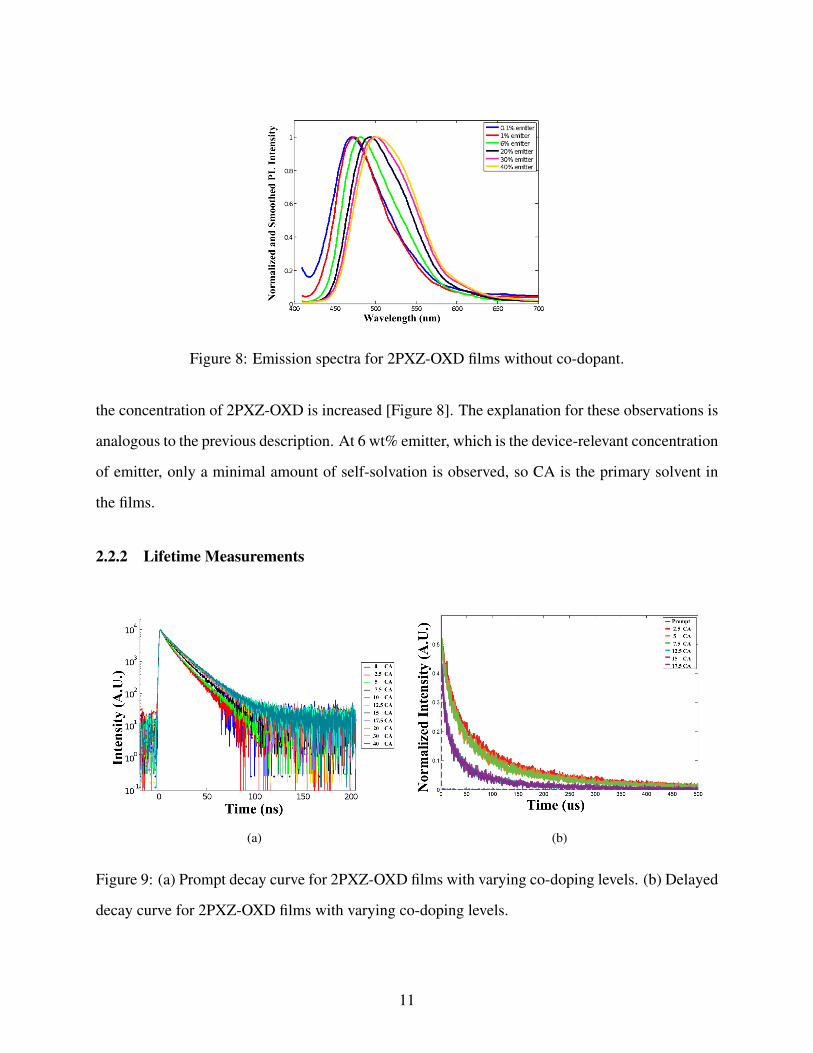
Figure 8: Emission spectra for 2PXZ-OXD films without co-dopant.
the concentration of 2PXZ-OXD is increased [Figure 8]. The explanation for these observations is
analogous to the previous description. At 6 wt% emitter, which is the device-relevant concentration
of emitter, only a minimal amount of self-solvation is observed, so CA is the primary solvent in
the films.
2.2.2 Lifetime Measurements
(a) (b)
Figure 9: (a) Prompt decay curve for 2PXZ-OXD films with varying co-doping levels. (b) Delayed
decay curve for 2PXZ-OXD films with varying co-doping levels.
11
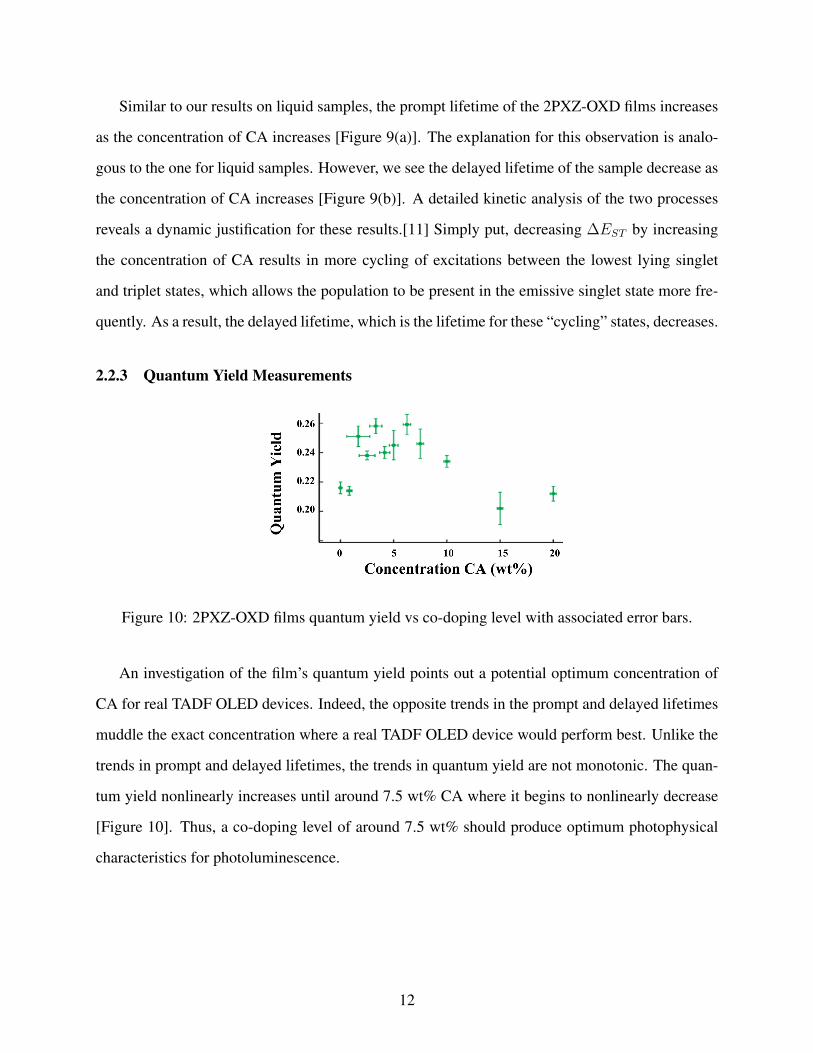
Similar to our results on liquid samples, the prompt lifetime of the 2PXZ-OXD films increases
as the concentration of CA increases [Figure 9(a)]. The explanation for this observation is analo-
gous to the one for liquid samples. However, we see the delayed lifetime of the sample decrease as
the concentration of CA increases [Figure 9(b)]. A detailed kinetic analysis of the two processes
reveals a dynamic justification for these results.[11] Simply put, decreasing ∆EST by increasing
the concentration of CA results in more cycling of excitations between the lowest lying singlet
and triplet states, which allows the population to be present in the emissive singlet state more fre-
quently. As a result, the delayed lifetime, which is the lifetime for these “cycling” states, decreases.
2.2.3 Quantum Yield Measurements
Figure 10: 2PXZ-OXD films quantum yield vs co-doping level with associated error bars.
An investigation of the film’s quantum yield points out a potential optimum concentration of
CA for real TADF OLED devices. Indeed, the opposite trends in the prompt and delayed lifetimes
muddle the exact concentration where a real TADF OLED device would perform best. Unlike the
trends in prompt and delayed lifetimes, the trends in quantum yield are not monotonic. The quan-
tum yield nonlinearly increases until around 7.5 wt% CA where it begins to nonlinearly decrease
[Figure 10]. Thus, a co-doping level of around 7.5 wt% should produce optimum photophysical
characteristics for photoluminescence.
12
2.3 Ultrafast Experiments
2.3.1 OHD-OKE Measurements
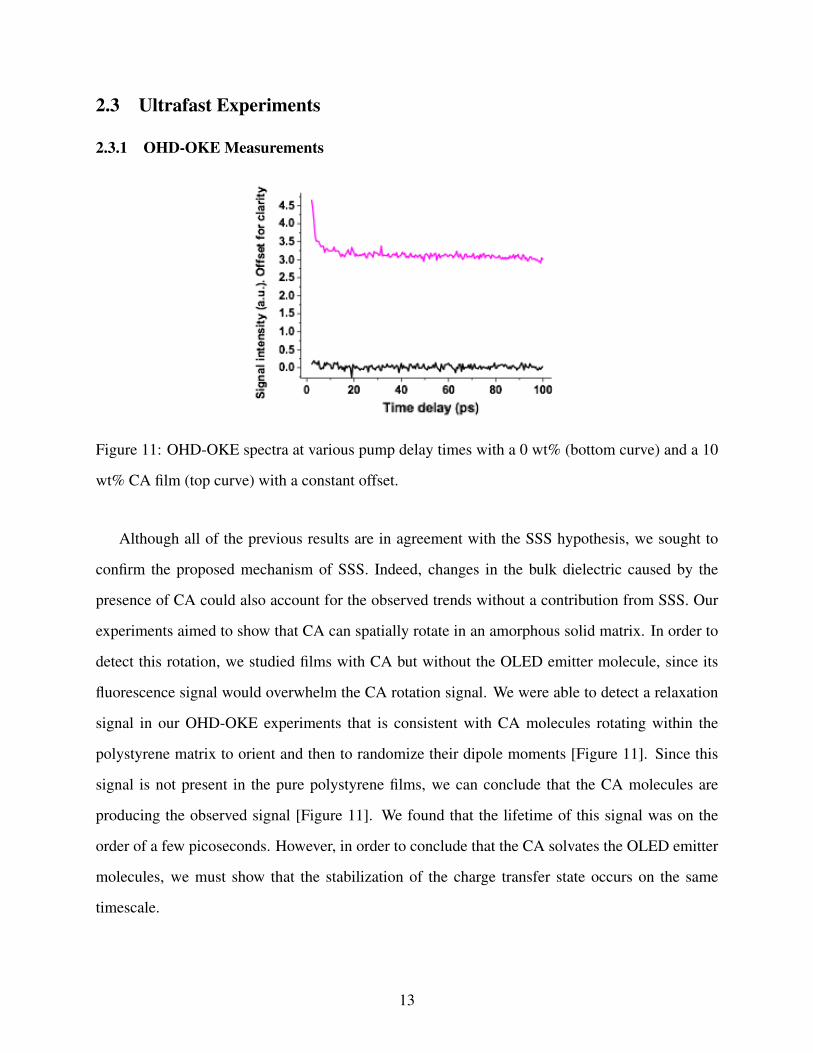
Figure 11: OHD-OKE spectra at various pump delay times with a 0 wt% (bottom curve) and a 10
wt% CA film (top curve) with a constant offset.
Although all of the previous results are in agreement with the SSS hypothesis, we sought to
confirm the proposed mechanism of SSS. Indeed, changes in the bulk dielectric caused by the
presence of CA could also account for the observed trends without a contribution from SSS. Our
experiments aimed to show that CA can spatially rotate in an amorphous solid matrix. In order to
detect this rotation, we studied films with CA but without the OLED emitter molecule, since its
fluorescence signal would overwhelm the CA rotation signal. We were able to detect a relaxation
signal in our OHD-OKE experiments that is consistent with CA molecules rotating within the
polystyrene matrix to orient and then to randomize their dipole moments [Figure 11]. Since this
signal is not present in the pure polystyrene films, we can conclude that the CA molecules are
producing the observed signal [Figure 11]. We found that the lifetime of this signal was on the
order of a few picoseconds. However, in order to conclude that the CA solvates the OLED emitter
molecules, we must show that the stabilization of the charge transfer state occurs on the same
timescale.
13
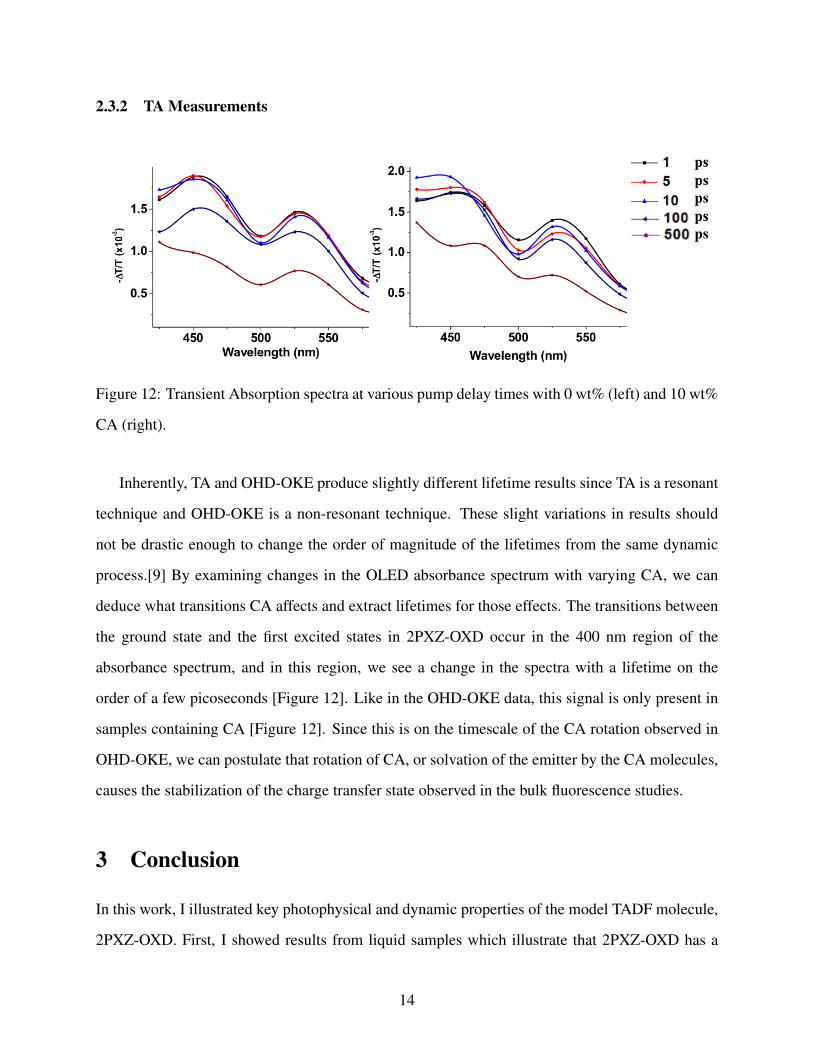
2.3.2 TA Measurements
Figure 12: Transient Absorption spectra at various pump delay times with 0 wt% (left) and 10 wt%
CA (right).
Inherently, TA and OHD-OKE produce slightly different lifetime results since TA is a resonant
technique and OHD-OKE is a non-resonant technique. These slight variations in results should
not be drastic enough to change the order of magnitude of the lifetimes from the same dynamic
process.[9] By examining changes in the OLED absorbance spectrum with varying CA, we can
deduce what transitions CA affects and extract lifetimes for those effects. The transitions between
the ground state and the first excited states in 2PXZ-OXD occur in the 400 nm region of the
absorbance spectrum, and in this region, we see a change in the spectra with a lifetime on the
order of a few picoseconds [Figure 12]. Like in the OHD-OKE data, this signal is only present in
samples containing CA [Figure 12]. Since this is on the timescale of the CA rotation observed in
OHD-OKE, we can postulate that rotation of CA, or solvation of the emitter by the CA molecules,
causes the stabilization of the charge transfer state observed in the bulk fluorescence studies.
3 Conclusion
In this work, I illustrated key photophysical and dynamic properties of the model TADF molecule,
2PXZ-OXD. First, I showed results from liquid samples which illustrate that 2PXZ-OXD has a
14
large red-shift in its spectrum in response to the polarity of the solvent molecules in the solution.
I also pointed out the corresponding changes in lifetime which demonstrate that the stabilization
caused by solvation of the emitter molecules can increase the characteristic lifetime of the initial
singlet population generated by excitation, or the prompt lifetime. These results motivated studies
on solid samples, which more closely resemble a real emitter layer in an OLED device.
The results from the solid samples mirrored those from the liquid samples. With increasing
concentration of polar co-dopant, the emitter spectrum red shifted, and likewise, the prompt life-
time of the emitter was increased. Unlike the prompt lifetime, I found that the delayed lifetime of
the emitter decreased with increasing concentration of polar co-dopant. This opposite behavior ne-
cessitated an exploration of the quantum yield in order to elucidate the ideal co-doping level. The
quantum yield had an absolute maximum over the co-doping levels explored at approximately 7.5
wt% polar co-dopant, which suggests that 7.5 wt% co-doping level would produce the best results
in a real device. Although these results were exciting, without evidence that confirms the hypoth-
esized SSS, it was unclear if these results were anomalous or if they would also appear in other
more device-relevant TADF systems. The OHD-OKE data suggested that the polar co-dopant had
enough mobility in the amorphous host to spatially rotate, which confirms the hypothesis that sig-
nificant rotation can occur in an amorphous solid. The similarity in lifetime of this rotation with the
spectral transformations that were observed in the TA experiments around the key 400 nm region
provide evidence that rotation of the polar co-dopant molecules is what causes the photophysical
and dynamical trends detected in the previous experiments.
While this work details significant progress towards the goal of making a real TADF OLED
device, additional research will be required to overcome the unique challenges associated with
device engineering. Most prominently, similar studies should be performed using commercially
available OLED hosts since the solid state structure of these hosts is likely to differ from the
structure of the polystyrene host explored in this study. Along the same vein, CA should be tested
for compatibility with the other components of a real device, and if it is found to be incompatible,
other device-compatible, small, polar molecules should be studied. The existing system could be
utilized to elucidate the threshold parameters for properties such as co-dopant molecule size or
15
dipole strength for observing SSS. These studies would accelerate the search for other feasible
co-dopant molecules by narrowing down the list of possible molecules.
Working towards more efficient and easily manufactured lighting and displays is an excellent
way to help tackle the climate issues resulting from energy usage. TADF has proven to be a
promising phenomenon for improving OLED function. The processes probed in an attempt to
understand better the mechanism and properties of TADF systems has revealed attributes of solid
state dynamics that could inform work on many general charge transfer systems. The auspicious
findings of this work offer evidence for the possibility of more efficient electronic devices in the
near future.
4 Methods
4.1 Spin-coated Films Sample Prep [11]
PS was purchased from Sigma-Aldrich, CA was purchased from VWR, and 2PXZ-OXD was pur-
chased from Luminescence Technology Corp. All chemicals were used without further purifica-
tion. Within a nitrogen glovebox, separate solutions of 2PXZ-OXD, CA, and PS were created at
a concentration of 50 mg/mL in chloroform and were stirred at 35◦C for at least an hour and then
allowed to return to room temperature while stirring. Quartz substrates were sonicated for 15 min
in isopropanol before being rinsed and dried with N2. The proper ratio of each solution was then
pipetted into another vial and stirred together before spin coating at 2000 rpm for 1 min (1500
rpm/s acceleration). Films for PL experiments contained 6 wt% 2PXZ-OXD, and films for TA
experiments contained 20 wt% 2PXZ-OXD. Films were either encapsulated within the glovebox
or remained under nitrogen purge for all measurements.
4.2 Time-resolved fluorescence [11]
Time-resolved and steady state fluorescence measurements were conducted with a Horiba NanoLog
Spectrofluorometer. Excitation for fluorescence spectra was centered at 390 nm using a Xenon
16
lamp. Prompt lifetimes were measured in TCSPC mode using a 310 nm NanoLED pulsed exci-
tation source (1.2 ns pulsewidth). Delayed Lifetimes were measured using Multi-channel Scaling
mode and were excited with a 310 nm SpectralLED pulsed excitation source (controllable pulse
width >0.1 ms).
4.3 Quantum Yield measurement [11]
Quantum Yield measurements were conducted at Stanford University in the McGehee lab. Photo-
luminescence QY was measured on a homebuilt setup. Samples were placed inside an integrating
sphere (LabSphere RTC-060) and the sphere was flushed with constant nitrogen flow. Samples
were excited with a Coherent Obis 375 nm laser and spectra were recorded through a SpectraPro
500i Acton research monochromator/Spectrum CCD. A calibration for the spectral throughput of
the system was performed and applied to each spectrum. Measurement procedure followed the
method of de Mello et. al.[7]
4.4 Dropcast Films Sample Prep
The same PS and CA used to make spin-coated samples were used without additional purification.
Within a nitrogen glovebox, separate solutions of CA and PS were created at a concentration of 50
mg/mL in chloroform and were stirred at 35◦C for at least an hour and then allowed to return to
room temperature while stirring. These solutions were then filtered with a 0.45 µm pipette filter to
remove any remaining aggregates. Glass substrates were sonicated for 15 min each in isopropanol,
acetone, and ultraclean water before being rinsed and dried with N2. The proper ratio of each
solution was then pipetted into another vial and stirred together initially for 5 minutes and then
for the duration of the drop-cast procedure. 400 µL of the prepared solution was dropped onto
the cleaned and dried substrates, and this layer was dried for 1 to 2 hours. Another 2 layers were
applied following the same method. The dried samples were then annealed under vacuum for 12
hours at 120◦C, for 12 hours at 60◦C, and for 1 hour at room temperature. The annealed samples
were removed from the substrate with tweezers, and the resulting free-standing films were used for
17
measurement.
4.5 OHD-OKE Spectroscopy1
A Ti:Sapphire Coherent Vitara (80 MHz rep rate) oscillator seeds a Ti:Sapphire Coherent Legend
Elite regenerative amplifier (5W, 5 kHz, 40 fs). The fundamental (800 nm) is split in a 90:10
ratio for the pump and probe beams. The pump is chopped at 2.5 kHz. The pump and probe are
sent through half waveplates and glan-laser polarizers before being focused in the sample. The
pump and probe are set to 45 degrees polarization with respect to each other. The probe is then re-
collimated, sent through an achromatic quarter waveplate and a Wollaston prism, thus splitting the
probe beam into parallel and perpendicular components, which are simultaneously sent to a large-
area Si balanced photodetector (Thorlabs PDB210A). The difference output from the detector is
sent to a lock-in amplifier referenced to the pump chopping frequency (2.5 kHz). The quarter
waveplate is finely tuned to balance the two photodetectors in the absence of the pump beam prior
to each measurement to zero the difference between the two photodetectors. In order to obtain
a high signal to noise ratio for anisotropies that persist on a >2 ps timescale, the output of the
regenerative amplifier is stretched to approximately 1 ps by tuning the angle of the compressor
grating. This stretching allows for higher pump powers to be used in the experiment.
4.6 Transient Absorption1
The same lasing setup and 90:10 ratio for the pump and probe beams as in the OHD-OKE setup is
used for the TA experiments. The 90% arm is sent into a delay line and then into a second-harmonic
BBO crystal to generate 400 nm light. The 10% portion is focused into a continuously-translated
calcium fluoride crystal to generate a single-filament white light down to approximately 350 nm.
The pump and probe pulses are overlapped in the sample, and the probe is re-collimated and
then focused into a fiber-optic coupled spectrometer/CCD (Ocean Optics USB-4000). The pump
is chopped at the 80th subharmonic of the laser rep rate (62.5 Hz), which lets 40 shots through
1Adapted from a description written by Milan Delor.
18
and blocks the next 40 shots. The CCD is triggered by the pump chopper signal and acquires
(pump ON) data for 20 shots (4 ms), then reads out for 8 ms with an electronic shutter that blocks
incoming light, and acquires (pump OFF) data for 20 shots. Averaging loops are software-timed
to allow continuous cycles of data integration and readout.
5 Acknowledgements
This work has been supported by The Dow Chemical Company under contract #244699. Time-
resolved fluorescence was performed at the Molecular Foundry as part of the Molecular Foundry
user program, supported by the Office of Science, Office of Basic Energy Sciences, of the U.S.
Department of Energy under Contract No. DE-AC02-05CH11231. Special thanks to Teresa Chen
at the Molecular Foundry and the Michael D. McGehee group at Stanford University for their
assistance and expertise.
I would like to thank my fantastic research mentors Benjamin Cotts and Milan Delor for their
excellent mentorship and support throughout my college career. I would also like to thank Pro-
fessor Naomi Ginsberg for giving me the opportunity to do the research for this thesis in her lab
and for inspiring me to continue to pursue physical chemistry in graduate school. I am grateful for
Rodrigo Noriega’s assistance with mastering sample preparation techniques and with practicing
good glovebox work habits. I also acknowledge all of the camaraderie and helpful conversations
I have had with every member of the Ginsberg group. Finally, I would like to dedicate this thesis
to my dear sister Elizabeth McCarthy who encouraged me to seek out an undergraduate research
position and reassured me of my ability to do undergraduate research throughout the many ups and
downs I encountered while working on this project.
19
References
[1] US Department of Energy Monthly Energy Review. November 2015. 2015.
[2] US Department of Energy 2010 U.S. Lighting Market Characterization.. 2010.
[3] Hirata, S., Sakai, Y., Masui, K., Tanaka, H., Lee, S. Y., Nomura, H., Nakamura, N., Ya-
sumatsu, M., Nakanotani, H., Zhang, Q., Shizu, K., Miyazaki, H., Adachi, C. Highly efficient
blue electroluminescence based on thermally activated delayed fluorescence. 2015. Nature
Materials, 14(3), 330–6.
[4] Dias, F., Bourdakos, K., Jankus, V., Moss, K., Kamtekar, K., Bhalla, V., Santos, J., Bryce, M.,
Monkman, A. Triplet harvesting with 100% efficiency by way of thermally activated delayed
fluorescence in charge transfer OLED emitters.. 2013. Advanced Materials: Deerfield Beach,
Fla., 25(27), 3707–14.
[5] Bulovic, V., Deshpande, R., Thompson, M., Forrest, S. Tuning the color emission of thin film
molecular organic light emitting devices by the solid state solvation effect. 1999. Chemical
Physics Letters, 308(3-4), 317–322.
[6] Serevicius, T., Nakagawa, T., Kuo, M.-C., Cheng, S.-H., Wong, K.-T., Chang, C.-H., Kwong,
R. C., Xia, S., Adachi, C. Enhanced electroluminescence based on thermally activated de-
layed fluorescence from a carbazole–triazine derivative. 2015. Physical Chemistry Chemical
Physics: PCCP, 15(38), 15850–5.
[7] de Mello, J. C.; Wittmann, H. F.; Friend, R. H. An improved experimental determination of
external photoluminescence quantum efficiency. 1997. Advanced Materials, 9 (3), 230–232.
[8] Smith, N., Meech, S. Optically-heterodyne-detected optical Kerr effect (OHD-OKE): appli-
cations in condensed phase dynamics. 2002. International Reviews in Physical Chemistry
75-100.
[9] Lakowicz, J. Principles of Fluorescence Spectroscopy. Third Edition: Springer Science and
Business Media, 2006.
20
[10] Uoyama, H., Goushi, K., Shizu, K., Nomura, H., Adachi , C. Highly efficient organic light-
emitting diodes from delayed fluorescence. 2012. Nature, 492, 234–238
[11] Cotts, B.L., McCarthy, D.G., Noriega, R., Penwell, S.B., Delor, M., Devore, D.D. De Vries,
T.S., Mukhopadhyay, S., Ginsberg, N.S. Tuning thermally activated delayed fluorescence
emitter photophysics through solvation in the solid state. Manuscript in Preparation
21