characteristics of fines in corn: review and analysis
TRANSCRIPT

Agricultural and Biosystems EngineeringPublications Agricultural and Biosystems Engineering
1992
Characteristics of Fines in Corn: Review andAnalysisCarl J. BernIowa State University, [email protected]
Charles R. Hurburgh Jr.Iowa State University, [email protected]
Follow this and additional works at: http://lib.dr.iastate.edu/abe_eng_pubs
Part of the Agriculture Commons, and the Bioresource and Agricultural Engineering Commons
The complete bibliographic information for this item can be found at http://lib.dr.iastate.edu/abe_eng_pubs/404. For information on how to cite this item, please visit http://lib.dr.iastate.edu/howtocite.html.
This Article is brought to you for free and open access by the Agricultural and Biosystems Engineering at Iowa State University Digital Repository. Ithas been accepted for inclusion in Agricultural and Biosystems Engineering Publications by an authorized administrator of Iowa State UniversityDigital Repository. For more information, please contact [email protected].

Characteristics of Fines in Corn: Review and Analysis
AbstractFines (material smaller than whole corn kernels) are troublesome and continually increase as corn lots movefrom harvest to utilization. This article reviews characteristics of fines in corn, including constituents, sizedistribution, nutritive and economic values, density, and airflow resistance, and presents analysis of them.These characteristics are related to corn grading, handling, and processing issues.
KeywordsCorn, Fines
DisciplinesAgriculture | Bioresource and Agricultural Engineering
CommentsThis article is from Transactions of the ASAE 35 (1992): 1859–1867. Posted with permission.
This article is available at Iowa State University Digital Repository: http://lib.dr.iastate.edu/abe_eng_pubs/404

CHARACTERISTICS OF FINES IN CORN: REVIEW AND ANALYSIS
C. J. Bern, C. R. Hurburgh, Jr. MEMBER MEMBER
ASAE ASAE
ABSTRACT Fines (material smaller than whole corn kernels) are
troublesome and continually increase as com lots move from harvest to utilization. This article reviews characteristics of fines in com, including constituents, size distribution, nutritive and economic values, density, and airflow resistance, and presents analysis of them. These characteristics are related to com grading, handling, and processing issues. KEYWORDS. Com, Fines.
INTRODUCTION
Fines (material smaller than whole kernels) are produced in corn as it moves from harvest to utilization. Increases in fines can be dramatic. Hill
et al. (1979) followed a 9 550-t (10,510 t) lot of midwest corn as it was shipped to Rotterdam. The lot contained 3.6% broken com-foreign material [BCFM-material that can pass through a 4.8-mm (12/64-in.) round-hole sieve, plus all matter other than com that remains in the sieved sample] at loading on Lake Erie and 15% BCFM as delivered in Rotterdam. At this point, 1089 t (1,198 ton) of BCFM had been generated in the lot during shipment!
Size of fines in this article, except for dust, is defined in terms of sieve openings which will and will not allow the material to pass. Grain dust particle size was determined by the forward light scatter method.
Fines cause many problems. They make the com more difficult to aerate (Grama et al., 1984), they increase the rate of spoilage (Kalbasi-Ashtari et al., 1979), they segregate from whole kernels under a filling spout (Stephens and Foster, 1976), and they are a favored location for production of aflatoxin (Shotwell et al., 1972). Presence of fines is the grain-quality problem most commonly mentioned by grain elevator/storage facility managers (Stroshine, 1989). Fines are the most likely cause of a drop in grade during shipment (Hill et al., 1979). They must be removed before wet milling (May, 1987) and dry milling (Alexander, 1987). Fines existing as dust (solid particles that become airborne) can, under certain
Article was submitted in January 1992; reviewed and approved for publication in October 1992.
Journal Paper J-14760 of the Iowa Agriculture and Home Economics Experiment Station, Ames, lA. Project No. 2790. Research supported by the Anderson's Research Foundation and the Iowa Agriculture and Home Economics Experiment Station.
The authors are Carl J. Bern, Professor, and Charles R. Hurburgh, Jr., Professor, Dept. of Agricultural and Biosystems Engineering, Iowa State University, Ames.
conditions, constitute fire, explosion, and health hazards (Martin, 1981; McLean, 1992).
The U.S. Grades and Standards define the com quality factors that relate to particle size. As noted earlier, anything that passes through the 4.8-mm round-hole sieve is "fines" by this measure. Nearly all previously cited authors recognized, however, that there were broken pieces larger than 4.8 mm (12/64 in.) diameter. The BCFM sieve was originally 5.6 mm (14/64 in.) and the material through it was called cracked corn and foreign material. It was changed to the present 4.8-mm size in 1921 (Hill, 1990). An additional definition was created in 1987. Broken com (BC) passes through the 4.8-mm sieve but not a 2.4-mm (6/64-in.) sieve. Foreign material (FM) is material which passes through the 2.4-mm sieve, plus all matter other than corn that remains on top of the 4.8-mm sieve (Miller, 1987). Presendy, BC and FM are listed as information but do not establish numeric grade. Their summation, BCFM, is still the grade-determining particle-size factor for com. There has been call recently to change the grades (NAEGA, 1986). A summary of corn fines and their properties is needed to evaluate potential actions.
This article is a review and analysis of reported characteristics of fine material (material smaller than whole kemels) in com, with application to com handling and com grading.
CONSTITUENTS AND SIZE DISTRIBUTION OF FINES IN CORN
Hill et al., (1982) analyzed 1,080 samples of com from Illinois country elevators and subterminals in 1976 and 1977. Table 1 lists constituents found in these samples, along with their size distribution. Constituent category was determined by microscopic examination. Note that even the smallest material was predominantly corn broken into small pieces. The noncom particles were most concentrated in sizes 4.0 mm (10/64 in.) and smaller. This material contained 58% of the total noncom weight in the sample. The BCFM contained 69% of the noncom weight.
Several studies have reported concentrations of fines sizes in market corn. These data are summarized and averaged in Table 2. The percentage passing through a 4.8-mm round-hole sieve, the current BCFM sieve, is the reference base. Amounts passing through other sieve sizes are expressed as percentages of the weight passing through the 4.8-mm sieve. As an example, in the bottom (averages) line, 19.2% of what is now BCFM would pass through a 2.4-mm sieve. This is the sieve that was tentatively chosen to define corn FM. The remaining 80.8% of BCFM is
VOL. 35(6): NOVEMBER-DECEMBER 1992 ' 1992 American Society of Agricultural Engineers 0001 -2351 / 92 / 3506-1859 1859

TABLE 1. Constituents and size distribution of 1976 and 1977 corn samples delivered to Illinois country elevators and subterminals (after Hill et al., 1982)
Size Ranges*
In conventional units.
Com BC FM
(mm) >6.0 6.0 4.8 4.0 3.2 2.4 1.8
(in.) > 15/64 15/64 12/64 10/64 8/64 6/64 4.5/64
Size Distribution of Com Samples (% by Weight)
%.17 1.94 0.73 0.51 0.29 0.13 0.23 (2.27) (0.76) (0.46) (0.44) (0.29) (0.16) (0.37)
Percentage in Material That
Passed Through Constituent 4.8-mm Sieve Distribution of Constituents in Each Size Range (%)
Comt 87.4 99.95 98.31 96.50 91.98 89.1 85.24 77.61 (I1.2)t
Com 10.6 0.03 1.02 2.60 5.06 8.09 12.99 20.47 by-products § (9.8)
Weed seeds 1.7 0.02 0.66 0.88 2.96 2.42 0.90 1.73 (5.0)
Dust and inert 0.3 0.00 0.02 0.03 0.03 0.38 0.87 0.29 material II (1.5)
100.0 100.00 100.00 100.00 100.00 100.00 100.00 100.00
Percentage of total noncom kemal material 69 17 13 11 16 13 8 21
• Size of particles in each category lies between that round-hole sieve size and the next smaller one.
t Material originating on com kernel. t Values in parentheses are standard deviations. § Non-kernel material originating on com plant. V Material not in other categories.
p . « e0.2625Sj+ 1.455 (lb)
where Sj represents the round-hole sieve size (64th in.) ,
(3<Si<16)
Figure 1 shows the Table 1 averages, along with the fitted function line.
The percentage of the lot weight that would pass through any round-hole sieve is then:
PjB (2)
where B is the percentage BCFM, and Pj is the percentage of total weight passing through a given round-hole sieve size. The percentage between any two screen sizes, Sj and S i _ i , i s :
P i - Pi-i • ( P i - P i - i ) B
100 (3)
where Pj and Pj_i are calculated from equation la or lb. Assuming 100% cleaning efficiency (total cleanout) and
that any material smaller than 6.4 mm is fines, the relative concentration of any two size ranges, Sj to Sj.i and Sj_i to Si_2, will be (in the cleanings):
between 4.8 mm and 2.4 mm and would be broken com. An important point shown by Table 2 is that the relative concentration of various particle sizes remains constant even though the actual amount of fines increased steadily with repeated handling. For example, export lots consistently had more BCFM than country elevator lots, but their relative concentrations of the sizes were not different.
The amount of BCFM in corn delivered to country elevators was less than 2% in all reports. Other studies have found the same low concentrations of BCFM at country elevators (Hurburgh and Moechnig, 1984; Hurburgh et al., 1983; Hurburgh, 1984). Increased discount for BCFM (or for any particle size designation) will be of limited effectiveness in mitigating handling breakage because farm-delivered grain has such small amounts, regardless of future breakage potential.
The following equation represents the averages from Table 2:
C r -i-1 P i - P i - 1
Pi_l - Pi_2 Pi_i - Pi_2 (4)
with the appropriate substitution of equation la or lb or actual size data. Table 3 lists the predicted size distribution of com fines (fines defined as less than 6.4 mm).
If cleanout is not complete, then an efficiency factor is introduced, for example Ej j . j , Ei_i i_2 (as decimals), and:
^ _ E,,_,(P,-P,_.) (5)
p . ^ g0.6616Sj+1.455 (la)
For example, suppose the uncleaned com contains 1.0% FM (Pi_i - Pi_2) and 3.0% BC (Pj - Pj.i) and the cleaner is operating at 90% and 60% efficiency, respectively. The relative concentration of BC to FM in the cleanings will be:
C «2:6001^2.0 ' 0.9(1.0)
where Pj is the percentage of the weight classified as BCFM passing through sieve size, and Sj' is the round-hole sieve size (mm).
(1.2<Si'<6.4)
This is more concentrated in small particles than was the uncleaned com.
The efficiency of a cleaner is related to screen size, in that near-fits are removed less efficiently than smaller particles (Quinn, 1987; Hurburgh et al., 1989). Equations la or lb and 5 allow prediction of the relative
I860 TRANSACTIONS OF THE ASAE

TABLE 2. Summary of data on corn fines size distribution
Ref.
7
18
18
18
18
18
18
18
18
18
18
18
18
18
9
9
9
9
8
6
10
15
15
(mm) Data Source (in.)
Export shipments 1974-75
Country elevator receipts, 1975 lA
Country elevator receipts, 1976 IA
Country elevator shipments, 1975 lA
Country elevators shipments, 1976 lA
River terminal receipts, 1975 IA
River terminal receipts, 19761A
River terminal shipments, 1975 IA
River terminal shipments, 19761A
Export receipts by barge, 1976
Export receipts by unit train, 1976
Export shipments 1975
Export shipments 1976
Country elevator receipts, 76-77 IL
Country elevator shipments, 76-77 IL
Terminal receipts 76-77 IL
Terminal shipments 76-77 IL
Export shipments 78-79 IL
Country elevator shipments, 1981 US
Export shipment sublots, 1985
Hopper cars at origin, 19861A
River terminal shipments, 19861A
Averages
Percentage through
4.8 12/64
3.28
1.24
1.64
1.89
2.05
1.32
1.54
1.75
2.40
2.71
3.08
2.74
3.12
3.33
1.14
1.85
2.00
2.60
3.30
2.25
5.32
2.11
2.39
Material Through Sieves*, as i
6.4 16/64
246.5
243.9
266.9
273.5
213.6
248.9
6.0 15/64
301.6
259.8
267.2
256.1
285.5
278.6
282.9
265.4
237.6
229.2
255.1
240.7
230.0
247.4
211.9
1%.5
181.5
248.6
5.6 14/64
100.0
163.4
152.1
139.9
151.8
4.8 12/64
100.0
100.0
100.0
100.0
100.0
100.0
100.0
100.0
100.0
100.0
100.0
100.0
100.0
100.0
100.0
100.0
100.0
100.0
100.0
100.0
100.0
100.0
100.0
I % of that Through 4.8-mm (12/64-in.) Sieve
4.0 10/64
54.3
50.3
63.1
64.6
56.1
44.1
62.1
60.7
61.6
3.4 8.5/64
44.4
44.2
3.2 8/64
41.9
39.0
31.2
37.1
34.8
35.7
39.4
52.9
41.7
40.9
31.4
36.2
39.9
34.2
31.9
36.0
36.9
33.3
31.7
39.3
29.8
33.4
36.8
2.4 6/64
21.5
19.2
17.8
20.5
19.6
19.5
19.9
16.1
18.5
19.2
1.8 4.5/64
12.3
11.4
13.1
12.3
12.1
12.2
12.2
1.2 3/64
6.4
5.3
5.8
* Assumed to be round-hole, except Reference 7 which was square mesh.
size distribution of cleanings, an important property in or, in conventional units determining the value of cleanings as feed.
The concentration of fines in com after cleaning also is important to the evaluation of cleaning and grade standards. Assuming that the grade standard is defined by
e0.2625sg+1.455 B ( l . O - E g )
^gf- 100 some screen size Sg, which is removed at efficiency Eg, as a decimal:
(6b)
e0.6616Sg+1.455 B ( l . O - E )
^gf- 100 (6a)
An example application of this formula can be derived from the data on rotary cleaners presented by Hurburgh et al. (1989). For rotary cleaners operating at a flow density (ratio of grain mass flow rate to rate of cleaning area exposure) of 6 kg/m^, cleaning efficiency was 55% for BCFM and 75% for FM alone. Table 4 shows
VOL. 35(6): NOVEMBER-DECEMBER 1992 1861

O 00
y o>
For mm; P = e0 66i6s+ 1.455 For 64th in.: P = e0.2625s + i
Sieve Size, s, m m
Sieve Size, s, 64th in.
Figure 1-Weight of corn fines passing through round-hole sieves as a percent of weight passing through 4.8-mm (12/64-in.) round hole sieve.
the concentration of BCFM and FM before and after cleaning, and the relative concentration of FM to BCFM in these cleanings. The cleanings were more concentrated in the smaller particles because cleaner efficiency was better for smaller sizes.
Equations 1-3 also can be used to predict particle size concentrations after future handlings, with the only independent variable being the percentage points of increase in the BCFM grade factor.
Aspiration can be used to clean grain. It separates by drag force of air and not necessarily by size. Therefore, some of the material removed in aspiration may not be classed as objectionable against a size-defined grade standard. Al-Yahya et al. (1991) determined the size distribution of liftings removed by a Kice 6DT4 mini-aspirator from a stock of corn containing 4.0% BCFM distributed in the size fractions defined by Table 3. Results are shown in figure 2.
Air velocities were calculated for the 10-mm by 102-mm air intake slots. The greatest velocity (22 m/s) was selected to remove 1(X)% of BCFM. It also took out nearly 35% of the whole corn (material over 6.4-mm sieve). The least velocity (8 m/s) was selected to take out
TABLE 3. Estimated particle size distribution in corn cleanings'"
Definition
Through Size No. (mm) (in.)
Over
(mm) (in.)
%of Fines by Weight
1 6.4 16/64 5.6 14/64 39.0 2 5.6 14/64 4.8 12/64 20.8
BCFM - 40.2% BC - 32.5% 3 4.8 12/64 4.0 10/64 15.4 4 4.0 10/64 3.2 8/64 10.0 5 3.2 8/64 2.4 6/64 7.1
- BCFM = 40.2% BC - 32.5% 6 2.4 6/64 1.8 4.5/64 2.8 7 1.8 4.5/64 4.9
BCFM -= 40.2% - -FM « 7.7% 100.0
TABLE 4. Size distribution of cleaned corn and cleanings from rotary grain cleaners (after Hurburgh et al., 1989)
Percentage FM in Cleanings Uncleaned Com Cleaned Com
%BCFM
2 4 6
%FMt
0.42 0.84 1.26
%BCFM* (E-0.55)
1.10 2.20 3.30
%FM* (E-0.75)
0.32 0.63 0.95
IfE-l.OOt
21 21 21
Actual^
29 29 29
* From equation 6b, FM defined as material passing through a 2.4-mm screen.
t From equation lb. t From equation 4.
almost no (<1%) whole corn. At 13 m/s, the slowest velocity that would remove nearly all FM, the aspirator removed about 65% of the BCFM. This was comparable to the rotary-screen cleaners. Combination of equation la or lb and the aspirator efficiency data, with B=4.0%, predicts that, at this airflow, the aspirator will remove about 5% of the material larger than BCFM.
That would be an economically objectionable loss. The rotary-screen cleaners removed about 1% of material larger than BCFM. We found no published data on the relative cleaning efficiencies of commercial cleaners in operation at grain elevators.
NUTRITIVE VALUE OF FINES Hill et al. (1982) measured nutritive value of various
particle sizes of com fines and whole com screened from the 1976 and 1977 crops. Martin (1981) studied grain dust from four Kansas elevators. Their results are shown in Table 5. Values for dust will be discussed in a later section.
Protein content increased with decreasing particle size. For fines passing through the 1.8-mm (4.5/64-in.) sieve, protein was more than two percentage points (20%) greater than for whole com. This suggests that this smallest size fraction contains a large portion of high-protein germ.
The smallest fraction (through 1.8 mm) has by far the greatest ash content (4.59%). This again suggests a large
12 14 16
AIR VELOCITY (V), m/s
Cleaning at 100% efficiency over a 6.4-mm round-hole sieve.
Figure 2-Cumulatiye size-removal efficiency (%) and air velocity (m/s) for eight sieve sizes when aspirating corn with 4.0% BCFM (after Al Yahya et al., 1991).
1862 TRANSACTIONS OF THE A S A E

portion of germ material in this fraction, since germ material is about 10% ash and has ten times the ash content of any other kernel part (Ockerman, 1978). Table 1 values for constituents of the smallest fraction bear this out by showing that over 77% of this fraction originates on the com kernel.
Al-Yahya et al. (1991) determined nutrient value of com liftings removed by a Kice 6DT4 mini-aspirator from a stock of com containing 4.0% BCFM with particle sizes distributed as given in Table 3. Figure 3 shows protein, oil, and starch of the liftings. Starch content of liftings was maximized at a low velocity; oil content was maximized at the greatest velocity. The protein content was the least defined, with no evident trend of variation with air velocity. Evidently high-starch particles have lesser terminal velocities and high-oil particles have greater terminal velocities.
AIRFLOW RESISTANCE AND DENSITY Stored fines have considerable airflow resistance. When
intermixed with grain, they also increase the airflow resistance of grain. Yang et al. (1990) measured airflow resistance and density of fines removed from corn by sieving. Experimental airflow-resistance data were fitted to this modified Ergun equation:
P = A VPD/
BDl' PDJ
V + B
BD PD
I BD PD
(7)
where P V A,B PD BD
pressure drop per unit bed depth (Pa/m) superficial fluid velocity m^/m^ min regression coefficients particle density (kg/m^) bulk density (kg/m^)
Figure 4 shows equation 7 plotted for each of the seven sizes, along with the shelled com line from Shedd (1953). Sizes correspond to size numbers defined in Table 3. Equation coefficients are presented in Yang et al. (1990). Airflow resistance of each successively smaller fines size is
75
74
73
72
71
70
J3
Q.
C
'5 o 0.
—r o
o
69 12.0
9.0k
8 .5^
8.01 3.81
3-6tr M—
3.4p 3.2p 3.oP 2.8p 2.6P 2.4b
a.
•Stock: 70.55 ST = 79.92-0.907 V + 0.0226 V2 R2 = 0.98
— \ I \ \ \ \ I I I
l l .Sh
11.op lo.sp lo.oU
pStock:9.79^ 9.5k
b.
PR = 14.097-0.571 V + 0.017 V2 R2 = 0.93
J I I I I I I I
c. -Stock:3.53
"OL = 2.32 + 0.0221 V + 0.0018 V2 R2 = 0.94
J I I I I I I I L 8 10 12 14 16 18 20 22 24
Air Velocity, V, m/s Figure 3-Starch, protein, and oil of liftings as a function of air velocity (Al Yahya et al., 1991).
TABLE 5. Nutritive properties of com fines (adapted from Hill et al., 1982; Martin, 1981)
Property
Crude protein (%)* Ash(%)* Oil(%)* Crude fiber (%)*
NFEt, t (%)
Whole Com (>15/64-in.)
10.2 1.4 4.5 2.2
81.8
Digestible energy§ (DE) MJ/kg 16.45 kcal/lb 1786
6.0 mm* (15/64-in.)
10.1 1.4 3.9 2.3
82.3
-
4.8 mm (12/64-in.)
10.4 1.6 4.3 2.6
81.1
15.81 1717
4.0 mm (10/64-in.)
10.4 1.6 3.4 2.9
81.7
15.57 1691
3.2 mm (8/64-in.)
10.4 1.7 2.5 3.5
81.9
15.30 1661
2.4 mm (6/64-in.)
11.0 2.4 2.4 4.2
80.1
15.03 1632
1.8 nmi (4/64-in.)
12.3 4.6 2.4 5.9
74.7
14.84 1611
Dust
9.0 6.6 2.7 8.1
73.6
-
* Size of particles in each category lies between that screen size and the next smaller one. t All percentages are on a dry basis. t Nitrogen free extract; NFE » 100 - protein - oil - ash - fiber. § DE = Gross energy (calorimeter) - fecal loss.
VOL. 35(6): NOVEMBER-DECEMBER 1992 1863
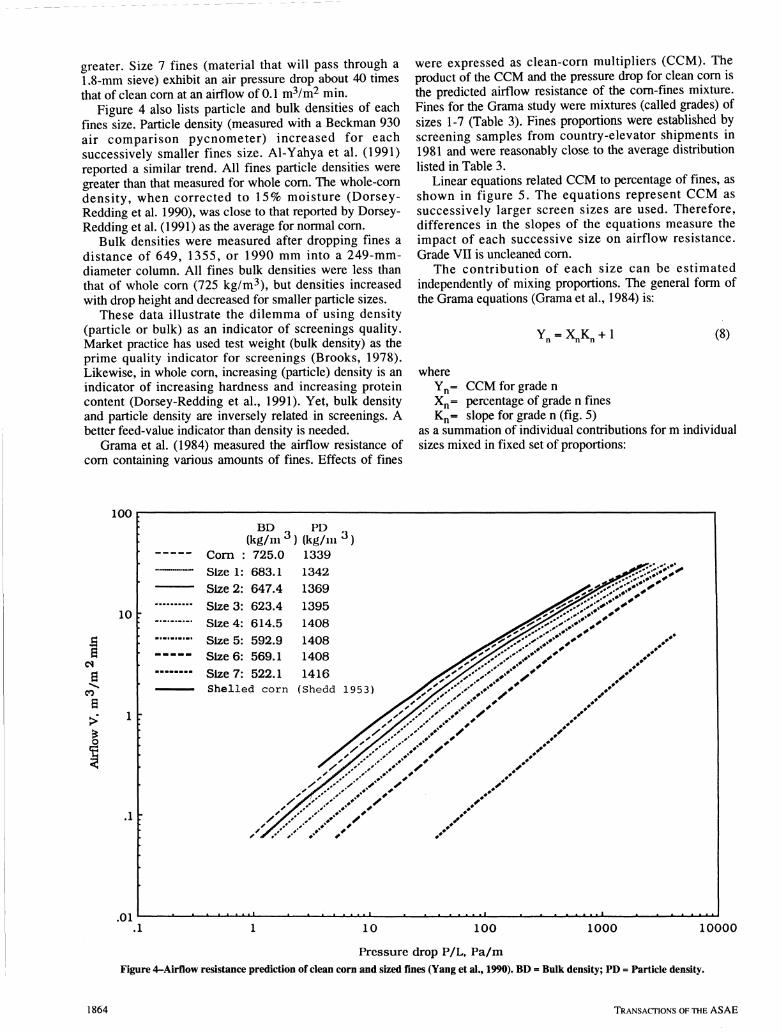
greater. Size 7 fines (material that will pass through a 1.8-mm sieve) exhibit an air pressure drop about 40 times that of clean com at an airflow of 0.1 m^/m^ min.
Figure 4 also lists particle and bulk densities of each fines size. Particle density (measured with a Beckman 930 air comparison pycnometer) increased for each successively smaller fines size. Al-Yahya et al. (1991) reported a similar trend. All fines particle densities were greater than that measured for whole com. The whole-com density, when corrected to 15% moisture (Dorsey-Redding et al. 1990), was close to that reported by Dorsey-Redding et al. (1991) as the average for normal com.
Bulk densities were measured after dropping fines a distance of 649, 1355, or 1990 mm into a 249-mm-diameter column. All fines bulk densities were less than that of whole corn (725 kg/m^), but densities increased with drop height and decreased for smaller particle sizes.
These data illustrate the dilemma of using density (particle or bulk) as an indicator of screenings quality. Market practice has used test weight (bulk density) as the prime quality indicator for screenings (Brooks, 1978). Likewise, in whole com, increasing (particle) density is an indicator of increasing hardness and increasing protein content (Dorsey-Redding et al., 1991). Yet, bulk density and particle density are inversely related in screenings. A better feed-value indicator than density is needed.
Grama et al. (1984) measured the airflow resistance of com containing various amounts of fines. Effects of fines
were expressed as clean-corn multipliers (CCM). The product of the CCM and the pressure drop for clean com is the predicted airflow resistance of the com-fines mixture. Fines for the Grama study were mixtures (called grades) of sizes 1-7 (Table 3). Fines proportions were established by screening samples from country-elevator shipments in 1981 and were reasonably close to the average distribution listed in Table 3.
Linear equations related CCM to percentage of fines, as shown in figure 5. The equations represent CCM as successively larger screen sizes are used. Therefore, differences in the slopes of the equations measure the impact of each successive size on airflow resistance. Grade VII is uncleaned com.
The contribution of each size can be estimated independently of mixing proportions. The general form of the Grama equations (Grama et al., 1984) is:
Yn = X„K„-Hl (8)
where Y„= CCM for grade n Xn= percentage of grade n fines Kn= slope for grade n (fig. 5)
as a summation of individual contributions for m individual sizes mixed in fixed set of proportions:
100 r
10
s s
CO
B > 1
11
.1
.01
(kg/ni 3 Com : 725.0
— Size 1: 683.1 Size 2: 647.4
1 Size 3: 623.4 t —• • Size 4: 614.5
[ '•' Size 5: 592.9 Size 6: 569.1 Size?: 522.1
r ^ ^»'
PD ) (kg/m^)
1339 1342 1369 1395 1408 1408 1408 1416
(Shedd 1953)
^^y^y y y yj^y y y
^ j^' y y ^ jfy y y ^
yyyy y y y y ^^ ' / V y y y ^
• 1 i — t - i - i ^ i .
y y
• • • • • • /
y
^*^» .*\y ^^ 1
.^<^» y y ^^ 1
.y^y<yy y ^
>''^><^y.*y .^^.^1* y y ^^ A 1
>'^^y'\y y X>yy y y y
y>yy y y y .^^^ y y y ^^ • i
y>yy y y y ' .'•' y" y y y V
.1 1 10 100 1000 10000
Pressure drop P/L. Pa/m Figure 4-Airflow resistance prediction of clean corn and sized fines (Yang et al., 1990). BD = Bulk density; PD = Particle density.
1864 TRANSACTIONS OF THE A S A E

2.5
I2.0 i 0 0 c a a 0
1.5
1.0
Q
^ 0 D A 0
-
2 D
Grade 1 II III IV V VI VII
^ ^
Size 1 1,2 1-3 1-4 1-5 1-6 1-7
0 v / ^
1
B-'""' ^
-—"3——"— , \ ,
^ 0 > ^ 1
v \ ' $ ^
^^$^^^^ 1
_ _ - — n 042 X+1^11-- Y
1 y 1 1
or, in conventional units:
Figure 5-Airflow resistance multiplier for increasing percentages of fines in corn (Grama et al., 1984).
Y„ = X k A + 10 (9) i=l
m Y = 2 ( ^ l ( l . 0 - E . ) ( e 0 - 2 6 2 5 Si+1.455) (115)
i=i l i o o ;
Equation 11 estimates the airflow resistance multiplier for cleaned grain, given some initial percentage of BCFM, and a cleaning efficiency for the various particle size.
Fines cause a substantial increase in airflow resistance, and the increase is greater in the smaller sizes than in the larger sizes. The major benefits from cleaning occur from removing material 3.2 mm (8/64 in.) and smaller. Removal of 4.8-mm particles (and smaller) will cut airflow resistance in half. Figure 5 assumed 100% cleaning efficiency for sizes less than the screen size and 0% efficiency for sizes greater than the screen size. In practice, this will not occur (as noted, for example, by Hurburgh et al., 1989). Lesser removal efficiencies for small sizes and some removal of larger fines would flatten out the curves, but the differences between BCFM concentrations would remain.
The airflow resistance, P, in any aeration situation is:
where kj is the contribution of the \th size, dimensionless pack factor units, pj is the percentage by weight of the \th size, in the entire com sample, and m = 7. Equation 9 can be solved successively beginning with Grade I (all size 1, so Ki = k] = 0.030), utilizing the fixed relationship of concentrations between sizes. For grade II, sizes 1 and 2 were present, in the proportions of 33:26 (1.269):
Pl/P2= 1.269
and for X2 = 1:
Y2 = 0.030 (1.269) + k2(l) + 1.0 - 0.042 (2.269) + 1.0
so:
k2 = 0.057, and so on.
This process yields equation 10 (for m = 7, uncleaned com):
P = P . Y k (12)
Y7 « 0.030 Pi + 0.057 P2 + 0.102 P3 + 0.256 P4
+ 0.631 P5+1.344 P6 + 0.648p7+1.0 (10)
The constants (kjS) in equation 10 represent the decimal percentage increase in airflow resistance per percentage point of fines in size i. Equation 10 applies to any cleaning situation, because one or more of the pjS can be made zero.
Equation 9, the general case of equation 10, can be modified from equations 1, 2, and the efficiency factor:
m Y^ = 2 ( ^ ) ( l . 0 - E i ) ( e 0 - 6 6 i 6 s:+i.455) (iia)
i=l \lOO/
where P^ is the clean com airflow resistance (any pressure units), and k represents CCM for other conditions. Fan output will be a simultaneous solution of equation 12 and the fan performance curve (output vs. pressure).
Axial and centrifugal crop drying fans are less effective (m^/min-W) at greater static pressures (MWPS, 1980). Therefore, increased airflow resistance decreases output and increases energy consumption per unit of airflow delivered. Grama et al. (1984) showed that com containing 3% BCFM requires from 10% more fan power (for low-airflow, low pressure aeration) to 264% more fan power for low-temperature bin drying) than clean com containing no BCFM.
Hurburgh (1987) applied this analysis to aeration at grain elevators. No. 2 corn with all BCFM removed showed a $0.006/bushel/y cost savings over No. 2 com with 3% BCFM, based on 2,000 h annual fan operation time at 0.1 m^/min-t (0.1 cfm/bu), and electrical energy costing $0.06/kWh.
PROPERTIES OF CORN DUST Grain dust is composed of solid particles that become
airborne during grain handling. Martin (1981) analyzed grain (including corn) dust collected in dust-control systems of four Kansas elevators.
PARTICLE SIZE DISTRIBUTION Figure 6 shows the particle size distribution of baghouse
and cyclone dust determined by the forward light scatter method. Note that about 5% of this dust is more than 2,000 jLim (2 mm) in diameter, but that more than 50% is smaller than 100 |LLm. Corn dust also contained corn "beeswings" which were 15 to 46 |LLm thick, with a mass of
VOL. 35(6): NOVEMBER-DECEMBER 1992 1865

21.1 to 112 ig and an area of 1.74 to 3.06 mm^. Particle density for all the grain dust averaged 1490 kg/m^, even more than the density reported for sized fines. The heat of combustion of corn dust was measured at 16.2 kJ/g (6970 Btu/lb), with 81.6% combustibles (combustibles -100% - % ash - % moisture).
PROXIMATE ANALYSIS
Table 6 shows proximate analysis results for com (and other) grain dust. Great ash variability was attributed to variability in dirt carried over during harvest. Com dust stands out as having the least ash, the least cmde fiber, and the greatest starch percentages. This is consistent with the Al-Yahya et al. (1991) study that showed that smaller pieces contained more starch.
The last column of Table 5 shows dust nutrient values from Table 6 converted to a dry basis for comparison with other size fractions. Dust stands out as having more ash and fiber than any other fines fraction.
PESTICIDE LEVELS IN DUST
If pesticide has been applied to grain, dust extracted from the grain is l ikely to have greater pest icide concentrations than the grain. This may occur because dust is produced by abrasion, which loosens surface particles that have absorbed the applied pesticide. Spillman and Parnell (1991) tested corn and corn dust from three elevators to determine Malathion concentration. Com dust averaged 0.30 g/Mg Malathion, more than 13 times that detected on the com.
SUMMARY Properties of fines removed from corn have been
reviewed. Properties for which information is found in the literature include constituents, size distribution, nutritive value, economic value, density, and airflow resistance.
TABLE 6. Proximate analysis (as-is basis) of dust control system effluent from commercial grain elevators (Martin, 1981)
99
981
95
90
™50|
IS E , CO 20
10
5
2| 1
-o— Baghouse dust
-®— Cyclone dust
10 20 50 100 200 Diameter \im
Dust-Source Grain
Wheat* Com* Sorghum*
Soybeans! Mixedt
Moisture Content
(%) 6.5-12.8
11.7-13.5 8.0-12.0 9.2-11.8 9.5
Protein
(%) 7.9-12.2 6.1-8.7 5.3-7.8 5.9-13.0 6.5
Ash (%)
7.9-28.5 4.1-9.1 8.2-32.2
12.1-40.5 8.0
Fat (%)
1.6-2.8 1.2-3.6 4.0-4.6 1.9-2.3 4.0
Cmde Fiber
(%) 15.0-17.2 5.0-10.0 8.2-17.3 8.8-11.8 6.8
Starch
(%) 39.8-55.8 60.9-67.6 38.0-61.5 33.6-57.7 65.3
500 1000 2000 5000
* Ranges of four samples. t Ranges of three samples, t Source, com and sorghum dust from baghouse, one sample.
1. About 85% of material smaller than whole kernels is broken com. Noncom materials are concentrated in sizes less than 4.0 mm (10/64 in.).
2. The relative distribution of particle sizes is constant across the com market.
3. Cleaners are most efficient at removing smaller sizes of fines.
4. The feed value, as measured by energy content, declines by about 10% as particle size is decreased from whole com to <1.8mm (4/64 in.). This is not as much as the typical market discount for fines relative to com.
5. Particle density increases and bulk density decreases as particle size decreases, when measurements are made soon after filling.
6. Presence of fines cause increases of up to 200% in airflow resistance of com.
REFERENCES Al-Yahya, S. A., C. J. Bern and C. R. Hurburgh, Jr. 1991.
Aspirator separation of com-fines mixtures. Transactions of the ASAE 34(3):944-949.
Alexander, R. J. 1987. Com dry milling: Process, products, and application. In Com: Chemistry and Technology, eds. S. A. Watson and P. E. Ramstad. St. Paul, MN: American Association of Cereal Chemists, Inc.
Brooks, B. 1978. An analysis of BCFM in com and the market for com screenings. 1977. Corn Quality Conference Proceedings, 69-76. University of Illinois, Urbana, February.
Dorsey-Redding, C, C. R. Hurburgh, Jr., L. A. Johnson and S. R. Fox. 1990. Adjustment of maize quality data for moisture content. Cereal Chem. 67(3):292-295.
. 1991. Relationships among maize quality factors. Cereal Chem. 68(6): 602-605.
Grama, S. N., C. J. Bern and C. R. Hurburgh, Jr. 1984. Airflow resistance of mixtures of shelled com and fines. Transactions of the ASAE 27(1): 268-272.
Hill, L. D., M. Paulsen and M. Early. 1979. Com quality: Changes during export. Spec. Pub. 58, Agric. Expt. Station, Univ. of Illinois, Urbana.
Hill, L.D., M. R. Paulsen, T. L. Mounts, A. J. Heakin and G. R. List. 1981. Changes in quality of com and soybeans between the United States and England. Spec. Pub. 63, Agric. Expt. Station, Univ. of Illinois, Urbana.
Hill, L. D., M. N. Leath, O. L. Shotwell, D. G. White, M. R. Paulsen and P. Garcia. 1982. Alternative definitions for the grade factor of broken com and foreign material. Bulletin 776. Agricultural Experiment Station, Univ. of Illinois, Urbana.
Figure 6-Particle size distribution of grain dust (Martin, 1981).
1866 TRANSACTIONS OF THE ASAE
Hill, L. D., M. R. Paulsen, G. C. Shove and T. J. Kuhn. 1985. Changes in quality of com between U.S. and Japan, 1985. AE-4609. Dept. of Agric. Econ., Univ. of Illinois, Urbana.
Hill, L. D. 1990. Grain Grades and Standards. Urbana, IL: University of Illinois Press.
Hurburgh, C. R., Jr., C. J. Bern, W. F. Wilcke and M. E. Anderson. 1983. Shrinkage and com quality changes from on-farm handling operations. Transactions of the ASAE 26(6): 1859-1857.
Hurburgh, C. R., Jr. 1984. Probe sampling of com. ASAE Paper No. 84-3019. St. Joseph, MI: ASAE.
Hurburgh, C. R., Jr. and B. W. Moechnig. 1984. Shrinkage and other com quality changes from drying at commercial elevators. Transactions of the ASAE 27(4): 1176-1180.
Hurburgh, C. R., Jr. 1986. Particle size characteristics of unit-train and barge com shipments. Dept. of Agric. Engr., Iowa State University, Ames.
. 1987. Aeration-coat control. Proc. 58th International Technical Conference. Grain Elevator and Processing Society, Minneapolis, MN.
Hurburgh, C. R., Jr., C. J. Bem and T. J. Bmmm. 1989. Efficiency of rotary grain cleaners in dry com. Transactions of the ASAE 32(6):2073-2077.
Iowa Development Commission. 1977. Com grading standards: A study of present com quality levels and the economic effect of proposed changes in USDA grading standards. Project P-94. Iowa Development Commission, 250 Jewett Building, Des Moines, lA.
Kalbasi-Ashtari, A., C. J. Bem and G. L. Kline. 1979. Effect of intemal and extemal damage on deterioration rate of shelled com. ASAE Paper No. 79-3038. St. Joseph, MI: ASAE.
Martin, C. R. 1981. Characterization of grain dust properties. Transactions of the ASAE 24(3):738-742.
May, J. B. 1987. Wet milling: Process and products. In Corn: Chemistry and Technology, eds. S. A. Watson and P. E. Ramstad. St. Paul, MN: American Association of Cereal Chemists, Inc.
McLean, K. 1992. Grain dust-hazards, legislation, control. Agricultural Engineering 47( 1): 14-16.
Miller, W. K. 1987. Grain handling practices. Federal Register 52 (125):24432-24438.
MWPS. 1980. Lx)w temperature and solar grain drying. MWPS-22. Midwest Plan Service, Iowa State University, Ames.
NAEGA. 1986. Commitment to quality. North American Export Grain Association, Washington, DC.
Ockerman, H. W. 1978. Source Book for Food Scientists. Westport, CT: AVI Publishing Co.
Quinn, M. D. 1987. Grain cleaning-design and operation overview. Proc. 58th International Technical Conference, 94-102. Grain Elevator and Processing Society, Minneapolis, MN.
Shotwell, O. L., M. L. Goulden and C. W. Hesseltine. 1972. Aflatoxin contamination: Association with foreign material and characteristic fluorescence in damaged com kemels. Cereal Chem. 49:458-465.
Shedd, C. K. 1953. Resistance of grains and seeds to airflow. Agricultural Engineering 34(9): 616-619.
Spillman, D. D. and C. B. Pamell, Jr. 1991. Grain quality impact of recombination of recirculation dust. ASAE Paper No. 91-4010. St. Joseph, MI: ASAE.
Stephens, L. E. and G. H. Foster. 1976. Grain bulk properties as affected by mechanical grain spreaders. Transactions of the ASAE 19(2):354-358, 363.
Stroshine, R. 1989. Fine materials in grain: An overview. Presented at NC151 Fine Materials Symposium, 16 Febmary, St. Louis, MO.
Yang, X., C. J. Bem and C. R. Hurburgh, Jr. 1990. Airflow resistance of cleanings removed from com. Transactions of the ASAE 33(4):\299'\302.
VOL. 35(6): NOVEMBER-DECEMBER 1992 1867