technical guide for fluid fine tailings management · 4.7 characteristics of deep fines-dominated...
TRANSCRIPT

Technical Guide for
Fluid Fine Tailings Management
August 30, 2012


Technical Guide
forFluid Fine Tailings Management
Table of Contents
August 30, 2012 Page i
Table of Contents
1 Introduction .................................................................................................................... 1-1 1.1 Background ...................................................................................................................... 1-1 1.2 Purpose of this Document ................................................................................................ 1-3 1.3 Tailings Management Considerations.............................................................................. 1-3
1.3.1 Tailings Management Objectives .................................................................. 1-4 1.3.2 Limiting FFT Volumes .................................................................................. 1-4 1.3.3 Tailings Roadmap Study ................................................................................ 1-5 1.3.4 Adaptive Management ................................................................................... 1-5
1.4 Outline of Technical Guide .............................................................................................. 1-6 2 Tailings Deposit Design Fundamentals ........................................................................ 2-1 2.1 Key Functions of a Tailings Deposit ............................................................................... 2-1
2.1.1 Environmental Impact of Tailings Management Technologies ..................... 2-1 2.1.2 Economics ...................................................................................................... 2-2
2.2 Deposit Types .................................................................................................................. 2-2 2.3 Selecting Deposit Type and Tailings Processing Technology ......................................... 2-4
2.3.1 Decision Factors, Applicability and Risks ..................................................... 2-4 2.3.2 Dewatering FFT ............................................................................................. 2-5 2.3.3 Current Process Methods ............................................................................... 2-9 2.3.4 Development of Settlement and Deposit Strength ....................................... 2-10
2.4 Geotechnical Considerations for Containment .............................................................. 2-12 2.4.1 Objectives .................................................................................................... 2-12 2.4.2 Potential Mine and Tailings Planning Conflicts .......................................... 2-14 2.4.3 Capping Soft Deposits ................................................................................. 2-14
2.5 Surface Reclamation – Soil and Vegetation .................................................................. 2-16 2.5.1 General Comments ....................................................................................... 2-16 2.5.2 Life-Cycle Stages for Reclamation .............................................................. 2-16
2.6 Adaptive Management in Tailings Deposit Design ....................................................... 2-17 3 Thin-Layered Fines-Dominated Deposits .................................................................... 3-1 3.1 Deposit Description ......................................................................................................... 3-1 3.2 Process Description .......................................................................................................... 3-1
3.2.1 Thin-Lift Dewatering of In-line Flocculated MFT (TLD) ............................. 3-1 3.2.2 MFT Centrifugation ....................................................................................... 3-3 3.2.3 Thin-Lift Thickened Tailings ......................................................................... 3-3 3.2.4 Thin-Lift Freeze-Thaw ................................................................................... 3-3
3.3 State of Technology ......................................................................................................... 3-4 3.3.1 Thin-Lift Dewatering ..................................................................................... 3-4 3.3.2 Centrifugation ................................................................................................ 3-5 3.3.3 Thin-Lift TT ................................................................................................... 3-5
3.4 Deposit Design ................................................................................................................. 3-6 3.4.1 Re-handling to Overburden Disposal Sites .................................................... 3-6 3.4.2 Multiple Layering in Place............................................................................. 3-7

Technical Guide for Fluid Fine Tailings Management
Table of Contents
August 30, 2012 Page ii
3.5 Measuring, Monitoring and Reporting ............................................................................ 3-8 3.6 Contingencies ................................................................................................................... 3-8 3.7 Characteristics of Thin-Lift Deposits............................................................................... 3-9 4 Deep Fines-Dominated (Cohesive) Deposits ................................................................ 4-1 4.1 Deposit Description ......................................................................................................... 4-1 4.2 Process Description .......................................................................................................... 4-1
4.2.1 Thickened Tailings ......................................................................................... 4-1 4.2.2 Accelerated Dewatering ................................................................................. 4-3 4.2.3 MFT-C ........................................................................................................... 4-4 4.2.4 Froth Treatment Tailings ............................................................................... 4-4
4.3 State of Technology ......................................................................................................... 4-4 4.3.1 Deep Deposits of Thickened Tailings ............................................................ 4-4 4.3.2 Accelerated Dewatering Deposits .................................................................. 4-5 4.3.3 Deep Deposits of MFT-C ............................................................................... 4-6 4.3.4 Deep Deposits of FTT .................................................................................... 4-6 4.3.5 Current Practice for Predicting Settlement of Deep Deposits ....................... 4-6 4.3.6 Opportunities for Improvement ..................................................................... 4-7
4.4 Deposit Design ................................................................................................................. 4-8 4.4.1 Design Elements ............................................................................................ 4-8 4.4.2 Deposit Capping, Consolidation and Surface Reclamation ........................... 4-8 4.4.3 Example of a Large Strain Consolidation Prediction .................................... 4-9
4.5 Measuring, Monitoring and Reporting .......................................................................... 4-11 4.6 Contingencies ................................................................................................................. 4-12
4.6.1 Design Allowances ...................................................................................... 4-12 4.6.2 Operating Contingencies .............................................................................. 4-13 4.6.3 Post-Deposition Contingencies .................................................................... 4-13
4.7 Characteristics of Deep Fines-Dominated Deposits ...................................................... 4-13 5 Fines-Enriched Sand ...................................................................................................... 5-1 5.1 Deposit Description ......................................................................................................... 5-1 5.2 Process Description .......................................................................................................... 5-2
5.2.1 Current Commercial Process – Syncrude CT ................................................ 5-3 5.2.2 Planned Commercial Process ......................................................................... 5-3 5.2.3 Potential Future Processes ............................................................................. 5-4
5.3 State of Technology ......................................................................................................... 5-5 5.3.1 Production and Deposition ............................................................................. 5-5 5.3.2 Performance and Capping .............................................................................. 5-6 5.3.3 Further Development ..................................................................................... 5-6
5.4 Deposit Design ................................................................................................................. 5-7 5.4.1 Objectives and Steps ...................................................................................... 5-7 5.4.2 Deposition Plan .............................................................................................. 5-7 5.4.3 Deposit Capping............................................................................................. 5-8 5.4.4 Deposit Consolidation and Settlement ........................................................... 5-8
5.5 Measuring, Monitoring and Reporting .......................................................................... 5-10 5.5.1 Primary Performance Indicators .................................................................. 5-10

Technical Guide
forFluid Fine Tailings Management
Table of Contents
August 30, 2012 Page iii
5.5.2 Site Monitoring ............................................................................................ 5-10 5.5.3 Process Monitoring ...................................................................................... 5-11 5.5.4 Other Performance Measurements ............................................................... 5-12
5.6 Contingencies ................................................................................................................. 5-12 5.7 Characteristics of Fines-Enriched Sand Deposits .......................................................... 5-13 6 Water-Capped Deposits................................................................................................. 6-1 6.1 Deposit Description ......................................................................................................... 6-1
6.1.1 General ........................................................................................................... 6-1 6.1.2 Advantages of Water Capping ....................................................................... 6-2
6.2 Process Description .......................................................................................................... 6-2 6.3 State of Technology ......................................................................................................... 6-3
6.3.1 Testing the Water Capping Concept .............................................................. 6-3 6.3.2 Commercial Readiness................................................................................... 6-3
6.4 Water-Capped Deposit Design ........................................................................................ 6-4 6.5 Measuring, Monitoring and Reporting ............................................................................ 6-5 6.6 Contingencies ................................................................................................................... 6-7 6.7 Characteristics of Water-Capped Deposits ...................................................................... 6-7 7 Fluid Fine Tailings Management .................................................................................. 7-1 7.1 Background ...................................................................................................................... 7-1 7.2 Measuring, Monitoring and Reporting ............................................................................ 7-1
7.2.1 Tailings Site Investigation ............................................................................. 7-2 7.2.2 Pond Measurement ......................................................................................... 7-2
7.3 Contingencies ................................................................................................................... 7-4 8 Summary ......................................................................................................................... 8-1 9 References ....................................................................................................................... 9-1 Appendix A Cohesive Deposit Modelling ....................................................................... A-1 Appendix B Monitoring Tailings Deposits ......................................................................B-1 Appendix C Research on Water-Capped Deposits........................................................ C-1
List of Figures
Figure 1-1 Sand Beaching and MFT Formation .................................................................... 1-1 Figure 2-1 Relative Containment Volume Required for Fines .............................................. 2-3 Figure 2-2 Tailings Volume% vs. Mass% ............................................................................. 2-6 Figure 2-3 Tailings Composition Ternary Diagram .............................................................. 2-6 Figure 2-4 Tailings General Properties Boundaries .............................................................. 2-7 Figure 2-5 Deep Deposit Consolidation .............................................................................. 2-11 Figure 2-6 Deposition Contexts ........................................................................................... 2-13 Figure 2-7 Capping Strength Requirements ........................................................................ 2-15 Figure 3-1 Thin-Lift Drying Process ..................................................................................... 3-2 Figure 3-2 Thin-Lift Drying Mechanism ............................................................................... 3-2 Figure 3-3 MFT Centrifugation Process ................................................................................ 3-3 Figure 3-4 Typical Overburden Poldering Operation for MFT-C ......................................... 3-7

Technical Guide for Fluid Fine Tailings Management
Table of Contents
August 30, 2012 Page iv
Figure 4-1 Thickened Tailings Process ................................................................................. 4-2 Figure 4-2 Accelerated Dewatering Process .......................................................................... 4-3 Figure 4-3 Accelerated Dewatering Pilot Test ...................................................................... 4-4 Figure 4-4 Example Consolidation Prediction ...................................................................... 4-9 Figure 4-5 Consolidation Times .......................................................................................... 4-10 Figure 4-6 Performance Measures for Deep Cohesive Deposits ......................................... 4-12 Figure 5-1 Syncrude Process for Subaerially Beached CT ................................................... 5-3 Figure 5-2 NST Using Two-Stage Cyclones ......................................................................... 5-4 Figure 5-3 Predicted and Measured CT Solids Content and Pore Pressure .......................... 5-9 Figure 6-1 Water-Capped Deposits ....................................................................................... 6-1 Figure 7-1 Pond Surveys ....................................................................................................... 7-3 Figure A-1 Compressibility Data for FFT ............................................................................. A-3 Figure A-2 Permeability Data for FFT .................................................................................. A-4 Figure A-3 Thickened Tailings Test Deposit Depth and Time ........................................... A-11 Figure B-1 LiDAR Survey/Surface Topography ...................................................................B-2 Figure B-2 RCW/FFT Interface and Beach Slopes ................................................................B-2 Figure B-3 Solid-Fluid Tailings Interface ..............................................................................B-3 Figure B-4 CT09 Sounding Probe ..........................................................................................B-4 Figure B-5 Shelby Tube Sampler ...........................................................................................B-5 Figure B-6 Typical Samples Obtained with the Cyre Sampler ..............................................B-6 Figure B-7 Sonic Drilling and Sampling ................................................................................B-7 Figure B-8 CPT-Cone and Sample Output.............................................................................B-9 Figure B-9 Vane Shear Test/Ball Penetration Test ..............................................................B-10 Figure B-10 Vane Shear Test Results ....................................................................................B-11 Figure B-11 Sieves and Sieve Shaker Apparatus ...................................................................B-14 Figure B-12 Hydrometer Apparatus .......................................................................................B-15 Figure B-13 Laser Diffraction Apparatus for Particle Size Analysis .....................................B-16 Figure B-14 Scattering Pattern for Small Particle (a) and Larger Particle (b) .......................B-16 Figure B-15 Methylene Blue Test Apparatus .........................................................................B-17 Figure B-16 Methylene Blue Stain Test .................................................................................B-18 Figure B-17 3D Block Model for Out-Of-Pit Deposit ...........................................................B-21 Figure C-1 Development of Water-Capping Concept – Scaled-Up Testing in
Microcosms and Field Test Ponds .......................................................................C-2 Figure C-2 Establishment of Test Pond Ecosystems Over Two Decades of
Development and Weathering ..............................................................................C-3
List of Tables
Table 3-1 TLD and Rehandling to Overburden ................................................................... 3-9 Table 3-2 TLD and Layered In-Place ................................................................................... 3-9 Table 4-1 Centrifuge Cake ................................................................................................. 4-13 Table 4-2 Accelerated Dewatering ..................................................................................... 4-13 Table 4-3 Thickened Tailings ............................................................................................. 4-13 Table 5-1 CT/NST .............................................................................................................. 5-13 Table 6-1 Design and Materials – Water-Capping Test Ponds and Base Mine Lake .......... 6-4

Technical Guide
forFluid Fine Tailings Management
Table of Contents
August 30, 2012 Page v
Table 6-2 Characteristics of Water-Capped Deposits .......................................................... 6-7 Table 8-1 Characteristics of Deposits – Summary ............................................................... 8-1 Table A-1 TT Compressibility and Permeability Parameters (Based on Fines Void
Ratio)................................................................................................................... A-6 Table A-2 Predicted Consolidation Behaviour for 10 years of Deposit Filling at
Various Loading Rates Using Shell Cell 1 Material Parameters ........................ A-8 Table A-3 Predicted Consolidation Behaviour for 10 years of Deposit Filling at
Various Loading Rates Using Syncrude Cell B Material Parameters ................ A-8 Table A-4 Predicted Consolidation Behaviour for 15 Years of Deposit Filling at
Various Loading Rates Using Shell Cell 1 Material Parameters ........................ A-9 Table A-5 Predicted Consolidation Behaviour for 15 years of Deposit Filling at
Various Loading Rates Using Syncrude Cell B Material Parameters ................ A-9 Table A-6 Predicted Consolidation Behaviour for 20 years of Deposit Filling at
Various Loading Rates Using Shell Cell 1 Material Parameters ...................... A-10 Table A-7 Predicted Consolidation Behaviour for 20 years of Deposit Filling at
Various Loading Rates Using Syncrude Cell B Material Parameters .............. A-10 Table B-1 Comparison of Geophysical Monitoring Techniques ........................................B-13 Table B-2 Laboratory Tests for Recycle Water Quality .....................................................B-19 Table B-3 Common Sampling and Measurement Techniques ...........................................B-20

Technical Guide
forFluid Fine Tailings Management
Abbreviations
August 30, 2012 Page vii
Abbreviations
3D ............................................................................................................. three-dimensional ADW ................................................................................................ accelerated dewatering AFD ............................................................................................... atmospheric fines drying BAW ........................................................................................................ beach above water BBFFT .................................................................................. beach below fluid fine tailings BBW ........................................................................................................ beach below water CADD ........................................................................... computer-aided design and drafting CEMA .......................................................... Cumulative Effects Management Association CT .......................................................................................................... Composite Tailings CPT ....................................................................................................... cone penetration test CT .............................................................................................................composite tailings CWZ ............................................................................................................ clear water zone DDA ................................................................................................. dedicated disposal area ERCB ...................................................................... Energy Resources Conservation Board FFT ............................................................................................................ fluid fine tailings FTT ................................................................................................... froth treatment tailings FOFW ................................................ fines over (fines + water) ratio (also, see definitions) GCPT ....................................................................................... gamma cone penetration test GHG ......................................................................................................... greenhouse gases LFH .................................................................................................. luvic, fulvic and humic LiDAR ........................................................................................ light detection and ranging MBI ................................................................................................... Methylene Blue Index MFT ........................................................................................................ mature fine tailings NST ................................................................................................ non-segregating tailings off-spec ....................................................................................................... off-specification OSPM ............................................................................ oil sands process-affected material OSPW .................................................................... oil sands process-affected tailings water OSTC .................................................................................. Oil Sands Tailings Consortium OWS ............................................................................................................. oil-water-solids PMDS ......................................................................... production management data system PSD ................................................................................................. particle size distribution RCW ................................................................................................................ recycle water SFR ........................................................................................................... sand-to-fines ratio TLD ............................................................................................................... thin-lift drying TRO ......................................................................................... tailings reduction operations TRS ................................................................................................ Tailings Roadmap Study TSS ..................................................................................................... total suspended solids TT ............................................................................................................. thickened tailings VST ............................................................................................................... vane shear test

Technical Guide
forFluid Fine Tailings Management
OSTC Companies
August 30, 2012 Page ix
OSTC Companies
Following over two years of consultation and planning, the Oil Sands Tailings Consortium (OSTC) was formally launched December 10, 2010 to facilitate cooperation with the objective of accelerating development of tailings management technology and practices. The OSTC includes all seven companies with operating responsibilities for surface mining oil sands leases.
Short Name Full Company Name
Canadian Natural Canadian Natural Resources Ltd.
Imperial Imperial Oil
Shell Shell Canada Limited
Suncor Suncor Energy Inc.
Syncrude Syncrude Canada Ltd.
Teck Teck Resources Limited
Total Total E&P Canada Ltd.
Acknowledgements
The OSTC extends appreciation to its working team members for their dedicated efforts in preparing this document: Nav Dhadli Alan Fair Alexander Hyndman Adam Langer
Preston McEachern Stuart Nadeau Adrienne Nickerson Fred Payne
Blair Penner Bill Shaw Rick Sisson
The OSTC also recognizes the important work of members of two expert panels that reviewed the work in progress through to completion, providing guidance to ensure technical integrity and clarity: W. David Carrier III President, Argila Enterprises, Inc. and Lunar Geotechnical Institute Inc. Lakeland, FL
Richard Dawson, PhD, P.Eng. Senior Vice President Norwest Corporation Vancouver, BC
Gerald DeSorcy, BSc., P.Eng. Consultant, DeSorcy Consulting Services Ltd. Calgary, AB
Ross Eccles, BSc., MSc. Senior Principal, Stantec Consulting Sidney, BC
John C. Errington, PhD, P.Ag. Consultant, John C. Errington and Associates Ltd. Victoria, BC
Barry J. Hurndall, C.Eng., M.I.C.E., P.Eng. Consultant, BJH Engineering Edmonton, AB
Norbert R. Morgenstern CM, AEO, PhD, P. Eng. Distinguished University Professor Emeritus Geotechnical Department of Civil and Environmental Engineering University of Alberta Edmonton, AB
Bernard J. Roth, LL.M., LL.B., B.A. Partner, Fraser Milner Casgrain LLP Calgary, AB
John C. Sobkowicz, PhD, P.Eng. Principal and Senior Geotechnical Engineer Thurber Engineering Ltd. Calgary, AB


Technical Guide
forFluid Fine Tailings Management
Definitions
August 30, 2012 Page xi
Definitions
Adaptive management See Williams, B.K., Szaro, R.C. and Shapiro, C. D. 2009. Adaptive Management: U.S. Department of the Interior Technical Guide. Available at: http://www.doi.gov/initiatives/AdaptiveManagement/TechGuide.pdf.
Bitumen content Mass of bitumen divided by mass of (solids + bitumen + water) x 100%.
Coagulation The agglomeration of fine particles in a tailings slurry, usually by the addition of a chemical agent that alters the electrical charge on those particles, thereby reducing inter-particle repulsive forces.
Fines, fine solids Mineral solids with particle size equal to or less than 44 μm, (does not include bitumen).
Fines content Mass of fines divided by mass of (solids + bitumen + water) x 100%.
Fines/(fines + water) ratio (FOFW)
Mass of fines divided by the (mass of fines + water) x 100%.
Flocculation The “clustering” of fine particles in a tailings slurry into groups or “flocs,” usually by the addition of a chemical agent that binds to those particles, thereby tying them together.
Fluid fine tailings (FFT) A liquid suspension of oil sands fines in water with a solids content greater than 2% but less than the solids content corresponding to the Liquid Limit.
Geotechnical fines content Mass of fines divided by mass of solids x 100%.
Geotechnical water content Mass of water divided by mass of solids x 100%.
Interburden Bitumen-lean (or free) layers within the ore, of sufficient thickness to be mined selectively and rejected for disposal with overburden or used for construction material.
Liquid limit (LL) The geotechnical water content defining the boundary between a liquid and a solid in soil mechanics, with equivalent remolded shear strength of 1 to 2 kPa. This state is defined by a standard laboratory test (ASTM D4318-10; modified for use in oil sands tailings containing bitumen). It can also be described in terms of an equivalent FOFW.
Mature fine tails (MFT) FFT with a low SFR (<0.3) and a solids content greater than 30% (nominal).
Mud farming The process of mechanically spreading a thin fine tailings deposit and discing the deposit to expose underlying material to atmospheric drying.
Meromictic A meromictic lake has layers of water that do not intermix.
Overburden The soil overlying the mined and processed oil sands ore, which may be used for various construction purposes or placed in overburden disposal deposits.
Plastic limit (PL) The geotechnical water content defining the boundary between a plastic (i.e., remoldable) solid and a brittle solid in soil mechanics, with an equivalent remolded shear strength of about 100 kPa. This state is defined by a standard laboratory test (ASTM D4318-10; modified for use in oil sands tailings containing bitumen). It can also be described in terms of an equivalent FOFW.
Sand Mineral solids with particle size greater than 44 µm (does not include bitumen).
Sand to fines ratio (SFR) The mass ratio of sand to fines – i.e., the mass of mineral solids with particle size >44 µm divided by the mass of mineral solids with particle size ≤44µm.

Technical Guide for Fluid Fine Tailings Management
Definitions
August 30, 2012 Page xii
Shrinkage limit (SL) The geotechnical water content defining the point at which a soil, upon loss of moisture, will experience no further volume reduction. This state is defined by a standard laboratory test (ASTM D4943-08; modified for use in oil sands tailings containing bitumen).
Solids Sand, clay and other solid particles contained in oil sands tailings (does not include bitumen).
Solids content Mass of solids divided by mass of (solids + bitumen + water) x 100%.
Subaerial deposition Deposited above water with exposure to the atmosphere.
Thin fine tails (TFT) FFT with a low SFR (<0.3) and a solids content between 15% (nominal) and 30% (nominal).
t/m2-y Tonnes (typically, of dry solids) per square metre per year.
tremie diffuser A device used to dissipate energy at the discharge of a slurry into water to avoid segregation.
Water content Mass of water divided by mass of (solids + bitumen + water) x 100%.
Whole tailings Tailings as produced directly from the primary separation cells in the extraction plant, containing water and most of the sand and fines from the oil sands ore.
µm microns or micrometres – one millionth of 1 m
Technical Guide
forFluid Fine Tailings Management
Section 1: Introduction
August 30, 2012 Page 1-1
1 Introduction
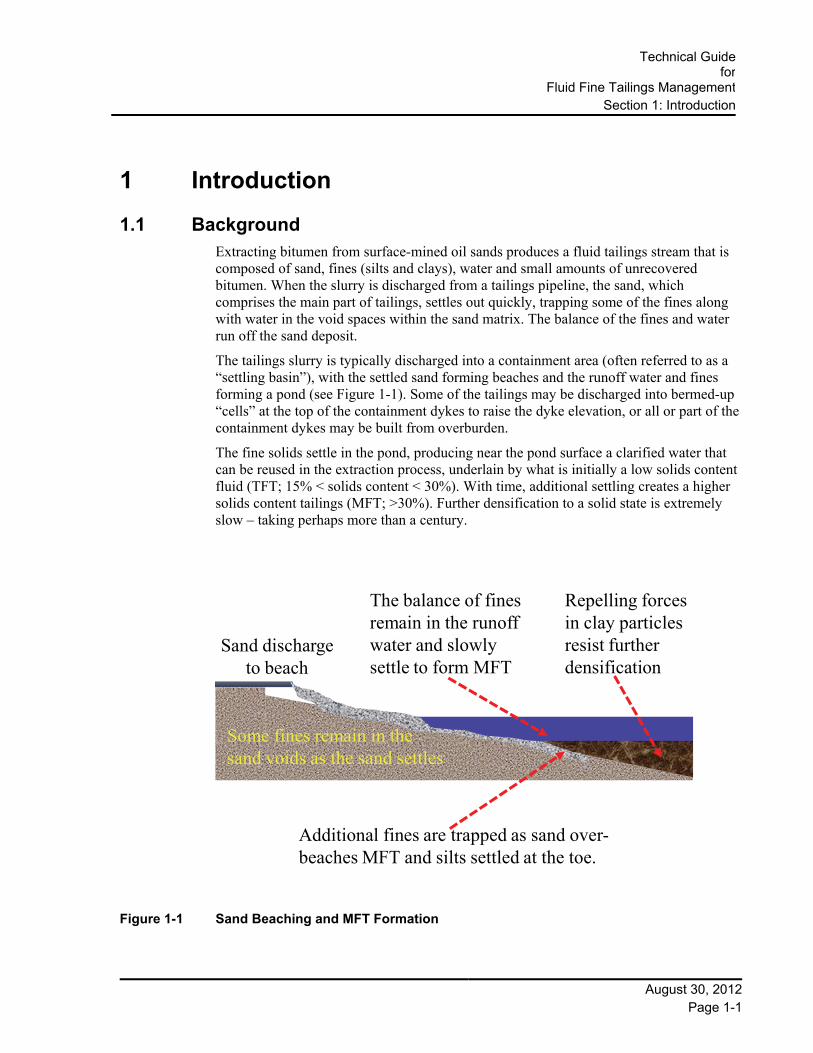
1.1 Background Extracting bitumen from surface-mined oil sands produces a fluid tailings stream that is composed of sand, fines (silts and clays), water and small amounts of unrecovered bitumen. When the slurry is discharged from a tailings pipeline, the sand, which comprises the main part of tailings, settles out quickly, trapping some of the fines along with water in the void spaces within the sand matrix. The balance of the fines and water run off the sand deposit.
The tailings slurry is typically discharged into a containment area (often referred to as a “settling basin”), with the settled sand forming beaches and the runoff water and fines forming a pond (see Figure 1-1). Some of the tailings may be discharged into bermed-up “cells” at the top of the containment dykes to raise the dyke elevation, or all or part of the containment dykes may be built from overburden.
The fine solids settle in the pond, producing near the pond surface a clarified water that can be reused in the extraction process, underlain by what is initially a low solids content fluid (TFT; 15% < solids content < 30%). With time, additional settling creates a higher solids content tailings (MFT; >30%). Further densification to a solid state is extremely slow – taking perhaps more than a century.
Sand discharge to beach
Some fines remain in thesand voids as the sand settles
Additional fines are trapped as sand over-beaches MFT and silts settled at the toe.
The balance of fines remain in the runoff water and slowly settle to form MFT
Repelling forces in clay particles resist further densification
Figure 1-1 Sand Beaching and MFT Formation

Technical Guide for Fluid Fine Tailings Management
Section 1: Introduction
August 30, 2012 Page 1-2
There are three key issues associated with managing fluid fine tailings throughout the operating period of oil sands mines, to create a sustainable terrain for mine closure:
1. The volume of MFT produced is substantial. At the time of writing there are approximately 800 million m3 of fluid tailings held in above-grade containment dams.
2. The methods for transformation of fluid tailings into stable, sustainable elements of a closure landscape are all in various states of development, from preliminary research to commercial practice. None can be considered as mature, i.e. proven practice, with performance fully demonstrated for operation and closure.
3. Until recently, full commercialization of methods for fluid fine tailings management was slow. This has resulted in progressive reclamation respecting fluid tailings volumes being less than desirable to date.
This report describes the different ways in which various oil sands tailings deposit types are produced, their important performance factors and how the deposit performance can be assessed through the period of their placement to their readiness for reclamation.
Four deposits types are created from the fines management methods under active development and commercial use:
1. Thin layered, fines-dominated deposits – After initial dewatering from chemical and mechanical treatment, these deposits rely on environmental effects, such as atmospheric evaporation and freeze-thaw cycles, for water reduction. The primary performance factor for this type of deposit is undrained shear strength.
2. Deep, fines-dominated deposits – After initial dewatering by chemical and mechanical treatment, these deposits rely on self-weight consolidation over time for dewatering. The primary performance factor for this type of deposit is solids content (or volume reduction) with time.
3. Fines-enriched sand deposits – These deposits rely on self-weight consoli-dation as their primary dewatering method. With higher permeability than fines-dominated deposits, they dewater more quickly under self-weight or with additional load from a capping layer. The primary performance factors for this type of deposit are SFR distribution in the deposit (to demonstrate lack of segregation) and solids content (or volume reduction) with time as surface surcharge is applied.
4. Water capped fines deposits – These deposits are based upon placing MFT or other densified fluid fine tailings in a completed mine pit, where they are capped with water. The primary performance factor for this type of deposit is surface water quality.
The monitoring protocols for these deposits include a variety of methods using both direct and/or indirect measures to track the primary performance factors. In addition, Adaptive Management approaches are an essential element in the practice of geotechnical engineering and reclamation science, to manage the inherent uncertainties associated with large-scale resource development.

Technical Guide
forFluid Fine Tailings Management
Section 1: Introduction
August 30, 2012 Page 1-3
From a public-interest perspective, it is important to identify the remaining steps required to increase the certainty of performance for each of the deposit types. Design and predictive timeline parameters must be delivered with sufficient definition to support planning and construction of tailings deposits within the context of the closure landscape.
Above-grade, out-of-pit tailings containment structures are a necessary, but temporary, component of the extraction and water-recycle process. The intent in developing fluid tailings technology and management methods has been, and continues to be, to provide operators with the means to reclaim these tailings deposits and achieve geotechnically secure landforms for mine closure. .
Oil sands operators are confident in their capability to effectively manage tailings during operations, reclamation and closure of their mine sites. With collaboration through the OSTC, work underway is focused on bringing a number of tailings treatment methods to commercial readiness that are more efficient – methods that use less energy, land area and other resources – to support progressive reclamation and complete mine closure.
This document serves to make transparent the state of technology, including the opportunities and uncertainties related to the methods under development. The methods now being commercialized, together with adaptive management, will provide operators with the means to effectively and economically reclaim the mine sites they operate so that resource value is conserved for Alberta.
1.2 Purpose of this Document In 2011, the Government of Alberta released the Lower Athabasca Regional Plan (LARP), based on work dating from 2007. The LARP provides a series of frameworks for managing cumulative environmental effects in the oil sands region. One LARP component is a tailings management framework.
The primary purpose of this document is to set out technical guidelines in support of the tailings management framework, for managing fluid fine tailings (FFT). An additional purpose is to provide transparency regarding the commercialization of methods designed to treat or manage oil sand tailings, to deliver the desired closure outcomes.
The technical guidelines presented in this document are intended to support the Government of Alberta in developing consistent policy for tailings regulation.
1.3 Tailings Management Considerations Tailings management should continue to focus on:
Achieving outcomes Evidence-based assessment of plans and risks Collaborative work by industry on solutions Transparency of progress and performance Integration of social, economic and environmental considerations.

Technical Guide for Fluid Fine Tailings Management
Section 1: Introduction
August 30, 2012 Page 1-4
1.3.1 Tailings Management Objectives
Underlying the development of a portfolio of tailings management methods are the following key tailings management objectives:
1. Longer term (before or at mine closure):
Establish a stable1 closure landscape that protects groundwater, directs surface water off the lease into established streams, and supports desired land end-use.
2. Shorter term (a limited timeframe after completing deposition for a terrestrial end-use deposit):
“Reclaim” the ground surface – place a cover to support access and plant growth.
3. Pursue solutions that fit lease conditions and operating realities.
4. Use technically sound, environmentally responsible and cost-effective methods.
In pursuing these objectives, oil sands operators are accountable to:
Develop and execute plans that meet tailings management objectives Submit plans that contain measurable performance goals Measure performance and report performance Take action if performance does not achieve required outcomes.
These objectives should be balanced with a high value placed on progressive reclamation so that excessive liability and closure costs are not deferred and results are demonstrated early in the developments.
The tailings management methods and resulting deposits must support the reclamation outcomes for mine closure. Interim measures and requirements should focus on those outcomes, avoiding criteria that could impede innovation and development or prevent the use of optimum methods. A performance-based approach to tailings management will ensure tailings deposits meet requirements for reclamation outcomes.
1.3.2 Limiting FFT Volumes
Of most importance, this document proposes that site-specific volume profiles of FFT be established for each mine site. This approach provides a direct method to manage and steward the volume of FFT, and would limit the accumulation and containment of FFT in a manner consistent with the goals of progressive reclamation and the desired reclamation and closure outcomes.
Under this proposal, oil sand operators would employ adaptive management to remain within their committed volumes. Adaptive management deals with inherent uncertainties associated with FFT generation, allowing operators to deploy available (and newly developed) methods, as required. Performance monitoring and reporting are essential elements, providing information on environmental conditions and identifying the need for ongoing adjustments and changes.
1 “Stable” means resistant to natural processes, self-healing after natural erosion and with a self-sustaining, native
vegetation cover.
Technical Guide
forFluid Fine Tailings Management
Section 1: Introduction
August 30, 2012 Page 1-5
1.3.3 Tailings Roadmap Study
In April 2011, a Tailings Roadmap Study (TRS) was jointly initiated by the OSTC and Alberta Innovates, Energy and Environment Solutions, with participation from Alberta Environment and Sustainable Resource Development, the ERCB, Alberta Energy and CanmetENERGY. The TRS is intended to identify a list of potential technologies to more effectively manage oil sands tailings. It is also intended to provide a path for commercialization of the most promising technologies and methods of application. Although the TRS results are a “snapshot in time,” they will assist in identifying technologies that merit further development.
Technologies included in the TRS range from methods industry is currently progressing (including some being used commercially), to others in initial stages of research and development being advanced by OSTC members or third-party technology developers. The OSTC has industry support to provide capacity to continue or begin work on technologies that merit additional development effort.
1.3.4 Adaptive Management
As noted, the state of development of both existing and new tailings management technologies ranges from pilot-scale to commercial demonstration. At present, no technology that addresses FFT can be considered “mature,” in the sense of having demonstrated that reclamation and closure objectives have been attained. Given the inherent challenges and learning curve as these technologies are validated at a commercial-scale, their design and operation, and the regulatory processes involved, must accommodate an “adaptive management” approach to succeed.
The U.S. Department of Interior Technical Guide to Adaptive Management2 describes adaptive management as follows:
Adaptive management is framed within the context of structured decision making, with an emphasis on uncertainty about resource responses to management actions and the value of reducing that uncertainty to improve management. Though learning plays a key role in adaptive management, it is seen here as a means to an end, namely good management, and not an end in itself.
This approach is consistent in principle with the existing regulatory framework in Canada and Alberta, and its value in application to oil sands mines has been recognized. For example, the adaptive management approach was referenced by Madam Justice Tremblay-Lamer during the March 5, 2008 court judgement on the Kearl Project:
[32] An approach that has developed in conjunction with the precautionary principle is that of “adaptive management.” In Canadian Parks and Wilderness Society v. Canada (Minister of Canadian Heritage), 2003 FCA 197, [2003] F.C.J. No. 703, at para. 24, Evans J.A. stated that “[t]he concept of adaptive management responds to the difficulty, or impossibility, of predicting all the environmental consequences of a project on the
2 Williams, B. K., R. C. Szaro, and C. D. Shapiro. 2009. Adaptive Management: The U.S. Department of the
Interior Technical Guide. Adaptive Management Working Group, U.S. Department of the Interior. Washington, DC.

Technical Guide for Fluid Fine Tailings Management
Section 1: Introduction
August 30, 2012 Page 1-6
basis of existing knowledge” and indicated that adaptive management counters the potentially paralyzing effects of the precautionary principle.
Thus, in my opinion, adaptive management permits projects with uncertain, yet potentially adverse environmental impacts to proceed based on flexible management strategies capable of adjusting to new information regarding adverse environmental impacts where sufficient information regarding those impacts and potential mitigation measures already exists.
1.4 Outline of Technical Guide This document provides guidance in the following areas:
Tailings deposit design and planning – how site geography and resulting deposit geometric constraints affect design, performance, and the evidence behind the projected performance
Plans for performance measurement and reporting
The approach for assessing effectiveness and acceptability of operator performance commitments
Adaptive management and contingencies should the actual deposit consolidation or other performance criteria fall below minimum acceptable performance.
The guide has eight sections:
Section 1: Overview of tailings management evolution, technology development and reclamation and closure objectives (this section).
Section 2: Tailings deposit design fundamentals.
Sections 3–6: Technology-specific details, scientific basis, measurement/stewardship and adaptive management strategies.
Section 7: Protocols for measurement, reporting of FFT volume.
Section 8: Summary.
Technical Guide
forFluid Fine Tailings Management
Section 2: Tailings Deposit Design Fundamentals
August 30, 2012 Page 2-1
2 Tailings Deposit Design Fundamentals
This section provides an overview of tailings deposit fundamentals as background for discussion of specific deposit types in Section 3 through Section 6.
2.1 Key Functions of a Tailings Deposit The key functions of a tailings deposit are for placement of tailings solids and water after extraction of the desired mineral (bitumen in the case of oil sands) from the ore, and in some cases, clarification and storage of water for reuse. In meeting these functions, the following are considered:
Mine planning and operations Dam safety Environmental impacts Economics.
2.1.1 Environmental Impact of Tailings Management Technologies
The total environmental impact of tailings management technologies must be considered. Impacts on air, land and water are balanced with reclamation considerations. Intensive tailings reclamation methods can result in higher environmental impacts in other areas, such as higher energy use or larger overall terrestrial footprints. Factors considered when assessing the overall environmental effects of FFT management technologies include:
Tailings footprint – total and wet
Process-affected water management during operations and at closure
Make-up water demands over time
Energy intensity and greenhouse gas emissions
Inventory of FFT and process-affected water through the operating period and at closure
Resource sterilization associated with out-of-pit tailings ponds and overburden disposal
Progressive reclamation, mine closure liability and resilience of the closure landscape to extreme natural events (fire or floods).
Development plans, technology, scientific understanding and performance measures change over time. An adaptive management approach ensures that the desired outcomes continue to be achieved. Unique site characteristics and technology choices will dictate individual responses to tailings management and will therefore vary between operators.
Technical Guide for Fluid Fine Tailings Management
Section 2: Tailings Deposit Design Fundamentals
August 30, 2012 Page 2-2
2.1.2 Economics
In addition to environmental and progressive reclamation considerations, cost-effective solutions are important for the following reasons:
Cost reflects the total resources used to accomplish the method employed. High costs generally reflect higher inputs of energy, materials and equipment, all of which have their own environmental impacts.
Both the Province of Alberta and the oil sands operators share in the net value created by oil sands development after all input costs are accounted for. Therefore, economic efficiency of oil sands development contributes directly to the province’s fiscal balance and the ability to fund education, health care and other important provincial responsibilities.
2.2 Deposit Types Technology is constantly evolving; in a relatively new industry this is abundantly true. Significant opportunities are available to improve and optimize exiting technologies, and potentially create completely new ones that will markedly change the industry. Outlined below are technologies that are being developed to achieve new levels of performance in tailings management:
Thin-lift dewatering provides early strength using polymer flocculation to provide initial dewatering, placement in thin lifts for drainage and then allowing the environmental effects of evaporation and freeze-thaw to complete the dewatering process. Reliance on these variable environmental effects results in some uncertainty as to the volumes that can be treated in any given year, or alternatively the land area needed to treat the desired volumes.
Deep fines-dominated (cohesive) deposits also involve the use of polymer flocculants. However, the material is placed in thicker lifts, in containment structures with significantly less land area than is required for atmospheric drying. Volume reduction and increased strength occur through self-weight consolidation over longer periods. The process can also include pre-treatment with thickeners or centrifuges to initiate this dewatering. The volume and area certainty and reduced land disturbance can provide an effective reclamation strategy, but time to consolidate is longer and less certain than for other deposit types, such as sand-dominated deposits. Deposition timing and location are linked with mine development advancement and containment availability.
Fines-enriched sand deposits that require containment and eventual capping to achieve surface strength are created using such technologies as composite tailings (CT) and non-segregating tailings (NST). When placed to avoid excessive segregation and retain a sand-dominated matrix, the deposits consolidate relatively quickly. Current efforts are aimed at minimizing segregation, which has been challenging in earlier operations – particularly in deep water deposits. This method competes for the use of sand that is also required for capping deposits and for containment dyke construction. These deposits release water and dissipate pore pressures faster, have higher effective stresses and thus can support higher loads, and reduce volume more quickly than deep fines-dominated deposits. Although they are more costly to cap than sand beach deposits, capping a fines-enriched sand deposit is achievable using more conventional lower-cost approaches than fines-dominated deposits.

Technical Guide
forFluid Fine Tailings Management
Section 2: Tailings Deposit Design Fundamentals
August 30, 2012 Page 2-3
As the volume of fines-enriched sand is predominantly the sand, these deposits require much greater containment volume for a specific mass of fines than all-fines deposits, (Figure 2-1 compares the relative volume requirement for different deposit materials). However, the total volume is less than separate deposits of sand and fines. Since all of the sand must be stored somewhere, it makes sense to maximize capture of fines in the sand, to the extent practical, for the various types of sand deposits.
Water-capped fines provide an effective solution for managing FFT using deep mine pits that are present during and at the completion of mine development. Deep pits present unique challenges on closure. Mature fine tailings (MFT) or polymer-treated and densified fine tailings provide suitable materials available for partial fill to avoid excessive lake depth.
Each of these technologies optimizes different aspects of the site-specific opportunities and challenges. They need to be selected and applied as appropriate to each site to achieve the intended final reclamation and closure landscape outcomes. For example, containment volume availability is important to selection of methods. Referring to Figure 2-1, a CT deposit with an SFR of 4, approaching complete consolidation at 80% solids, requires over 3 Mm3 of containment to manage 1 M t of fines, whereas a treated MFT deposit at just 60% consolidation requires about one- third the containment volume for 1 M t of fines. These volume and timing factors are integral to the planning process.
0
2
4
6
8
10
30 35 40 45 50 55 60 65 70 75 80
Sto
rage
Vol
ume
(Mm
3pe
r dr
y M
tonn
esof
fin
es)
Solids Content % (by Total Mass)
CT
MFT
TT
Volume Reduction
Figure 2-1 Relative Containment Volume Required for Fines

Technical Guide for Fluid Fine Tailings Management
Section 2: Tailings Deposit Design Fundamentals
August 30, 2012 Page 2-4
2.3 Selecting Deposit Type and Tailings Processing Technology
2.3.1 Decision Factors, Applicability and Risks
Two fundamental factors must be evaluated when choosing the tailings technologies and the types of deposits that will be used at a particular site:
The cost required to meet the performance criteria and objectives outlined in Section 1.2.1
The risks associated with the performance of the selected methods.
Performance criteria for tailings deposits are proposed in the applicant’s mine design to control the operating inventory of FFT and achieve the reclamation goals outlined in mine closure plans. Therefore, the tailings technology and type of deposit must be selected to optimize the cost while achieving these performance criteria. An adaptive management plan must be in place to ensure submitted FFT management and closure plans can be attained. Unsatisfactory performance can result in expensive remediation, delays in progressive reclamation or both.
The performance evaluation of the specific fines deposits or fines-enriched sand deposits is site-specific. The results of the performance evaluation depend on a number of variables, including:
Ratio of mineable to non-mineable area within lease boundaries (determines availability of out-of-pit storage area for overburden/interburden and tailings disposal)
Deposit strip ratio
Design of any existing extraction and onsite upgrading facilities
Ore particle size distribution and chemistry
Foundation conditions for tailings containment structures
Availability and suitability of material, both above the ore body (overburden) and within the ore body (interburden) for use in construction of tailings containment structures
Existing inventories of FFT and process-affected water
Availability of fines from a thickening operation
Design of the reclamation landscape, including surface drainage features.
Site-specific conditions are the key determinant in selecting the type of deposit at a particular site. General considerations in selecting deposit types include:
Thin-lift, fines-dominated deposits can be used where a very large land area is available for drying or where significant amounts of partially-dewatered material can be contained in mine overburden/interburden disposal areas.
Thick, fines-dominated deposits are advantageous where land area is not sufficient for thin-lift deposits or where such deposits would result in unacceptable environmental impacts.
Technical Guide
forFluid Fine Tailings Management
Section 2: Tailings Deposit Design Fundamentals
August 30, 2012 Page 2-5
Thick, fines-enriched sand deposits make sense where sand is in any case being stored, but not in critical elements of containment structures (such as dykes) and not where competing demands for sand (tailings containment construction and deposit capping) limit use of fines-enriched sand deposits.
Water-capped deposits provide an option for managing fluid tailings with minimal use of land, energy, and other costly resources. Partial filling of a mine pit with fine tailings allows for setting an appropriate (clear water) lake depth and for sealing the base of pit lakes to inhibit inflow of water into the pit (e.g., from high-salt basal aquifers) or out of the pit.
In addition to site-specific variables, the tailings management/planning team must deal with the current levels of uncertainty regarding tailings technology. No technology is free of the risk that performance will vary from planning assumptions. This risk cannot be quantitatively assessed with a high degree of accuracy; rather, it is qualitatively assessed, involving the judgement of planners, engineers and scientists.
Risk will vary depending on both site-specific conditions and the experience and collective views of the team. The team requires a suite of technologies available to manage both cost and risk through an adaptive management plan that accommodates the inherent uncertainties in the science.
Risk is progressively reduced as the different methods gain experience through practice, and assessments of performance add to the knowledge base.
2.3.2 Dewatering FFT
FFT from oil sands extraction plant initially (in the pipeline) consist of clay, fine silt, coarse silt and fine sand particles suspended in water. Upon deposition, most of the sand and coarse silt settles out in beaches, and the fines run off into a pond. They reach a nominal 15% solids content and an SFR less than about 0.3 after a number of days (and are referred to as TFT) – this is the solids content measured at the “mudline” and represents the boundary of relatively unhindered settlement.
After a year or two, the solids content below the mudline increases to about 30% (mainly by a hindered settlement process, but also with the onset of consolidation), becoming mature fine tailings or MFT. Above 30% solids, the MFT continues to densify (or “dewater) by a combination of consolidation and creep. These processes are extremely slow, owing to the build-up of repelling forces on the clay surfaces and the reduction in hydraulic conductivity at lower void ratios.
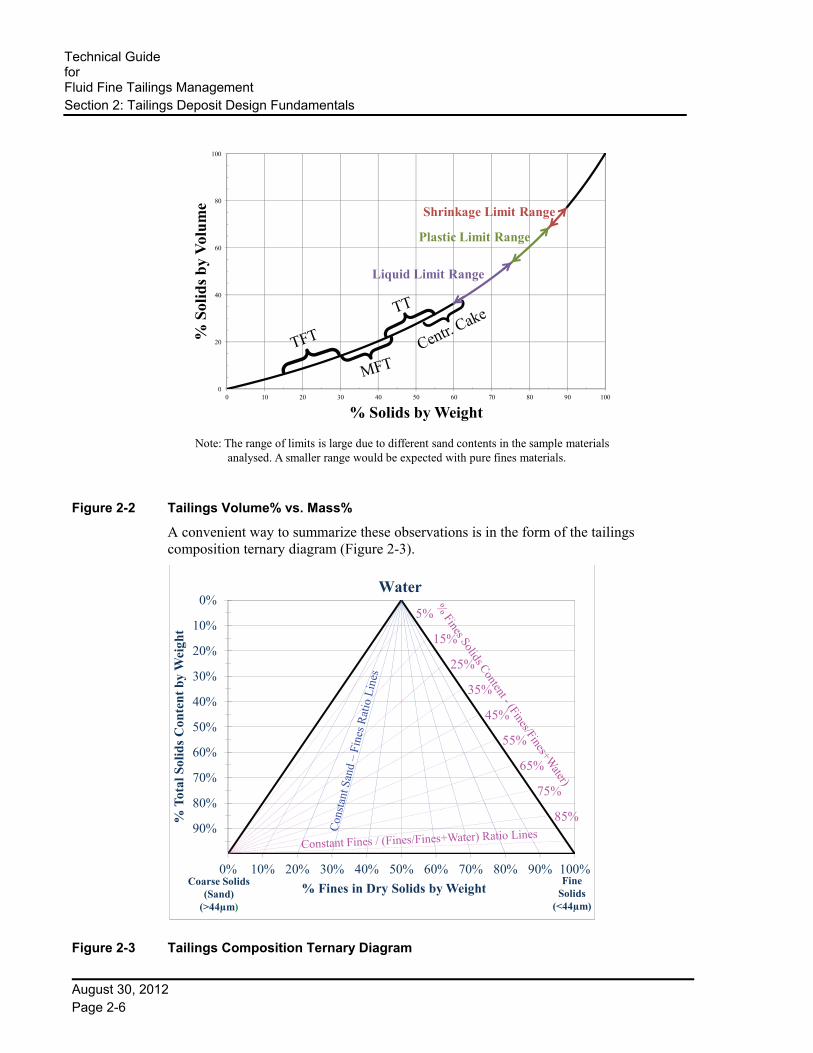
A perspective on volume reduction through dewatering is shown in Figure 2-2, which compares percent water and solids by weight versus the equivalent volume percentages. Note that a slurry with a 50% solids content (i.e., by weight) is 72% water by volume. It must attain a solids content of 75% to 80% (by weight) to develop sufficient long-term stiffness and strength (in the range of 50 kPa to 100 kPa), losing 67% to 75% of its water in the process, and ending up at water contents of 47% to 40% by volume (respectively). For tailings treatment technologies involving drying, FFT might further dewater as far as the shrinkage limit.
Technical Guide for Fluid Fine Tailings Management
Section 2: Tailings Deposit Design Fundamentals
August 30, 2012 Page 2-6
Figure 2-2 Tailings Volume% vs. Mass%
A convenient way to summarize these observations is in the form of the tailings composition ternary diagram (Figure 2-3).
Figure 2-3 Tailings Composition Ternary Diagram
0
20
40
60
80
100
0 10 20 30 40 50 60 70 80 90 100
% S
olid
s b
y V
olu
me
% Solids by Weight
Note: The range of limits is large due to different sand contents in the sample materials analysed. A smaller range would be expected with pure fines materials.
Shrinkage Limit Range
Plastic Limit Range
Liquid Limit Range
5%
15%
25%
35%
45%
55%
65%
75%
85%
0%
10%
20%
30%
40%
50%
60%
70%
80%
90%
0% 10% 20% 30% 40% 50% 60% 70% 80% 90% 100%
% T
otal
Sol
ids
Con
ten
t b
y W
eigh
t
% Fines in Dry Solids by WeightCoarse Solids
(Sand)(>44µm)
FineSolids
(<44µm)
Water

Technical Guide
forFluid Fine Tailings Management
Section 2: Tailings Deposit Design Fundamentals
August 30, 2012 Page 2-7
The diagram is best described by Charles and Charles3, as follows.
The apices of the triangle represent 100% by weight water (top), coarse solids (bottom left), and fines (bottom right) respectively. Points in the triangle represent a three-component suspension. Points along the axis line connecting the 100% water and fines apices represent mixtures of fines and water only. Straight lines drawn from this line to the 100% coarse apex represent suspensions in which the ratio of FOFW is constant (magenta-coloured lines in Figure 2-4). Straight lines drawn from the sand and fines axis to the 100% water apex (blue-coloured lines in Figure 2-4) represent constant geotechnical fines content (they also represent lines of constant SFR, although the SFR values are not shown on the graph). These lines represent slurries with constant particle size distributions but varying solids content. The horizontal lines in this diagram represent suspensions with constant solids content (and since water content = [1 – solids content], lines of constant water content as well).
Figure 2-4 Tailings General Properties Boundaries
Figure 2-4 represents the various slurry and soil property boundaries at different sand–fines–water contents, including slurry segregation boundaries and liquid and plastic limits. The exact location of these boundaries will vary somewhat, depending on the plasticity of the tailings and the method by which they have been treated.
3 Charles, M.E. and Charles, R.A. 1971. The use of heavy media in the pipeline transport of particulate solids.
Paper 12, Advances in Solid-Liquid Flow in Pipes and its Application. Edited by Iraj Zandi. Published by Pergamon Press. pp. 171–197.
5%
15%
25%
35%
45%
55%
65%
75%
85%
0%
10%
20%
30%
40%
50%
60%
70%
80%
90%
0% 10% 20% 30% 40% 50% 60% 70% 80% 90% 100%
% T
otal
Sol
ids
Con
ten
t b
y W
eigh
t
% Fines in Dry Solids by WeightFine
Solids(<44µm)
Coarse Solids(Sand)
(>44µm)
Water

Technical Guide for Fluid Fine Tailings Management
Section 2: Tailings Deposit Design Fundamentals
August 30, 2012 Page 2-8
The following subsections describe different areas into which the ternary diagram can be divided, describing different types of tailings behaviour.
2.3.2.1 Settling/Hindered Settling Boundary
The upper boundary in Figure 2-4 differentiates between the region of sedimentation, which plots to the left and above the line, and hindered settling, which plots below and to the right of the line. Sedimentation refers to the relatively rapid settling of solids from suspension at solids concentrations where the interaction between particles is small and has an insignificant impact on settling rates. The original work at the University of Alberta (Scott and Cymerman, 1993) located this boundary at the 15% FOFW line for oil sand tailings. However, this boundary is variable and depends on the depositional environment, and the size, density, surface properties, bitumen content, and mineralogy of the tailings.
2.3.2.2 Segregation Boundary
The existence of a segregation boundary has long been used in the fields of pipeline solids transport and thickened tailings disposal. Tests on Syncrude tailings have been conducted to locate this boundary at a FOFW of 30% (see Figure 2-4). Above this boundary, the coarse particles in the tailings will quickly, differentially settle and segregate from the fines and water. Below the boundary, the coarse particles will not segregate. The location of the segregation boundary is sensitive to the shear strain rate in the tailings.
The location of this line can be altered (typically, raised in the ternary diagram) by the addition of inorganic coagulants, carbon dioxide or flocculants to the tailings slurries. The addition of one of these chemicals has the effect of increasing the yield strength of the fines/water matrix, thereby better suspending the sand. The most studied of these chemical amendments is gypsum, which has been used to alter the boundary in the commercial production of composite tailings (CT).
Somewhere in the region of the segregation boundary, the physical densification process (at least for low SFR tailings) transitions from one primarily of hindered settlement to one primarily of consolidation and creep. This transition is not sharp nor necessarily coincident with the segregation boundary, but occurs over a range of solids contents.
2.3.2.3 Coarse Solids Matrix Boundary
A coarse solids matrix boundary has been established, as shown in Figure 2-4, to define the division between material whose behaviour is dominated by fines (i.e., where the sand grains are distributed throughout the fines but not in contact) and a material whose behaviour is dominated by sand (i.e., where sand grains come into contact with each other). This boundary has also been described as the constant sand void ratio line or the sand skeletal void ratio boundary. At this boundary, the sand structure is at its maximum void ratio (i.e. its loosest state), while still having grain-to-grain contact.

Technical Guide
forFluid Fine Tailings Management
Section 2: Tailings Deposit Design Fundamentals
August 30, 2012 Page 2-9
2.3.2.4 Liquid Limit, Plastic Limit and Shrinkage Limit Boundaries
These boundaries have been defined at geotechnical water contents where the soil behaviour changes (see Definitions). As the water content decreases, the state of the slurry changes from a viscous liquid to a plastic solid (at the liquid-limit boundary), and then to a brittle solid (at the plastic limit boundary). The shrinkage limit is the water content where further loss of moisture will not result in any further volume reduction.
These limits are primarily affected by the properties of the fines in the tailings and thus approximately parallel lines of constant FOFW, at least in the zone where the tailings are defined as being fines-dominated (i.e., to the right of the coarse solids matrix boundary).
At the liquid limit, the soil has remolded, undrained shear strength of 1 to 2 kPa, and at the plastic limit, about 100 kPa. These boundaries are highly sensitive to mineralogy and pore water chemistry.
2.3.3 Current Process Methods
Five process methods are currently being used to accelerate the release of water from fine tailings:
1. The first method uses flocculation and processing of FFT through a solid-bowl scroll centrifuge. Adding a coagulant such as gypsum can also assist the process. Solids contents of about 55% are produced in the centrifuge “cake.” The cake is deposited in relatively thin lifts of about 2t/m2-y in cells, in a manner similar to the handling of soft, wet overburden soils. Left for a winter freeze-thaw cycle, the cake will attain a peak shear strength of 5 kPa to 10 kPa, before an additional lift is placed.
Alternatively, the cake is continuously deposited, at higher annual rates per area, into deep, in-pit deposits, relying on self-weight consolidation to effect further water release and volume reduction.
2. The second method employs in-line flocculation of FFT and discharge of the flocculated slurry in thin lifts into cells, where initial dewatering, effected by the flocculation and drainage, can increase the solids content to around 60%. Further water removal is accomplished via evaporation and freeze-thaw effects.
The volumes associated with oil sands mining and the low net evaporation rates in northern Alberta result in large area requirements to meet dewatering targets for reclamation. The dewatered material can be relocated to overburden cells after initial dewatering (similar to centrifuge cake), or alternatively, allowed to dewater further with evaporation or freeze-thaw to a point where it has sufficient strength to form an integral part of a disposal structure.
3. The third method is to form deep deposits of in-line flocculated FFT (e.g., in a large in-pit cell). Water expressed from the deposit and precipitation is decanted from the surface. Surface dewatering can be assisted by rim-ditching the perimeter of the deposit or creating channels on the surface to direct water to a decant sump. Self-weight consolidation progressively increases the solids content of the deposit, driving water upward through the deposits (or both upward and downward if there is bottom drainage).

Technical Guide for Fluid Fine Tailings Management
Section 2: Tailings Deposit Design Fundamentals
August 30, 2012 Page 2-10
4. A fourth method is to draw FFT directly from the extraction process (e.g., cyclone overflow), and flocculate and thicken them in a mechanical thickener. Thickening is generally employed to recover energy but also has the benefit of partially dewatering the FFT, producing TT. The TT can be placed in deep deposits, relying on consolidation for dewatering. Alternatively, it could be discharged in thin lifts, in a similar manner to that described in Item 2) above.
An additional use of the thickening process is to densify froth treatment tailings.
5. The fifth method involves blending sand slurry (typically at high solids content) with FFT, using flocculants or coagulants to attain a non-segregating mix. The material is then discharged into a deep deposit. Where the fines are sourced as MFT, the resulting product is referred to as CT. Alternatively, where fines are sourced as TT, the resulting product is referred to as NST. The key objective of both methods is to reduce the water content and produce a sand-dominated mix, at a moderately high SFR. This results in a relatively quick volume reduction and increase in deposit strength (compared to lower SFR tailings deposits).
2.3.4 Development of Settlement and Deposit Strength
Deposits designed for terrestrial reclamation must achieve sufficient water release (and therefore volume reduction) so that residual settlement following closure is sufficiently low to not disrupt the surface drainage of the landform. In addition, deposit strength must support surface access and reclamation. As water is released and solids content increases, the deposit strength increases, passing through the liquid limit and plastic limit as described previously.
Where environmental effects (evaporation and freeze-thaw) are the predominant mechanisms for water removal, early strength attainment is critical. Early, low-level strength values in the range of 1 kPa to 5 kPa are indicative of exceeding the liquid limit and show dewatering progress. However, such low-level strengths are not sufficient for construction-grade material for free-standing deposits. Reaching the liquid limit should not be misconstrued as an end goal, in and of itself, as that would encourage the use of early strength enhancement with additives that may not contribute to further dewatering through consolidation – or worse, may impede consolidation.
Technical Guide
forFluid Fine Tailings Management
Section 2: Tailings Deposit Design Fundamentals
August 30, 2012 Page 2-11
Drainage is Predominantly Upward
Consolidating tailings
Sand & soil cap
Figure 2-5 Deep Deposit Consolidation
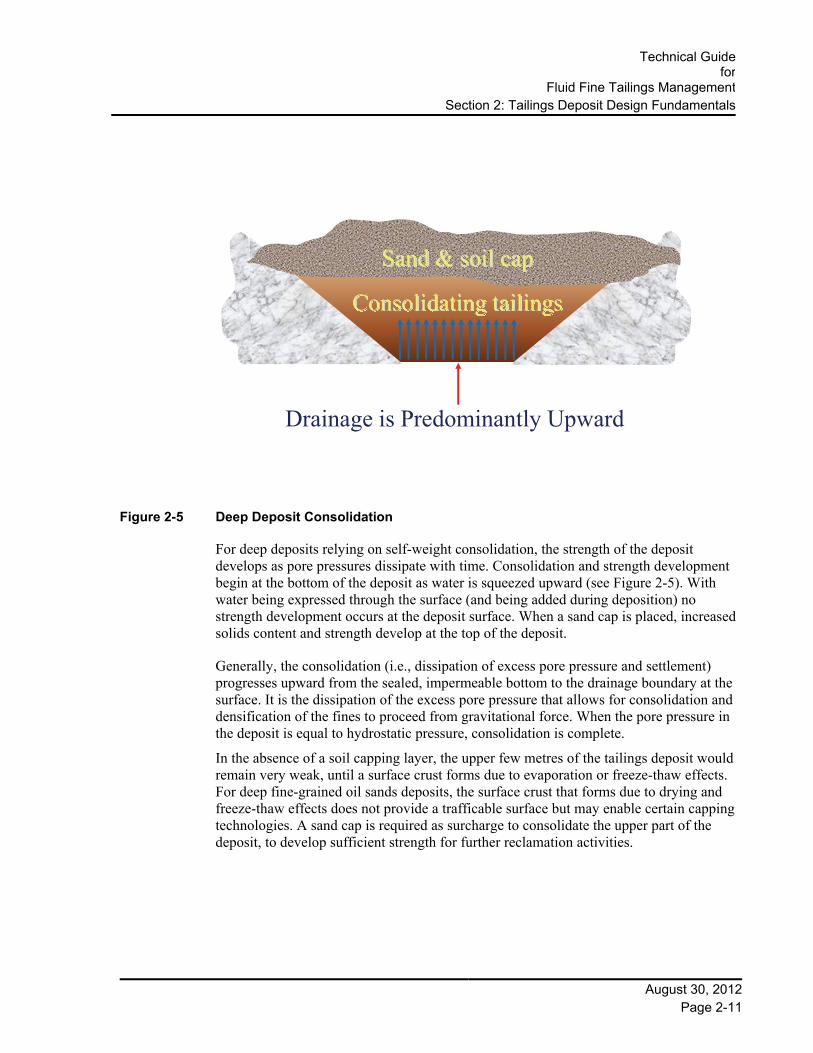
For deep deposits relying on self-weight consolidation, the strength of the deposit develops as pore pressures dissipate with time. Consolidation and strength development begin at the bottom of the deposit as water is squeezed upward (see Figure 2-5). With water being expressed through the surface (and being added during deposition) no strength development occurs at the deposit surface. When a sand cap is placed, increased solids content and strength develop at the top of the deposit.
Generally, the consolidation (i.e., dissipation of excess pore pressure and settlement) progresses upward from the sealed, impermeable bottom to the drainage boundary at the surface. It is the dissipation of the excess pore pressure that allows for consolidation and densification of the fines to proceed from gravitational force. When the pore pressure in the deposit is equal to hydrostatic pressure, consolidation is complete.
In the absence of a soil capping layer, the upper few metres of the tailings deposit would remain very weak, until a surface crust forms due to evaporation or freeze-thaw effects. For deep fine-grained oil sands deposits, the surface crust that forms due to drying and freeze-thaw effects does not provide a trafficable surface but may enable certain capping technologies. A sand cap is required as surcharge to consolidate the upper part of the deposit, to develop sufficient strength for further reclamation activities.

Technical Guide for Fluid Fine Tailings Management
Section 2: Tailings Deposit Design Fundamentals
August 30, 2012 Page 2-12
2.4 Geotechnical Considerations for Containment
2.4.1 Objectives
While landscape design, aesthetics and timely re-vegetation are important elements of mine reclamation, the primary criteria in attaining geotechnical stability for all tailings deposits are:
To minimize post-closure settlement.
To maintain a stable closure landscape. This means limiting ground movements to levels similar to natural landscapes and avoiding catastrophic failures, which could be triggered by a seismic event or by extreme surface erosion.
To meet these criteria, diligence is required in the geotechnical design of disposal structures (discussed further below).
With the goal of achieving a reclaimed site that meets reclamation certification criteria and returning public lands to the province, it is important to distinguish between out-of-pit and in-pit deposits (see Figure 2-6). Where weak, clay-dominated materials are involved, below-grade disposal in the excavated mine pit is preferable to out-of-pit structures.
It is necessary, however, to permanently place some soft material in out-of-pit disposal areas, with the proportion governed by site conditions. In this situation, geotechnical design and improving the strength of these deposits (on a predictable trajectory) will be critical factors. Design of out-of-pit deposits must consider and avoid the potential for large-scale failures. Geotechnical integrity considerations for out-of-pit deposits include the following:
Providing acceptable margins of safety against gross failure through weak or liquefiable materials under anticipated maximum loads (including earthquake), and against excessive erosion caused by anticipated maximum hydrologic events, for reasonable return periods (e.g., 100 years)
Designing overburden and tailings disposal deposits to be sufficiently robust to experience soil movements typical of the surrounding landscape over very long time frames and more extreme loading or hydrologic conditions, without loss of essential function
Designing an erosion-resistant deposit, (e.g., capping first with a material such as sand capable of supporting a plant root zone then with a topsoil that will support vigorous plant growth)
Advancing consolidation of the deposit to the point where further surface subsidence (after closure) is manageable and there will not be large-scale differential settlement that could lead to disruption of the closure landscape (so that the landscape continues to function as intended).
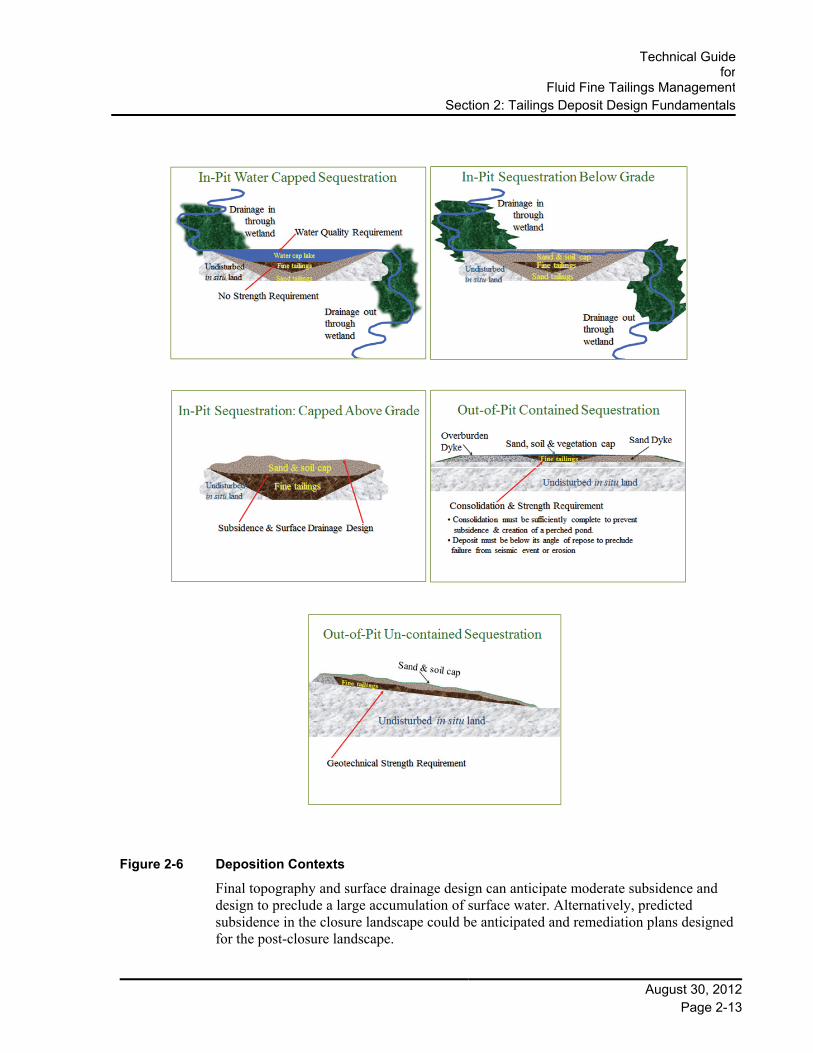
Technical Guide
forFluid Fine Tailings Management
Section 2: Tailings Deposit Design Fundamentals
August 30, 2012 Page 2-13
Figure 2-6 Deposition Contexts
Final topography and surface drainage design can anticipate moderate subsidence and design to preclude a large accumulation of surface water. Alternatively, predicted subsidence in the closure landscape could be anticipated and remediation plans designed for the post-closure landscape.
Technical Guide for Fluid Fine Tailings Management
Section 2: Tailings Deposit Design Fundamentals
August 30, 2012 Page 2-14
In-pit deposits below the original topography present fewer design constraints if the following factors are present:
Weak deposits are contained within a large, stable landmass, including an adequate undisturbed segment (or equivalent) adjacent to any natural water bodies
Surface of the deposit cap is at or below the original surrounding topography
If only the surface cap of the in-pit deposit is above grade, consideration of future subsidence to avoid a perched lake is similar to an out-of-pit deposit, except that any contained tailings would not be exposed to the risk of an uncontrolled release.
2.4.2 Potential Mine and Tailings Planning Conflicts
Maximizing in-pit sequestration of weak materials conflicts with the goal of implementing fines-dominated remediation methods early in the mining cycle. This trade-off requires determining the appropriate deferral period to allow for adequate working room to be developed in the active mine pit. Key mine and tailings planning considerations to achieve in-pit sequestration of fines include:
Employing sufficient out-of-pit disposal of overburden/interburden early in the mine life. This allows quicker opening of the pit floor for in-pit containment construction. Out-of-pit mine disposal areas are generally constructed of competent material to achieve geotechnical integrity.
Employing out-of-pit disposal of coarse tailings sand. This also achieves in-pit containment availability. Sand, constructed appropriately, has sufficient long-term geotechnical integrity to form a dry closure landscape.
Minimizing the volume of the in-pit structures required to create containment, by selecting the appropriate timing for in-pit disposal.
Strategic use of coarse sand tailings in-pit to construct containment for weak, fines-dominated deposits or fines-enriched sand deposits. This is especially important where suitable overburden and interburden material is not available in sufficient quantities to efficiently construct containment.
2.4.3 Capping Soft Deposits
A cohesive or fines-enriched sand deposit will normally be capped with a suitable material to:
Increase surface load to accelerate water removal from the deposit and shorten consolidation time (particularly for the upper portion of the deposit).
Provide a suitable subsoil composition in the event that the fines deposit contains dissolved-salt concentrations unsuitable for the root zone of surface vegetation (sand or a Pleistocene overburden material is generally used).
Create features (e.g., hummocks) and surface contours according to the surface drainage pattern designed for mine closure.

Technical Guide
forFluid Fine Tailings Management
Section 2: Tailings Deposit Design Fundamentals
August 30, 2012 Page 2-15
1 -2 kPa 25kPa - 75kPa
Soft Deposit Capping
Mobile Equipment
Trafficability
Sand-Dominated Deposits - acquire strength under
confined load (e.g., sand capping)
Cohesive deposits develop a crust (through environmental effects) sufficient to support a cap. Upper strength then
develops through additiona l consolidation
Once deposition in a DDA has been completed, water will continue to be expressed through the surface. Capping can start once deposit consolidation or surface crusting has advanced to the point where the cap can be safely placed without risk of failure (see Figure 2-7). The following are some considerations for the different types of deposits:
For fines-enriched sand deposits, this is a relatively rapid process and once near-surface solids contents are sufficient for capping, the capping load itself will generate surface strength. They are typically ready for initial capping efforts within a few months after the end of deposition.
For deep, fines-dominated deposits, after initial water release from the flocculation process is complete in a few weeks, self-weight consolidation is a more prolonged process. By keeping the surface drained, however, strength for capping is developed through desiccation from evaporation and freeze-thaw effects.
Soft deposits can be capped with existing technologies at 1 to 2 kPa. For these materials, it might be advantageous to use various mechanical methods to enhance environmental effects and assist surface strength development. Once a cap has been placed, consolidation of the upper zone proceeds with the benefit of the cap surcharge and in a few years provides access for reclamation equipment.
Figure 2-7 Capping Strength Requirements
In some cases, (e.g., with undesirable segregation of CT or NST), deposits with very low bearing strength and very slow consolidation times could be produced. These are not optimal, but there are still methods that can be used to cap them. An example is the use of “floating caps.” These are constructed by placing geotextiles and petroleum coke over the deposit surface while it is frozen. With thawing of the underlying FFT, the coke cap floats as long as it is kept dewatered, because it has a bulk density of less than water. Drainage of the underlying FFT is slightly enhanced by the cap and may be further enhanced by the placement of more capping material and/or the installation of vertical drains. This method of capping and promoting consolidation is very expensive and only identified as a possible mitigation measure in the event of poor DDA deposit performance.

Technical Guide for Fluid Fine Tailings Management
Section 2: Tailings Deposit Design Fundamentals
August 30, 2012 Page 2-16
2.5 Surface Reclamation – Soil and Vegetation
2.5.1 General Comments
Placement of a suitable depth of soil to support the intended, vegetated landform completes the reclamation cycle. Recent practice has favoured salvage and placement of natural upland forest soils, including the surface luvic, fulvic and humic (LFH) horizon, rather than a peat-mineral soil mix salvaged from muskeg areas.
Ideally, if this upland material can be sourced from current or recent overburden stripping, the material will contain sufficient native seed and root stock to support re-establishment of native vegetation on the reclaimed site. Salvaged coarse woody debris may also be applied to the reconstructed soil surface to provide micro-habitats for a number of plant, invertebrate and vertebrate species.
Ion concentrations in the DDA deposit and sand cap can influence the required depth of topsoil, appropriate timing for placement of soil and vegetation, and the timing for surface drainage to be released from the closure landscape to offsite water bodies.
Modelling the surface hydrology and ionic concentration decay in the upper soil zones and drainage pathways will provide guidance for monitoring the reclamation progression and success in the years following reclamation.
2.5.2 Life-Cycle Stages for Reclamation
In 2009, new definitions were introduced to track reclamation progress in the oil sands. The stages are:
Cleared Disturbed Ready for reclamation Soils placed Temporary reclamation Permanent reclamation Certified reclaimed.
For the purpose of this document, the first two stages are considered “operations” and include tailings deposition. The next two are considered “undergoing reclamation.” The final three are “Reclaimed.” Some overlap exists between the tailings management plan regulated by ERCB and the closure and reclamation plan regulated by Alberta Environment. This document focuses on the state of technology up to the point where soils are placed. Once soils are in place, regulations for closure and reclamation will ensure acceptable reclamation activities for terrestrial and wetland deposits. This document focuses on the operational period and bringing deposits to the “ready for reclamation” phase. It is not meant to address matters already dealt with by C&R plans.
Technical Guide
forFluid Fine Tailings Management
Section 2: Tailings Deposit Design Fundamentals
August 30, 2012 Page 2-17
2.6 Adaptive Management in Tailings Deposit Design The Adaptive Management approach supplements planning decisions to deal with uncertainties in the planning process for tailings facilities. Ongoing monitoring and field performance interpretation will help address uncertainties over the life of the structure and permit timely modifications to the plan, if warranted.
To use the approach, the tailings engineer must have a plan of action for unfavourable situations that could be discovered by observations during operation and reclamation of the structure (e.g., see last bullet of Section 2.4.4). The observations must be reliable, must reveal significant phenomena and must be reported so as to encourage prompt action.
Sections 3 through Section 6 describe application of the adaptive management approach to the different types of deposits that might be used for oil sands tailings. Site-specific application of the methods should be described and approved by the regulators in the facility design report. Results of the measurement program should be reported in the annual facility performance reports. Modifications to the design should be reported in updated tailings plans submitted for regulatory approval every five years, or whenever design changes substantially.

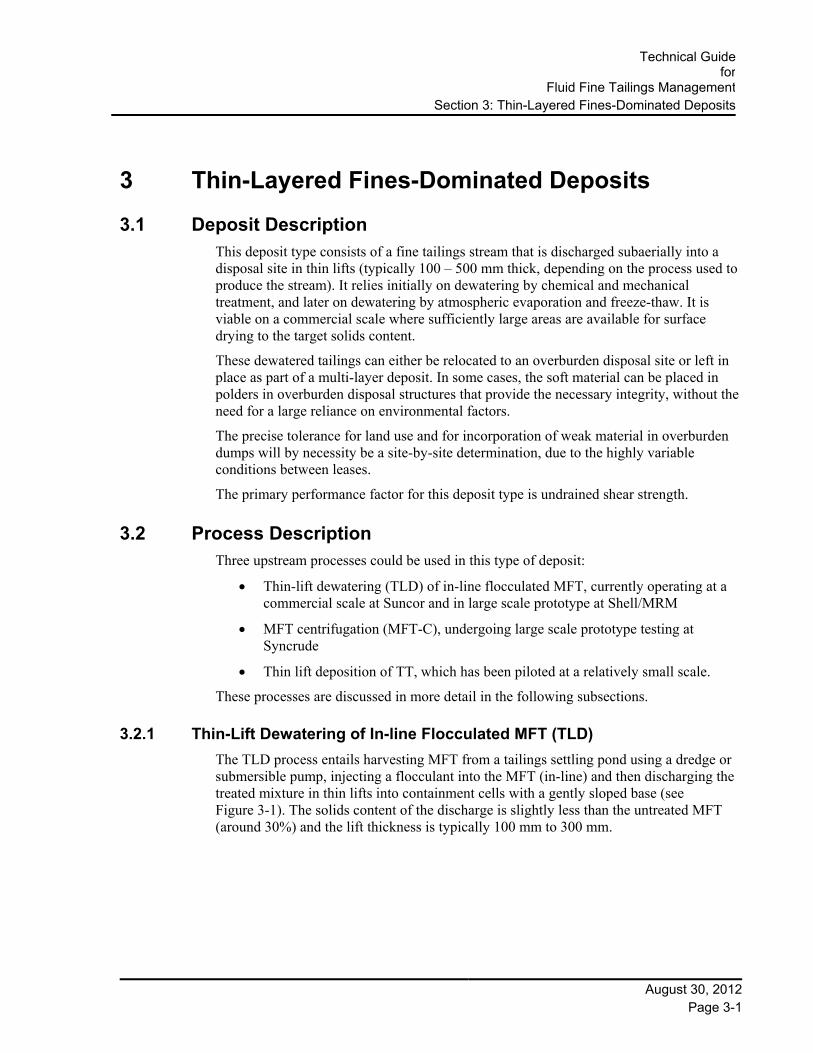
Technical Guide
forFluid Fine Tailings Management
Section 3: Thin-Layered Fines-Dominated Deposits
August 30, 2012 Page 3-1
3 Thin-Layered Fines-Dominated Deposits
3.1 Deposit Description This deposit type consists of a fine tailings stream that is discharged subaerially into a disposal site in thin lifts (typically 100 – 500 mm thick, depending on the process used to produce the stream). It relies initially on dewatering by chemical and mechanical treatment, and later on dewatering by atmospheric evaporation and freeze-thaw. It is viable on a commercial scale where sufficiently large areas are available for surface drying to the target solids content.
These dewatered tailings can either be relocated to an overburden disposal site or left in place as part of a multi-layer deposit. In some cases, the soft material can be placed in polders in overburden disposal structures that provide the necessary integrity, without the need for a large reliance on environmental factors.
The precise tolerance for land use and for incorporation of weak material in overburden dumps will by necessity be a site-by-site determination, due to the highly variable conditions between leases.
The primary performance factor for this deposit type is undrained shear strength.
3.2 Process Description Three upstream processes could be used in this type of deposit:
Thin-lift dewatering (TLD) of in-line flocculated MFT, currently operating at a commercial scale at Suncor and in large scale prototype at Shell/MRM
MFT centrifugation (MFT-C), undergoing large scale prototype testing at Syncrude
Thin lift deposition of TT, which has been piloted at a relatively small scale.
These processes are discussed in more detail in the following subsections.
3.2.1 Thin-Lift Dewatering of In-line Flocculated MFT (TLD)
The TLD process entails harvesting MFT from a tailings settling pond using a dredge or submersible pump, injecting a flocculant into the MFT (in-line) and then discharging the treated mixture in thin lifts into containment cells with a gently sloped base (see Figure 3-1). The solids content of the discharge is slightly less than the untreated MFT (around 30%) and the lift thickness is typically 100 mm to 300 mm.
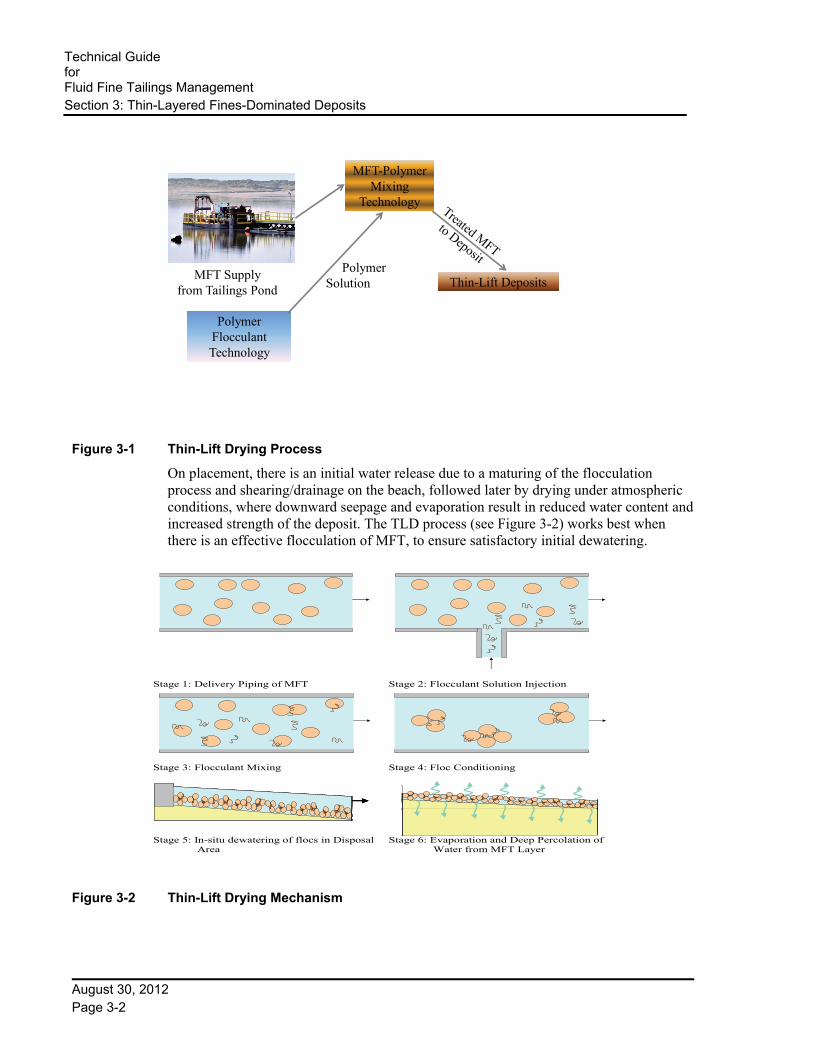
Technical Guide for Fluid Fine Tailings Management
Section 3: Thin-Layered Fines-Dominated Deposits
August 30, 2012 Page 3-2
MFT Supplyfrom Tailings Pond
Polymer FlocculantTechnology
Polymer Solution
MFT-Polymer Mixing
Technology
Thin-Lift Deposits
Figure 3-1 Thin-Lift Drying Process
On placement, there is an initial water release due to a maturing of the flocculation process and shearing/drainage on the beach, followed later by drying under atmospheric conditions, where downward seepage and evaporation result in reduced water content and increased strength of the deposit. The TLD process (see Figure 3-2) works best when there is an effective flocculation of MFT, to ensure satisfactory initial dewatering.
Figure 3-2 Thin-Lift Drying Mechanism
Stage 1: Delivery Piping of MFT
Stage 2: Flocculant Solution Injection
Stage 3: Flocculant Mixing
Stage 4: Floc Conditioning
Stage 5: In-situ dewatering of flocs in Disposal Area
Stage 6: Evaporation and Deep Percolation of Water from MFT Layer
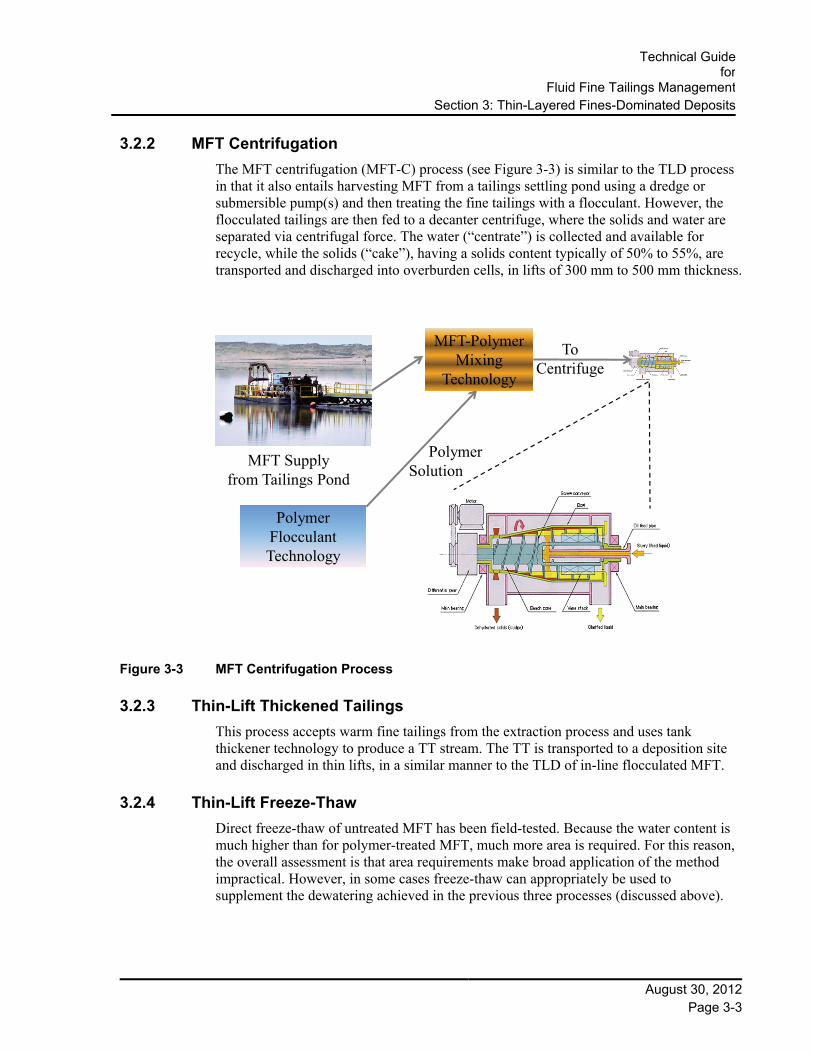
Technical Guide
forFluid Fine Tailings Management
Section 3: Thin-Layered Fines-Dominated Deposits
August 30, 2012 Page 3-3
3.2.2 MFT Centrifugation
The MFT centrifugation (MFT-C) process (see Figure 3-3) is similar to the TLD process in that it also entails harvesting MFT from a tailings settling pond using a dredge or submersible pump(s) and then treating the fine tailings with a flocculant. However, the flocculated tailings are then fed to a decanter centrifuge, where the solids and water are separated via centrifugal force. The water (“centrate”) is collected and available for recycle, while the solids (“cake”), having a solids content typically of 50% to 55%, are transported and discharged into overburden cells, in lifts of 300 mm to 500 mm thickness.
MFT Supplyfrom Tailings Pond
Polymer FlocculantTechnology
To Centrifuge
Polymer Solution
MFT-Polymer Mixing
Technology
Figure 3-3 MFT Centrifugation Process
3.2.3 Thin-Lift Thickened Tailings
This process accepts warm fine tailings from the extraction process and uses tank thickener technology to produce a TT stream. The TT is transported to a deposition site and discharged in thin lifts, in a similar manner to the TLD of in-line flocculated MFT.
3.2.4 Thin-Lift Freeze-Thaw
Direct freeze-thaw of untreated MFT has been field-tested. Because the water content is much higher than for polymer-treated MFT, much more area is required. For this reason, the overall assessment is that area requirements make broad application of the method impractical. However, in some cases freeze-thaw can appropriately be used to supplement the dewatering achieved in the previous three processes (discussed above).
Technical Guide for Fluid Fine Tailings Management
Section 3: Thin-Layered Fines-Dominated Deposits
August 30, 2012 Page 3-4
3.3 State of Technology Many similarities exist between the deposits created by the three processes currently used or under consideration for thin-lift-fines-dominated materials. Nevertheless, the state of technology for each is described separately in the following subsections.
3.3.1 Thin-Lift Dewatering
TLD is in commercial operation at Suncor, as the main part of their tailings reduction operations (TRO) and in large-scale demonstration at the Shell Muskeg River Mine – atmospheric fines drying (AFD).
Polymer science provides an important basis for optimizing flocculation in the TLD process. While lab testing has consistently indicated an optimum flocculant from polymers that are currently commercially available, research into new and improved flocculants is ongoing.
Considerable effort has also focused on optimizing the process for injection and mixing polymers with the MFT. Both computational fluid dynamics and experimental methods have been employed. Study results have been shared among operators through the OSTC, and significant improvements have resulted.
Intense field effort is also underway on identifying more efficient methods of cell preparation (e.g., designing cells that take maximum advantage of existing topography) and more effective methods to discharge treated tailings into cells (e.g., using of alternate discharge technologies).
Another important area of research and development is the science associated with drying soils. The problem is quite complex, involving coupled heat and moisture flows along with volume-change behaviour. Current modelling provides insight into the variables governing drying rates, but does not model important phenomena like cracking and is difficult to extend to two and three dimensions.
Parallel work in the field is focused on techniques to optimize spreading and enhance drying. Disturbing material too early in the process could damage the flocculated structure and slow both the initial drainage and the later drying process. However, at some point, breaking up the crust of the material and providing drainage to channel precipitation off the deposit both help to optimize drying rates.
Thus, although this process has been intensely studied, and deployed or planned at very large scale, the technology is not free of risk or uncertainty. Remaining significant challenges include:
Identifying and optimizing design of the flocculant addition, mixing, slurry delivery and distribution systems.
Managing the complex balance between the shear environment required for thorough mixing of flocculant solution into the thick MFT suspension and the very different shear environment required for aggregate growth while maintaining aggregate integrity.
Understanding and quantifying feed variability in real-time and applying process control.

Technical Guide
forFluid Fine Tailings Management
Section 3: Thin-Layered Fines-Dominated Deposits
August 30, 2012 Page 3-5
Addressing significant real-time operator-control challenges resulting from inherent variability of particle size and mineralogy of the clay fines comprising the FFT, which directly affects flocculant dose requirements and also the rheology of the suspensions after treatment.
Achieving optimized base conditions (deposition area geometry) that allow for maximum spreading and robust operation of the TLD applications.
Controlling complex interactions between the rheology of the flocculated fines, initial dewatering, geometry of the deposit base and working of the deposit to enhance dewatering.
Considering weather and seasonal impacts on timing and planning.
Addressing these issues is an integral part of the adaptive management approach. Knowledge gained through development and deployment will feed into continuous improvement in design and management of these types of deposits.
3.3.2 Centrifugation
Centrifugation has been demonstrated with commercial-scale machines and test deposits at Syncrude, with current plans for a commercial scale prototype demonstration this year (2012) and a staged commercial deployment over the next few years. The research and development programs began with laboratory bench-scale tests and evolved into field trials of increasing size and scope in each of 2007 and 2008. Syncrude completed their largest-scale field test to date between August and October 2010, producing over 10,000 m3 of centrifuge dewatered FFT (cake).
Key issues under study include:
The right combination of flocculants and coagulants that will optimize centrifuge throughput and drying behaviour after deposition.
The combinations of lift thickness and placement rate that will optimize drying rate.
The solids content that can be achieved through evaporation and freeze-thaw effects, and the cumulative effects of subsequent lifts.
The flow characteristics and deposit slopes of centrifuge cake.
Optimization of mechanical methods for promoting drying, such as “mud-farming” to break up surface crusts.
3.3.3 Thin-Lift TT
Thin-lift deposition of TT was tested at a pilot-scale at Shell in 2009. The test work indicated that subaerial deposition was beneficial in reducing the propensity for segregation. The test deposits showed minimal segregation and an increase in solids content over several days, due primarily to water runoff. Larger-scale testing is required to validate pilot observations. This would include establishing the degree of segregation and tolerance for the variable sand-to-fines ratio (SFR) that would be expected in a large commercial setting. In addition, the benefit of potential end-of-pipe chemical amendments to reduce segregation should be investigated.
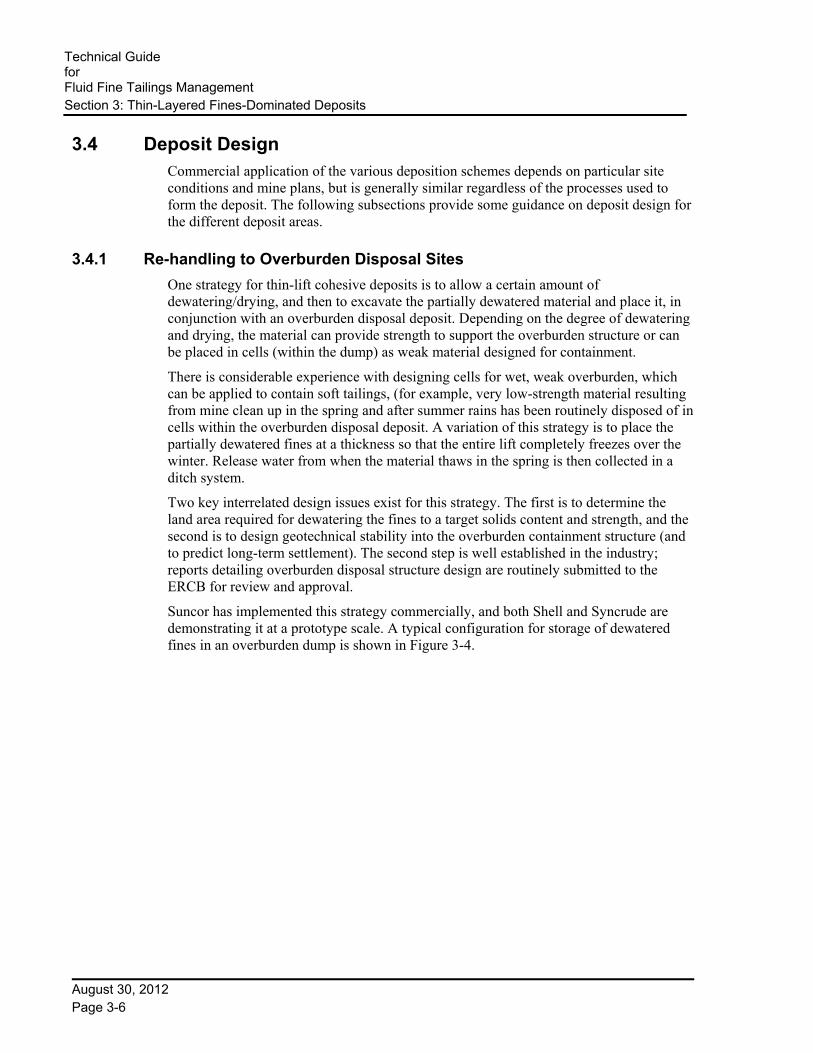
Technical Guide for Fluid Fine Tailings Management
Section 3: Thin-Layered Fines-Dominated Deposits
August 30, 2012 Page 3-6
3.4 Deposit Design Commercial application of the various deposition schemes depends on particular site conditions and mine plans, but is generally similar regardless of the processes used to form the deposit. The following subsections provide some guidance on deposit design for the different deposit areas.
3.4.1 Re-handling to Overburden Disposal Sites
One strategy for thin-lift cohesive deposits is to allow a certain amount of dewatering/drying, and then to excavate the partially dewatered material and place it, in conjunction with an overburden disposal deposit. Depending on the degree of dewatering and drying, the material can provide strength to support the overburden structure or can be placed in cells (within the dump) as weak material designed for containment.
There is considerable experience with designing cells for wet, weak overburden, which can be applied to contain soft tailings, (for example, very low-strength material resulting from mine clean up in the spring and after summer rains has been routinely disposed of in cells within the overburden disposal deposit. A variation of this strategy is to place the partially dewatered fines at a thickness so that the entire lift completely freezes over the winter. Release water from when the material thaws in the spring is then collected in a ditch system.
Two key interrelated design issues exist for this strategy. The first is to determine the land area required for dewatering the fines to a target solids content and strength, and the second is to design geotechnical stability into the overburden containment structure (and to predict long-term settlement). The second step is well established in the industry; reports detailing overburden disposal structure design are routinely submitted to the ERCB for review and approval.
Suncor has implemented this strategy commercially, and both Shell and Syncrude are demonstrating it at a prototype scale. A typical configuration for storage of dewatered fines in an overburden dump is shown in Figure 3-4.
Technical Guide
forFluid Fine Tailings Management
Section 3: Thin-Layered Fines-Dominated Deposits
August 30, 2012 Page 3-7
Ribs for Truck Access
Overburden Cap
Outer Shell
Soft Deposit
Figure 3-4 Typical Overburden Poldering Operation for MFT-C
3.4.2 Multiple Layering in Place
Multiple layering of dewatered fines has the following requirements which are peculiar to this type of deposit:
The DDA design must address foundation strength and long-term surface drainage control.
The berms must be designed with an appropriate configuration to contain the ultimate height of the facility.
In addition, the land area required for the initial dewatering/drying varies depending on the strength required for the disposal structural stability and the effectiveness of the drying process, but in any case is significant. Current experience indicates that 1.5 t/m2-y to 2 t/m2-y (of solids) can be dewatered when very little strength is required for the dewatered fines (such as might apply for the “re-handling” scenario discussed previously). However, if construction-quality material is required, about 0.5 t/m2-y to 1 t/m2-y can typically be dewatered, which implies 2 to 3 times the area required for multi-layered deposits compared to facilities where the dewatered fines are to be re-handled and placed in overburden disposal deposits. In addition to the area required for drying, a significant area is used for accommodating berms, roads and ditches.

Technical Guide for Fluid Fine Tailings Management
Section 3: Thin-Layered Fines-Dominated Deposits
August 30, 2012 Page 3-8
3.5 Measuring, Monitoring and Reporting The primary performance indicator for either type of deposit (discussed in the previous section) is undrained shear strength. This indicator is suitable to monitor and demonstrate an acceptable trajectory toward reclamation; related information would typically be collected during annual geotechnical investigations. Additional indicators might be required to support process control and other operational requirements such as mud-farming.
In regards to geotechnical stability, additional monitoring/performance indicators are slope movement (measured with inclinometers), pore pressure (measured with piezometers) and settlement (measured with normal survey techniques).
Appendix B should be consulted regarding methods for monitoring tailings deposits, and in the case of thin fines-dominated deposits, the discussion provided in Section B.5 and Section B.6.
3.6 Contingencies In the event that the deposits described do not perform according to plan, several design, operating and post-deposition contingencies are available or under development. The options currently available to operators are outlined further below (along with their current stage of development). In many cases, the contingencies are still in a research or development stage. Hence the need for an adaptive management plan, whereby new insights are continuously incorporated in future designs and applications.
If thin-lift-fines-dominated deposits do not achieve predicted performance, options that could be implemented, depending on the stage of the deposit and the deviations encountered, include:
During Operations:
Providing additional time for the deposit to achieve the desired strength.
Investigating alternative cell designs to improve deposit flow and water management.
Providing under-drainage to improve drying rate by constructing high-permeability base layers to assist in dewatering.
Increasing drying area and reducing lift thickness, to compensate for lower than expected drying rates.
Improving process control.
Using alternative chemical amendments.
Mechanical spreading to establish uniform, thin lifts.
Mud-farming – mechanically tilling deposits to maximize evaporation.
Using inter-layer, horizontal drains to enhance dewatering.
Including off-specification cells to contain and reprocess off-spec material as needed.

Technical Guide
forFluid Fine Tailings Management
Section 3: Thin-Layered Fines-Dominated Deposits
August 30, 2012 Page 3-9
During Reclamation:
Mud-farming to mechanically till deposits to maximize evaporation. Using horizontal drainage layers or vertical wick drains to enhance dewatering.
After Reclamation:
Overbuilding selected areas to account for expected settlement. Re-grading to facilitate drainage. Reconstructing erosion- and drainage-control features. Extending period of active management.
3.7 Characteristics of Thin-Lift Deposits Tables 3-1 and 3-2 provide some information on the dewatering area, containment, energy consumption and reclamation requirements for TLD deposits.
Table 3-1 TLD and Rehandling to Overburden
Cost ($)
Area Footprint Containment Requirement
Energy Intensity/GHG
Time to Capping/Reclamation
Very high Large None when deposited; but needed when
placed in overburden dumps.
High Rapid
Table 3-2 TLD and Layered In-Place
Cost ($)
Area Footprint Containment Requirement
Energy Intensity/GHG
Time to Capping/Reclamation
High Very large Compacted shell Medium Extended placement time; rapid when
complete

Technical Guide
forFluid Fine Tailings Management
Section 4: Deep Fines-Dominated (Cohesive) Deposits
August 30, 2012 Page 4-1
4 Deep Fines-Dominated (Cohesive) Deposits
4.1 Deposit Description This deposit type consists of a FFT stream that is discharged more or less on a continuous basis into a deep disposal site, which accumulates a significant thickness over time. The FFT can come from a variety of sources, as discussed in Section 4.2. The SFR of this material is typically below 24 and the fines are moderately to highly plastic.
Initial water release is accomplished with one of the polymer flocculant processes outlined later. The balance of water release/volume reduction occurs through self-weight consolidation and creep, (for very deep in-pit deposits, it might make sense to insert sand layers or geo-drains to enhance dewatering rates). Thus, the important performance factor is the increase in solids content (or volume reduction) with time.
Environmental effects (evaporation and freeze-thaw) play a minimal role in dewatering except for surface crust development when filling is complete. Once a sufficient crust has developed, the surface is capped, typically with sand, to provide both a load to assist the consolidation of the upper part of the deposit and a substrate for topsoil.
Deep fines-dominated deposits are generally favoured where in-pit area and volume are available. Less deep, out-of-pit deposits in a containment structure might be necessary for new mine start-up, or for example, could be attractive as polders in large out-of-pit sand storage areas. Deep fines-dominated deposits represent a very efficient land end-use with geotechnically secure containment.
Consolidation time for deep fines-dominated deposits is affected by a number of factors, the most important of which are the character of the material, the rate of deposition per area and the overall depth of the deposit. It requires considerable technical effort to predict consolidation rates for design and to monitor performance through the operations and reclamation cycle. Simply stated, the major goals are to predict the time-dependent capacity of a containment area, (to properly size the area to accommodate the anticipated volume of fines-dominated material), and to analyze the settlement rates under surcharge for reclamation needs.
4.2 Process Description
4.2.1 Thickened Tailings
The TT process is typically integrated in the extraction and tailings flow scheme (Figure 4-1). Tailings from the primary and secondary flotation circuits are cycloned to remove sand. The sand-depleted tailings stream is then fed into a thickener vessel with a polyacrylamide flocculant solution(s) to cluster the fines into flocs.
4 Materials with an SFR between 2 and 3 can be regarded as transitional between “fines-dominated” and
“fines-enriched sand.” They need to be considered on a case-by-case basis, depending on the specific material and deposit characteristics.
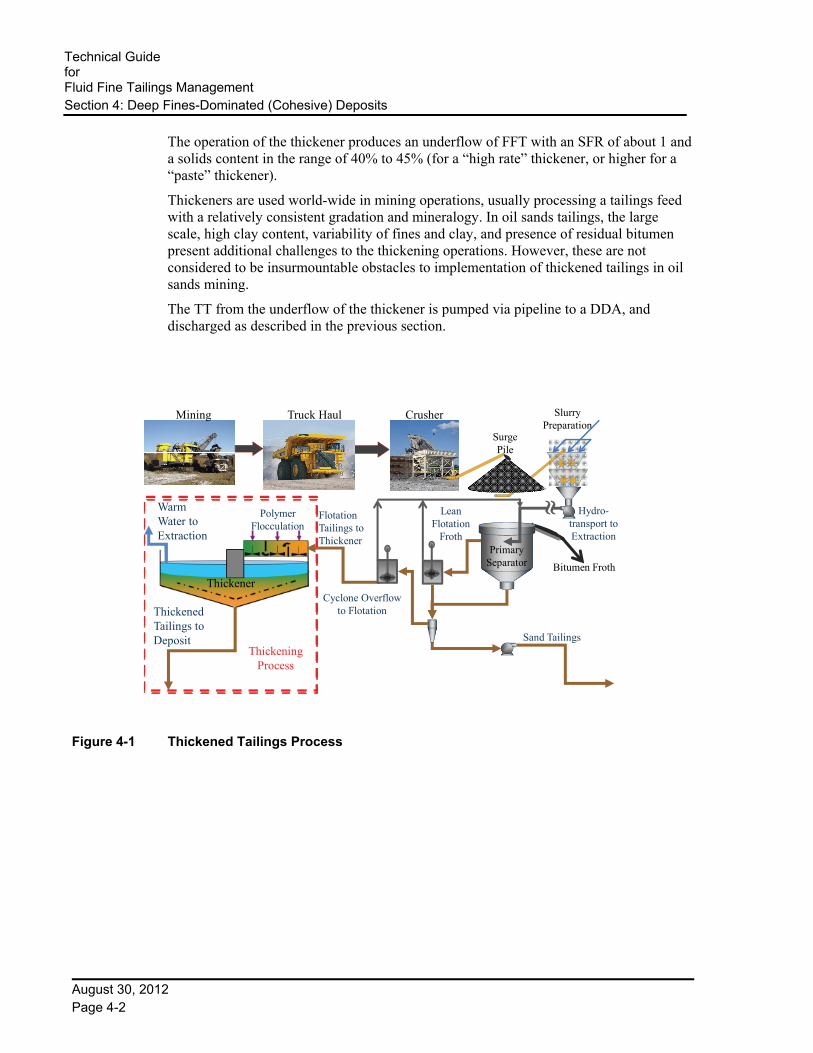
Technical Guide for Fluid Fine Tailings Management
Section 4: Deep Fines-Dominated (Cohesive) Deposits
August 30, 2012 Page 4-2
The operation of the thickener produces an underflow of FFT with an SFR of about 1 and a solids content in the range of 40% to 45% (for a “high rate” thickener, or higher for a “paste” thickener).
Thickeners are used world-wide in mining operations, usually processing a tailings feed with a relatively consistent gradation and mineralogy. In oil sands tailings, the large scale, high clay content, variability of fines and clay, and presence of residual bitumen present additional challenges to the thickening operations. However, these are not considered to be insurmountable obstacles to implementation of thickened tailings in oil sands mining.
The TT from the underflow of the thickener is pumped via pipeline to a DDA, and discharged as described in the previous section.
Thickened Tailings to Deposit
Warm Water to Extraction
Cyclone Overflow to Flotation
Flotation Tailings to Thickener
Polymer Flocculation
Slurry Preparation
Sand Tailings
Bitumen Froth
Lean Flotation
Froth
Surge Pile
Thickener
Primary Separator
Hydro-transport to Extraction
Mining Truck Haul Crusher
Thickening Process
Figure 4-1 Thickened Tailings Process

Technical Guide
forFluid Fine Tailings Management
Section 4: Deep Fines-Dominated (Cohesive) Deposits
August 30, 2012 Page 4-3
4.2.2 Accelerated Dewatering
Accelerated dewatering uses in-line flocculation of MFT followed by deposition in a deep containment area, as described in Section 4.1 (see Figure 4-2).
MFT Supplyfrom Tailings Pond
Polymer FlocculantTechnology
Polymer Solution
MFT-Polymer Mixing
Technology
Deep Cohesive Deposit
Figure 4-2 Accelerated Dewatering Process
This technology has been tested at a prototype scale at Syncrude. In the test deposit configuration, surface decantation of the deposit to remove expressed water and rain water occurs through a decant structure with a bottom drain to pump water away (see Figure 4-3). The decant structure has an adjustable weir height to minimize the depth of water on top of the deposit and provide drainage at the deposit surface. The surface rises during the fill period and subsides after fill completion, as dewatering continues.
In a large commercial deposit, other means of maintaining surface drainage, such as to a low point at a deposit perimeter, assisted by drainage ditches on the deposit surface, can be used to decant surface water.
After the initial fill and decantation, evaporation, freeze-thaw and rim-ditching accelerate consolidation to create a deposit surface of suitable density to support a cap and dry landscape reclamation or, alternatively, placement of a sand drainage layer followed by an additional deposit layer.

Technical Guide for Fluid Fine Tailings Management
Section 4: Deep Fines-Dominated (Cohesive) Deposits
August 30, 2012 Page 4-4
Figure 4-3 Accelerated Dewatering Pilot Test
4.2.3 MFT-C
MFT-C for discharge in a deep deposit is produced in the same manner as described for thin-lift deposits in Section 3.2.2 and as illustrated in Figure 3-3. The centrifuge cake is discharged at 50% to 55% solids content, while the centrate is relatively free of solids (at less than 1% solids content).
The centrifuge cake can be transported to the DDA by truck, conveyor or pipeline (using positive displacement pumping). Alternatively, with the ability to locate the centrifuge plant adjacent to the deposit (and make it mobile), a stacking boom conveyor could be used to discharge the MFT-C.
4.2.4 Froth Treatment Tailings
FTT represent a small but important segment of the fines currently placed in deep fines-dominated deposits. Further discussion is provided in Section 4.3.4.
4.3 State of Technology
4.3.1 Deep Deposits of Thickened Tailings
TT has the benefit of a reasonable amount of pilot information – a number of large in-ground columns, a field deposit (Cell B), and the 10-m deep in-ground thickener deposit, all located at Syncrude’s Aurora mine. There are also two significant in-cell deposits at Shell’s Muskeg River mine (Cell 1 and Cell 4).
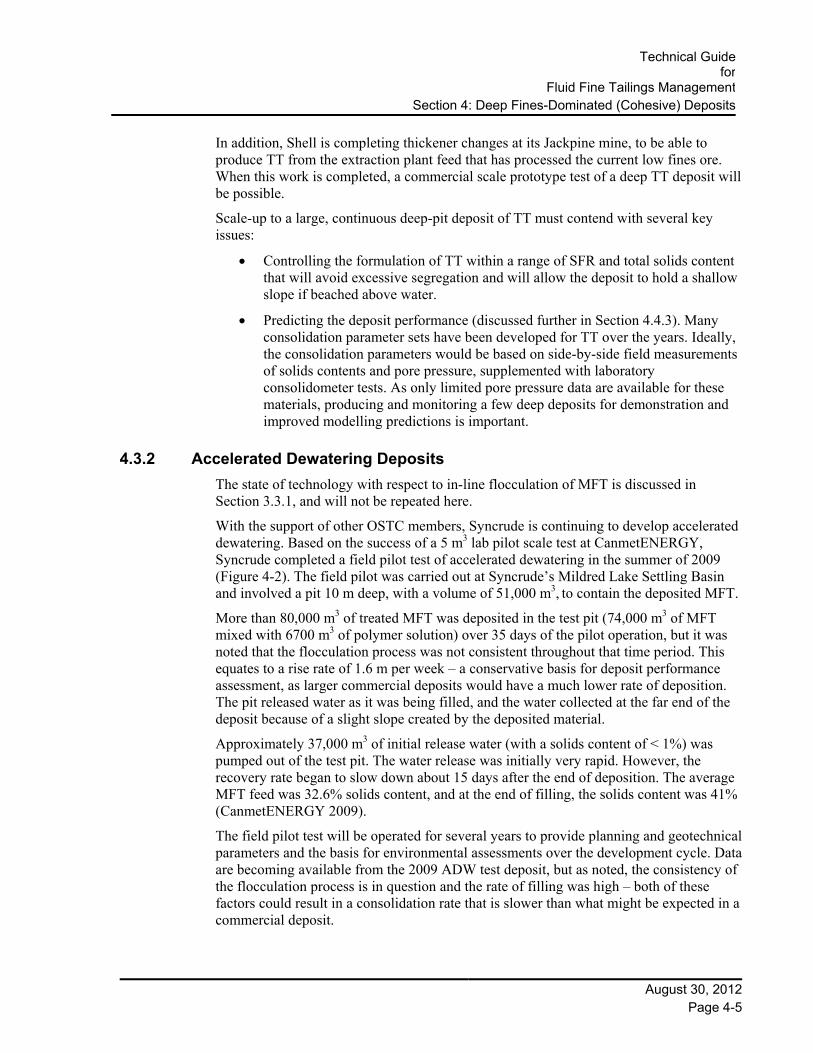
Technical Guide
forFluid Fine Tailings Management
Section 4: Deep Fines-Dominated (Cohesive) Deposits
August 30, 2012 Page 4-5
In addition, Shell is completing thickener changes at its Jackpine mine, to be able to produce TT from the extraction plant feed that has processed the current low fines ore. When this work is completed, a commercial scale prototype test of a deep TT deposit will be possible.
Scale-up to a large, continuous deep-pit deposit of TT must contend with several key issues:
Controlling the formulation of TT within a range of SFR and total solids content that will avoid excessive segregation and will allow the deposit to hold a shallow slope if beached above water.
Predicting the deposit performance (discussed further in Section 4.4.3). Many consolidation parameter sets have been developed for TT over the years. Ideally, the consolidation parameters would be based on side-by-side field measurements of solids contents and pore pressure, supplemented with laboratory consolidometer tests. As only limited pore pressure data are available for these materials, producing and monitoring a few deep deposits for demonstration and improved modelling predictions is important.
4.3.2 Accelerated Dewatering Deposits
The state of technology with respect to in-line flocculation of MFT is discussed in Section 3.3.1, and will not be repeated here.
With the support of other OSTC members, Syncrude is continuing to develop accelerated dewatering. Based on the success of a 5 m3 lab pilot scale test at CanmetENERGY, Syncrude completed a field pilot test of accelerated dewatering in the summer of 2009 (Figure 4-2). The field pilot was carried out at Syncrude’s Mildred Lake Settling Basin and involved a pit 10 m deep, with a volume of 51,000 m3, to contain the deposited MFT.
More than 80,000 m3 of treated MFT was deposited in the test pit (74,000 m3 of MFT mixed with 6700 m3 of polymer solution) over 35 days of the pilot operation, but it was noted that the flocculation process was not consistent throughout that time period. This equates to a rise rate of 1.6 m per week – a conservative basis for deposit performance assessment, as larger commercial deposits would have a much lower rate of deposition. The pit released water as it was being filled, and the water collected at the far end of the deposit because of a slight slope created by the deposited material.
Approximately 37,000 m3 of initial release water (with a solids content of < 1%) was pumped out of the test pit. The water release was initially very rapid. However, the recovery rate began to slow down about 15 days after the end of deposition. The average MFT feed was 32.6% solids content, and at the end of filling, the solids content was 41% (CanmetENERGY 2009).
The field pilot test will be operated for several years to provide planning and geotechnical parameters and the basis for environmental assessments over the development cycle. Data are becoming available from the 2009 ADW test deposit, but as noted, the consistency of the flocculation process is in question and the rate of filling was high – both of these factors could result in a consolidation rate that is slower than what might be expected in a commercial deposit.
Technical Guide for Fluid Fine Tailings Management
Section 4: Deep Fines-Dominated (Cohesive) Deposits
August 30, 2012 Page 4-6
As the next step in developing the technology, Syncrude plans to create a large-scale deposit of several million tonnes using improved polymer and mixing technologies, developed since the 2009 test, and a slower rate of deposition, more representative of a commercial operation.
4.3.3 Deep Deposits of MFT-C
The state of technology with respect to the actual centrifugation of MFT is discussed in Section 3.3.2, and will not be repeated here.
There is little data available for deep deposits of MFT-derived material from either the accelerated dewatering or centrifugation processes. This material represents a subset of fines with a lower SFR and greater clay content than TT. Therefore, at the same rates of deposition (t/m2-y) and total deposit depth, longer consolidation times can be expected for deep MFT-C deposits than for deep TT deposits.
Thus far, centrifuge deposits have been relatively thin and have experienced freeze-thaw effects. Syncrude is proposing to construct a deep deposit of MFT-C in the south part of its North Mine, which would produce better data on the performance of this type of deposit.
4.3.4 Deep Deposits of FTT
Managing this discrete (FTT) stream for thickening and deposition is being considered. One field trial has been completed at the Shell Muskeg River Mine, supported by other OSTC members. While it is premature to anticipate what important performance factors and criteria might best apply to such treatment, the OSTC considers this to be an important element in the portfolio of methods that warrants further development.
4.3.5 Current Practice for Predicting Settlement of Deep Deposits
Compression of deep, fines-dominated deposits is dependent on three main processes:
Individual grain settlement and/or “hindered” settlement Large-strain consolidation Creep.
As discussed previously, the first of these processes dominates the behaviour of low solids content FFT deposits (typical of initial run off from beached whole tailings). In regards to moderate solids content deposits (e.g., the deposits being considered in this section), either of the latter two processes might dominate the compression behaviour in any particular instance; their relative importance depends on the FFT gradation, mineralogy and starting solids content. To date, most analyses of field trial data have focussed on the consolidation behaviour, with no explicit quantification or inclusion of creep.
The software used to predict large strain settlement is in a similar state of ambiguity with respect to creep. Some of the software is limited to consolidation; other software attempts to include creep in an approximate manner.
Technical Guide
forFluid Fine Tailings Management
Section 4: Deep Fines-Dominated (Cohesive) Deposits
August 30, 2012 Page 4-7
Predictions using the latter, while potentially more “correct,” have not been undertaken on commercial scale deposits due to the aforementioned lack of explicit creep data from field testing.5
The current state of practice in predicting the compression and settlement of deep fines deposits is thus based on finite-strain consolidation only (discussed further in Appendix A). The theoretical basis for the modelling is not “perfect” and there are inherent inaccuracies in the results, but it is the best that can be done given the available information on FFT properties.
The finite strain models incorporate parameters on the compressibility and hydraulic conductivity of the deposited FFT, and these parameters are derived, as best as possible, from the back analysis of the field deposits discussed earlier in this section (4.3). As density increases in a FFT deposit, compressibility, hydraulic conductivity and the rate of water release all decline.
Another difficulty with oil sands deposits is that bitumen content can impede consolidation, causing it to depart from classic clay-property predictions. In addition, there are few deposits that are both deep and observed over many years. It is therefore necessary to extrapolate over many years of deposition and consolidation and over many metres of depth, using laboratory column data and a few deposits of a few metres depth. Changes in the measured parameters have a large impact on the predicted rate of consolidation, (this applies to both TT and accelerated dewatering).
For this reason, producing and monitoring a few deep deposits for demonstration and improved consolidation modelling predictions is important. It is also important to improve the process for treating the material and forming the deposits.
The risks arising from the aforementioned prediction uncertainty are often addressed through adaptive management by using observation (monitoring) results to adjust the design or operation as required. While there is uncertainty in the prediction of consolidation, the actual measurement of consolidation performance can be accomplished with a reasonable degree of accuracy.
4.3.6 Opportunities for Improvement
Improvements in the technologies for producing deep cohesive deposits are predominantly at the process end:
Better process control so deposited material is consistently on-spec (doesn’t segregate)
Increasing the amount of initial dewatering as deposits are formed
Modifying solids properties so that consolidation rates increase
Developing chemical solutions that assist these objectives.
5 Data are available on small-scale laboratory tests and attempts have been made to model the observed lab-scale behaviour using both consolidation and creep.
Technical Guide for Fluid Fine Tailings Management
Section 4: Deep Fines-Dominated (Cohesive) Deposits
August 30, 2012 Page 4-8
4.4 Deposit Design
4.4.1 Design Elements
The following elements are considered peculiar to, and important in, the design of a deep, fines-dominated deposit:
Containment design
The material balance – what goes into and out of the DDA over its operating life
The properties of the material delivered to the deposit
The deposit operation – placement of material, water removal, removal of off-spec material and segregated fines
The manner in which the completed and reclaimed DDA fits into the closure landscape
Capping, surface contouring for drainage, soil and vegetation planning consistent with land elements
Any observational and control period to meet reclamation objectives.
It is important to clearly identify the flexibility and contingencies included in the design, for example, the ability for containment volume to stay ahead of deposit growth.
The planning process would include the following:
The volume shrinkage against time associated with consolidation and its prediction accuracy are key input parameters to the mine/tailings planning process. The level of certainty in process performance and consolidation progression will guide the level of contingency needed for FFT containment volume in the DDA.
Operations performance will be used to update plans, taking advantage of more certain performance.
4.4.2 Deposit Capping, Consolidation and Surface Reclamation
As discussed in Section 2.4.4, cohesive deposits must be capped to complete consolidation of the upper part of the deposit. For cohesive deposits, the cap is supported with a desiccated surface crust. Once consolidation has advanced sufficiently, surface soil placement, final contouring and vegetation planting can begin.
Since cohesive deposits consolidate more slowly than sand-dominated deposits (particularly the last 1 to 2 m of subsidence), final landscape contours must account for a small amount of residual subsidence. An at-grade wetland landscape could be designed to tolerate a somewhat larger residual subsidence. For very large amounts of residual subsidence, a subaqueous deposit is more applicable (as described in Section 7).

Technical Guide
forFluid Fine Tailings Management
Section 4: Deep Fines-Dominated (Cohesive) Deposits
August 30, 2012 Page 4-9
4.4.3 Example of a Large Strain Consolidation Prediction
An example of a consolidation prediction for a deep, fines-dominated deposit is given in Figure 4-3. This figure shows deposit height and solids content with time for a 16 m deep deposit, filled at a rate of 0.825 t/m2-y of fines, an SFR of 0.8 and an initial solids content of 50%. A 5 m sand cap (or surcharge) is completed in the fifth year following deposit completion. The deposit is 90% consolidated 10 years after the surcharge.
These projections are based on parameters derived from Shell Cell 1 at the Muskeg River Mine. Predictions using Cell B at Syncrude’s Aurora North Mine yield similar results. Note that the peak undrained shear strength curves are not part of the consolidation prediction, but are derived from the solids concentrations. The figure is shown for illustrative purposes only and is not necessarily representative of any particular deposit.
In addition to characteristics of the material deposited, deposit consolidation is significantly influenced by total deposit depth and rate of deposition. In general, a deeper deposit with a higher rate of deposition will take longer to consolidate to the same point of residual deposit subsidence. Thus, reduction in consolidation time requires greater deposit area. Figure 4-4 summarizes the predicted consolidation times for a range of deposit depths and deposition rates, to attain a point of residual consolidation of 1.5 m, at which point final contouring for surface drainage and topsoil placement can begin.
Again, this figure is shown for illustrative purposes; predictions for any particular deposit would have to be made using properties and conditions specific to that deposit.
0
2
4
6
8
10
12
14
16
18
50 55 60 65 70 75 80 85
Dep
osit
dep
th (
m)
[exc
lud
ing
5m s
and
cap
]
Solids Content (%)
0
2
4
6
8
10
12
14
16
18
0 10 20 30 40 50 60
Dep
osit
Dep
th (
m)
Peak Undrained Shear Strength (kPa)
End of Fill 5 yrs after Fill(5 m sand cap)
10 years after Fill
15 years after Fill
Final height
13.25 m
Note: Filling Shell Cell 1 parameters 0.8255t/m2/y of fines at SFR 0.8, 35.7% solids content, 15 years fill to 16.2 m.
Figure 4-4 Example Consolidation Prediction
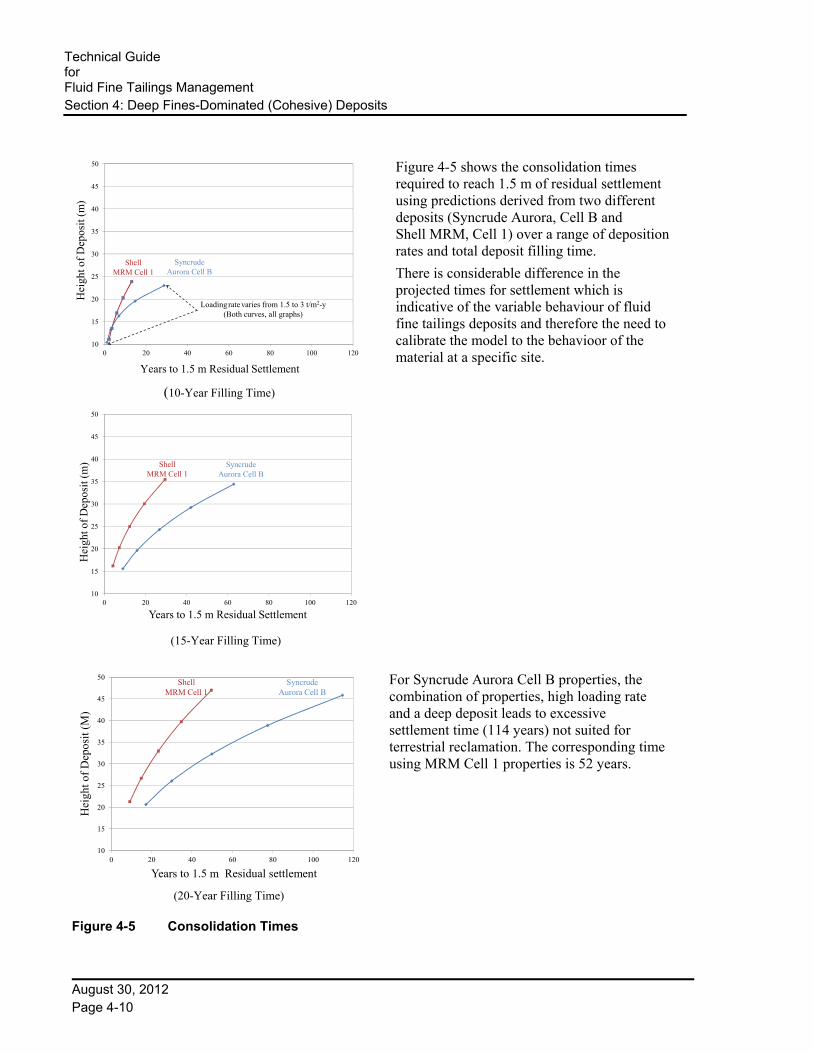
Technical Guide for Fluid Fine Tailings Management
Section 4: Deep Fines-Dominated (Cohesive) Deposits
August 30, 2012 Page 4-10
10
15
20
25
30
35
40
45
50
0 20 40 60 80 100 120
SyncrudeAurora Cell B
ShellMRM Cell 1
Years to 1.5 m Residual Settlement
Hei
ght o
f D
epos
it (
m)
Loadingratevaries from 1.5 to 3 t/m2-y(Both curves, all graphs)
(10-Year Filling Time)
10
15
20
25
30
35
40
45
50
0 20 40 60 80 100 120
Hei
ght o
f D
epos
it (
m)
Years to 1.5 m Residual Settlement
SyncrudeAurora Cell B
ShellMRM Cell 1
(15-Year Filling Time)
10
15
20
25
30
35
40
45
50
0 20 40 60 80 100 120
Hei
ght o
f D
epos
it (
M)
Years to 1.5 m Residual settlement
SyncrudeAurora Cell B
ShellMRM Cell 1
(20-Year Filling Time)
Figure 4-5 Consolidation Times
For Syncrude Aurora Cell B properties, the combination of properties, high loading rate and a deep deposit leads to excessive settlement time (114 years) not suited for terrestrial reclamation. The corresponding time using MRM Cell 1 properties is 52 years.
Figure 4-5 shows the consolidation times required to reach 1.5 m of residual settlement using predictions derived from two different deposits (Syncrude Aurora, Cell B and Shell MRM, Cell 1) over a range of deposition rates and total deposit filling time.
There is considerable difference in the projected times for settlement which is indicative of the variable behaviour of fluid fine tailings deposits and therefore the need to calibrate the model to the behavioor of the material at a specific site.

Technical Guide
forFluid Fine Tailings Management
Section 4: Deep Fines-Dominated (Cohesive) Deposits
August 30, 2012 Page 4-11
4.5 Measuring, Monitoring and Reporting The actual deposit performance is measured and compared to the predictions used for deposit design. The predicted performance would include a complete cycle of deposit behaviour from initial filling through capping and placement of reclamation.
The key factors in managing soft deposits that increase in solids content and reduce in volume over time are:
When will the deposit be reclaimable?
What are the measurements and triggers that indicate that the deposit performance is on-track or off-track?
Performance measurement includes:
A record of material delivered to the deposit compared with the model assumptions, including composition/properties and total mass of solids.
Deposit properties are also measured for each year of filling.
Measurement of solids content against deposit depth at the planned measurement points.
A number of samples would also be taken for analysis (Dean-Stark – OWS, particle size, methylene blue, Atterberg limits), to validate correlations between strength and consolidation.
Appendix B should be consulted regarding methods for monitoring tailings deposits, and in the case of deep fines-dominated deposits, the discussion provided in Sections B.2 through B.4 (and also Section B.5 respecting the secondary measurement of deposit strength).
Figure 4-6 shows how deposit monitoring would be compared to predicted performance and reported against plans. The measurement protocol includes the following:
Sufficient number of samples to determine solids content and other properties of interest.
Measured data plotted against the model-projected consolidation path, adjusted for differences in filling rate and composition.
Confirmation whether or not actual consolidation is above predicted minimum acceptable trajectory.
Deposit consolidation below minimum acceptable range would trigger regulatory review and adaptive management or contingency actions.
Consolidation advancement would be measured each year after deposit completion and then after capping, until consolidation had advanced to the point where surface reclamation can be accomplished.

Technical Guide for Fluid Fine Tailings Management
Section 4: Deep Fines-Dominated (Cohesive) Deposits
August 30, 2012 Page 4-12
Highest Predicted ConsolidationSlowest Predicted Consolidation
0
2
4
6
8
10
12
14
16
18
2050 60 70 80 90
Dep
osit
Dep
th (
m)
Solids Content (%)
UnacceptablePerformance
Range
AcceptablePerformance
Range
Figure 4-6 Performance Measures for Deep Cohesive Deposits
4.6 Contingencies Characteristic of deep cohesive deposits is the uncertainty over their precise rate of consolidation, volume reduction and strength attainment. Contingent measures can be applied at all stages, from planning and design through to reclamation.
4.6.1 Design Allowances
Design allowances are an integral part of risk management in the design process. They include basing design parameters on minimum expected performance. Key factors to limit the impact of consolidation underperformance include:
A conservative approach to available containment versus expected deposit volume.
Conservative prediction as to consolidation timing while being prepared to respond to faster than predicted consolidation, allowing for earlier capping and reclamation.
Considering methods for very deep in-pit deposits – e.g., placing intermediate sand layers (wick or other types of drains would be used to control pore pressure in the sand units).

Technical Guide
forFluid Fine Tailings Management
Section 4: Deep Fines-Dominated (Cohesive) Deposits
August 30, 2012 Page 4-13
4.6.2 Operating Contingencies
Should depositional performance fall short of expectations, the following measures can be considered:
Investing in process performance improvement through tighter control over the process to reduce variability and off-spec operations.
Reducing reliance on the method by reducing the rate of deposition or deposit interval depth.
Advancing other (likely more costly) methods of FFT management such as centrifugation and poldering within overburden.
4.6.3 Post-Deposition Contingencies
Should deposit consolidation fall substantially below expectations such that timelines are deemed unacceptable, remedial action could include:
Additional loading/surcharge by, for example, depositing additional tailings sand over the area to accelerate the rate of consolidation (the resulting landform profile changes would need to be assessed to ensure landscape design and surface hydrology integrity is maintained).
Adding wick drains to the deposit to accelerate water removal and the rate of consolidation.
4.7 Characteristics of Deep Fines-Dominated Deposits Table 4-1 to Table 4-3 provide information on the area, containment, energy consumption and reclamation requirements for deep, fines-dominated deposits.
Table 4-1 Centrifuge Cake
$ Cost Area Footprint Containment Requirement
Energy Intensity/ GHG
Time to Capping/Reclamation
High Small Low High Slow
Table 4-2 Accelerated Dewatering
$ Cost Area Footprint Containment Volume Energy Intensity/ GHG
Time to Capping/Reclamation
Medium Moderate Low Low Slow
Table 4-3 Thickened Tailings
$ Cost Area Footprint Containment Volume Energy Intensity/ GHG
Time to Capping/Reclamation
Medium (Energy
recovery)
Moderate Low Very Low (Energy recovery)
Slow

Technical Guide
forFluid Fine Tailings Management
Section 5: Fines-Enriched Sand
August 30, 2012 Page 5-1
5 Fines-Enriched Sand
Fines-enriched sand typically has an average SFR from about 3 to 5 (can be somewhat higher), a pipeline solids content ranging from 55% to 60%, and a solids content after deposition in excess of 70%. These deposits are typically formed using processes such as CT and NST that are intended to capture the fines within sand voids during deposition, thus managing the inventory of FFT with minimal re-handling. To form these deposits, adequate sand and containment is required. Coupling the process with bitumen production often leads to operational constraints that must be considered before selecting this type of deposit.
The deposit can be characterized by two primary metrics for assessing conformity of the operation with plan: consistency of sand to fines ratio and solids content trajectory in response to surcharge (e.g., additional CT layers or sand cap).
5.1 Deposit Description When initially deposited, fines enriched sand typically has a loose to compact density, and a relatively high hydraulic conductivity and low compressibility compared with fines-dominated materials. With an average SFR from 3 to 5, the material is in the range where short-term strength is typically governed by undrained behaviour, but the deposit will consolidate and gain strength relatively quickly under load.6
As this type of deposit is predominantly sand, it has a lower potential for storage of fines per unit volume than fines-dominated deposits. However, the overall deposit volume for fines enriched sand is less than for fines and sand in separate deposits as the fines-enriched deposit holds fines within the sand void space. Since all of the sand must be store somewhere, it makes sense to maximize capture of fines in the sand, as much as is possible given the various types of sand deposits that are needed.
The deposits will exhibit heterogeneity for the following reasons:
Some coarse layers might be inter-layered within the fines-enriched sand because of periods when the process is off-spec. The presence of coarse layers could result in a more well-drained deposit that consolidates faster than a uniform fines-enriched sand deposit.
6 In correspondence regarding CT performance, Morgenstern (2009) indicates that fines-enriched sand deposits,
when placed properly, are intended to behave like a granular deposit, but consolidate somewhat more slowly than clean sand. He observes that because granular deposits are frictional in behaviour, they would have zero strength at the surface. However, capping generates sufficient strength to facilitate equipment mobility and hence reclamation. Morgenstern goes on to state that both theory and practice indicates rapid consolidation when subjected to capping that facilitates mobility of fairly large equipment and reclaimability. The capping itself is commonly performed hydraulically and to be successful simply requires that the deposit end up in a drained state. He notes that all of this has been demonstrated in practice.
Technical Guide for Fluid Fine Tailings Management
Section 5: Fines-Enriched Sand
August 30, 2012 Page 5-2
Lenses of fines-dominated material might also exist in the deposit. These lenses develop when fines-enriched sand segregates on deposition (into sand and fines-dominated layers) and is subsequently covered by a non-segregated, more uniform fines-enriched sand. Isolated pockets of high fines material have been found to consolidate under the surcharge of the overlying CT. Excessive fines-dominated lenses could impede drainage and might be weaker than the fines-enriched sand. Contingencies must be established to avoid or deal with excessive quantities of fines-dominated materials.
Segregation during deposition could also result in fluid fines at the surface of the deposit; tailings management plans must include measures to manage this material.
Constraints related to site geography/geometry, placement timing, FFT space availability and large area required for hydraulic tailings deposition might require co-disposal of fines-enriched sand with other tailings materials. The tailings management plan must include measures to manage the impacts of co-disposal on deposit characteristics.
The key benefits of fines-enriched sand that allow for long-term management of fines in the tailings disposal facility include:
Storage of fines in the sand void space (which would otherwise require an additional storage volume elsewhere).
Relatively early and rapid densification and strength gain.
Deposit strength that allows hydraulic sand capping.
Consolidation settlement that is manageable with appropriate sand cap design.
5.2 Process Description CT is currently the commercial process used for forming fines-enriched sand tailings deposits. NST is a variation of CT where the fines are supplied from a thickener rather than MFT from a tailings settling pond. To understand the differences, it is necessary to first describe the fines balance that results from a CT operation.
CT is designed to contain an average of 20% fines (geotechnical fines content) at a solids content of about 60%. The “coarse tailings” stream used to produce CT is obtained by hydro-cycloning whole tailings from the extraction plant, which removes excess water (and some fines). The cyclone sand underflow, nominally at 68% solids content, is combined with MFT, nominally at 30% to 35% solids content, harvested from a tailings pond. A coagulant such as gypsum, carbon dioxide or alum is added to the blended stream to increase the fines-water viscosity, which better suspends the sand grains in the fines-water matrix and makes a non-segregating slurry.
The slurry is discharged into a containment area where it consolidates, releasing additional water to the surface. The discharge can be onto a subaerial beach or into deep water through a tremie diffuser. For either deposition method, the CT process results in rapid release of process-affected water, making it available for recycle to the extraction plant.
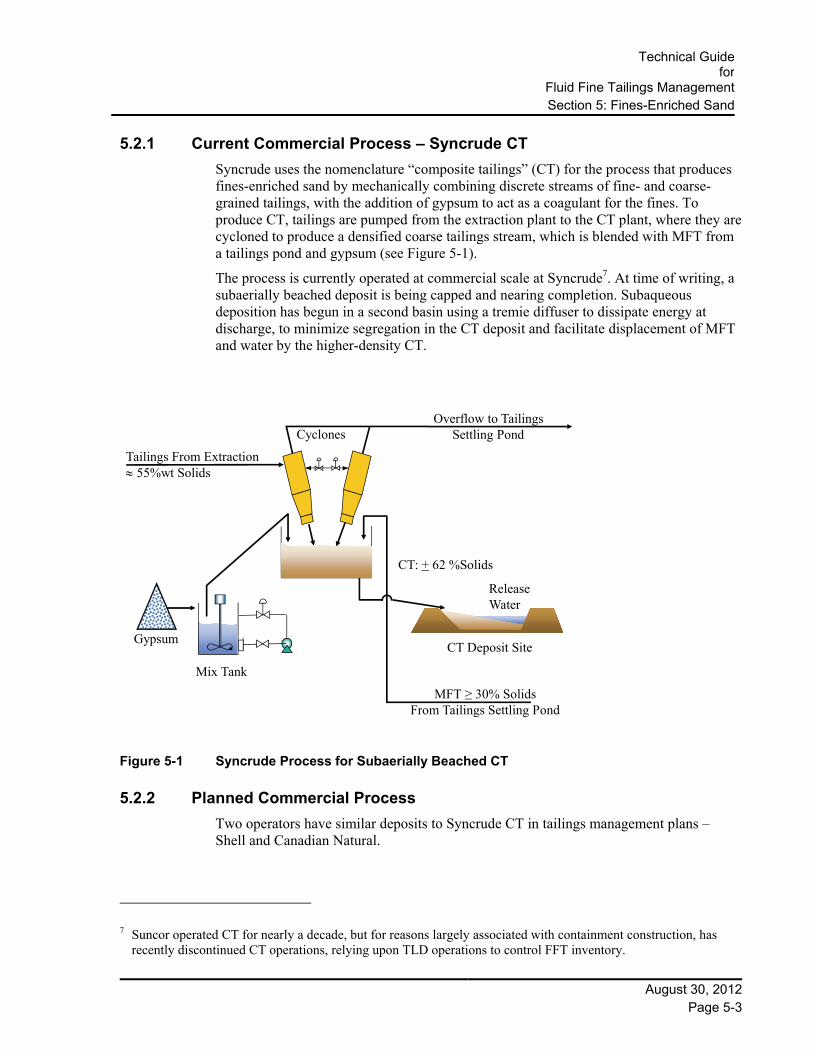
Technical Guide
forFluid Fine Tailings Management
Section 5: Fines-Enriched Sand
August 30, 2012 Page 5-3
5.2.1 Current Commercial Process – Syncrude CT
Syncrude uses the nomenclature “composite tailings” (CT) for the process that produces fines-enriched sand by mechanically combining discrete streams of fine- and coarse-grained tailings, with the addition of gypsum to act as a coagulant for the fines. To produce CT, tailings are pumped from the extraction plant to the CT plant, where they are cycloned to produce a densified coarse tailings stream, which is blended with MFT from a tailings pond and gypsum (see Figure 5-1).
The process is currently operated at commercial scale at Syncrude7. At time of writing, a subaerially beached deposit is being capped and nearing completion. Subaqueous deposition has begun in a second basin using a tremie diffuser to dissipate energy at discharge, to minimize segregation in the CT deposit and facilitate displacement of MFT and water by the higher-density CT.
MFT ≥ 30% SolidsFrom Tailings Settling Pond
Mix Tank
Gypsum
Release Water
CT Deposit Site
CT: + 62 %Solids
CyclonesOverflow to Tailings
Settling Pond
Tailings From Extraction 55%wt Solids
Figure 5-1 Syncrude Process for Subaerially Beached CT
5.2.2 Planned Commercial Process
Two operators have similar deposits to Syncrude CT in tailings management plans – Shell and Canadian Natural.
7 Suncor operated CT for nearly a decade, but for reasons largely associated with containment construction, has
recently discontinued CT operations, relying upon TLD operations to control FFT inventory.

Technical Guide for Fluid Fine Tailings Management
Section 5: Fines-Enriched Sand
August 30, 2012 Page 5-4
Shell CT and NST
This year (2012), Shell plans to implement CT at their Muskeg River Mine using fluid fines pumped from their external tailings storage facility. They also plan to produce NST (using thickener underflow for fines) in 2019 at the Muskeg River Mine, and in 2020 at the Jackpine Mine. The process flow for Shell’s CT is very similar to that used at Syncrude, except alum is currently planned as the coagulant. The coagulant selection process for NST is not yet complete.
Canadian Natural NST
Canadian Natural is constructing facilities to implement NST technology in 2015. The process produces a product very similar to CT. The key difference from CT is that cyclone underflow sand is combined with fines from the extraction operation thickened in a mechanical thickener, rather than MFT dredged from a settling pond (Figure 5-2). Canadian Natural plans to use CO2 as a coagulant.
TT from Thickener≥ 45% Solids
Release Water
NST Deposit
1st StageCyclones
Overflow to Flotation & Thickener
Tailings From Extraction 55%wt Solids
2nd StageCyclones
Alum or CO2
Figure 5-2 NST Using Two-Stage Cyclones
5.2.3 Potential Future Processes
Other methods to create a fines-enriched sand deposit include:
Using a paste thickener (rather than a high-rate thickener) as the source of a lower water content fines stream combined with coarse sand dewatered to lower moisture contents than achievable by cycloning. This process provides a higher solids content sand–fines blend than current CT mix designs; it was piloted at Shell using vibrating screens to dewater the sand.
Technical Guide
forFluid Fine Tailings Management
Section 5: Fines-Enriched Sand
August 30, 2012 Page 5-5
Dewatering sand in a cell and beaching area for recovery to CT operations. Besides providing lower-water-content sand, this would fully decouple CT operations from the extraction process (if the fines were also recovered from a tailings pond).
Flocculating whole tailings (or tailings spiked with additional fines) for beaching to avoid segregation of fines (and generation of FFT). While potentially effective in capturing more fines, this method a) reduces the drainage rate of the sand deposit, b) could affect planning and operation of the tailings facility, and c) may not be allowed where beaches need to form a structural portion of the containment dykes.
The Tailings Technology Deployment Roadmap Study provides an excellent review of these and other processes that might be advanced to commercial development to create fines-enriched deposits.
5.3 State of Technology
5.3.1 Production and Deposition
One of the most intense research and development efforts in oil sand tailings has been on making a tailings product that captures an optimal amount of fines and does not segregate upon discharge into a disposal area. The laboratory and pilot scale testing of CT showed a viable technology for increasing fines capture. After several field trials at Syncrude and Suncor, the industry thus adopted it in commercial operations, in 1997 at Suncor and 2000 at Syncrude.
Production issues were still encountered. The first challenge was to produce a CT that met a prescribed, robust recipe – variable coarse tailings feed density, bitumen content, and a reliable supply of chemical additive all posed challenges. It took operators several years to identify and implement process changes and controls, so that they could reliably produce a CT that met specifications.
The second challenge was to provide a sufficiently low energy environment when CT (or NST) was discharged to a DDA, so that it did not segregate under high shear stresses. Partial segregation of CT had been encountered in previous CT ponds. Deposition into deep water proved particularly challenging.
This issue continues to pose a challenge. Segregation in deep water is understood but does not have a simple solution, due to several challenges associated with winter tailings operations and optimal tremie operation from a floating platform (not always possible or desired). Oil sands operators are actively researching and developing improvements in the process and discharge techniques to solve this problem:
Increasing the density of the slurry to reduce shear-induced segregation.
Developing a tremie design that achieves low shear conditions to prevent excessive mixing with water or FFT.
Using a two-stage cyclone circuit, to reduce the conflict between optimizing operations for bitumen production versus CT production.

Technical Guide for Fluid Fine Tailings Management
Section 5: Fines-Enriched Sand
August 30, 2012 Page 5-6
5.3.2 Performance and Capping
Suncor Pond 5 provided early experience with CT deposit performance. CT was placed in the facility beginning in 1995. Many lessons regarding process control and deposition were learned during the operation. As a result, the tailings deposits were quite variable, with significant thicknesses of (segregated) FFT near the surface in some quadrants of the pond. Nevertheless, Suncor developed a method of capping this fluid material, to create a trafficable surface, by placing coke over geo-fabric in the winter (when the pond surface was frozen). This cap allowed access for reclamation activities, including installation of wick drains. While this approach is time-consuming and very expensive, it demonstrates that reclamation is achievable even under suboptimal conditions through adaptive management.
Another commercial experience with CT was Syncrude’s East In-Pit area, which occupies roughly 1150 ha (11.5 km2) and is situated immediately east of Highway 63, in the location of the former 60-m deep Syncrude East Mine. Deposition of tailings sand in this area started in 1999; CT deposition started in 2000. Co-deposition of both sand and CT continued until July 2011. A sand cap and a reclamation base have been successfully placed in the north part of this deposit, and further reclamation activities are underway.
5.3.3 Further Development
Milestones for further development of the technology include:
Assessment of results from the Syncrude operation with a tremie diffuser for deposition in the Southwest In-Pit Storage Facility, expected in 2012 – 2013.
Performance of the CT process at the Muskeg River Mine. Operational data is expected to be representative of ongoing operations by 2013. Deposit performance indicators measured in 2013 and 2014 are expected to provide a reasonable indication of conformance to plan.
Operation of the NST process at Horizon. Operational data is expected to be representative of ongoing operations by 2016. Deposit performance indicators measured in 2016 and 2017 are expected to provide a reasonable indication of conformance to plan.
Subaerial deposition of NST into an area dedicated to non-segregating tailings with a small fluid pond. Canadian Natural plans to maintain a relatively small pond in DDA2 when this in-pit facility begins operation by pumping fluids back to the external tailings facility. The facility is currently projected to begin operating in 2020. Initial performance indications for this facility are anticipated within 18 months of first placement.

Technical Guide
forFluid Fine Tailings Management
Section 5: Fines-Enriched Sand
August 30, 2012 Page 5-7
Despite the challenges with commercial CT operations and the potential and desirability for further optimization, development has now reached a state where CT is one of the methods in a portfolio of options available to operators for managing FFT. The primary challenge during operations is minimizing segregation and improvements are still possible, as discussed above. The range of characteristics and behaviour for CT deposits is predictable and can be measured in the field. Feasible mitigation strategies are available where design performance is not met. Therefore, plans developed using the adaptive management approach, are well-suited to these deposits, as discussed in Sections 5.4 and 5.6.
5.4 Deposit Design
5.4.1 Objectives and Steps
The contemplated reclamation landscape and the methods available to create that landscape are key determinants of the required properties of the underlying deposit. Design of fines-enriched sand deposits must consider the following four key objectives for successful reclamation:
The deposit has sufficient solids content so the cap, ridges, soil cover and vegetation can be deposited and constructed within the schedule for progressive reclamation.
Post-closure settlement is of manageable magnitude so that landforms are stable and drainage systems perform as planned, within tolerances.
The amount of tailings water expressed into the cover soil after capping and consolidation is not a material threat to vegetation.
Groundwater is suitable for plant growth after capping and a suitable period of flushing. The specific groundwater requirements will depend on species of vegetation required over a certain timeline. This is largely a matter of process water chemistry independent of deposit type.
The design of a fines-enriched sand deposit involves the following steps:
Developing a deposition plan Developing a capping plan Predicting and controlling the time-settlement-strength trajectory Planning for heterogeneity.
5.4.2 Deposition Plan
Developing a deposition plan must balance optimal tailings and recycle water pipeline layout with the requirements of the reclamation and closure plan. Deposition must support the final surface drainage plan. Ideally, the tailings discharge should be located so that distal regions coincide with planned wetlands.
Technical Guide for Fluid Fine Tailings Management
Section 5: Fines-Enriched Sand
August 30, 2012 Page 5-8
The next step in the design is to select target ranges for the SFR and the slurry density. The mix SFR is determined by factors such as the availability of sand, the SFR of the ore body, and any existing inventory of fluid fines on the lease. Higher SFRs consolidate and gain strength faster than lower SFRs, but obviously entrap fewer fines. The slurry density is chosen primarily based on pumping characteristics, but as discussed earlier, reducing segregation potential is becoming an important factor.
5.4.3 Deposit Capping
A base-case capping plan is then developed that is compatible with the predicted strength of the deposit and the proposed capping method. Fines-enriched sand deposits acquire their strength through confinement and surface load. Therefore, they have no strength right at the surface and capping must contend with gaining access to the surface to apply the load (usually sand) that will further dewater the upper layer. The base case for capping will typically be hydraulic placement, but pluviation from a barge (sand-raining) or mechanical placement are also options. Capping in winter takes advantage of the frozen strength of the tailings material.
5.4.4 Deposit Consolidation and Settlement
The time-volume change trajectory and the associated strength gain of the tailings deposit must be predicted and addressed, so that the reclaimed tailings meet closure plan require-ments. Prediction of settlement rates for fines-enriched sand tailings requires the use of large strain consolidation models, in a manner similar to that described for deep fines-dominated deposits in Section 4.3.5. However, the consolidation process and parameters are better understood for the fines-enriched sand deposits than for the fines-dominated deposits, with the result that predicted performance should have a higher degree of accuracy.
Pollock (1988) developed a suitable approach that is frequently applied for oil sands deposits and has been calibrated using the Syncrude commercial CT trial. Key input parameters for the model are tailings hydraulic conductivity and compressibility, which are stress-dependent. Published values are available in the literature, e.g., Liu et al. (1994) and Suthaker and Scott (1995). Laboratory measurement techniques to determine these parameters are understood by experienced practitioners. Required analysis conditions include solids loading rate, solids content and pond area rating curve.
If the base-case prediction does not meet reclamation plan targets, the planned behaviour of the deposit can be modified by adjusting the placement rate, the SFR, or both, or by layering the SFR in the deposit. Combining these conditions so that reclamation objectives are achieved establishes the design.
Once the base case is established, behaviour must be predicted for “reasonable worst-case” conditions. For fines-enriched sand, the primary unfavourable uncertainties involved in the prediction are the hydraulic conductivity of the material and the stratigraphy of the deposit. While the geotechnical community has gained considerable experience predicting and measuring permeability not only in oil sands deposits but worldwide, uncertainty remains because this parameter can vary over wide ranges. This must be accounted for by sensitivity analyses and through use of the adaptive management approach.

Technical Guide
forFluid Fine Tailings Management
Section 5: Fines-Enriched Sand
August 30, 2012 Page 5-9
As discussed, heterogeneity is unavoidable in fines-enriched sand deposits because of variations in ore feed and some degree of segregation. The design must consider the impacts of this variation. For example, a pumping system can be designed so that fluid fines are removed from the deposit and either treated using another dewatering method or placed in a settling pond for subsequent re-handling.
322
323
324
325
326
327
328
329
60 65 70 75 80 85
Ele
vati
on m
asl
Solids Content (%)
Field Data
Analysis results with lab data input
Analysis results using fieldcompressibility
Analysis results using fieldcompressibility and upper boundpermeability
322
323
324
325
326
327
328
329
0 5 10 15 20 25 30 35
Ele
vati
on m
asl
Excess pore Pressure (kPa)
Analysis results with lab data
Analysis results with fieldcompressibility
Analysis results with fieldpermeability and upper boundpermeabilityField Data
Figure 5-3 Predicted and Measured CT Solids Content and Pore Pressure
Technical Guide for Fluid Fine Tailings Management
Section 5: Fines-Enriched Sand
August 30, 2012 Page 5-10
To address the presence of layers with higher and lower SFR than average, key parameters such as hydraulic conductivity, compressibility and strength can be measured or estimated for materials representative of the full range of likely deposit conditions.
5.5 Measuring, Monitoring and Reporting The primary performance indicators are discussed in the next subsection, followed by a discussion of the lab and field tests that are required to support the monitoring program, important process monitoring, and other useful performance measurements. A more detailed discussion of various sampling, in situ testing and laboratory testing methods is found in Appendix B.
5.5.1 Primary Performance Indicators
The primary performance indicators for fines-enriched sand deposits are the SFR distribution after deposition and the trajectory of changing solids content in response to the surcharge of overlying layers or a sand cap:
The SFR distribution provides feedback on whether segregation is being controlled within plan limits. SFR is also strongly correlated to hydraulic conductivity and therefore drainage characteristics that influence strength and consolidation.
Consolidation modelling can be used to set targets for average solids contents and acceptable deviations. Measurement of the deposit solids content indicates progress of consolidation based on expected initial and final values.
5.5.2 Site Monitoring
In the tailings deposits, material parameters can be measured during annual pond investigation programs to provide an indication that the deposit characteristics are consistent with the design assumptions.
Sonic drilling will be required to recover undisturbed samples.
The key laboratory measurements required to support determination of the important performance indicators are:
Oil, water and solids (OWS) (Dean Stark)
Particle size distribution
Solids content
Pore-water chemistry (basic anions, cations, pH, electrical conductivity, alkalinity).
The key in situ measurements are:
Strength Pore pressure Deposit temperature.

Technical Guide
forFluid Fine Tailings Management
Section 5: Fines-Enriched Sand
August 30, 2012 Page 5-11
After deposition ceases in the tailings facility, surface settlement trends also are indicative of solids content trajectory. Therefore, a qualified professional must establish the details of the measurement plan to determine solids content and interpret the results.
The strength profile of the deposit can be measured in situ and the trends with depth and time can be used to estimate solids content. Cone penetration testing (CPT) (with passive gamma), can be used to establish correlations between strength, excess pore pressure, and solids content.
Once deposition ceases, measurements of in situ pore pressure can be used to assess amount of excess pore pressure (and effective stress) and thus provide an estimate of duration and magnitude of future settlement. Measured pore pressures can also be used in conjunction with laboratory consolidation tests to predict settlement magnitude. Settlement measured over time also provides estimates of magnitude and duration of future settlement that can be compared with performance predictions.
While test methods for these measurements are well established in geotechnical and oil sands practice, some adjustments in the methods for fines content determination are necessary to address the specific characteristics (including bitumen) of oil sands.
In addition, interpretation of both in situ and laboratory strength tests involves judgement and experience, requiring highly experienced practitioners. The current joint effort between the OSTC and the ERCB to develop guidelines for fines and strength measurement will likely prove useful to document appropriate procedures, and can be expanded as necessary to include other key measurements.
The operating data should be presented and summarized in annual performance reports. If necessary, contingencies and mitigation measures will be required to address departures from design assumptions regarding the magnitude and spatial variability of the SFR, solids measurements or both.
In tailings facilities where segregated fluid fines are allowed to accumulate, the fluids would be included in the site total FFT inventory.
5.5.3 Process Monitoring
Frequent monitoring of the CT production process is also necessary to confirm that it is operating within the planned range for the mix design. Key measurements are line density, SFR, and coagulant concentration.
Online density is straightforward to measure. However, sampling is necessary to confirm fines and clay content along with coagulant dosage and water chemistry. These measurements allow daily monitoring and adjustment of the process so that the mix design is met. They can also be summarized for periodic regulatory reporting.
Key laboratory measurements required to monitor the process are:
Oil, water and solids (OWS) (Dean Stark)
Particle size distribution
Solids content
Pore-water chemistry (basic anions, cations, pH, electrical conductivity, alkalinity.

Technical Guide for Fluid Fine Tailings Management
Section 5: Fines-Enriched Sand
August 30, 2012 Page 5-12
5.5.4 Other Performance Measurements
In addition to the primary indicators described above, the monitoring program should track discharge locations, volumes and line density. These data allow improved reconstruction of the pond stratigraphy. The fluid elevation in the tailings deposit should be surveyed at least weekly. Beach deposits should be surveyed for subaerial deposits; tailings designers should establish the frequency.
The temperature should be determined in the tailings deposits if they are beached above water in tailings disposal facilities with small fluid ponds (otherwise, experience indicates freezing of tailings is not a significant concern.) The presence of ice should be evaluated where low deposit temperatures are measured.
Process water chemistry should be measured at least monthly, as this chemistry directly determines the deposit pore water chemistry. Actual measurement frequency could be more often to meet plant operational requirements. The pore water chemistry should be measured as necessary to provide information for cap design and reclamation planning.
5.6 Contingencies Detailed site-specific mitigation plans are important to the adaptive management approach. They need to be part of the tailings management plan, and include proposed “triggers” to guide when mitigation would be implemented. If fines-enriched sand deposits do not achieve required performance, depending on the stage of the deposit and deviations encountered, options could include:
1. During operations:
Improving process technology (e.g., means to improve density, add better-performing flocculants or coagulants, or decouple from bitumen recovery)
Improving operational controls
Further dewatering at the tailings facility to achieve a higher solids content for deposition (e.g., cross flow filtration)
Improving deposition technology (e.g., improved tremie design)
Pumping fluid fines and use of a supplemental fines management technology to better control SFR and attain higher average fines content
Capturing fluid fines at the base of wetlands included in the reclamation plan
Overbuilding selected areas to deliberately generate a hummocky surface through differential settlement
Implementing water treatment technology to address unsatisfactory water chemistry.
2. During reclamation:
Dewatering the deposit by using wick drains in conjunction with deposit capping Using coke capping Using sand-raining capping technology Using winter capping to take advantage of frozen strength.

Technical Guide
forFluid Fine Tailings Management
Section 5: Fines-Enriched Sand
August 30, 2012 Page 5-13
3. After reclamation:
Overbuilding selected areas to account for expected settlement Re-grading to facilitate drainage Reconstructing erosion and drainage control features Extending period of active management.
These methods will allow the fines-enriched sand to be managed and monitored, and achieve the performance criteria established at each site.
5.7 Characteristics of Fines-Enriched Sand Deposits Table 5-1 provides some information on the area, containment, energy consumption and reclamation requirements for fines-enriched sand deposits.
Table 5-1 CT/NST
$ Cost Area Footprint Containment Requirement
Energy Intensity/ GHG
Time to Capping/Reclamation
Medium Small High Medium Fast


Technical Guide
forFluid Fine Tailings Management
Section 6: Water-Capped Deposits
August 30, 2012 Page 6-1
6 Water-Capped Deposits
6.1 Deposit Description
6.1.1 General
This deposit type consists of placing FFT that has naturally densified to >30% solids content into an engineered mine pit, where a water cap is established to form a lake. Once acceptable surface water quality is attained, in-flow to and out-flow from surrounding terrain is established to emulate a natural lake system (Figure 6-1). As water quality is fundamental to attainment of the proposed reclamation end point, it is the primary performance factor for this technology.
In a variation of this method, fine tailings would be densified before placement, thereby increasing the disposal capacity of the mine pit. While these deposits consolidate and gain strength over a long period as soft lake bottom mud, they are not intended to support terrestrial reclamation features.
A – approximate initial water cap depth B – approximate maximum consolidated depth after completion of MFT densification
Figure 6-1 Water-Capped Deposits

Technical Guide for Fluid Fine Tailings Management
Section 6: Water-Capped Deposits
August 30, 2012 Page 6-2
6.1.2 Advantages of Water Capping
Early studies of MFT in active settling basins supported the water-capping concept:
MFT exhibited properties more like a gel than a free-flowing liquid. For example, MFT above a solids content of about 30% showed sufficient strength to remain as a distinct bottom layer below a less-dense water cap.
The acute toxicity associated with specific components of OSPW was lost within months when OSPW was allowed to weather naturally without input of fresh process water.
Placement of MFT below the original land surface (below grade) at the bottom of a mined-out pit, surrounded by undisturbed clay, limestone and oil sands deposits, provides geotechnical stability for long-term containment and at the same time allows for decommissioning of (temporary) above-grade containment dams. Clay content in the MFT is projected to act as an effective transport barrier between the MFT pore water and groundwater or surface river systems.
The advantages of water capping as a treatment and reclamation option for handling MFT are as follows:
Provides readily available, otherwise low-value fill material for the large, deep pits left in the landscape after mining
Provides large water reservoir with extended water retention, so that natural degradation processes for OSPM can proceed
Does not require a chemical amendment, although chemical amendment to densify the transferred MFT could be an option
Allows design flexibility with the materials, as well as physical aspects of construction
Using process RCW for capping obviates the need for large volumes of additional water from surface drainage or rivers surrounding the site
Appears to be robust to the normal operational variability expected in fine tails composition (caused by varying ore properties and processing conditions)
Provides efficient storage of maturing fine tails, allowing densification to occur gradually without additional mechanical or chemical manipulation, using little energy, and therefore has low associated greenhouse gas emissions compared with other reclamation options.
6.2 Process Description One of the main types of FFT that are envisaged for water-capped deposits is MFT (produced as discussed in Section 1.1). The two key issues associated with incorporating un-amended MFT in a reclamation landscape are:
The volume of MFT produced is substantial.
MFT is a fluid with a composition that is predominantly water; densification to fully consolidated clay is currently projected to take hundreds of years.
Technical Guide
forFluid Fine Tailings Management
Section 6: Water-Capped Deposits
August 30, 2012 Page 6-3
Because of these issues, application of a “wet landscape” was the earliest disposal option developed and as such, is the most researched of the methods available. The wet landscape concept involves placing MFT in geotechnically stable areas left by oil sands mining, followed by capping with a water layer of appropriate depth to establish a lake supporting natural biotic life forms.
Placing material in the deposit is relatively simple, as both the MFT and the capping water can be pumped from their sources, transferred by pipeline and discharged into the mine pit.
6.3 State of Technology
6.3.1 Testing the Water Capping Concept
When the water-capping concept was introduced, researchers recognized key functional aspects that required empirical knowledge and demonstration before such a reclamation component could be accepted. These included a) stability of the pond layers, b) interaction of the pond with the groundwater, c) flux across the water cap/tailings interface, d) littoral zone development, e) toxicity to aquatic life, and f) ecological development.
These questions have been addressed over the last two decades in a program of progressive monitoring and experimentation, using laboratory, field and modelling methods at Syncrude. Where possible, questions have been addressed with scientific study in real systems at a reduced scale from a full-size lake. Details and results of this work are given in Appendix C.
Because of scaling factors and characteristics of the starting components, the test ponds are not expected to exactly mimic a commercial-scale facility. Nor could the test ponds fully capture the variability in MFT composition that can be expected in a commercial facility. Aspects such as area, depth and volume ratios of MFT to water cap can only be directly studied at large scale.
In addition to industry-based research, evaluation of this technology is part of a multi-stakeholder process facilitated by the Cumulative Effects Management Association (CEMA). CEMA proposes issuing and periodically updating an end-pit lake guidance document, which will include contributions from industry, government and stakeholder representatives.
6.3.2 Commercial Readiness
Further investigation of the large-scale lake processes will require monitoring a full-scale reclaimed system. Syncrude is in the process of initiating such a facility at the Mildred Lake site. The current West In-Pit tailings facility will be converted to a commercial-scale MFT water-capping demonstration facility (Base Mine Lake) in 2012. For scale differences between the Base Mine Lake project and work completed to date, see Table 6-1.

Technical Guide for Fluid Fine Tailings Management
Section 6: Water-Capped Deposits
August 30, 2012 Page 6-4
Subject to commercial validation, Syncrude plans to retain Base Mine Lake as a permanent feature in its closure landscape. All surface mine-based oil sands projects assume at least one water-capped deposit as part of the closure landscape, pending validation of the technical feasibility of the concept at the Base Mine Lake.
The use of water-capped deposits is viable on a commercial scale where in-pit deposits and closure landscape conditions exist such that the impacts of groundwater seepage (including expression of water from the fines-dominated deposit itself), geotechnical stresses and long-term deposit consolidation are manageable.
The degree to which this method can be applied will be site-specific, recognizing the inherent variability among oil sands leases. The method has the attraction of resolving mine pit backfill to emulate a natural feature, while at the same time disposing of the accumulation of FFT in an economic, energy-efficient manner.
Water-capped deposits are a standard legacy feature of open pit mines outside the oil sands sector. There is an increasing body of knowledge from these facilities, some of which is transferrable to the oil sands sector.
Table 6-1 Design and Materials – Water-Capping Test Ponds and Base Mine Lake
6.4 Water-Capped Deposit Design Factors to be considered in the design of a water-capped deposit are as follows:
Long-term geotechnical stability is attained by depositing MFT below the surrounding natural topography. A substantial landform, consisting of a remnant in situ zone plus an additional buffer of placed material, is essential for areas adjacent to natural creeks or rivers. For an interim period, the deposit could be adjacent to areas of active mining or subsequent infill. For this period, the common perimeter must be managed as a dam, with applicable design and regulatory requirements.
Variable Test Ponds Base Mine Lake
Surface area (ha) 0.05 – 4 ~800
Initial depth of water cap (m) 0.5 – 2.8 ≥5
Volume of water cap (m3) (1 – 80) ˣ 103 (35 – 40) ˣ 106
Volume of MFT (m3) (1 – 80) ˣ 103 >175 ˣ 106
Volume ratio (MFT:water) ~1 >4
Maximum fetch (km) 0.04 – 0.25 >3
Fill time (y) <0.1 (all) 17 (MFT)//1–5 (water)
Hydrology Closed (no surface flow-through) Open (flow-through) potential
Residence time (y) >15 >10
MFT source Mildred Lake Settling Basin North Mildred Lake Settling Basin South
Water cap source Natural surface water or OSPW Mixed OSPW and natural water

Technical Guide
forFluid Fine Tailings Management
Section 6: Water-Capped Deposits
August 30, 2012 Page 6-5
Lake depth and depth profile are important design considerations. A mine pit void could be 50 m to 100 m deep. This depth has a high probability of leading to meromictic conditions, where deep, cold layers of water do not intermix with surface layers. These layers are generally absent of life and can accumulate concentrations of salts and dissolved gases. Natural meromictic lakes have experienced rare turnovers (e.g., once in several centuries), with both adverse ecological and human consequences.
Transfer of MFT or densified MFT to a pit void presents in many ways an ideal solution to avoid an excessively deep pit lake:
Lake depth can be controlled to a design depth. Where unconsolidated MFT is used, depth before and after natural densification occurs must be considered.
The fill will buttress the steep pit walls so that collapse, erosion and expansion of the lake perimeter is avoided.
The partial fill will reduce the amount of fresh water required to complete the lake fill.
Partially filling the pit with MFT appears to provide both an effective barrier to saline groundwater inflow to the lake and a self-seal to impede outflow of MFT pore water to surrounding groundwater. However, both placed and in situ soil properties adjacent to and beneath the deposit, and their impact on groundwater flow, must be considered.
It is intended that the deposit provide aquatic and riparian habitat on closure. Shoreline profile and the presence of shallow portions of a lake that allow sunlight to penetrate, represent the littoral zones of the lake supporting plant life. To this end, provision of an adequate littoral zone along with wetland features must be included. Wetland features can provide a water quality “polishing” function both as to inflow from above-grade placed deposits and outflow to natural water bodies, particularly in the initial stages of reclamation. These features can be used to accelerate the timing when outflow achieves the required quality to be released from the closure landscape to offsite water bodies. However, a number of factors (pit geometry, pace of closure, and minimization of overall project disturbance) will limit the percentage of littoral, riparian and wetlands habitat that can be provided – in some cases to somewhat less than ideal percentages.
6.5 Measuring, Monitoring and Reporting As noted earlier (Section 6.3.1), there are six nominal categories of risk affiliated with development of a water-capped MFT deposit in a closure landscape. It follows that a measurement and monitoring program to validate application of the technology should compare actual facility performance with the developmental “trajectory” proposed by the operator. Established measurement and monitoring methods to address the validation process include:
Stability of the layers: water quality (total suspended solids [TSS], clarity indices), MFT solids content and strength, depth to MFT/water interface
Groundwater interaction – groundwater wells, groundwater chemistry
Flux across water cap – water chemistry, air quality testing

Technical Guide for Fluid Fine Tailings Management
Section 6: Water-Capped Deposits
August 30, 2012 Page 6-6
Littoral zone development – vegetation, aquatic life surveys
Toxicity to aquatic life – vegetation, benthic, fish health and toxicology studies
Ecological development – health, toxicology and diversity surveys.
The above criteria presume satisfactory geotechnical stability of pit containment.
Survey, sampling and laboratory testing methods specific to this type of deposit are discussed in Appendix B, Sections B.1 to B.3, B4.1, portions of B.6, and B.7
It is recognized that reporting will be focused on MFT and water volumes, depth and chemistry, as having the MFT attain geotechnical strength within operational time frames is not a design criteria of this technology.
As with all technologies, the management plan should include processes to design, validate, execute and communicate a measurement and performance-monitoring plan. The following steps are contemplated:
Development of performance “trajectories” at outset of the project. These trajectories should focus on performance criteria (cap water quality, FFT density/consolidation and progressive ingress of aquatic and riparian ecosystems) that will validate conformance with or deviation from evolution of the initial deposit to a reclamation-ready state.
Validation of such trajectories with external parties expert in the field, including academic, regulatory and consultant organizations.
Development and validation of contingency plans (Section 6.6), including determination of the point at which such plans should be initiated in the event that deviations from expected trajectory are considered sufficient to put the expected reclamation end point at risk.
Selection of a suite of measurement and survey techniques and programs that will allow efficient and effective tracking of performance criteria. Validation of such techniques and programs with external parties might be considered.
Implementation of the performance-monitoring plan during the construction and post-construction phases.
As noted earlier, the primary performance factor for successful implementation of this water capping method is the attainment of sustainable water quality.
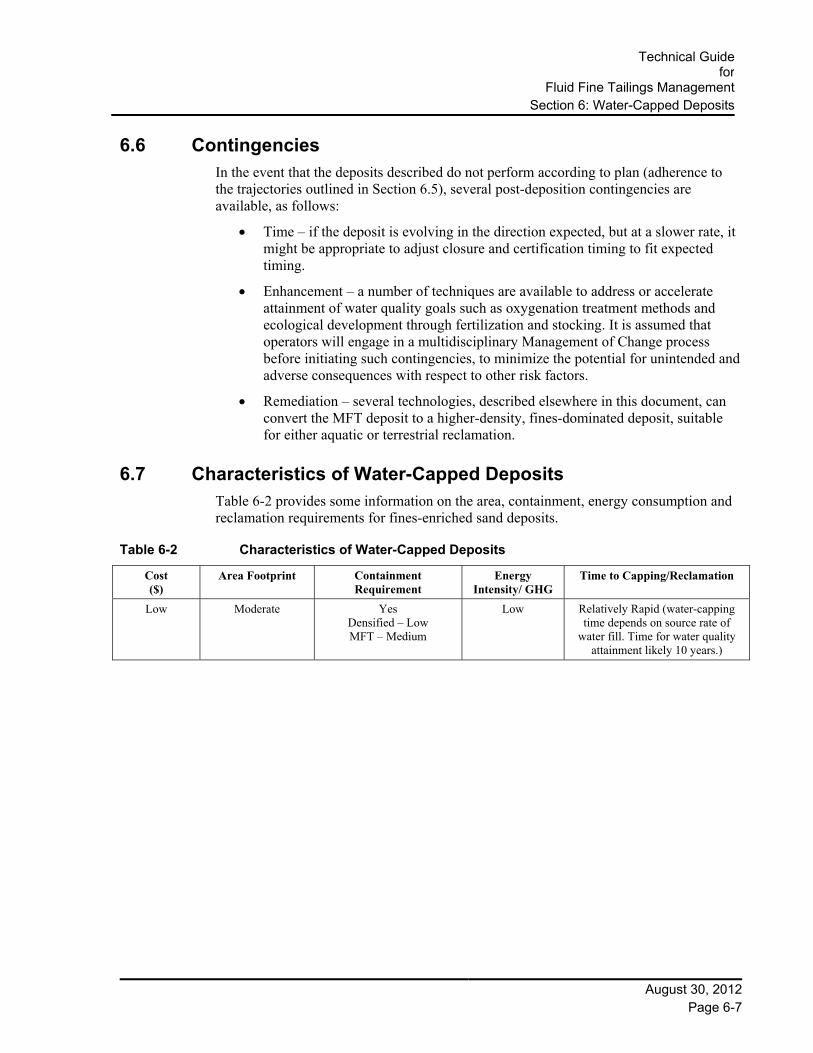
Technical Guide
forFluid Fine Tailings Management
Section 6: Water-Capped Deposits
August 30, 2012 Page 6-7
6.6 Contingencies In the event that the deposits described do not perform according to plan (adherence to the trajectories outlined in Section 6.5), several post-deposition contingencies are available, as follows:
Time – if the deposit is evolving in the direction expected, but at a slower rate, it might be appropriate to adjust closure and certification timing to fit expected timing.
Enhancement – a number of techniques are available to address or accelerate attainment of water quality goals such as oxygenation treatment methods and ecological development through fertilization and stocking. It is assumed that operators will engage in a multidisciplinary Management of Change process before initiating such contingencies, to minimize the potential for unintended and adverse consequences with respect to other risk factors.
Remediation – several technologies, described elsewhere in this document, can convert the MFT deposit to a higher-density, fines-dominated deposit, suitable for either aquatic or terrestrial reclamation.
6.7 Characteristics of Water-Capped Deposits Table 6-2 provides some information on the area, containment, energy consumption and reclamation requirements for fines-enriched sand deposits.
Table 6-2 Characteristics of Water-Capped Deposits
Cost ($)
Area Footprint Containment Requirement
Energy Intensity/ GHG
Time to Capping/Reclamation
Low Moderate Yes Densified – Low MFT – Medium
Low Relatively Rapid (water-capping time depends on source rate of
water fill. Time for water quality attainment likely 10 years.)


Technical Guide
forFluid Fine Tailings Management
Section 7: Fluid Fine Tailings Management
August 30, 2012 Page 7-1
7 Fluid Fine Tailings Management
7.1 Background Containment and control of FFT through the period of active mining and at mine closure is a key risk management matter. Previous sections of this document have addressed various methods for treatment and deposition of FFT, so that the treated material is in many cases no longer a fluid and in all cases incorporated into the closure landscape. This section of the document addresses management of the remaining volumes of FFT, that are not captured in one of the previously discussed deposit types and that are considered acceptable for storage on the lease without further treatment.
Management of this aspect of oil sands tailings has the following objectives:
Safe containment of the FFT and overlying OSPW. This aspect is currently well managed through internal procedures overseen by Alberta Dam Safety Branch and industrial practice. However, in the long-term, it is accepted that there will be no above-grade storage of FFT.
Maintaining FFT volumes within a profile consistent with site plans submitted for project approval and updated with mine plans as mining progresses. To the extent practical, this profile should reflect the principle of progressive reclama-tion, meaning that volumes should not be accumulated such that there is a large and costly liability at mine closure.
Adaptive management measures will be available to maintain FFT volumes within committed limits. In practice, this will mean adjusting the rate of FFT treatment and disposal methods to control final volumes of FFT. Implicit in this approach is that reactive, unplanned increases in the storage containment volume will not be the response to under-prediction of FFT generation.
In respect to the previous point, proven methods will be developed for treatment and disposal of FFT consistent with reclamation planning and execution during operations and at mine closure.
7.2 Measuring, Monitoring and Reporting The primary reason for measuring and reporting FFT volumes is to demonstrate that past and predicted future accumulations of FFT are within submitted tailings plans and committed limits. To be assured that this is the case, operators must fully understand their entire tailings mass balance. The following are important respecting the FFT component:
The rate at which FFT is being generated during mining. The rate at which FFT consolidates in ponds. The volumes of FFT that are treated and stored in an approved DDA.
Technical Guide for Fluid Fine Tailings Management
Section 7: Fluid Fine Tailings Management
August 30, 2012 Page 7-2
Models are used to predict the volume and mass of FFT being generated; the following variables are critical to the modelling process:
Percentage of fines in oil sands to be processed through extraction Proportion of fines not captured in sand structures and flowing to pond fluid Density profile of FFT Withdrawals of FFT to be processed and transferred to final disposal locations.
Various techniques are required to characterize FFT deposits, including topographical surveys, pond sounding, in situ testing and sampling, as discussed in the following subsections. These techniques are complemented by laboratory testing, stratigraphic modelling, data treatment and reconciliation with the feed to the mine and extraction plant. More detail on specific sampling and test methods is found in Appendix B.
7.2.1 Tailings Site Investigation
Specific deposit performance measurements in the site investigation program include:
Stratigraphy and volume of RCW and FFT
Physical properties of the FFT in terms of bitumen, water and solids, particle size distribution mineralogy and relationship between fines and water, sand and fines, and bitumen and fines
Geotechnical classification and measurements, which include Atterberg limits, specific gravity, pore water pressure and undrained shear strength
Chemical properties of the FFT pore water
Densification properties of the FFT
Development of microbial activity
Surface topography of tailings ponds (surveyed at least once a year to determine overall tailings volumes and results of the annual aerial survey are used to generate a site-wide material balance).
7.2.2 Pond Measurement
A number of measurement methods are used to determine:
Geometry (and therefore capacity) of the pond containment, which constantly changes as dykes are raised and sand is discharged to the interior of the pond
Volume of fluids in the pond (total FFT, densification to MFT and water).
These sampling and measurement methods are discussed in detail in Appendix B.
The generation of FFT represents the difference between large numbers:
Fines in the ore processed Less fines retained in sand structures Less MFT removed for processing to disposal.

Technical Guide
forFluid Fine Tailings Management
Section 7: Fluid Fine Tailings Management
August 30, 2012 Page 7-3
Each of the input numbers has a range of precision so that over time, small differences in annual estimates can grow to large differences in FFT volume. Recognizing the inherent inaccuracy in annual balances, it is essential to observe, track and adjust volume projections over time.
The following definitions for the upper and lower limits of FFT should be consistent across the industry (see Figure 7-1):
FFT lower limit using pond bottom (defined by a strength measurement that approximates the liquid limit). This criterion should accommodate efficient geophysical methods as developed (versus pond sounding and sampling).
FFT upper limit (see Figure 7-1) defined by solids content. The definition has been 1% suspended solids. Measured by SONAR, the value will range from 5% to 10% solids content. However, given the rapid transition from 1% to 20% solids, there is little difference in using 1% or the SONAR boundary, and better area coverage can be attained efficiently with SONAR.
Solid-Liquid Interface– Defined by Strength
DykeRecycle Water
MFT
FFT Transition Zone
FFT Top – Defined by solids %wt
Note: The geotechnical liquid limit is in the range of 1kPa to 2kPa. However, practical measurement methods might dictate a somewhat higher strength for “pond bottom.” Similarly, about 5% solids content could represent the practical SONAR method for FFT top surface. Since the transition from 2% to 15% solids content occurs over a small depth interval, a measurement difference of 5% versus 2% is insignificant.
Figure 7-1 Pond Surveys
Technical Guide for Fluid Fine Tailings Management
Section 7: Fluid Fine Tailings Management
August 30, 2012 Page 7-4
7.3 Contingencies Computer model projections, adjusted to match performance, can be used for longer-term prediction of the FFT volumes. However, given the degree of uncertainty in net generation of FFT, the primary design contingency is to take a conservative approach to forecasting FFT generation. The degree of conservatism will be determined by each operator, recognizing:
Degree of variability in the ore body
Site-specific constraints on the practicality and cost of contingency volume
Ability to respond in operations by expanding dewatering processes that can offset any underestimates of containment and accumulated FFT volumes.
The response in operations to an increase in FFT beyond the planned trajectory, once all operational improvements have been exhausted, would be to expand the resources for dewatering of FFT, such as discussed in previous sections of this document.
As the end of mine life is approached, if the volume of FFT to be stored on the site were to exceed the amount that could be acceptably accommodated according to the closure plan, the FFT could be treated to increase its density and therefore storage efficiency.

Technical Guide
forFluid Fine Tailings Management
Section 8: Summary
August 30, 2012 Page 8-1
8 Summary This document sets out technical guidelines for managing FFT through appropriate treatment and disposal in a DDA. For each site, operators must consider land availability and disturbance, geotechnical conditions, resource distribution, general site geology, containment availability and mine advancement to develop the optimum tailings management strategy. Table 8-1 summarizes the methods currently under development and their main features.
Table 8-1 Characteristics of Deposits – Summary
Method Cost ($)
Area Footprint
Containment Requirement
Energy Intensity/
GHG
Time to Capping/Reclamation
Thin-Lift Drying High Very Large Compacted shell Medium Extended placement time; rapid when complete
Thin-Lift Drying with Rehandling
Very High Large None when placed High Rapid
Deep Cohesive
Centr. High Small Low High Slow
AD Medium Moderate Low Low Slow
TT Moderate Low Very Low
(Energy recovery) Slow Moderate
Fines-Enriched Sand Deposits
Medium Small High Medium Fast
Water-Capped In-pit Deposits
Low Moderate Yes Densified – Low MFT – Medium
Low
Water-capping time depends on source rate of water fill. Time for water quality attainment likely 10 years.
Site-specific opportunities and challenges are critical in evaluating the appropriate suite of FFT treatment methods to be applied. Most operations will need to deploy a number of methods and deposit types to achieve their progressive reclamation and closure plans. Current development efforts will provide improving definition of performance factors for the different methods. An adaptive management approach to the deployment and balancing of use of the methods will deliver required outcomes while retaining resource value.
Geotechnical engineering and reclamation science together with appropriate measurement protocols, using both direct and indirect measurement methods, are essential elements in adaptive management of uncertainties inherent with this large-scale resource development.
Outcome-directed and performance-based management is essential in delivering results. FFT site-specific volume profiles are the most direct way to manage oil sands tailings, focusing on volumes that are consistent with progressive reclamation and closure plans. Operators commit to use available methods, as required through adaptive management, to maintain FFT volumes within an approved FFT profile.
Technical Guide for Fluid Fine Tailings Management
Section 8: Summary
August 30, 2012 Page 8-2
The interaction of tailings management, reclamation and closure with mine site planning represents a complex but manageable challenge. Decision-makers and stakeholders must adapt from experience, new information, and evolving social values to achieve desired outcomes. Performance monitoring and reporting is essential to provide information on environmental conditions and to identify the need for ongoing adjustments and changes. The information in this document is intended to reinforce these facts and provide a path for effective and collaborative tailings management.
Technical Guide
forFluid Fine Tailings Management
Section 9: References
August 30, 2012 Page 9-1
9 References
.
Caughill, Morgenstern, N.R. and Scott, J.D. 1993. Geotechnics of non-segregating oil sand tailings. Canadian Geotechnical Journal 30: 801–811.
Clifton Associates Limited. 2009. Towards a Results-Based Regulatory System. Report for the Saskatchewan Ministry of Environment. Regina, Saskatchewan.
Demoz, A., Dang-Vu, T. and Mikula, R.J. 2009. Rim Ditch Dewatering Pilot Test Division Report. CanmetENERGY. Devon 09-80 (Cf). November 2009.
Liu et al. 1994. Consolidation of Suncor Non-segregating Tailings. 47th Canadian Geotechnical Conference. Halifax, Nova Scotia.
Pollock, G.W. 1988. Large Strain Consolidation of Oil Sand Tailings Sludge. University of Alberta. M.Sc. Thesis. 276 p.
Rushton, A., Ward, A.S. and Holdich, R.G. 2000. Solid-Liquid Filtration and Separation Technology. 2nd ed. Wiley-VCH.
Sobkowicz, J. and Morgenstern, N.R. 2009. A Geotechnical Perspective on Oil Sands Tailings. Keynote address to the 2009 Tailings and Mine Waste Conference, Banff, Alberta.
Suthaker, N.N. and Scott, J.D. 1995. Measurement of hydraulic conductivity in oil sand tailings slurries. Canadian Geotechnical Journal 33: 642–653.
Williams, B.K., Szaro, R.C. and Shapiro, C.D. 2009. Adaptive Management: U.S. Department of the Interior Technical Guide. U.S. Department of the Interior, Washington, D.C. Available at: http://www.doi.gov/initiatives/AdaptiveManagement/TechGuide.pdf.


Technical Guide
forFluid Fine Tailings Management
Appendix A: Cohesive Deposit Modelling
August 30, 2012 Page A-1
Appendix A Cohesive Deposit Modelling
Discharging high fines FFT (typically MFT or TT) into a deep DDA, at a relatively high rate (such that environmental effects do not dominate the deposit behaviour) creates deep, fines-dominated (cohesive) deposits. They share the following characteristics:
They are derived from among low cost fines management processes
They have a low footprint area
They require the least containment volume of any of the tailings materials
They are the slowest consolidating deposits and the most complex to model to predict consolidation timing.
This appendix contains additional information on the process of consolidation modelling to augment the information in Section 4.
The conventional approach to model consolidation and predict settlement in tailings slurries is to undertake a one-dimensional consolidation prediction based on finite strain consolidation theory. These involve large strains, nonlinear soil properties and consolidation due to self-weight. At present, this approach provides the most reliable and robust prediction method, as the theory and models are established and tested for tailing materials8. Large-strain finite element models are capable of dealing with the complexity of disposal sequences, deposit depth and changes in boundary conditions. Parametric studies can be carried out with a numerical model which makes the modelling extremely useful in both the planning and operational stages.
Figure A-1 and Figure A-2 show the void ratio versus effective stress and the permeability versus void ratio relationships that were obtained from various laboratory consolidometer tests and field deposit back analyses. The laboratory compressibility and hydraulic conductivity data were derived from consolidometer testing results performed since 1997 by Syncrude, Shell and Total. The compressibility and hydraulic conductivity field data were derived from TT deposits created with demonstration thickeners at the Syncrude Aurora Mine and the Shell Muskeg River Mine. The compressibility design parameters are based on field measurements of solids contents and pore pressures, made side-by-side and taken at different time intervals, and supplemented with laboratory consolidometer tests. The permeability design parameters are based on field data only.
In terms of consolidation, the field behaviour is typically better than that predicted when using data solely from the laboratory. In the field, it appears that the material is more permeable than in the laboratory. This is a fairly common finding in geotechnical practice and is likely attributable to macro structure or channelling that is present in the field deposits but not at small scale in the laboratory. It could also be related to dynamic effects during placement in the field or deposit heterogeneity.
8 As noted in Section 4.3.5, the finite strain models to not explicitly include creep, which is an important but as yet
poorly quantified aspect of the long-term behaviour of FFT. It is possible that creep may somewhat retard the development of primary consolidation, as well as increase long-term settlement. However, there are no data for creep effects in FFT.

Technical Guide for Fluid Fine Tailings Management
Appendix A: Cohesive Deposit Modelling
August 30, 2012 Page A-2
Using field results to calibrate the finite strain model proved to provide a good fit with data from pilot scale TT deposition, which has increased the confidence in predicting the behaviour of future TT deposits. Once the field compressibility and permeability parameters are used, the height of the deposit, solids contents, and pore pressures can be modelled with reasonable accuracy. It is considered that the predictions made are a reasonable basis for planning.
The compressibility is an indication of how the material will compress under applied stresses. In general, the compressibility of clayey slurry controls the amount of consolidation. The hydraulic conductivity (permeability) is an indication of how fast the water can flow through the material at different solids content. However, the rate of consolidation is a function of both compressibility and permeability9. For example, a slurry with a high compressibility and low permeability will have large settlement that occurs over a long period of time; a slurry with a low compressibility and high permeability will have less settlement that occurs over a shorter time period (which may be partly related to a greater dewatering that has occurred during placement).
The combination of compressibility and hydraulic conductivity, along with the initial condition and boundary condition, can be inserted into a finite strain consolidation analysis to predict how much and how fast deep, cohesive tailings deposits can release water (volume reduction, settlement) under a specified stress condition.
The ability to predict time rates of slurry consolidation provides a means of evaluating alternative approaches to fine tailings disposal. Among the specific useful applications are:
Predicting the storage capacity of disposal areas (time to fill to specified height as a function of filling rate and areal extent)
Predicting final surface elevation after reclamation (ultimate settlement as a function of total height and surcharge loading).
9 The rate of consolidation is directly proportional to the ratio of (permeability / compressibility). Since both of
these terms vary with void ratio, so also does the rate of consolidation vary with void ratio.

Technical Guide
forFluid Fine Tailings Management
Appendix A: Cohesive Deposit Modelling
August 30, 2012 Page A-3
Figure A-1 Compressibility Data for FFT
0.1
1
10
0.1 1 10 100 1000
Fin
es V
oid
Rat
io, e
f
Vertical Effective Stress, kPaCompressibility Design Parameters Lower Bound (Syncrude Cell B 2002 Field Data and Laboratory Data)Compressibility Design Parameters Upper Bound (Syncrude Cell B Field Data and Laboratory Data)Compressibilty Design Parameters (Shell Cell 4 Field Data and Laboratory Data)Syncrude TT Laboratory Data
TOTAL TT Laboratory Data
Syncrude Cell B Field Data 2002
Syncrude Column 8 Field Data 2002, 2003, 2004
Shell Cell 4 Field Data 2009, 2010
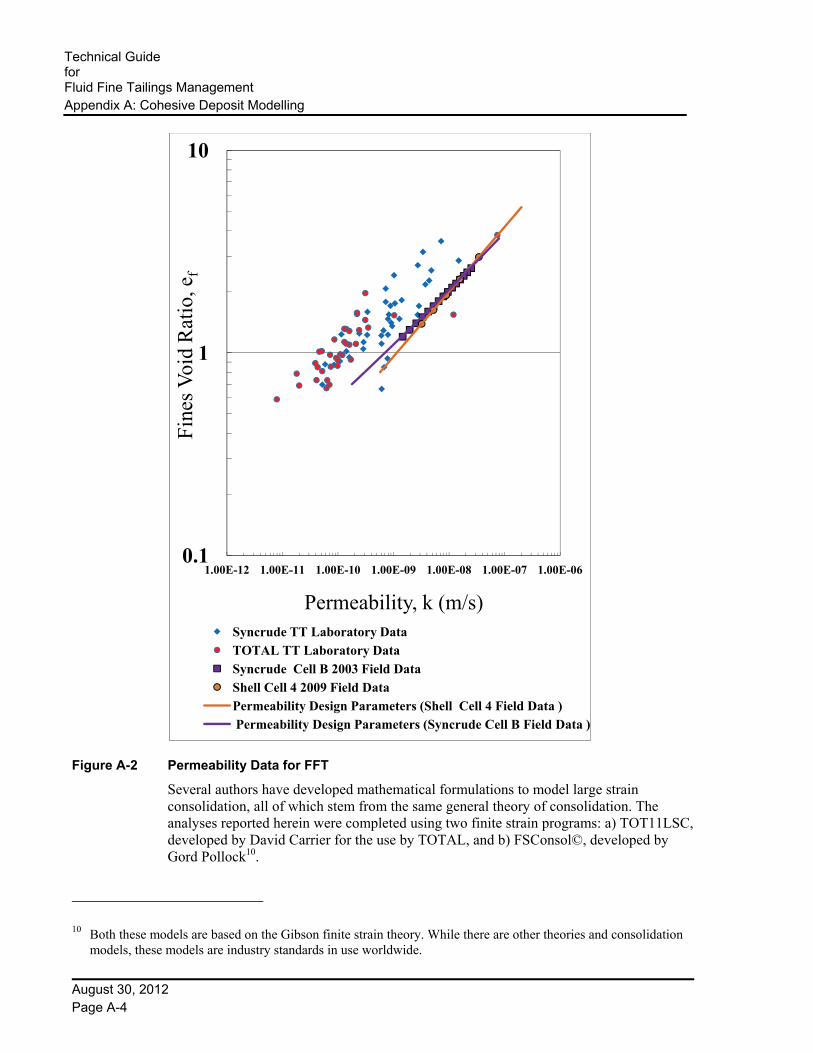
Technical Guide for Fluid Fine Tailings Management
Appendix A: Cohesive Deposit Modelling
August 30, 2012 Page A-4
Figure A-2 Permeability Data for FFT
Several authors have developed mathematical formulations to model large strain consolidation, all of which stem from the same general theory of consolidation. The analyses reported herein were completed using two finite strain programs: a) TOT11LSC, developed by David Carrier for the use by TOTAL, and b) FSConsol©, developed by Gord Pollock10.
10 Both these models are based on the Gibson finite strain theory. While there are other theories and consolidation
models, these models are industry standards in use worldwide.
0.1
1
10
1.00E-12 1.00E-11 1.00E-10 1.00E-09 1.00E-08 1.00E-07 1.00E-06
Fin
es V
oid
Rat
io, e
f
Permeability, k (m/s)Syncrude TT Laboratory Data
TOTAL TT Laboratory Data
Syncrude Cell B 2003 Field Data
Shell Cell 4 2009 Field Data
Permeability Design Parameters (Shell Cell 4 Field Data )Permeability Design Parameters (Syncrude Cell B Field Data )
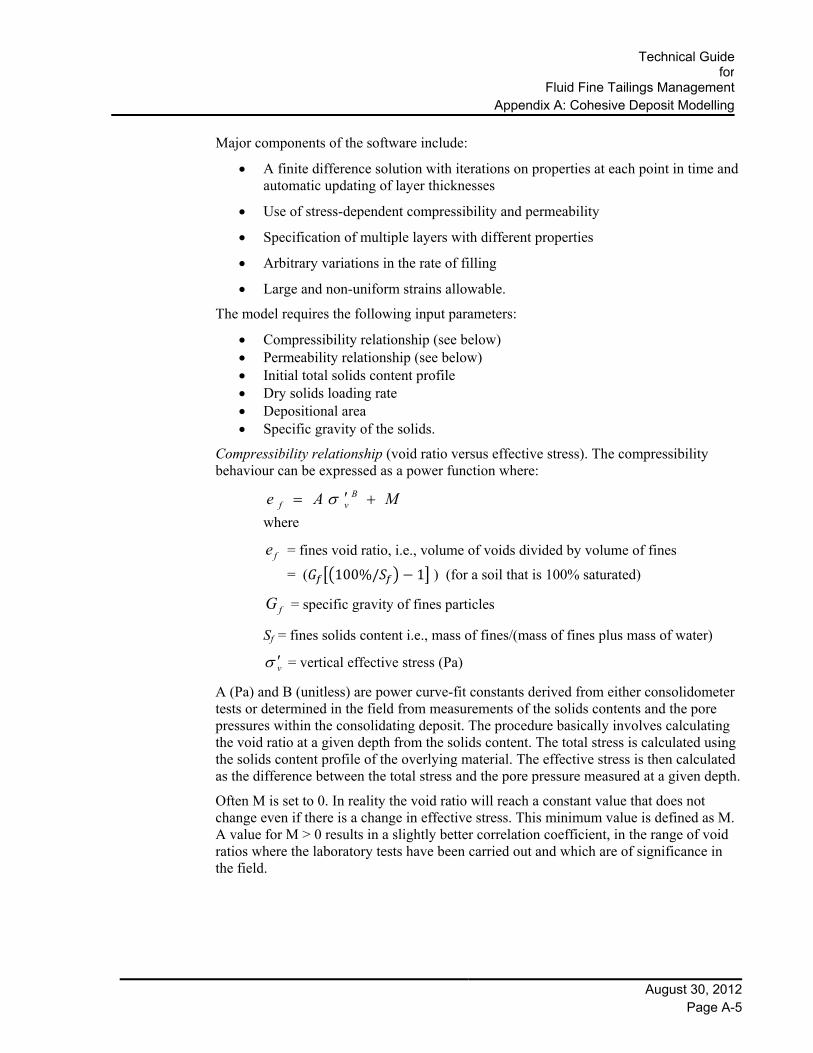
Technical Guide
forFluid Fine Tailings Management
Appendix A: Cohesive Deposit Modelling
August 30, 2012 Page A-5
Major components of the software include:
A finite difference solution with iterations on properties at each point in time and automatic updating of layer thicknesses
Use of stress-dependent compressibility and permeability
Specification of multiple layers with different properties
Arbitrary variations in the rate of filling
Large and non-uniform strains allowable.
The model requires the following input parameters:
Compressibility relationship (see below) Permeability relationship (see below) Initial total solids content profile Dry solids loading rate Depositional area Specific gravity of the solids.
Compressibility relationship (void ratio versus effective stress). The compressibility behaviour can be expressed as a power function where:
MAe Bvf
where
fe = fines void ratio, i.e., volume of voids divided by volume of fines
= ( 100%/ 1 ) (for a soil that is 100% saturated)
fG = specific gravity of fines particles
Sf = fines solids content i.e., mass of fines/(mass of fines plus mass of water)
v = vertical effective stress (Pa)
A (Pa) and B (unitless) are power curve-fit constants derived from either consolidometer tests or determined in the field from measurements of the solids contents and the pore pressures within the consolidating deposit. The procedure basically involves calculating the void ratio at a given depth from the solids content. The total stress is calculated using the solids content profile of the overlying material. The effective stress is then calculated as the difference between the total stress and the pore pressure measured at a given depth.
Often M is set to 0. In reality the void ratio will reach a constant value that does not change even if there is a change in effective stress. This minimum value is defined as M. A value for M > 0 results in a slightly better correlation coefficient, in the range of void ratios where the laboratory tests have been carried out and which are of significance in the field.

Technical Guide for Fluid Fine Tailings Management
Appendix A: Cohesive Deposit Modelling
August 30, 2012 Page A-6
Permeability relationship (permeability versus void ratio) The permeability, k, can be expressed as a power function of the fines void ratio:
DfCek
Where C (in m/s) and D (unitless) are power curve-fit constants again derived from either consolidometer tests or determined in the field by monitoring settlement with time.
An alternate relationship frequently used for the permeability of clayey slurries is:
fFf eEek 1/
A number of parametric cases were modelled to evaluate TT consolidation behaviour, which are reported herein. For the various runs, different solids loading rates “y” were used; the values selected were based on an initial slurry rise rate of 2, 2.5, 3, 3.5 and 4 m per year. The initial slurry solids content was 50%, with a fines content of 35.7% and an SFR of 0.8. For each case considered, the model was run to achieve a certain filling rate over three time frames - 10, 15 and 20 years. The effects of two permeability/compressibility relationships were also considered; these cases were termed “lower” and “upper.”
The consolidation relationships used in the analysis are shown in the following table.
Table A-1 TT Compressibility and Permeability Parameters (Based on Fines Void Ratio)
Model
Basis Compressibility Coefficient Permeability Coefficient
Alternative Permeability Coefficient
A B M C D E F
(Pa) (m/s) (m/s)
Syncrude
(Lower Bound)
45.32 ‐0.43 0.54 7.63E‐10 3.59 1.4E‐09 4.29
Syncrude
(Upper Bound)
21.34 ‐0.29 0.54 6.99E‐10 3.63 1.46E‐09 4.29
Shell 26.34 ‐0.343 0.51 1.14e‐09 3.125 2.09e‐09 3.9
The model basis parameters “Syncrude Lower Bound” and “Shell” were used for the consolidation analyses presented in this document.
For all TT cases considered, the analyses were based on 1-D consolidation, upward drainage only, and no ponded water at the surface of the consolidating thickened tailings deposit.
Technical Guide
forFluid Fine Tailings Management
Appendix A: Cohesive Deposit Modelling
August 30, 2012 Page A-7
A post-filling sand cap was applied in all cases. The model includes the following assumptions regarding surcharge loads that were applied to simulate the addition of a cap:
The surcharge load will not impede the flow of water coming out of the top of the consolidating tailings deposit, (generally the case for a sand cap).
The rate of surcharge loading will not result in any other geotechnical problems (e.g. inversion of capping layer and the underlying TT).
The surcharge loads used in the models correspond to a cap of 5 m of sand, assuming no water table within the capping layer, (i.e., the water table remains at the surface of the underlying TT deposit, at the base of the capping layer).
In each case, it was assumed that a cap having a unit weight of 18 kN/m3 (90 kPa) would be placed. In the FSConsol© model, the surcharge was added relatively instantaneously, even though, in reality, a cap would be constructed over time.
The model results are summarized in Table A-2 through Table A-7.
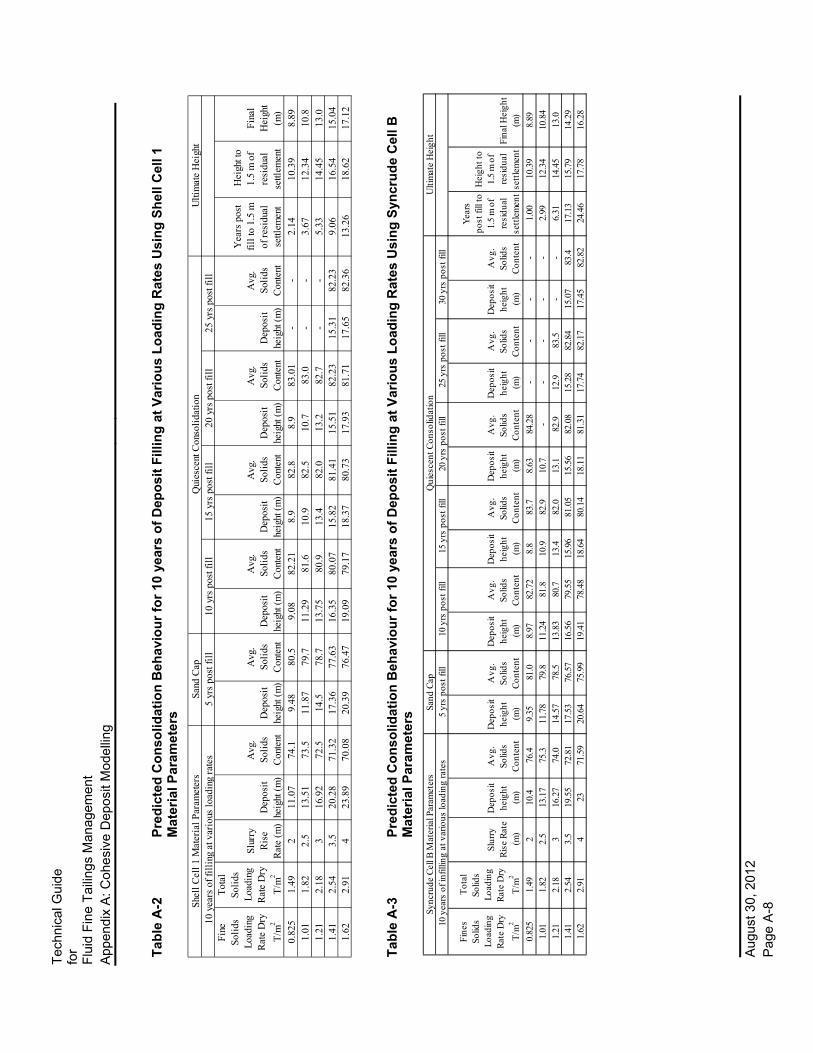
Tec
hnic
al G
uide
fo
r F
luid
Fin
e T
ailin
gs M
anag
emen
t
App
endi
x A
: Coh
esiv
e D
epos
it M
odel
ling
Aug
ust 3
0, 2
012
P
age
A-8
Tab
le A
-2
Pre
dic
ted
Co
nso
lidat
ion
Beh
avio
ur
for
10 y
ears
of
Dep
osi
t F
illin
g a
t V
ario
us
Lo
adin
g R
ates
Usi
ng
Sh
ell C
ell 1
M
ater
ial P
aram
eter
s
T
able
A-3
P
red
icte
d C
on
solid
atio
n B
ehav
iou
r fo
r 10
yea
rs o
f D
epo
sit
Fill
ing
at
Var
iou
s L
oad
ing
Rat
es U
sin
g S
yncr
ud
e C
ell B
M
ater
ial P
aram
eter
s
Fin
e So
lids
Lo
adin
g
Rat
e D
ry
T/m
2
Tot
al
Soli
ds
Loa
ding
R
ate
Dry
T/m
2
Slur
ry
Ris
e R
ate
(m)
Dep
osit
heig
ht (
m)
Avg
. So
lids
C
onte
ntD
epos
it he
ight
(m
)
Avg
. So
lids
C
onte
ntD
epos
it he
ight
(m
)
Avg
. So
lids
C
onte
ntD
epos
it he
ight
(m
)
Avg
. So
lids
C
onte
ntD
epos
it he
ight
(m
)
Avg
. So
lids
C
onte
ntD
epos
it
heig
ht (
m)
Avg
. S
olid
s C
onte
nt
Yea
rs p
ost
fill
to 1
.5 m
of
res
idua
l se
ttlem
ent
Hei
ght t
o 1.
5 m
of
resi
dual
se
ttlem
ent
Fin
al
Hei
ght
(m)
0.82
51.
492
11.0
774
.19.
4880
.59.
0882
.21
8.9
82.8
8.9
83.0
1-
-2.
1410
.39
8.89
1.01
1.82
2.5
13.5
173
.511
.87
79.7
11.2
981
.610
.982
.510
.783
.0-
-3.
6712
.34
10.8
1.21
2.18
316
.92
72.5
14.5
78.7
13.7
580
.913
.482
.013
.282
.7-
-5.
3314
.45
13.0
1.41
2.54
3.5
20.2
871
.32
17.3
677
.63
16.3
580
.07
15.8
281
.41
15.5
182
.23
15.3
182
.23
9.06
16.5
415
.04
1.62
2.91
423
.89
70.0
820
.39
76.4
719
.09
79.1
718
.37
80.7
317
.93
81.7
117
.65
82.3
613
.26
18.6
217
.12
Sand
Ca p
She
ll C
ell
1 M
ater
ial P
aram
eter
sQ
uies
cent
Con
soli
datio
nU
ltim
ate
Hei
ght
10
year
s of
fil
ling
at v
ario
us lo
adin
g ra
tes
5 yr
s po
st fi
ll10
yrs
pos
t fil
l15
yrs
pos
t fil
l20
yrs
pos
t fil
l25
yrs
pos
t fil
l
Fine
s So
lids
Load
ing
R
ate
Dry
T/m
2
Tot
al
Solid
s Lo
adin
g R
ate
Dry
T/m
2
Slur
ry
Ris
e R
ate
(m)
Dep
osit
heig
ht
(m)
Avg
. So
lids
Con
tent
Dep
osit
heig
ht
(m)
Avg
. So
lids
Con
tent
Dep
osit
heig
ht
(m)
Avg
. So
lids
Con
tent
Dep
osit
heig
ht
(m)
Avg
. So
lids
Con
tent
Dep
osit
heig
ht
(m)
Avg
. So
lids
Con
tent
Dep
osit
heig
ht
(m)
Avg
. So
lids
Con
tent
Dep
osit
heig
ht
(m)
Avg
. So
lids
Con
tent
Yea
rs
post
fill
to
1.5
m o
f re
sidu
al
sett
lem
ent
Hei
ght t
o 1.
5 m
of
resi
dual
se
ttle
men
tFi
nal H
eigh
t (m
)
0.82
51.
492
10.4
76.4
9.35
81.0
8.97
82.7
28.
883
.78.
6384
.28
--
--
1.00
10.3
98.
89
1.01
1.82
2.5
13.1
775
.311
.78
79.8
11.2
481
.810
.982
.910
.7-
--
--
2.99
12.3
410
.84
1.21
2.18
316
.27
74.0
14.5
778
.513
.83
80.7
13.4
82.0
13.1
82.9
12.9
83.5
--
6.31
14.4
513
.01.
412.
543.
519
.55
72.8
117
.53
76.5
716
.56
79.5
515
.96
81.0
515
.56
82.0
815
.28
82.8
415
.07
83.4
17.1
315
.79
14.2
91.
622.
914
2371
.59
20.6
475
.99
19.4
178
.48
18.6
480
.14
18.1
181
.31
17.7
482
.17
17.4
582
.82
24.4
617
.78
16.2
8
Qui
esce
nt C
onso
lidat
ion
Sand
Cap
10
year
s of
infil
ling
at v
ario
us lo
adin
g ra
tes
Ulti
mat
e H
eigh
t5
yrs
post
fill
10 y
rs p
ost f
ill15
yrs
pos
t fill
20 y
rs p
ost f
ill25
yrs
pos
t fill
30 y
rs p
ost f
illSy
ncru
de C
ell B
Mat
eria
l Par
amet
ers

Tec
hnic
al G
uide fo
rF
luid
Fin
e T
ailin
gs M
anag
emen
t
A
ppen
dix
A: C
ohes
ive
Dep
osit
Mod
ellin
g
Aug
ust 3
0, 2
012
Pag
e A
-9 T
able
A-4
P
red
icte
d C
on
solid
atio
n B
ehav
iou
r fo
r 15
Yea
rs o
f D
epo
sit
Fill
ing
at
Var
iou
s L
oad
ing
Rat
es U
sin
g S
hel
l Cel
l 1
Mat
eria
l Par
amet
ers
T
able
A-5
P
red
icte
d C
on
solid
atio
n B
ehav
iou
r fo
r 15
yea
rs o
f D
epo
sit
Fill
ing
at
Var
iou
s L
oad
ing
Rat
es U
sin
g S
yncr
ud
e C
ell B
M
ater
ial P
aram
eter
s
Fine
So
lids
Load
ing
Ra
te D
ry
T/m
2
Tota
l So
lids
Load
ing
Rate
Dry
T/m
2
Slur
ry
Rise
Ra
te
(m)
Dep
osit
heig
ht
(m)
Avg
. So
lids
Cont
ent
Dep
osit
heig
ht
(m)
Avg
. So
lids
Cont
ent
Dep
osit
heig
ht
(m)
Avg
. So
lids
Cont
ent
Dep
osit
heig
ht
(m)
Avg
. So
lids
Cont
ent
Dep
osit
heig
ht
(m)
Avg
. So
lids
Cont
ent
Dep
osit
heig
ht
(m)
Avg
. So
lids
Cont
ent
Dep
osit
heig
ht
(m)
Avg
. So
lids
Cont
ent
Dep
osit
heig
ht
(m)
Avg
. So
lids
Cont
ent
Yea
rs p
ost f
ill
to 1
.5 m
of
resi
dual
se
ttlem
ent
Hei
ght t
o 1.
5 m
of r
esid
ual
settl
emen
tFi
nal H
eigh
t (m
)
0.82
51.
492
16.2
75.1
14.4
179
.913
.85
81.5
213
.682
.413
.48
82.8
6-
--
--
-4.
0514
.75
13.2
51.
011.
822.
520
.25
74.3
18.0
579
.017
.380
.816
.981
.816
.682
.416
.482
.9-
--
-7.
8017
.63
16.1
31.
212.
183
24.9
673
.122
.26
77.8
20.5
779
.820
.081
.019
.781
.819
.582
.419
.482
.8-
-12
.00
20.7
519
.25
1.41
2.54
3.5
30.0
371
.85
26.7
776
.51
25.3
678
.71
24.4
980
.13
23.9
81.1
223
.49
82.3
523
.19
82.3
5-
-20
.61
23.8
522
.35
1.62
2.91
435
.47
70.4
931
.58
75.1
729
.78
77.5
728
.62
79.1
927
.82
80.3
427
.25
81.1
926
.83
81.8
226
.51
82.3
128
.69
26.9
425
.44
Shel
l Cel
l 1 M
ater
ial P
aram
eter
sSa
nd C
a pQ
uies
cent
Con
solid
atio
nUl
timat
e H
eigh
t
15
year
s of i
nfill
ing
at v
ario
us lo
adin
g ra
tes
30 y
ears
pos
t fill
25 y
ears
pos
t fill
5 yr
s pos
t fill
10 y
ears
pos
t fill
15 y
ears
pos
t fill
20 y
ears
pos
t fill
35 y
ears
pos
t fill
Fine
So
lids
Load
ing
Rate
Dry
T/m2
Total
So
lids
Load
ing
Rate
Dry
T/m2
Slur
ry
Rise
Ra
te (m
)
Depo
sit
heig
ht (m
)
Avg.
Solid
s Co
ntent
Depo
sit
heig
ht (m
)
Avg.
Solid
s Co
ntent
Depo
sit
heig
ht (m
)
Avg.
Solid
s Co
ntent
Depo
sit
heig
ht (m
)
Avg.
Solid
s Co
ntent
Depo
sit
heig
ht (m
)
Avg.
Solid
s Co
ntent
Depo
sit
heig
ht (m
)
Avg.
Solid
s Co
ntent
Depo
sit
heig
ht (m
)
Avg.
Solid
s Co
ntent
Depo
sit
heig
ht (m
)
Avg.
Solid
s Co
ntent
Depo
sit
heig
ht (m
)
Avg.
Solid
s Co
ntent
Depo
sit
heig
ht (m
)
Avg.
Solid
s Co
ntent
Year
s pos
t fil
l to
1.5
me
tre
resid
ual
settl
emen
t
Heig
ht to
1.
5 m
of
resid
ual
settl
emen
t
Fina
l He
ight
(m)
0.82
51.
492
15.5
576
.814
.56
79.5
14.1
180
.75
13.8
81.6
13.6
482
.14
--
--
--
--
--
9.00
14.5
913
.09
1.01
1.82
2.5
19.6
375
.618
.01
78.9
17.4
80.5
16.9
81.0
16.6
82.5
16.3
83.1
16.1
83.5
15.9
883
.94
--
--
16.0
016
.84
15.3
41.
212.
183
24.2
974
.222
.46
77.4
21.4
979
.220
.880
.520
.381
.520
.082
.219
.782
.219
.582
.8-
--
-26
.83
19.8
918
.39
1.41
2.54
3.5
29.2
172
.96
27.0
876
.03
25.8
377
.96
24.9
479
.39
24.2
980
.47
23.7
981
.32
23.4
8223
.08
82.5
522
.44
83.7
--
42.7
322
.75
21.2
51.
622.
914
34.4
271
.71
31.9
475
.18
30.3
577
.14
29.2
278
.59
28.3
979
.71
27.7
480
.61
27.2
381
.35
26.8
281
.95
25.9
783
.17
25.0
784
.04
62.7
825
.69
24.1
9
S ync
rude
Cel
l B M
ateria
l Par
amete
rsSa
nd C
apQu
iesc
ent C
onso
lidati
on 1
5 ye
ars o
f inf
illin
g at v
ario
us lo
adin
g rate
s25
yrs p
ost f
ill35
yrs p
ost f
ill30
yrs p
ost f
ill5
yrs p
ost f
ill10
yrs p
ost f
ill15
yrs p
ost f
ill20
yrs p
ost f
illUl
timate
Hei
ght
50 yr
s pos
t fill
80 yr
s pos
t fill

Tec
hnic
al G
uide
fo
r F
luid
Fin
e T
ailin
gs M
anag
emen
t
App
endi
x A
: Coh
esiv
e D
epos
it M
odel
ling
Aug
ust 3
0, 2
012
P
age
A-1
0
Tab
le A
-6
Pre
dic
ted
Co
nso
lidat
ion
Beh
avio
ur
for
20 y
ears
of
Dep
osi
t F
illin
g a
t V
ario
us
Lo
adin
g R
ates
Usi
ng
Sh
ell C
ell 1
M
ater
ial P
aram
eter
s
T
able
A-7
P
red
icte
d C
on
solid
atio
n B
ehav
iou
r fo
r 20
yea
rs o
f D
epo
sit
Fill
ing
at
Var
iou
s L
oad
ing
Rat
es U
sin
g S
yncr
ud
e C
ell B
M
ater
ial P
aram
eter
s
Fine
So
lids
Load
ing
Rate
Dry
T/m2
Total
Sol
ids
Load
ing
Rate
Dry
T/m2
Slur
ry
Rise
Rate
(m
)De
posit
he
ight
(m)
Avg.
Solid
s Co
nten
tDe
posit
he
ight
(m)
Avg.
So
lids
Conte
ntD
epos
it he
ight
(m)
Avg.
So
lids
Conte
ntD
epos
it he
ight
(m)
Avg.
Solid
s Co
ntent
Depo
sit
heig
ht (m
)
Avg
. So
lids
Conte
ntDe
posit
he
ight
(m)
Avg.
Solid
s Co
ntent
Depo
sit
heig
ht (m
)
Avg
. So
lids
Conte
nt
Depo
sit
heig
ht (m
)
Avg.
Solid
s Co
nten
tDe
posi
t he
ight
(m)
Avg.
Solid
s Co
nten
t
Year
s to
post
fil lt
o 1.
5 m
of
resi
dual
se
ttlem
ent
Heig
ht to
1.5
m
of re
sidua
l se
ttlem
ent
Fina
l He
ight
(m)
0.82
51.
492
21.2
775
.519
.35
79.8
18.6
781
.08
18.3
82.0
18.0
282
.58
17.8
582
.91
17.7
483
.17
--
--
9.29
19.0
417
.54
1.01
1.82
2.5
26.6
774
.824
.31
78.6
23.3
780
.222
.881
.222
.481
.922
.182
.4-
--
--
-14
.39
22.8
721
.37
1.21
2.18
332
.96
73.5
30.0
877
.228
.79
79.0
28.0
80.2
27.4
81.1
26.9
81.8
26.6
82.3
26.4
82.7
--
25.1
126
.99
25.4
91.
412.
543.
539
.73
-35
.51
-22
.39
-33
.07
-32
.33
-31
.77
-31
.34
--
31-
-33
.68
31.0
929
.59
1.61
2.91
447
70.7
342
.91
74.4
140
.76
76.5
39.2
578
.04
38.1
379
.22
37.2
880
.14
36.6
280
.67
81.4
636
.09
34.4
783
.33
49.5
935
.17
33.6
7
Shel
l Cel
l1 M
ater
ial P
aram
eters
Sand
Cap
Quie
scen
t Con
solid
ation
Ultim
ate H
eigh
t
20
year
s of i
nfill
ing a
t var
ious
load
ing r
ates
25 ye
ars p
ost f
ill30
year
s pos
t fill
65 ye
ars p
ost f
ill5
yrs p
ost f
ill10
year
s pos
t fill
15 ye
ars p
ost f
ill20
year
s pos
t fill
35 y
ears
pos
t fill
Fine
So
lids
Load
ing
R
ate
Dry
T/m
2
Tota
l So
lids
Load
ing
Dry
Rat
e
T/m
2
Slur
ry
Ris
e R
ate
(m)
Dep
osit
heig
ht (m
)
Avg
. So
lids
Con
tent
Dep
osit
heig
ht
(m)
Avg
. So
lids
Con
tent
Dep
osit
heig
ht (m
)
Avg
. So
lids
Con
tent
Dep
osit
heig
ht (m
)
Avg
. So
lids
Con
tent
Dep
osit
heig
ht (m
)
Avg
. So
lids
Con
tent
Dep
osit
heig
ht (m
)
Avg
. So
lids
Con
tent
Dep
osit
heig
ht
(m)
Avg
. So
lids
Con
tent
Dep
osit
heig
ht (m
)
Avg
. So
lids
Con
tent
Dep
osit
heig
ht (m
)
Avg
. So
lids
Con
tent
Dep
osit
heig
ht (m
)
Avg
. So
lids
Con
tent
Yea
rs to
1.
5 m
of
resi
dual
se
ttlem
ent
Hei
ght t
o 1.
5 m
of
resi
dual
se
ttlem
ent
Fina
l H
eigh
t (m
)0.
825
1.49
220
.63
77.0
19.3
179
.718
.69
81.0
318
.382
.017
.97
82.6
417
.73
83.1
817
.55
83.6
1-
--
--
-16
.14
18.1
716
.67
1.01
1.82
2.5
26.0
775
.724
.47
78.3
23.6
379
.723
.080
.822
.681
.622
.282
.221
.982
.821
.783
.2-
--
-32
.00
21.8
220
.32
1.21
2.18
332
.28
74.4
30.4
176
.829
.378
.328
.579
.527
.880
.427
.381
.226
.981
.826
.682
.325
.883
.525
.184
.752
.57
25.7
424
.24
1.41
2.54
3.5
38.8
673
.05
36.6
875
.39
35.2
876
.98
34.1
878
.27
33.3
279
.31
32.6
380
.16
32.0
780
.86
31.6
181
.46
30.6
82.7
829
.51
84.2
776
.45
29.6
428
.14
1.61
2.91
445
.83
71.7
542
.274
.89
39.6
177
.66
39.6
77.6
638
.68
78.6
337
.95
79.4
37.3
680
.05
36.8
780
.59
35.8
281
.76
34.7
282
.311
0.00
33.5
232
.02
Sync
rude
Cel
l B M
ater
ial P
aram
eter
s20
yea
rs in
fillin
g at
var
ious
load
ing
rate
sSa
nd C
a pQ
uies
cent
Con
solid
atio
n35
pos
t fill
20 y
rs p
ost f
ill80
yrs
pos
t fill
5 yr
s po
st fi
ll10
yrs
pos
t fill
15 y
rs p
ost f
ill25
yrs
pos
t fill
30 y
rs p
ost f
ill50
yrs
pos
t fill
Ulti
mat
e H
eigh
t

Technical Guide
forFluid Fine Tailings Management
Appendix A: Cohesive Deposit Modelling
August 30, 2012 Page A-11
While the predictions provide a reasonable basis for planning, there remains a significant degree of uncertainty due to the extrapolation of both time and depth that must be made, as illustrated in Figure A-3. Performance measurement data from deeper demonstration and commercial deposits will provide the basis for increased accuracy of consolidation predictions, and hopefully also for the inclusion of creep data into the predictive models.
0
5
10
15
20
25
0 5 10 15 20 25 30
Consolidation Time, Years
Dep
osit
Dep
th,M
etre
s
Aurora Cell B& MRM Cell 1 Data
Commercial Deposits Modelling
Figure A-3 Thickened Tailings Test Deposit Depth and Time

Technical Guide
forFluid Fine Tailings Management
Appendix B: Monitoring Tailings Deposits
August 30, 2012 Page B-1
Appendix B Monitoring Tailings Deposits
The adaptive management approach requires a system of monitoring and assessment, relevant to management objectives, so that progress in meeting the objectives can be tracked. This appendix describes several of the monitoring methods currently used by oil sands operators. Further development of guidelines for monitoring methods will be necessary to provide consistency, accuracy and flexibility while incorporating the large body of existing data. The OSTC is working with the ERCB to develop guidelines for fines and strength measurement for tailings deposits. In addition, the ERCB has requested that the oil sands industry develop, to the extent practical, a standard tailings classifica-tion system.
In response, the OSTC is obtaining third-party assistance to complete this work. It is not expected that every operator will use the same procedure, especially for fines measurement where substantial existing data on ore fines have been collected using techniques developed by each operator. However, the current suite of methods needs to be documented and correlations established to allow comparison of data. Where possible, uniform strength measurement guidelines for similar deposits are desired.
As additional measurement requirements are identified to support the different deposit types described herein, the OSTC (to become the Tailings Environmental Priority Area of COSIA), is available and willing to work in partnership with the ERCB to expand guidelines as appropriate.
B.1 Surveys The surface topography of tailings ponds is surveyed to:
Assist in estimating tailings storage space.
Support calculating a site-wide material balance.
Track the progress of tailings construction activities for operational purposes (cell and beach construction, pipeline relocation, overburden dyke construction).
Survey techniques include traditional topographic ground survey, aerial photography stereo pairs and satellite imagery stereo pairs. Relatively recently, some operators have used aerial-mounted light detection and ranging (LiDAR) optical remote sensing technology that can measure the distance to a target by illuminating the target with light, often using pulses from a laser. Figure B-1 shows an aerial-mounted LiDAR and the resulting 3D surface of the topographic survey.
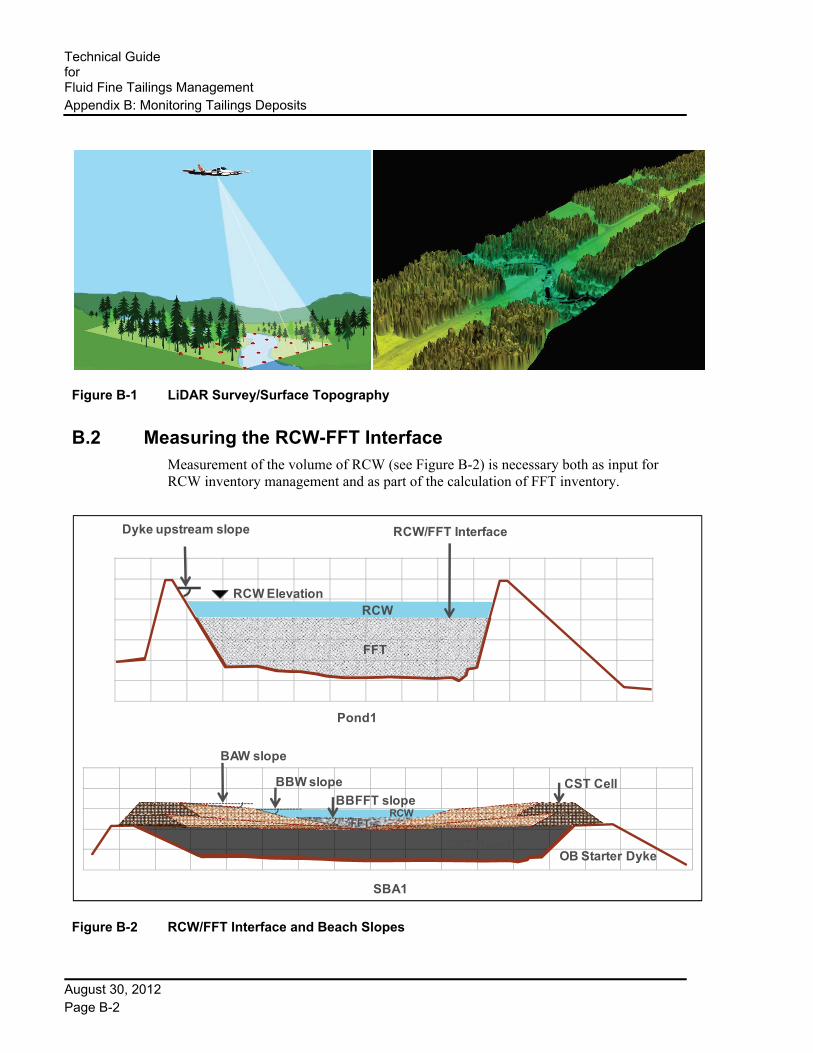
Technical Guide for Fluid Fine Tailings Management
Appendix B: Monitoring Tailings Deposits
August 30, 2012 Page B-2
Figure B-1 LiDAR Survey/Surface Topography
B.2 Measuring the RCW-FFT Interface Measurement of the volume of RCW (see Figure B-2) is necessary both as input for RCW inventory management and as part of the calculation of FFT inventory.
Figure B-2 RCW/FFT Interface and Beach Slopes
FFT
RCW
Pond1
RCW Elevation
RCW/FFT InterfaceDyke upstream slope
SBA1
BAW slope
BBW slope
BBFFT slope
CST Beach
CST Cell
OB Starter Dyke
FFTRCW

Technical Guide
forFluid Fine Tailings Management
Appendix B: Monitoring Tailings Deposits
August 30, 2012 Page B-3
A commercial grade Sound navigation and ranging (Sonar) tool is commonly used to measure the interface. The Sonar system uses a high frequency single-beam echo sounder with a 2.7-degree beam width and 200 kilohertz transducer. The depth of water is calculated by measuring the amount of time it takes for an emitted sound signal to “bounce off” the “bottom” or interface and return to the transducer. A Global Positioning System (GPS) is used for horizontal position data (latitude and longitude). The depth-to-interface measurements are checked by measuring solids content versus depth at an appropriate number of locations on the pond.
B.3 Measuring the Solid-Fluid Tailings Interface The interface between solid and fluid tailings (see Figure B-3) must be established to calculate the FFT inventory. Historically, the AK-97 sounding probe has commonly been used in the oil sands industry to define this interface. The probe is solid steel, 3.5 m long and 136 kg. It has a 3.2-cm tip diameter with a 60° cone.
The diameter increases to 10 cm 1.5 m above the tip. The probe is lowered using the winch of a sampling boat. Refusal is usually determined by the operators based on the tension of the winch cable, which decreases as the probe reaches the fluid to solid transition. Results show that sounding depth is well-correlated with increased in situ strength in the range of 2 kPa to 10 kPa.
Solid-Liquid Interface– Defined by Strength
DykeRecycle Water
MFT
FFT Transition Zone
FFT Top – Defined by Solids Content
Figure B-3 Solid-Fluid Tailings Interface

Technical Guide for Fluid Fine Tailings Management
Appendix B: Monitoring Tailings Deposits
August 30, 2012 Page B-4
The CT09 probe (see Figure B-4) is another tool that can be used to define the fluid-solid tailings interface. The CT09 is being adopted by all oil sands tailings operators to replace the AK97.
The CT09 probe is a drop-sounding tool designed to stop at the same pond bottom surface as historical drop sounders (i.e., the AK-97). However, this tool incorporates an instrumented CPT tip at the end of the probe. In this manner, tip resistance, pore pressure and inclination can be measured during the sounding in addition to the solid-fluid interface. Hence, the interface can be determined by looking at the CT09 data. Because the CT09 is a calibrated tool that displays depth versus data, interpretation is less subject to operator subjectivity. In addition, by inspecting the CT09 data versus depth, the nature of the refusal can be determined. One can determine if the probe stopped because of resistance from non-fluid tailings, or other reasons, such as probe inclination or bitumen layers.
Figure B-4 CT09 Sounding Probe
Because of the limitations of any rapid wireline tool, the refusal depth of any of the tools described is likely only accurate to +/- 50cm. Provided that an appropriate number of probe locations are selected, this accuracy is sufficient to provide a reasonable measurement of FFT inventory.
B.4 Sampling Fluid and solid tailings deposits can be sampled to determine such properties as solids and bitumen content, strength, SFR, methylene blue index, and water and pore water chemistry. Different sampling techniques are required for RCW (<1 to 2% fines), fluid fines and non-fluid soil deposits.
B.4.1 Sampling the Clear Water Zone
Sampling of the CWZ is necessary as it typically holds most of the RCW inventory on site. The sampling program should be designed to provide a good representation of CWZ chemistry and TSS to assess RCW quality in terms of solids and bitumen content.

Technical Guide
forFluid Fine Tailings Management
Appendix B: Monitoring Tailings Deposits
August 30, 2012 Page B-5
A wireline fluid sampler is commonly used in the oil sands industry to obtain samples from the CWZ. The wireline sampler has two parts: a lower portion consisting of a cylindrical chamber, which collects the sample, and an upper weight that keeps the sampler in an upright position as it is lowered to the sample depth. The wireline sampler uses compressed gas, typically nitrogen, to keep the sample chamber closed until the desired sample depth is reached. Once at the desired depth, the nitrogen gas is turned off and the surrounding water enters the sampler.
B.4.2 Sampling the FFT Zone
Below the CWZ, there is a deposit of FFT, which might be TFT, MFT, TT, CT or NST. There are a variety of samplers that can be used to sample these materials; not all are well suited to all types of FFT. Discussed herein are the wireline sampler, Shelby tube and the Cyre sampler.
The wireline sampler can be used to collect samples of low solids content, fines-dominated FFT, such as TFT, MFT, and possibly TT. Its operation is discussed in the previous section.
The Shelby tube sampler (see Figure B-5) consists of a thin-walled tube with a cutting edge at the toe. A sampler head attaches the tube to the drill rod, and contains a check valve and pressure vents. Generally used in cohesive soils, this sampler is advanced into the soil layer. The vacuum created by the check valve and cohesion of the sample in the tube cause the sample to be retained when the tube is withdrawn. This sampler works well in fines-dominated FFT deposits that have begun to develop some strength, but does not work well if the material is too granular or too soft.
Figure B-5 Shelby Tube Sampler
Another tool that can be used to sample FFT, which can handle softer materials than the Shelby tube, is the Cyre sampling tool. The Cyre sampler is a modified piston sampler that performs very well in very soft to firm, fines-dominated deposits. It can also be pushed through fines-enriched sands that have strengths up to that of loose sand. A 1 m long sample can be obtained from a desired elevation.

Technical Guide for Fluid Fine Tailings Management
Appendix B: Monitoring Tailings Deposits
August 30, 2012 Page B-6
As with other types of piston samplers, the sample is taken by pushing a cylinder into the deposit while an internal ram is kept at a fixed elevation. Samples obtained using the Cyre sampler are shown in Figure B-6.
Figure B-6 Typical Samples Obtained with the Cyre Sampler Courtesy of Geoforte Services Ltd.
The Cyre sampler obtains excellent samples in fines-dominated materials. However, in fines-enriched sand deposits, such as CT, it suffers from the same deficiency as other piston samples in granular material – it can cause a densification/loss of water during sampling. It is also slow and best used when a core showing detailed layering is required.
Both the Shelby tube and Cyre samplers can be used in fines-enriched sand FFT deposits. While their accuracy in regards to measuring density may be limited, they are still useful in collecting samples for accurate determination of geotechnical fines content and SFR.
There are few methods of collecting samples of fines-enriched sand (such as CT or NST) that are sufficiently undisturbed that the sample’s solids content can be determined accurately. One method is rapid freezing using a nitrogen probe. This technique is time consuming and expensive, but could be used to calibrate other tools that either sample for density or measure density in situ (the latter are discussed further in Section B.5).
B.4.3 Sampling the “Pond Bottom” (Sand Cell and Beach Deposits)
Many methods are available for advancing boreholes and collecting samples in fines-enriched sand deposits (such as BAW, BBW, BBMFT). Two common tools used for sampling these materials are a Shelby tube sampler (for the more clayey or silty deposits, with strengths >>5 kPa) and a sonic AquaLock sampler (applicable to most materials).
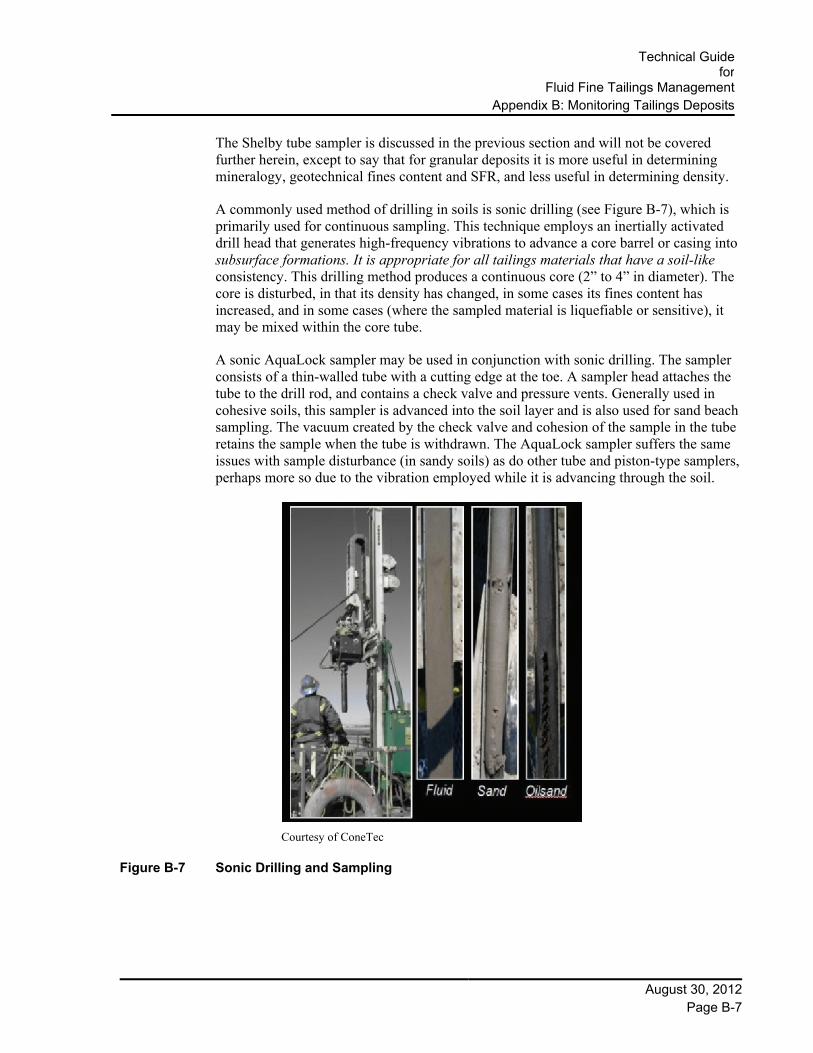
Technical Guide
forFluid Fine Tailings Management
Appendix B: Monitoring Tailings Deposits
August 30, 2012 Page B-7
The Shelby tube sampler is discussed in the previous section and will not be covered further herein, except to say that for granular deposits it is more useful in determining mineralogy, geotechnical fines content and SFR, and less useful in determining density.
A commonly used method of drilling in soils is sonic drilling (see Figure B-7), which is primarily used for continuous sampling. This technique employs an inertially activated drill head that generates high-frequency vibrations to advance a core barrel or casing into subsurface formations. It is appropriate for all tailings materials that have a soil-like consistency. This drilling method produces a continuous core (2” to 4” in diameter). The core is disturbed, in that its density has changed, in some cases its fines content has increased, and in some cases (where the sampled material is liquefiable or sensitive), it may be mixed within the core tube.
A sonic AquaLock sampler may be used in conjunction with sonic drilling. The sampler consists of a thin-walled tube with a cutting edge at the toe. A sampler head attaches the tube to the drill rod, and contains a check valve and pressure vents. Generally used in cohesive soils, this sampler is advanced into the soil layer and is also used for sand beach sampling. The vacuum created by the check valve and cohesion of the sample in the tube retains the sample when the tube is withdrawn. The AquaLock sampler suffers the same issues with sample disturbance (in sandy soils) as do other tube and piston-type samplers, perhaps more so due to the vibration employed while it is advancing through the soil.
Courtesy of ConeTec
Figure B-7 Sonic Drilling and Sampling

Technical Guide for Fluid Fine Tailings Management
Appendix B: Monitoring Tailings Deposits
August 30, 2012 Page B-8
B.5 In situ Testing In situ testing is usually part of a tailings site investigation program and includes:
Cone penetration tests (with pore pressure and natural gamma measurements) Ball penetration tests Vane shear tests Geophysical tests
B.5.1 Cone Penetration Tests
In a CPT test, a rod with an instrumented, cone-shaped tip is pushed into the ground at a constant rate while recording cone tip resistance (qt), sleeve friction (fs), dynamic pore pressure (u), and in some cases, passive gamma counts. Gamma radiation is associated with the radioactive decay of potassium-40 found in clay minerals such as illite. Figure B-8 shows a typical test-hole CPT profile (with passive gamma).
The data collected in a CPT test has been correlated to engineering properties in a large number of soil types, and thus can be used to determine soil stratigraphy, relative density, strength and fluid pressures. In sand deposits, the CPT can give an accurate measurement of the “state” of the soil (whether or not it is liquefiable). In fluid materials, total stress, unit weight and solids content can be calculated using the equilibrium pore water pressure profile. In non-fluid materials, the CPT can be pushed through hard layers, and detect soft high fines content layers below.
The peak undrained shear strength, , can be estimated according to the following
equation:
where = total cone resistance
= vertical total stress (or overburden pressure)
= cone factor (or bearing capacity factor)
The cone factor, , is approximately equal to 15 ± 5. It is known that tends to
increase with increasing plasticity index and to decrease with increasing soil sensitivity.
uS
ktvtu NqS /)(
tq
v
ktN
ktN ktN
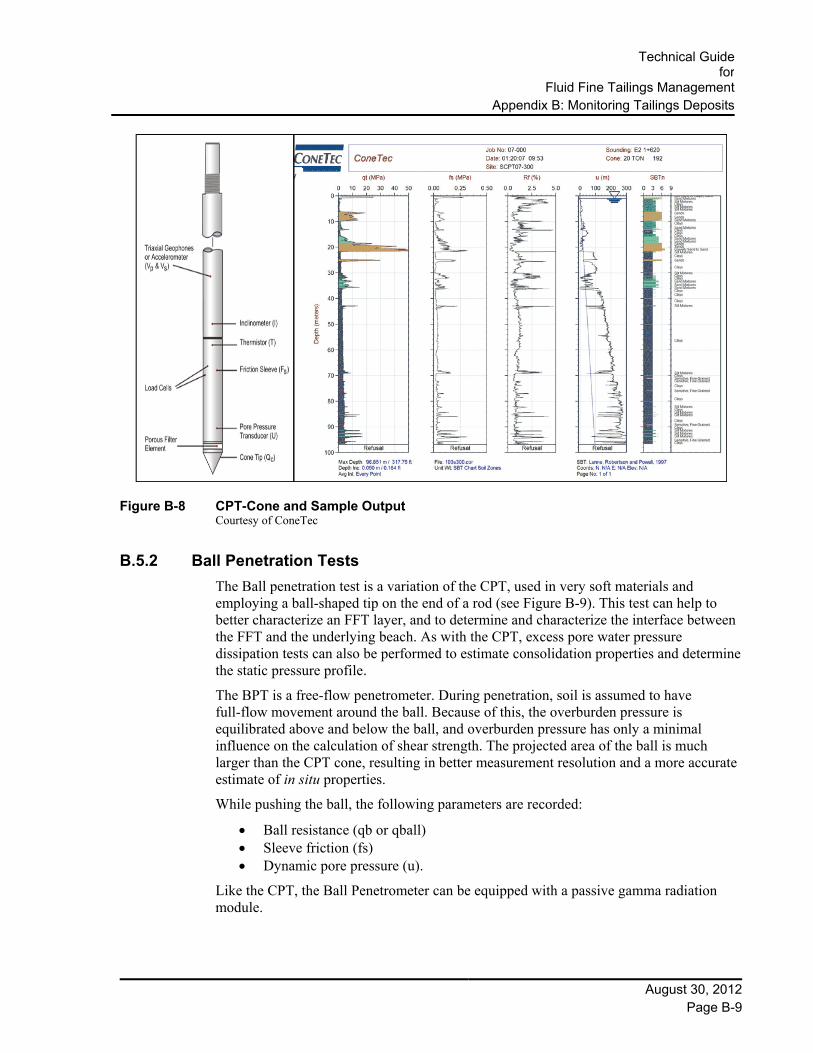
Technical Guide
forFluid Fine Tailings Management
Appendix B: Monitoring Tailings Deposits
August 30, 2012 Page B-9
Figure B-8 CPT-Cone and Sample Output Courtesy of ConeTec
B.5.2 Ball Penetration Tests
The Ball penetration test is a variation of the CPT, used in very soft materials and employing a ball-shaped tip on the end of a rod (see Figure B-9). This test can help to better characterize an FFT layer, and to determine and characterize the interface between the FFT and the underlying beach. As with the CPT, excess pore water pressure dissipation tests can also be performed to estimate consolidation properties and determine the static pressure profile.
The BPT is a free-flow penetrometer. During penetration, soil is assumed to have full-flow movement around the ball. Because of this, the overburden pressure is equilibrated above and below the ball, and overburden pressure has only a minimal influence on the calculation of shear strength. The projected area of the ball is much larger than the CPT cone, resulting in better measurement resolution and a more accurate estimate of in situ properties.
While pushing the ball, the following parameters are recorded:
Ball resistance (qb or qball) Sleeve friction (fs) Dynamic pore pressure (u).
Like the CPT, the Ball Penetrometer can be equipped with a passive gamma radiation module.

Technical Guide for Fluid Fine Tailings Management
Appendix B: Monitoring Tailings Deposits
August 30, 2012 Page B-10
Figure B-9 Vane Shear Test/Ball Penetration Test Courtesy of ConeTec
The BPT test will produce an estimate of peak undrained shear strength during its initial push through the soil. The test equipment can be raised and lowered several times, remolding the surrounding soil in the process, with subsequent pushes providing an estimate of the remolded undrained shear strength.
B.5.3 Vane Shear Tests
The vane shear test is an in situ geotechnical testing method used to estimate the undrained shear strength of fully saturated clays with minimal disturbance. The test is widely used in geotechnical investigations. The vane shear test (VST) consists of two steps.
First, a four-bladed vane (see Figure B-9) is inserted into the sediment to the desired test depth, and then rotated at a constant slow rate, while torque is measured continuously. Torque increases until the material fails, at which point the torque starts to decrease. The maximum applied torque is then used to determine the peak vane shear strength of the soil.
Second, the vane is rotated 10 times rapidly by hand, to remould the soil surrounding the vane. The slow, constant rotation is then resumed to determine the remoulded shear strength. The sensitivity of the soil is defined as the ratio of the peak to remoulded strengths. Figure B-10 shows typical stress-strain behaviour of an undrained soil during a vane shear test. It can be seen that the initial peak shear strength is 4 kPa with a remoulded strength less than 0.5 kPa, and a sensitivity of about 10.

Technical Guide
forFluid Fine Tailings Management
Appendix B: Monitoring Tailings Deposits
August 30, 2012 Page B-11
The VST is currently the standard for soil shear strength tests in oil sands tailings, but is somewhat slow and costly. It is possible that the faster BPT test might be run to estimate the undrained shear strength (Su) of a fine-grained material, replacing the need to test the entire deposit with the vane shear device. This would require comparative testing and correlations to demonstrate accuracy.
Figure B-10 Vane Shear Test Results
B.5.4 Geophysical Tests
There are several geophysical tests that can be used to measure (primarily) in situ density, which might provide a higher level of accuracy in fines-enriched deposits than the in situ sampling techniques described earlier. There are five geophysical tools that could be used to measure FFT density: natural gamma, gamma-gamma, neutron, compression wave velocity and TDR. These are described below. It is assumed that for FFT deposits, these tools or probes would be lowered using a wireline setup, or pushed through the soil using a CPT-like rod.

Technical Guide for Fluid Fine Tailings Management
Appendix B: Monitoring Tailings Deposits
August 30, 2012 Page B-12
Radioactivity and Geophysical Logging
Radioactivity is the emission of electromagnetic energy or a stream of particles from an atom. The electromagnetic rays are also known as gamma rays. These emissions come from unstable nuclei or radioactive sources. Geophysical methods focus on the transmission of gamma rays from unstable nuclei or from the stimulation of stable nuclei with gamma rays or neutrons. Gamma ray logging is generally performed by a scintillation counter, which uses a special crystal to generate an electric current that can be counted. The radioactive methods are generally used in rock formations and their application in soft soils is limited.
Natural Gamma Ray Logging
Small concentrations of naturally occurring radioactive materials (NORMS) exist in varying concentrations in most soil types. The scintillation counter is fixed to a sonde and is lowered down the borehole at a constant rate. Natural gamma rays are measured for a set counting time, typically 2 to 5 seconds. The resulting count is the average of the emitted radiation for the counting period. Typically clays produce the highest number of counts.
Gamma-Gamma Logging
The sonde for gamma-gamma logging is similar to that for natural gamma ray logging, except that it contains a source of gamma radiation. The sonde has a lead covering which has two windows in it to allow gamma emission and collection (of a back scattered radiation). The lead covering greatly reduces detection of the background radiation present within the formation. The interaction of the gamma rays is directly proportionally to the bulk density of the soil.
Neutron Logging
High energy neutrons are emitted from a source within the sonde into the soil. The neutrons then collide with the nuclei of various atoms. The energy lost during these collisions is greatest when the nuclei and neutrons are close to the same mass. Therefore the rate of loss of the neutrons is proportional to the density of the material. The primary response is to hydrogen, which means that the logging is most sensitive to water. Newer systems use compensated neutron logging, which reduces the effects of salinity and clay on the results.
Sonic Logging
Another borehole wire line measurement technique is sonic logging. Sonic logging measures the compression wave (P-wave) velocity of a formation. P-waves will travel faster through soil than water or oil. The resulting wave speed in the fluid and solid can then be correlated to porosity. Shear waves (S-waves) are also produced and in some applications are measured as well; however shear waves cannot transmit through fluids due to the lack of shear strength of the medium. S-waves can be used in conjunction with P-waves to assess the elastic modulus of a soil as well as to reduce errors introduced due to the presence of gas. Measurement is made by emitting a pulse from two points on a sonic sonde. The pulses are alternated to reduce orientation errors from the sonde not being parallel to the borehole.

Technical Guide
forFluid Fine Tailings Management
Appendix B: Monitoring Tailings Deposits
August 30, 2012 Page B-13
Electrical Capacitance Sensors
An alternative to measuring radioactive sources within the ground is to measure the dielectric permittivity of the surrounding soil. The sensors work by charging the surrounding soil as a capacitor. The presence of water has a large impact on the sensor readings since the dielectric permittivity of water is 80 εa (apparent dielectric permittivity) compared to a value of 4 to 8 εa for soil and 1 εa for air. Some sensors sample at higher frequencies around 70 MHz, which reduces the impact of salinity on the readings. While the sensors are designed for long term use, they can be pushed into undisturbed, loose soils to obtain readings.
Table B-1 Comparison of Geophysical Monitoring Techniques
Sensor Type Primary Measurement
Sensing Area Advantages Disadvantages
Natural Gamma Ray Logging
Gamma Ray Count 30 cm uncased, 20 cm cased borehole
Can be used to estimate the volume of clays.
-Not sensitive to porosity changes and the presence of water -More useful to determine lithology. -Relative measurement; requires a clay free zone for zeroing.
Gamma-Gamma Ray Logging
Electron Density 15 cm uncased, limited in cased boreholes
Electron density can be directly related to porosity and bulk density.
-Difficult to obtain readings through casing. -Results can be skewed by saline environments. -Requires estimate of fluid and matrix density.
Neutron-Gamma Ray Logging
Gamma Radiation 60 cm, 20 cm in high water content soils
-Measurements are directly tied to the presence of hydrogen. -Can be related to porosity.
-Presence of gypsum and shale can adversely affect results.
Electrical Capacitance Sensors
Dielectric Permittivity 10 cm -Does not require a borehole. -Sensors can be installed before deposition or pushed into deposits. -Results are directly proportional to volumetric water content and density. -Relatively low cost.
-Require calibration to return accurate results at high water contents. -Accuracy is much lower (15%) at volumetric water contents above 40%.

Technical Guide for Fluid Fine Tailings Management
Appendix B: Monitoring Tailings Deposits
August 30, 2012 Page B-14
B.6 Laboratory Testing – Analytical Methods
B.6.1 Laboratory Test for Oil, Water, Solids
OWS contents of the tailings samples are typically determined using the Dean Stark distillation method. This procedure is well established for use in oil sands.
B.6.2 Laboratory Test for Particle Size Distribution
Many techniques have been devised for determining particle size distributions of fine grained solids. The most common ones used in the oil sands industry are wet or dry sieve/hydrometer and laser diffraction.
A dry sieve analysis involves a nested column of sieves with wire mesh cloth (screen). A representative weighed sample is poured into the top sieve which has the largest screen openings. Each lower sieve in the column has smaller openings than the one above. At the base is a round pan, called the receiver (see Figure B-11).
The column is typically placed in a mechanical shaker. The shaker shakes the column, usually for some fixed amount of time. After the shaking is complete the material on each sieve is weighed. The weight of the sample of each sieve is then divided by the total weight to give a percentage retained on each sieve.
A wet sieving process is set up like a dry process: the sieve stack is clamped onto the sieve shaker and the sample is placed on the top sieve. Above the top sieve a water-spray nozzle is placed which supports the sieving process additionally to the sieving motion.
Rinsing continues until the liquid discharged through the receiver is clear. Sample residue on the sieves must be dried and weighed. It is very important when wet sieving not to change sample volume (no swelling, dissolving or reaction with the liquid).
Figure B-11 Sieves and Sieve Shaker Apparatus

Technical Guide
forFluid Fine Tailings Management
Appendix B: Monitoring Tailings Deposits
August 30, 2012 Page B-15
Material passing through the sieve with the smallest openings (typically, 74 μm) is collected and its grain size is measured in a hydrometer. A small amount of the sample is mixed with water (at low solids content), along with a dispersant, shaken up, and then left in a column to settle. Larger (fine sand and silt size) particles settle more quickly and smaller (fine silt and clay size) particles settle more slowly. As the individual grains settle through the column, the average density of the mixture changes. Measuring the change of column density with time allows one to calculate the grain size distribution.
The laser diffraction technique requires that the sample be dispersed at a low concentration in a suitable liquid. The mixture is then passed through a beam of a monochromatic light, usually a laser. The light scattered by the particles, at various angles, is measured by multi-element detectors (see Figure B-12) and numerical values relating to the scattering pattern are recorded for subsequent analysis. These numerical scattering values are then transformed, using an appropriate optical model and mathematical procedure, to yield the proportion of the total volume of particles to a discrete number of size classes forming a volumetric particle size distribution (PSD).
Figure B-12 Hydrometer Apparatus
The laser diffraction technique (see Figure B-13) for the determination of PSD is based on the phenomenon that particles scatter light in all directions with an intensity pattern that is dependent on particle size. Figure B-14 shows this dependency in the scattering patterns for two sizes of spherical particles. In addition to particle size, particle shape and the optical properties of the particulate material influence the scattering pattern.

Technical Guide for Fluid Fine Tailings Management
Appendix B: Monitoring Tailings Deposits
August 30, 2012 Page B-16
Figure B-13 Laser Diffraction Apparatus for Particle Size Analysis
Figure B-14 Scattering Pattern for Small Particle (a) and Larger Particle (b)
B.6.3 Laboratory Test for Clay Plasticity and Activity
There are two sets of tests that can be used to measure various aspects of clay plasticity. The most common one is the Atterberg Limit test, which measures a soils liquid limit (the state where it transitions from a liquid to a plastic solid) and the plastic limit (the state where it transitions from a plastic to a non-plastic solid). These limits are typically reported in terms of geotechnical water content. The test method is prescribed in ASTM D4318-10, although some modifications are made for oil sands tailings to address the issue of the effects of bitumen. The Atterberg limits also provide an estimate of remolded shear strength, with the strength at the liquid limit being in the range of 1 to 2 kPa, and the strength at the plastic limit being about 100 kPa.
The plasticity index of a soil is the difference between the liquid and plastic limits, and combined with the clay content of the soil, a calculation can be made of clay activity:
Activity = Plasticity Index/% clay content
The higher the activity of the clay, i.e., the higher the plasticity index compared to the amount of clay in the soil, the more “active” the clay mineralogy.
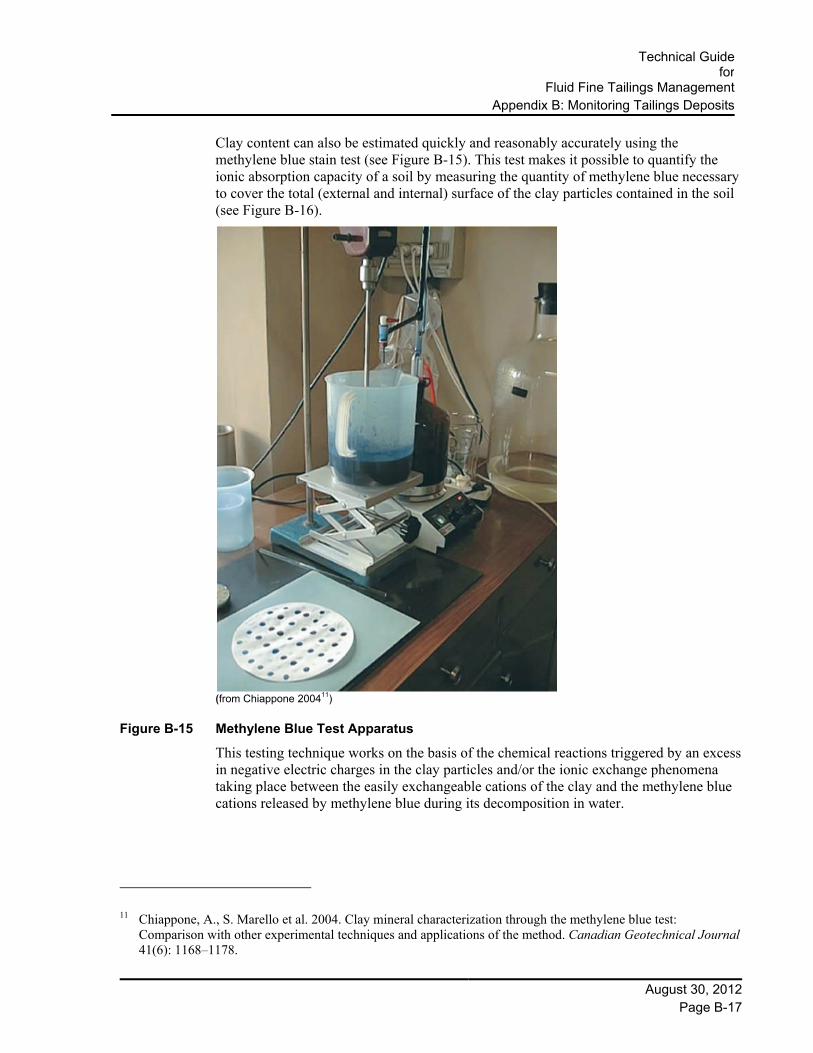
Technical Guide
forFluid Fine Tailings Management
Appendix B: Monitoring Tailings Deposits
August 30, 2012 Page B-17
Clay content can also be estimated quickly and reasonably accurately using the methylene blue stain test (see Figure B-15). This test makes it possible to quantify the ionic absorption capacity of a soil by measuring the quantity of methylene blue necessary to cover the total (external and internal) surface of the clay particles contained in the soil (see Figure B-16).
(from Chiappone 200411)
Figure B-15 Methylene Blue Test Apparatus
This testing technique works on the basis of the chemical reactions triggered by an excess in negative electric charges in the clay particles and/or the ionic exchange phenomena taking place between the easily exchangeable cations of the clay and the methylene blue cations released by methylene blue during its decomposition in water.
11 Chiappone, A., S. Marello et al. 2004. Clay mineral characterization through the methylene blue test:
Comparison with other experimental techniques and applications of the method. Canadian Geotechnical Journal 41(6): 1168–1178.
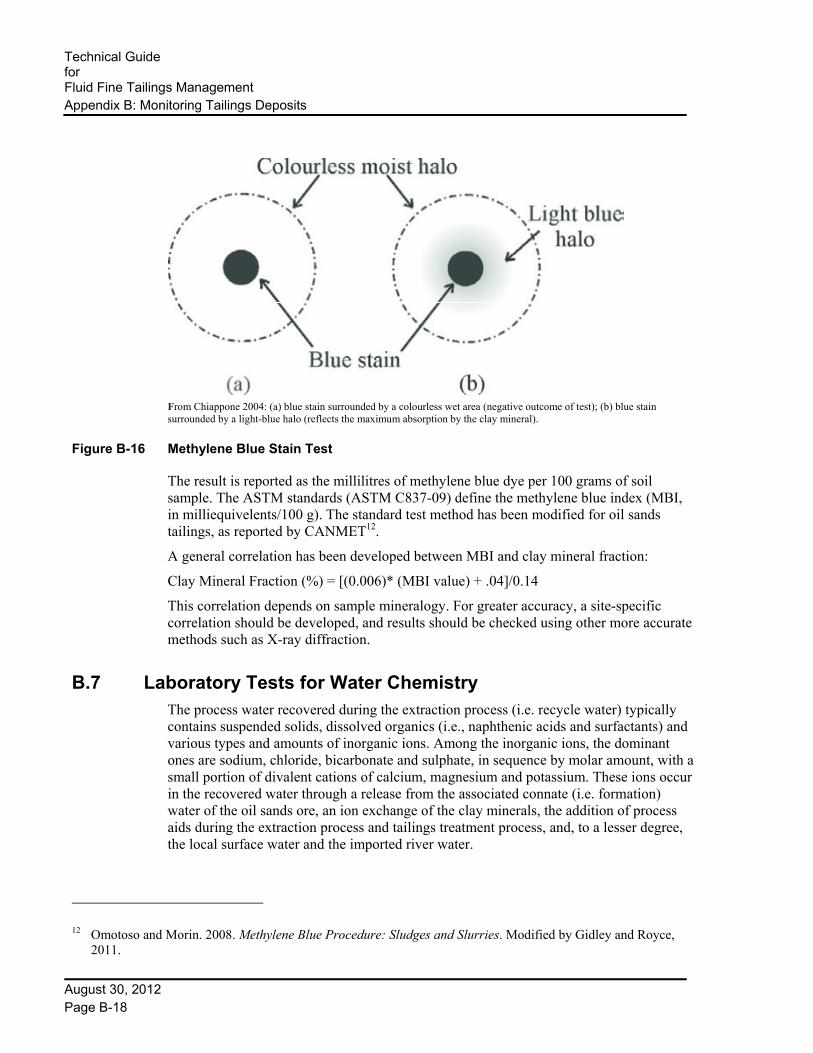
Technical Guide for Fluid Fine Tailings Management
Appendix B: Monitoring Tailings Deposits
August 30, 2012 Page B-18
From Chiappone 2004: (a) blue stain surrounded by a colourless wet area (negative outcome of test); (b) blue stain surrounded by a light-blue halo (reflects the maximum absorption by the clay mineral).
Figure B-16 Methylene Blue Stain Test
The result is reported as the millilitres of methylene blue dye per 100 grams of soil sample. The ASTM standards (ASTM C837-09) define the methylene blue index (MBI, in milliequivelents/100 g). The standard test method has been modified for oil sands tailings, as reported by CANMET12.
A general correlation has been developed between MBI and clay mineral fraction:
Clay Mineral Fraction (%) = [(0.006)* (MBI value) + .04]/0.14
This correlation depends on sample mineralogy. For greater accuracy, a site-specific correlation should be developed, and results should be checked using other more accurate methods such as X-ray diffraction.
B.7 Laboratory Tests for Water Chemistry The process water recovered during the extraction process (i.e. recycle water) typically contains suspended solids, dissolved organics (i.e., naphthenic acids and surfactants) and various types and amounts of inorganic ions. Among the inorganic ions, the dominant ones are sodium, chloride, bicarbonate and sulphate, in sequence by molar amount, with a small portion of divalent cations of calcium, magnesium and potassium. These ions occur in the recovered water through a release from the associated connate (i.e. formation) water of the oil sands ore, an ion exchange of the clay minerals, the addition of process aids during the extraction process and tailings treatment process, and, to a lesser degree, the local surface water and the imported river water.
12 Omotoso and Morin. 2008. Methylene Blue Procedure: Sludges and Slurries. Modified by Gidley and Royce,
2011.

Technical Guide
forFluid Fine Tailings Management
Appendix B: Monitoring Tailings Deposits
August 30, 2012 Page B-19
The ionic content of the recovered water increases as a consequence of oil sands plants operating under a policy of zero water discharge to the environment. There is no large-scale treatment of recovered process water available to reduce the ionic loading. Since an excessive level of some inorganic ions can impact extraction, it is important to monitor ion concentrations in the RCW.
A broad range of laboratory tests can be done on RCW and tailings pore water samples. Table B-2 lists the most common ones for monitoring RCW quality. (Additional metal analyses are used for environmental assessment.)
Table B-2 Laboratory Tests for Recycle Water Quality
Test Rational
Cl- Indicator for overall water chemistry, important for understanding toxicity, indicator of -connate water.
Ca2+, Mg2+ High levels will increase risk of scaling.
Na+ High levels are used in extraction for clay dispersion.
K+ High levels will coagulate clays, and cause higher viscosity and extraction issues.
pH Good range is 8 to 9.5. PH>9.5 causes emulsification of oil with water lower recovery. PH<8 causes poor recovery because clays are not dispersed.
TSS Higher levels reduce extraction recovery performance
Temperature Required for heat balance.
TDS Indicator of total conductivity. Higher levels reduce extraction performance
SO42- Higher levels cause scaling, issues in extraction, lower recovery.
NO32- Corrosion indicator.
HCO3-, CO3
2- High levels are good for extraction. High levels lead to scaling, lower heat exchanger efficiency and corrosion.
Dissolved Oxygen High levels escalate corrosion.
Biological Oxygen Demand (BOD) Environmental concerns.
Fe2+, Fe3+, Mn2+ Important for monitoring corrosion.

Technical Guide for Fluid Fine Tailings Management
Appendix B: Monitoring Tailings Deposits
August 30, 2012 Page B-20
B.8 Sounding, Sampling and In situ Measurement Techniques For a summary of common sampling and measurement techniques, see Table B-3.
Table B-3 Common Sampling and Measurement Techniques
Item Technique
Topographic surface Aerial survey (LiDAR): Land-based surveys, land-based LiDAR.
RCW/FFT interface Sonar , Geoforte CWZ tool.
Hard bottom CT09, AK-97, Geoforte solid-bottom sounding tool.
RCW samples
Wireline sampling system. In-line samplers.
FFT samples Wireline sampling system, Cyre sampler.
TT, NST, CT samples Shelby tube sampler, sonic AquaLock sampler, liquid nitrogen probe.
Shear strength CPT-Ball, CPT- Cone, VST (for calibration).
In situ geophysical methods Gamma, Gamma-gamma, neutron, compression wave velocity, TDR
OWS Dean Stark.
PSD Wet sieve or dry sieve and hydrometer (for grains <45 µm). Laser diffraction for full grain distribution or for grains <45 µm. Methylene blue for clay content
Clay activity Clay content (variety of methods) and Plasticity Index
RCW chemistry Standard analytical chemistry methods.
B.9 Data Storage, Analysis and Stratigraphic Modelling
B.9.1 Stratigraphic Modelling
Data collected during the site investigation program (aerial survey, sounding, in situ tests, sampling and laboratory analysis) is typically stored in a database so that it can be analyzed and used for comparisons with results from previous investigations.
The data is also used to determine a stratigraphic model and establish properties for the tailings deposits. A commonly used method is to establish a 3D block model. The model is used to estimate the properties of all tailings deposits in terms of volume, OWS, PSD, SFR, fines content and strength. Figure B-17 shows a typical cross-section of a 3D tailings block model for a cohesive deposit showing the stratigraphy of the solids concentration by weight and shear strength. A 3D block model is one of several methods available to consider spatial distribution of the tailings deposit properties. Other proprietary spatial models may be more flexible and provide better spatial modelling of fluid tailings properties.
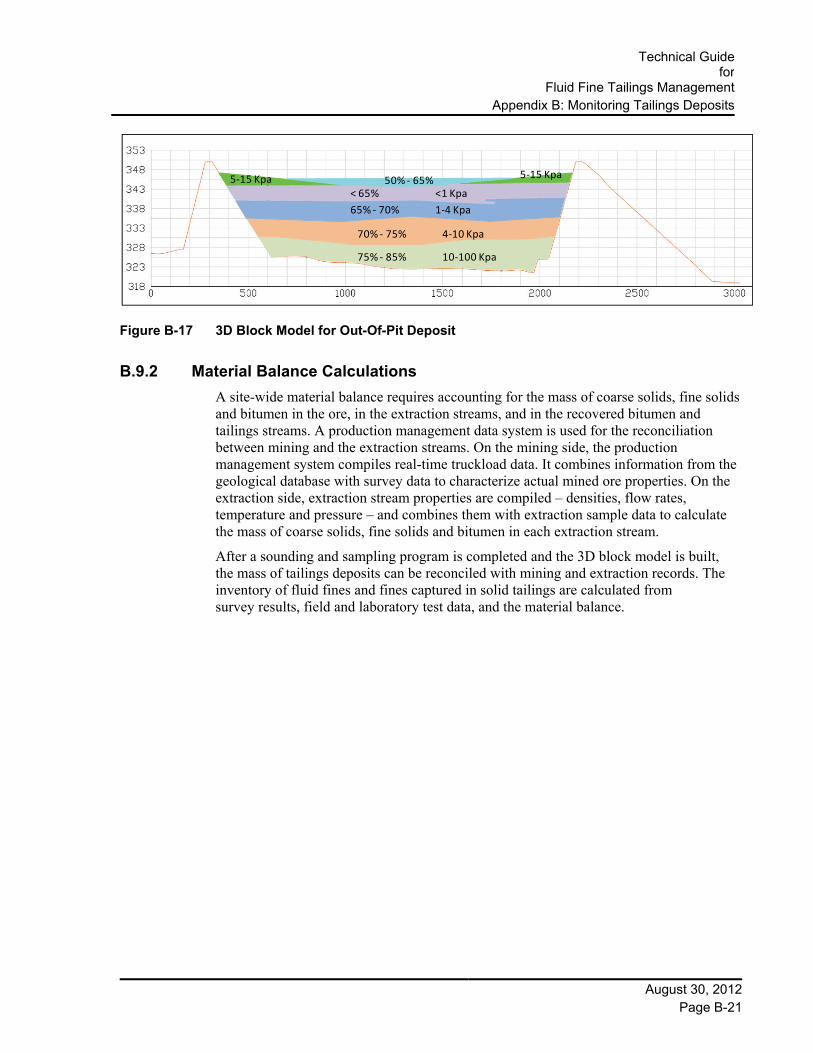
Technical Guide
forFluid Fine Tailings Management
Appendix B: Monitoring Tailings Deposits
August 30, 2012 Page B-21
Figure B-17 3D Block Model for Out-Of-Pit Deposit
B.9.2 Material Balance Calculations
A site-wide material balance requires accounting for the mass of coarse solids, fine solids and bitumen in the ore, in the extraction streams, and in the recovered bitumen and tailings streams. A production management data system is used for the reconciliation between mining and the extraction streams. On the mining side, the production management system compiles real-time truckload data. It combines information from the geological database with survey data to characterize actual mined ore properties. On the extraction side, extraction stream properties are compiled – densities, flow rates, temperature and pressure – and combines them with extraction sample data to calculate the mass of coarse solids, fine solids and bitumen in each extraction stream.
After a sounding and sampling program is completed and the 3D block model is built, the mass of tailings deposits can be reconciled with mining and extraction records. The inventory of fluid fines and fines captured in solid tailings are calculated from survey results, field and laboratory test data, and the material balance.
75% ‐ 85% 10‐100 Kpa
70% ‐ 75% 4‐10 Kpa
65% ‐ 70% 1‐4 Kpa
< 65% <1 Kpa50% ‐ 65% 5‐15 Kpa 5‐15 Kpa

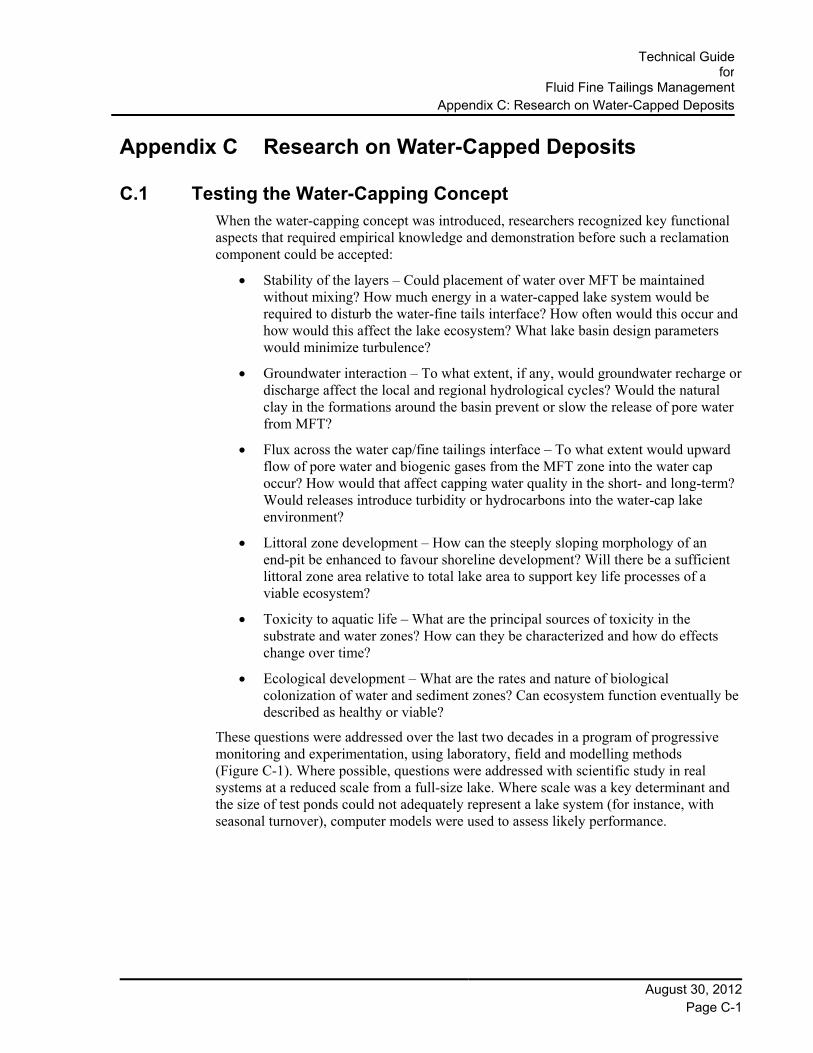
Technical Guide
forFluid Fine Tailings Management
Appendix C: Research on Water-Capped Deposits
August 30, 2012 Page C-1
Appendix C Research on Water-Capped Deposits
C.1 Testing the Water-Capping Concept When the water-capping concept was introduced, researchers recognized key functional aspects that required empirical knowledge and demonstration before such a reclamation component could be accepted:
Stability of the layers – Could placement of water over MFT be maintained without mixing? How much energy in a water-capped lake system would be required to disturb the water-fine tails interface? How often would this occur and how would this affect the lake ecosystem? What lake basin design parameters would minimize turbulence?
Groundwater interaction – To what extent, if any, would groundwater recharge or discharge affect the local and regional hydrological cycles? Would the natural clay in the formations around the basin prevent or slow the release of pore water from MFT?
Flux across the water cap/fine tailings interface – To what extent would upward flow of pore water and biogenic gases from the MFT zone into the water cap occur? How would that affect capping water quality in the short- and long-term? Would releases introduce turbidity or hydrocarbons into the water-cap lake environment?
Littoral zone development – How can the steeply sloping morphology of an end-pit be enhanced to favour shoreline development? Will there be a sufficient littoral zone area relative to total lake area to support key life processes of a viable ecosystem?
Toxicity to aquatic life – What are the principal sources of toxicity in the substrate and water zones? How can they be characterized and how do effects change over time?
Ecological development – What are the rates and nature of biological colonization of water and sediment zones? Can ecosystem function eventually be described as healthy or viable?
These questions were addressed over the last two decades in a program of progressive monitoring and experimentation, using laboratory, field and modelling methods (Figure C-1). Where possible, questions were addressed with scientific study in real systems at a reduced scale from a full-size lake. Where scale was a key determinant and the size of test ponds could not adequately represent a lake system (for instance, with seasonal turnover), computer models were used to assess likely performance.

Technical Guide for Fluid Fine Tailings Management
Appendix C: Research on Water-Capped Deposits
August 30, 2012 Page C-2
Laboratory Studies Hybrid Cross-Overs Test Pond Studies Naphthenic acids characterization Lead Investigator: Phil Fedorak Affiliation: University of Alberta Years of Research: 1992 - 2011
Fish toxicity Lead Investigator: George Dixon Affiliation: University of Waterloo Years of Research:1996 - 2011
Chemistry of water caps Lead Investigator: Mike MacKinnon Affiliation: Syncrude Research Years of Research:1989 - 2011
Shear strength of Syncrude MFT Lead Investigator: Greg Lawrence Affiliation: University of BC Years of Research:1978 - 1991
Nutrients and fertilization effects Lead Investigator: Warren Zyla Affiliation: University of Alberta Years of Research: 1994
PAHs in sediments & pore water Lead Investigator: Brian Brownlee Affiliation: National Water research Inst. Years of Research: 1995 - 1996
Methanogenisis in Syncrude MFT Lead Investigator: Phil Fedorak Affiliation: University of Alberta Years of Research: 1992 - 2011
Characterization of microbes Lead Investigator: Julia Foght Affiliation: University of Alberta Years of Research: 1985- 2011
Tree swallow reproduction Lead Investigator: Judy Smits Affiliation: University of Saskatchewan Years of Research:1997 - 2011
Small mammal toxicity Lead Investigator: Karsten Liber Affiliation: University of Saskatchewan Years of Research:2000
Plankton community analysis Lead Investigator: Ralph Smith Affiliation: University of Waterloo Years of Research: 1997 - 2011
Macrophyte growth Lead Investigator: Dave Barton Affiliation: University of Waterloo Years of Research: 1997
Benthic community analysis Lead Investigator: Jan Ciborowski Affiliation: University of Windsor Years of Research: 1996 - 2011
Dates identify the year when research was initiated or ponds were constructed. Text boxes identify the broad categories of research and principal collaborators. Hybrid crossovers are research areas that included both laboratory and field components.
Figure C-1 Development of Water-Capping Concept – Scaled-Up Testing in Microcosms and Field Test Ponds
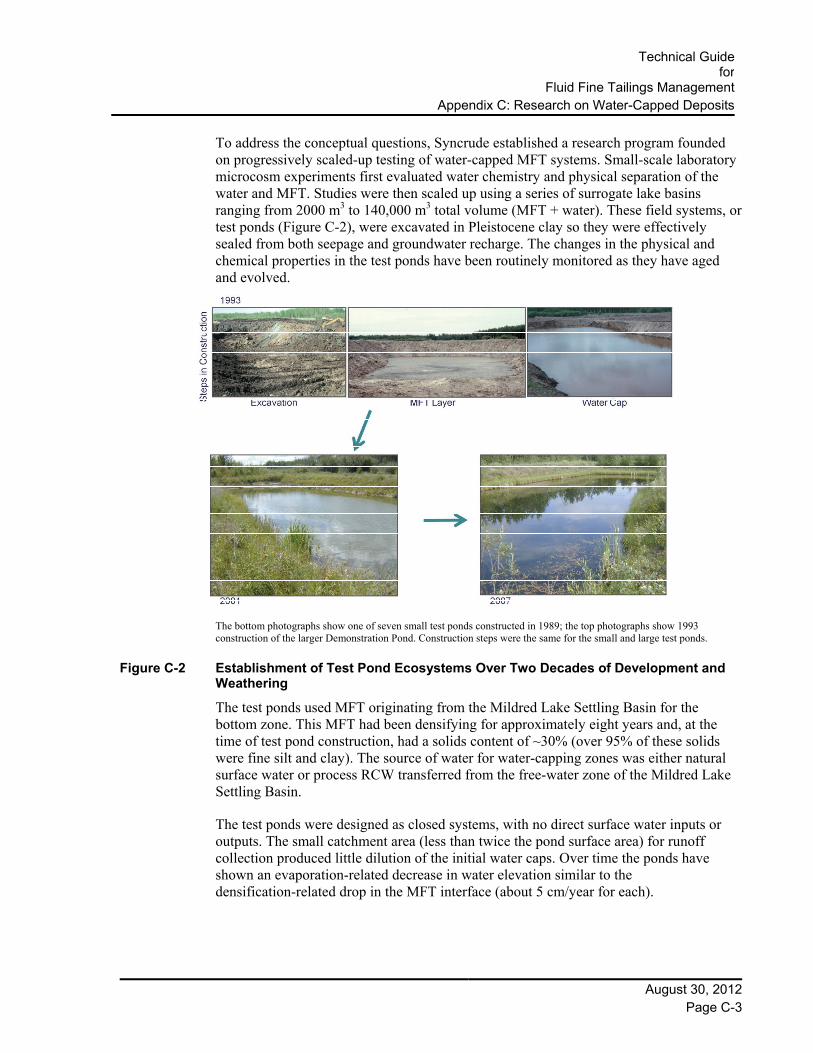
Technical Guide
forFluid Fine Tailings Management
Appendix C: Research on Water-Capped Deposits
August 30, 2012 Page C-3
To address the conceptual questions, Syncrude established a research program founded on progressively scaled-up testing of water-capped MFT systems. Small-scale laboratory microcosm experiments first evaluated water chemistry and physical separation of the water and MFT. Studies were then scaled up using a series of surrogate lake basins ranging from 2000 m3 to 140,000 m3 total volume (MFT + water). These field systems, or test ponds (Figure C-2), were excavated in Pleistocene clay so they were effectively sealed from both seepage and groundwater recharge. The changes in the physical and chemical properties in the test ponds have been routinely monitored as they have aged and evolved.
The bottom photographs show one of seven small test ponds constructed in 1989; the top photographs show 1993 construction of the larger Demonstration Pond. Construction steps were the same for the small and large test ponds.
Figure C-2 Establishment of Test Pond Ecosystems Over Two Decades of Development and Weathering
The test ponds used MFT originating from the Mildred Lake Settling Basin for the bottom zone. This MFT had been densifying for approximately eight years and, at the time of test pond construction, had a solids content of ~30% (over 95% of these solids were fine silt and clay). The source of water for water-capping zones was either natural surface water or process RCW transferred from the free-water zone of the Mildred Lake Settling Basin.
The test ponds were designed as closed systems, with no direct surface water inputs or outputs. The small catchment area (less than twice the pond surface area) for runoff collection produced little dilution of the initial water caps. Over time the ponds have shown an evaporation-related decrease in water elevation similar to the densification-related drop in the MFT interface (about 5 cm/year for each).

Technical Guide for Fluid Fine Tailings Management
Appendix C: Research on Water-Capped Deposits
August 30, 2012 Page C-4
Thus, the test ponds experienced little change in free water volume and an increased proportional makeup of released MFT pore water in the water caps over time. This water balance scenario is not likely to occur in a full-scale end-pit lake, where the greater depth, volume ratio and watershed catchment size will affect these hydrological rates.
The test ponds are reasonably representative of:
Chemical concentrations, degradation pathways and overall water quality
General nature of fluxes across the water-fine tails interface
Shoreline development timelines
Biological colonization rates and community development in littoral zones
Accumulation rates for detritus at the water-fine tails interface
Changing toxicity profiles over time
Water balance elements, such as variability between estimated and actual precipitation and evaporation rates.
Because of scaling factors and characteristics of the starting components, these ponds are not expected to exactly mimic a commercial-scale facility. Nor could the test ponds fully capture the variability in MFT composition that can be expected in a commercial facility. Aspects such as area, depth and volume ratios of MFT to water cap can only be directly studied at large scale.
These design differences mean that the test ponds cannot fully represent the potential for:
Stratification processes in the water column, including seasonal chemical and thermal turnover events and related dissolved oxygen profiles.
Large water body movements, including currents, localized effects from inflows and outflows, wave action, shoreline erosion and wind-driven mixing processes.
Nutrient cycling from deep water sediments into the open-water zone, as well as nutrient impacts from surrounding reclamation activities.
Food web influences driven by a dominance of microscopic plants in the open-water zone over macroscopic plants in the shallow shoreline zone.
Water balance elements, such as introduction of inflows and outflows, and microclimate influences of the larger open-water area on the evaporation rate.
Impact and response to climate change.
Influence of variability in MFT composition (density and chemistry).
Influence of variable microbial activity in the MFT zone, including accelerated densification rates, biogas production and release to the water cap layer.
Although some of the chemistry-related issues could be evaluated through laboratory studies and are described in the following subsections, the physical lake processes have of necessity been evaluated with modelling.

Technical Guide
forFluid Fine Tailings Management
Appendix C: Research on Water-Capped Deposits
August 30, 2012 Page C-5
In addition to industry-based research, evaluation of this technology is part of a multi-stakeholder process facilitated by the Cumulative Effects Management Association (CEMA). CEMA proposes issuing and periodically updating an end-pit lake guidance document, which will include contributions from industry, government and stakeholder representatives.