characteristics of effective alternative teacher
TRANSCRIPT

Teachers College Record Volume 110, Number 1, January 2008, pp. 1–63Copyright © by Teachers College, Columbia University0161-4681
Characteristics of Effective AlternativeTeacher Certification Programs
DANIEL C. HUMPHREYMARJORIE E. WECHSLER
SRI International
HEATHER J. HOUGH
Stanford University
Background: Alternative certification plays a central role in the production of new teachersin many states, yet little is known about the characteristics of an effective program. Giventhat the variation within programs is as great as the variation between programs, the com-mon methodology of comparing programs is unable to discern the qualities of programs withpositive teacher outcomes.Focus of Study: This paper is based on an analysis of seven alternative certification pro-grams to determine the characteristics of effective programs. It presents findings from ananalysis designed to shed light on the effects of personal, program, and contextual inputs onteaching outcomes. To account for within-program variation, the analysis clusters individ-uals across programs based on common background characteristics, program experiences,and school contexts.Research Design: We employed multiple data collection activities at both the program andparticipant levels. We conducted case studies of seven alternative certification programs,including multiple interviews with key personnel and document reviews. We surveyed pro-gram participants twice—once at the beginning of their participation in the program, andagain at the end of their first year of teaching. We also observed a sample of participantsteaching and interviewed them both at the beginning and end of their first year of teaching.Findings: We found that each program, personal, or contextual element analyzed impacted
2 Teachers College Record
various outcomes differently, and each contributed to the development of skilled, confidentteachers. The element with the strongest effect on all measured outcomes, however, was schoolcontext.Conclusions : Overall, findings suggest that an effective alternative certification programplaces candidates in schools with strong leadership, a collegial atmosphere, and adequatematerials. Effective programs select well-educated individuals or work to strengthen subject-matter knowledge, and recognize that previous classroom experience is an asset. Effectiveprograms provide carefully constructed and timely coursework tailored to candidates’ back-grounds and school contexts. And, effective programs provide trained mentors who have thetime and resources to plan lessons with candidates, share curricula, demonstrate lessons,and provide feedback after frequent classroom observations.
INTRODUCTION
Alternative teacher certification has become an increasingly commonpart of the teacher-preparation system. First established in the 1980s as aresponse to projected teacher shortages, alternative certification pro-grams are found now in nearly every state and many colleges and univer-sities (Feistritzer, 2005). More recently, school districts have begun theirown teacher-preparation programs, often in partnership with local uni-versities. In some parts of the country, nearly as many teachers enter theprofession through alternative routes as traditional routes (Humphrey &Wechsler, 2005).
Typically, alternative certification programs offer qualified teachercandidates a streamlined preparation program that places them in theclassroom as the teacher of record more quickly than traditional univer-sity-based programs. While this is generally true, some programs consid-ered to be alternative actually require a longer combination of course-work and internship than most university programs. Furthermore, whiletraditional programs are generally structured around coursework and aculminating student teaching experience, many university programs areincreasingly integrating coursework and student teaching. This blurringof the lines between alternative and traditional routes seems likely toincrease.
Despite the overlap between traditional and alternative teacherpreparation, alternative certification has recently become the U.S.Department of Education’s favored policy response to the dual demandsof improving teacher quality and increasing the teacher supply. The U.S.Secretary of Education’s Third Annual Report on Teacher Quality (U.S.Department of Education, 2004) promotes alternative certification, andthe federal No Child Left Behind Act includes participants in alternative
Effective Alternative Teacher Certification Programs 3
certification programs in its definition of “highly qualified” teachers. Atthe same time, opponents of alternative certification have been sharplycritical of such endorsements, charging that alternative certificationplaces unqualified teachers in the classrooms of the neediest students.
Ironically, both the endorsement and criticism of alternative certifi-cation are based on a very thin research base. The initial findings of thisstudy demonstrated that many of the assumptions about alternative cer-tification put forth by both proponents and opponents are inaccurate(Humphrey & Wechsler, 2005).1 Rather than declaring alternative certifi-cation a wholly good or bad enterprise (as proponents and opponents,respectively, tend to do), we concluded that teacher development inalternative certification appears to be a function of the interactionbetween the program as implemented, the school context in which theon-the-job training occurs, and the career trajectory of the individual par-ticipant. Our analysis highlighted the importance of variations bothacross and within programs, and led us to question the usefulness of mak-ing comparisons between different alternative certification programs.Rather, we theorized, a better unit of analysis would be a subgroup ofindividuals from different programs with similar backgrounds and expe-rience, who work in similar school settings.
The analysis presented in this paper builds on these conclusions toaddress the research question: What are the characteristics of effectivealternative certification programs? This paper is an attempt to add to theknowledge base on alternative certification to inform policy-makers andprogram directors seeking to address concerns about teacher supply andteacher quality.2
After providing a brief overview of the methodology, we examine thecharacteristics of alternative certification participants and program com-ponents and identify variables that seem likely to contribute to programoutcomes. Next, we describe the contributions of the identified variablesto a variety of outcome measures. We conclude by discussing the rele-vance of the findings to the improvement of alternative certification inparticular, and to teacher preparation in general.
STUDY METHODS
We employed multiple data collection activities, focusing on seven alter-native certification programs. To ensure that the programs we studiedmet certain practical and theoretical criteria, we used a purposive sam-pling strategy that considered program scale, replicability, intensity ofsupport, and participant characteristics. The seven programs are theTeacher Education Institute in the Elk Grove, California, Unified School

4 Teachers College Record
District; New Jersey’s Provisional Teacher Program; Milwaukee’sMetropolitan Multicultural Teacher Education Program (MMTEP); theNew York City Teaching Fellows Program; North Carolina’s NC TEACH(North Carolina Teachers of Excellence for All Children); Teach ForAmerica; and the Texas Region XIII Education Service Center’sEducator Certification Program.
In six of the seven programs, participants are full-time teachers whilecompleting their credential requirements. Elk Grove’s TeacherEducation Institute, which requires a full year of student teaching in con-cert with coursework, is the exception. The programs vary in size and thetargeted participant population. Milwaukee’s MMTEP program is consid-erably small, serving only 20 participants, all of whom have been parapro-fessionals or teacher’s aides in Milwaukee for at least one year. In con-trast, the New York City Teaching Fellows Program prepares several thou-sand teachers annually, all of whom have strong academic and/or profes-sional backgrounds. NC TEACH was designed to support mid-career pro-fessionals interested in switching to a career in education. New Jersey’sProvisional Teacher Program trains teachers already hired to work as theteacher-of-record in schools. Teach For America recruits new collegegraduates from selective universities to serve as teachers in hard-to-staffurban and rural districts. The Texas Region XIII Educator CertificationProgram targets both mid-career professional and recent college gradu-ates in high-need subject areas. All seven programs provide coursework,though the focus and amount of coursework varies, as does the developerand provider of the coursework. All seven programs also offer some typeof mentoring, though the source and focus of mentoring varies. The onecharacteristic common to all programs is that they are considered to bealternative, rather than traditional, teacher-preparation programs. Briefdescriptions of each program’s design can be found in Appendix A.
For each program, we conducted interviews with key personnel threetimes over the course of the study (spring 2003, fall 2003, spring 2004).Respondents included the program director, teaching faculty, certifica-tion advisors, classroom supervisors, and others. We also collected andexamined program documents, including program descriptions, coursesyllabi, existing evaluations or evidence of effectiveness, and other docu-ments.
We collected participant-level data over the course of the 2003–04academic year. For each program, we surveyed participants at the begin-ning and end of their first year in the program, which, in six of the sevenprograms, was also the beginning and end of participants’ first year asfull-time teachers.3 The survey included questions about participants’background (e.g., past professional experiences, college majors, demo-
Effective Alternative Teacher Certification Programs 5
graphics); perceptions of preparedness for teaching; reasons for goinginto teaching; and reasons for choosing the alternative certification pro-gram. The questionnaire also measured participants’ knowledge forteaching reading and mathematics, program supports received, careerplans, and perceptions of growth.
In each program, we followed 10–13 participants as they progressedthrough the first year of their program. We used a two-phase samplingstrategy to select target participants. First, we randomly selected schoolsin which the alternative certification teachers were working. Then, inschools with more than three participants, we randomly selected partici-pants. We observed each participant in the classroom twice—once in thefall and again in the spring—using a structured observation instrumentto measure the classroom learning environment, the teacher’s pedagogi-cal strategies, and classroom management. We also conducted in-depthinterviews with each participant that consisted of three parts: (1) a reflec-tion on the observed lesson (i.e., perception of its strengths and weak-nesses, connections between instructional strategies and the alternativecertification program); (2) information on the participant and his/herexperiences in the program (i.e., background, program components,perceptions of the program, school context, other professional develop-ment experiences, perceptions of readiness to teach); and (3) a case sce-nario designed to assess knowledge, attitudes, and beliefs about teaching.This strategy entailed presenting the participant with a realistic class-room-based scenario and asking how he/she would respond to the situa-tion and the reasons for doing so. The case scenarios helped groundeach interview in a consistent set of teaching problems. We also con-ducted interviews with other individuals influential to the participant’sdevelopment as a teacher, including the principal and coaches or men-tors who worked closely with the participant.
In the following sections, we present our findings. We first summa-rize results from the initial analyses, describing program participants. Wethen turn to the programs themselves and the training they provide.
CHARACTERISTICS OF ALTERNATIVE CERTIFICATION PARTICIPANTS
Our preliminary findings highlighted the importance of interactionsbetween the program as implemented, the school context, and individu-als’ backgrounds (Humphrey & Wechsler, 2005). In this section, wereview key findings from our earlier paper and present additional dataabout alternative certification participants.
6 Teachers College Record
The demographics of alternative certification participants
Alternative certification programs sometimes are designed to diversifythe pool of new teachers. On average, alternative certification teachers inour sample are not very different demographically from traditional routeteachers, though a closer look at participants’ characteristics revealssome interesting patterns. While the mean age of participants is slightlyhigher than teachers in traditional preparation programs, the age rangewithin programs is considerably wide, with alternative certification teach-ers representing both older individuals as well as new college graduates.Further, national data and data from the seven case study programs indi-cate no considerable gender differences between alternative certificationand traditional preparation participants. Some individual programs,however, attract greater percentages of men to the teaching professionthan national averages. In addition, while overall averages suggest thatalternative certification programs are successful in attracting greater per-centages of minorities into the teaching profession, program participantstend to reflect the racial composition of their local teacher labor market(Humphrey & Wechsler, 2005).
Selecting alternative certification participants
Much has been made of alternative certification programs’ ability toattract talented and well-educated individuals into teaching. Indeed,most programs devote considerable resources to the selection of partici-pants. However, research on the personal characteristics and back-grounds of individuals who will become effective teachers is thin (Wilson,Floden, & Ferrini-Mundy, 2001). As a result, different programs have dif-ferent selection criteria, depending on their assumptions about the mostdesirable qualities. Teach For America, for example, selects well-edu-cated young people from many of the nation’s most prestigious universi-ties. The New York City Teaching Fellows program also looks for well-edu-cated individuals, but is also interested in candidates with significantcareer experience. In contrast, Milwaukee’s MMTEP program onlyselects teacher’s aides already working in the Milwaukee Public Schools.New Jersey’s selection process includes a minimum grade point averageand the demonstration of subject-matter knowledge, but is highly decen-tralized, as candidates must have a job offer as a requirement for admis-sion. Given the large number of New Jersey candidates with previousclassroom experience (discussed later), it seems that the hiring princi-pals and district officials value such experience.
Effective Alternative Teacher Certification Programs 7
While there may be a variety of personal characteristics that make foran effective teacher, most alternative certification programs bet on edu-cation background, work experience, previous classroom experience, orsome combination of the three.
Education backgrounds
Research suggests that teachers with strong academic backgrounds maybe more effective than less well-educated teachers (Ballou & Podgursky,1997; Wayne & Youngs, 2003). The case-study programs included individ-uals with a variety of educational backgrounds. We used Barron’s six-scaleselectivity ranking for undergraduate universities and coded participantsas having attended a competitive or a less competitive institution ofhigher education (Barron’s Educational Services, Inc., 2002). Weincluded Barron’s two highest rankings in our “competitive” category,and two lowest rankings in our “less competitive” category.4 Althoughalternative route teachers overall are more likely to have graduated fromcompetitive universities than from less competitive ones, we found widevariation. The percentage of alternative certification participants attend-ing a competitive college ranges from 58 percent of TFA participants tonone of MMTEP’s participants. Of course, the competitiveness of the col-lege or university that an individual attended is just one indicator of awell-educated individual. Further, programs like MMTEP argue that theirrecruiting strategy results in new teachers who are committed to theircommunities and less likely to move on after a few years.
Previous career and classroom experience
Alternative certification programs are often considered an effectivemeans for attracting career-changers, allowing business people, scientists,mathematicians, lawyers, architects, engineers, and other skilled profes-sionals to bring their experience and acumen to the teaching profession.Although we did encounter some career-changers, more participants hadbeen full-time students or employed in an education-related field imme-diately before entering the program. Overall, relatively few participantsswitched from careers in mathematics and science to teaching (about5%), only 2 percent came from the legal profession, and 6 percent camefrom a financial or accounting career. In contrast, about 42 percent ofparticipants were either in education or were full-time students immedi-ately before entering their alternative certification program. Accordingly,when we examined the financial changes that participants made to enter

8 Teachers College Record
the teaching profession, we found that the majority of participants in theseven programs experienced a salary increase (Humphrey & Wechsler,2005).
Perhaps most instructive to understanding alternative certificationparticipants, nearly half of participants had classroom experience priorto entering their program. In five of the seven programs, more than 60percent of participants report having previous experience as a classroomteacher, substitute teacher, or teacher’s aide. And, their experience wasof considerable length. For example, New Jersey participants who hadprevious teaching experience averaged 39 months of experience.5
Similarly, 41 percent of participants across all seven programs had at leasta full academic year of classroom experience.
The large number of participants with classroom experience led usto include this variable in our outcomes analysis (reported later). We alsowanted to analyze the impact of previous careers, especially in mathemat-ics and science; however, there were insufficient numbers of candidateswith these previous career experiences to conduct the analysis.
These demographic and background variables provide just a smallglimpse into alternative certification participants. Although we onlydescribe a few variables here, they adequately demonstrate the complex-ities of thinking about effective alternative certification programs.Though we can make statements about alternative certification partici-pants as a whole, means mask important variation both across and withinprograms. The variation matters not just as a statistical exercise, butbecause personal characteristics influence the supports individuals needto develop into professional teachers. Within most of the programs, par-ticipants’ education, experience, and commitment vary greatly. And, as aresult of the variation, participants have very different developmentalneeds. This basic fact complicates any attempt to identify a fixed set ofprogram characteristics that can guarantee the successful production ofeffective teachers. Clarifying who participates in alternative certificationprograms in a more detailed manner—both across and within pro-grams—thus, is important in determining the characteristics of effectiveprograms.
ALTERNATIVE CERTIFICATION PROGRAM COMPONENTS
The complexity of alternative certification is due not only to the variationof participant backgrounds, but also to the variation in how participantsexperience their programs and school placements:

Effective Alternative Teacher Certification Programs 9
Program components espoused by program directors, coursecatalogs, or other media provide a general sense of the goals of,and the ideal training offered by, a program, but in practice maynot accurately reflect the learning opportunities participantsexperience. Both the participant’s characteristics and the schoolcontext may undermine even the best designed program fea-tures. Individuals learn from both the formal and the informalcontexts of their schools. In most programs, this learning existsbeyond the control of the alternative certification program.(Humphrey & Wechsler, 2005, p.29)
Next, we elaborate on this notion by examining how participantsexperienced their coursework, mentoring and supervision, and schoolenvironments. Importantly, we document the variation of participantexperiences within programs.
Participant experiences with coursework
Coursework is a key training component in each of the seven case studyprograms. Across programs, program directors reported that the course-work provided practical training focused on specific skills and knowledgethat teachers need in classrooms. In fact, the coursework varied in theemphasis placed on subject-matter content, pedagogy, classroom man-agement, educational theory, and child development. These variationsexist not only among different programs, but within individual programsas well, depending on who designs the course curricula (Humphrey &Wechsler, 2005). Some alternative certification programs design theirown curricula; others are designed by partner universities. In the NewYork City Teaching Fellows program, multiple university partners designand deliver coursework, and thus participants within the one programmay have very different experiences with their coursework.
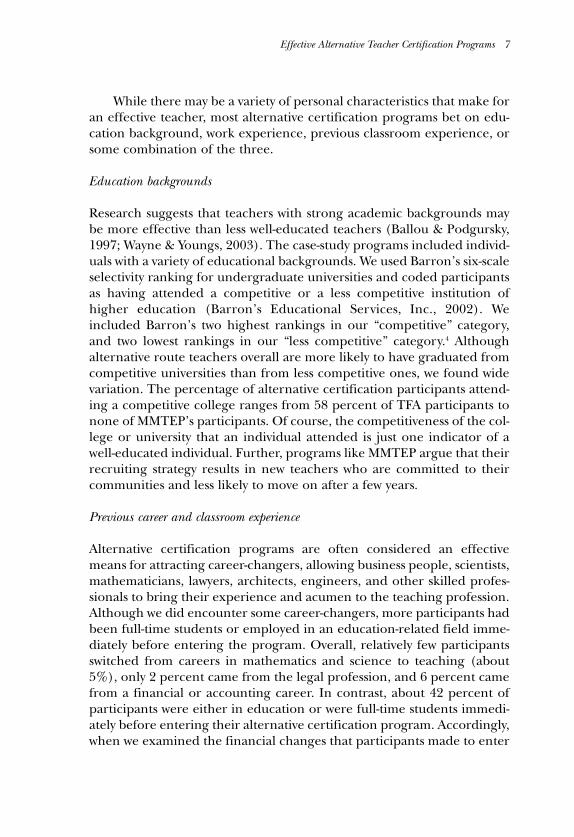
In general, participants reported that coursework mattered to theirdevelopment as teachers, though ratings varied by program. Across pro-grams, 55 percent of participants reported that their coursework duringthe school year was a moderate to very important source of professionalsupport (see Exhibit 1). At the extremes, over four-fifths of Elk Grove’sTEI participants but less than one-half of New York City Teaching Fellowsrated their coursework highly.
10 Teachers College Record
Across all programs, alternative certification participants spoke mosthighly about practical courses focused on specific ideas for teaching acurriculum or handling classroom management. Faced with a classroomof students each morning, participants were eager to learn specific strate-gies to employ immediately in their classes. One participant, for example,extolled the applied nature of her classes: “It is all practical. They arealways asking us what is useful or not.” Participants were much less enthu-siastic about theoretical, historical, or foundational classes. Criticizingher more academic classes, another participant said, “The courseshaven’t provided anything that I can apply in the classroom. It’s not tan-gible.”
Alternative certification participants’ appraisal of their courseworkalso seems to depend on their readiness to learn. Some participants,especially those with previous classroom experience, seemed moreequipped to learn from their coursework. Those who could connect theircoursework to prior understandings reported more benefit from thecoursework. One participant, for example, entered her program with astrong foundation in special education and felt very aware of how to man-age and relate to children with unique challenges. Through her course-work, then, she was able to identify weaknesses in her knowledge ofinstructional techniques. “I know the management part of [teaching], . . .I know special ed,” she said. “I am learning a lot about the technical partof [teaching] . . . phonemic awareness, phonics.”
Exhibit 1. Percent of Participants Reporting that their Coursework Was a Moderate to Very ImportantSource of Professional Support***
***p < .001.Source: SRI Survey of Alternative Certification Program Participants (2004).
4445
6769707280
55
0%
20%
40%
60%
80%
100%
All 7programs
TeacherEducationInstitute
NewJersey
TexasRegion XIII
MMTEP NCTEACH
Teach ForAmerica
NYCTeachingFellows
Par
ticip
ants

Effective Alternative Teacher Certification Programs 11
Participants who do not struggle with the classroom management orprocedures also reflected more positively on their coursework.Participants who are not too overwhelmed by their teaching duties, eventhose with no prior experience, are more likely to report benefits fromtheir credentialing classes. Finding their daily teaching manageable,these participants are more likely to attend their credentialing classesready to learn and to apply the new knowledge to their classrooms thenext day.
Thus, even in the same program, the coursework that is valuable toparticipants varies, depending on their readiness to learn and their class-room experiences. The variation evident in participants’ valuation oftheir coursework was also evident for other program components, suchas mentoring and supervision.
Mentoring and supervision
With a heavy emphasis on on-the-job training, most alternative certifica-tion programs attach great importance to mentoring. Although by nomeans conclusive, the research on mentoring suggests that it can be aneffective strategy to reduce teacher attrition and improve teacher quality(Lopez, Lash, Schaffner, Shields, & Wagner, 2004). Alternative certifica-tion programs provide two types of mentoring and supervision for partic-ipants: a mentor or supervisor from the university or alternative certifica-tion program and a school-based mentor.
Program supervision
One source of supervision and feedback comes from program staff oruniversity supervisors. We found a good deal of variation from one pro-gram to another with regard to the frequency with which participantswere observed by their programs (see Exhibit 2) and the value the partic-ipants placed on it. Nearly all participants in five of the seven programsreported receiving such support at least once or more during the schoolyear. However, one-quarter of participants in NC TEACH and one-fifth ofparticipants in the NYC Teaching Fellows Program reported never beingobserved by program staff or university supervisors. Milwaukee’s pro-gram stands out for the high frequency of observations and feedback byprogram staff: 85 percent of participants received feedback from theirprogram at least monthly. Supervision is a key component of theMilwaukee program and one feature that participants across programsvalue a great deal. Overall, over 80 percent of participants in all programs

12 Teachers College Record
who were observed and received feedback from their program staff oruniversity supervisor found that support to be somewhat or very valuable.
In-school mentoring
The second type of mentoring is from an in-school mentor. All seven ofthe programs consider in-school mentoring a prominent feature of theirprogram design, although they used mentors in different ways. Arguably,the in-school mentor can provide the most intensive and valuable sup-port to an alternative certification participant. Informal daily supportand regular formal guidance can help a new teacher weather the manychallenges of a difficult job. Ideally, the in-school mentor is an accom-plished teacher working in the same grade or subject area who has theexpertise to help guide and support a new teacher.
In MMTEP, mentors are full-time release teachers, not housed at aspecific school site, whose full-time job is mentoring four or five teachers.Elk Grove’s TEI employs an apprenticeship model whereby participantsare placed in the classroom with a different teacher each semester of theprogram. The other programs supported mentors who were full-timeteachers in the participants’ schools.
The percent of participants who received mentor support at leastmonthly varied by program (see Exhibit 3). The three programs in which
Exhibit 2. Frequency of Observations and Feedback From Program Staff and University Supervisors***
***p < .001.Source: SRI Survey of Alternative Certification Program Participants (2004).
34
85
5644 40 34 27 25
50
7347
605144
15
54
0%
20%
40%
60%
80%
100%
All 7programs
MMTEP TeacherEducationInstitute
NewJersey
TexasRegion XIII
NYCTeachingFellows
Teach ForAmerica
NCTEACH
Par
ticip
ants
At least monthly At least once

Effective Alternative Teacher Certification Programs 13
the lowest percent of participants received monthly in-school mentoringalso had the highest percent of participants who reported receiving nomentoring support, even though mentoring is a formal component oftheir programs. Specifically, 17 percent of NC Teach participants, 13 per-cent of Teach For America participants, and 11 percent of New Jerseyparticipants reported never receiving mentor support. Overall, however,most participants reported a fairly high frequency of mentoring.
Mentor support can take many forms, and, according to participants,not all mentoring activities are of equal value. Participants who receivedmentoring reported that the mentor activities they most valued werewatching demonstration lessons, collaboratively planning lessons, talkingabout the strengths and needs of specific students, and receiving curricu-lum materials.
We found a great deal of variation by program with regard to the per-cent of teachers receiving the most valued mentor activities at leastmonthly (see Exhibit 4). Elk Grove’s TEI is the most consistent in provid-ing participants with their most valued types of mentoring. MMTEP islikewise strong, especially in providing materials and talking about spe-cific students. Other programs, however, do not consistently provide anyof the most valued types of mentoring.
Exhibit 3. Frequency of Observations and Feedback from In-School Mentors***
***p < .001.Source: SRI Survey of Alternative Certification Program Participants (2004).
505657
7377
8387
6937
3326
25231412
24
0%
20%
40%
60%
80%
100%
All 7programs
TeacherEducationInstitute
NYCTeachingFellows
MMTEP TexasRegion XIII
NCTEACH
NewJersey
Teach ForAmerica
Par
ticip
ants
At least monthly At least once

14 Teachers College Record
Through the case studies, we also found that mentors provided verydifferent types of support. Some mentors solely served as a source ofemotional support, while others provided a higher level of guidance inlearning to teach. Of those mentors who attended to a teacher’s practice,we found that many focused primarily on classroom management andprocedures rather than instructional technique. One participant, forexample, said that her mentor helped her improve in such ways as speak-ing more quietly in small groups, writing on the board using larger print,and smoothing transitions. Others, however, received specific guidanceon how to use curricula, adapt instruction for students, and make cre-ative instructional decisions to meet students’ needs. One participantreported:
[Differentiated instruction] is one thing I’ve learned from my[mentor]. She’ll look at [the lesson], say my kids can’t do this.So, she’ll bring in the concept another way. Fulfilling the stan-dard, but accomplishing it another way. . . . I’ve learned to dothat through her.
The structure of most programs’ mentoring component leaves fartoo much to chance: availability of the mentor to provide support, knowl-
Exhibit 4. Percent of Participants Reporting Receiving the Most Valued Mentoring Activitiesat Least Monthly***
***p < .001 for all variables.Source: SRI Survey of Alternative Certification Program Participants (2004).
154
1518
7
31
73
148 9
22 20
10
31
61
13
21
42
54
42
3228
79
36
202527
38
62
33
83
28
0%
20%
40%
60%
80%
100%
All 7Programs
TeacherEducationInstitute
MMTEP TexasRegion XIII
New Jersey NC TEACH NYCTeachingFellows
Teach ForAmerica
Par
ticip
ants
Demonstrated lessons Jointly planned lessons Talked about specific students' needs Provided materials
Effective Alternative Teacher Certification Programs 15
edge of how to work with adults, and individual teaching style. Most pro-grams do not have a detailed process for selecting mentors, nor do theyinvest significant time or money into training mentors on what specificactivities or supports are most effective in training new teachers. Someprograms provide mentor training, but it is rarely focused on a variety ofspecific mentoring strategies. Further, most programs provide their men-tors with only a nominal stipend, and little, if any, release time. For thesereasons, quality and content of mentoring varies based on individualteaching style, interest, and personality of the mentor. With a largerinvestment in recruitment, selection, training, and compensation, pro-grams could potentially remove some of the variability in mentoring.
The program components discussed thus far, coursework, mentoringand supervision, are within the direct purview of the alternative certifica-tion programs. Another program component is the on-the-job trainingthat occurs as participants work in schools. Although often not activelyconsidered by the programs, the contexts of participants’ placements,discussed next, matters.
School context
Following our initial school visits, we were convinced that school contextplayed an important role in an alternative route teacher’s development.While programs often cannot control participants’ school contexts, theycan control the support they provide to participants teaching in variouscontexts. This consideration is especially important because many alter-native certification participants are assigned to difficult schools charac-terized by a lack of teacher support and a high-need student population.For example, in four of the five New York City schools we visited, fewerthan half of the students met standards in English language arts or math-ematics. Many participants across programs also reported that they wereassigned far more high-need students than other teachers in theirschools. One general education teacher, for example, had 6 out of 21 stu-dents with individualized education plans and another 6 who wereEnglish learners.
There probably is no precise recipe to create a school that helpsalternative certification participants succeed, but our survey analysisidentified collegial relationships, strong leadership, and adequate sup-plies and materials as important components.
Factor analysis indicated that professional collegial environmentswere ones in which teachers analyze student work samples together; seekeach other’s advice about instructional issues and problems; observeeach other’s classrooms and offer feedback and/or exchange ideas; and
16 Teachers College Record
discuss student assessment data to make decisions about instruction. Theteacher professional communities in the participants’ placement schoolsranged from robust to non-existent. While some programs such as TEIplace greater percentages of their participants in schools with strongteacher professional communities, even TEI does not place all partici-pants in strong collegial environments. Within single programs, then,participants may or may not have the opportunity to learn from and besupported by their colleagues.
Administrators, like teacher colleagues, can also serve as a source forgrowth or interfere with participants’ development. Across all seven pro-grams, two-thirds of participants reported that their school administra-tors worked to ensure that teachers have the support they need to be suc-cessful; however, only 50 percent of participants reported that teachers intheir school trust the school administrators. Thirty percent reported thattheir opinions about instruction were different from the principal’s opin-ions.
As with other conditions, we found a great deal of variation in admin-istrative support across and within alternative certification programs. Forexample, one participant described how a lack of administrative supporthas made her professional life more difficult:
My AP is very unhelpful. She gives me useless crap that I’ll neverbe able to use. She gave me bead patterns but no beads to gowith them. She hasn’t given me the photocopies I asked for. OnMonday my paraprofessional was absent, and I had two boysthrowing chairs around. I sent a kid to get her, and she refusedto come get them.
In contrast, a participant in a supportive school described adminis-trators who are available and helpful: “I can go to the principal of theschool. I can just walk into his office. We have a grade leader who knowseverything. She makes everything easy for you.”
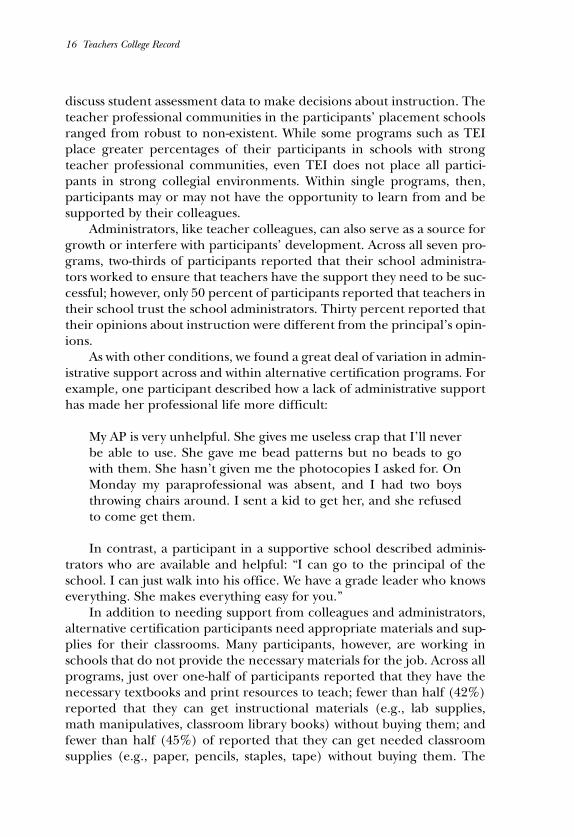
In addition to needing support from colleagues and administrators,alternative certification participants need appropriate materials and sup-plies for their classrooms. Many participants, however, are working inschools that do not provide the necessary materials for the job. Across allprograms, just over one-half of participants reported that they have thenecessary textbooks and print resources to teach; fewer than half (42%)reported that they can get instructional materials (e.g., lab supplies,math manipulatives, classroom library books) without buying them; andfewer than half (45%) of reported that they can get needed classroomsupplies (e.g., paper, pencils, staples, tape) without buying them. The

Effective Alternative Teacher Certification Programs 17
availability of materials influences what the participants feel they can doin the classroom. As one teacher said, “I cut out a lot of things that Iwould like to do with the kids because I know the final expense would betoo great for me.” Some participants spend a great deal of their ownmoney buying materials and supplies for their classrooms. We heard esti-mates ranging from several hundred to several thousand dollars of per-sonal money spent for professional purposes.
Alone, each of these context variables—professional community,administrator support, and availability of materials—can influence teach-ers’ development and their enjoyment of teaching. The combination offactors, however, can have a profound effect on how teachers perceiveteaching and how much they are able to learn on the job.
Next, we turn to an examination of how participant characteristics(i.e., educational background and previous teaching experience) andprogram characteristics (i.e., coursework, mentoring, and school con-text) contribute to different outcomes.
LINKING PARTICIPANT AND PROGRAM CHARACTERISTICS TOPROGRAM OUTCOMES
Because the variation in participant experiences within programs wassometimes as great as the variation between programs, we questioned ourability to determine characteristics of effective programs simply by com-paring different programs. Consequently, we added the concept of“paths into teaching” to our analysis, clustering groups of individualsacross programs based on a set of common background characteristicsand experiences. We considered those input variables that emerged fromthe descriptive analysis provided above, including:
• Academic background: Using Barron’s 6-scale university selectivityranking, participants whose undergraduate institutions are levels 5and 6 are considered competitive, and levels 1 and 2 are consid-ered less competitive.
• Previous teaching experience: Participants are considered experi-enced if they have had nine months’ or more previous experienceas a classroom teacher, aide, or substitute.
• Perceived quality of coursework: Participants who rated eithertheir pre-service or in-service coursework very or moderatelyimportant are said to have had valuable coursework. All others aresaid to have had poor coursework.
• Frequency of mentoring: Using a factor score that combined thefrequency of nine mentoring activities, we consider those in the
18 Teachers College Record
top quartile of the factor to have frequent mentoring, and those inthe bottom quartile to have infrequent mentoring
• School environment: Using a factor score combining administra-tor support, teacher professional community, and availability ofmaterials, we consider those in the top and bottom quartile to havea good and challenging context, respectively.
Outcome measures we considered include predicted retention,knowledge for teaching, teacher self-efficacy, and teacher-reportedgrowth. Although our study did not include a student achievement com-ponent, we discuss the existing research on alternative certification andstudent achievement and the implications of our research on future stu-dent-achievement analyses. Next, we describe each of these outcomesand the input variables that impact them.
Teacher retention
The existing research on the retention of alternatively certified teachersis mixed, though it appears that some programs are more effective thanothers at preparing alternative route teachers who stay in the profession(Darling-Hammond, 1994; Dial & Stevens, 1993; Haberman 1999;Hutton, Lutz, & Williamson, 1990; Paccione, McWhorter, & Richburg,2000; Stoddart, 1990; Wilson et al., 2001; Wise, 1994). The programs westudied had different goals regarding teacher retention. For MMTEP,retention is a key goal and their strategy of recruiting teachers’ aides is aconscious effort to develop individuals already committed to working inthe Milwaukee public schools. In contrast, Teach For America’s goal isleadership development, not teacher retention. Some programs attractindividuals who, at the outset, plan to stay in teaching, though the pro-grams may not specifically recruit for this commitment. Candidates forElk Grove’s TEI, for example, purposely seek out the program becausethey want to teach in the sponsoring district. Upon entering the programin the fall, more than three-quarters of TEI participants reported thatthey planned to teach for 10 years or more; by contrast, only 11 percentof Teach For America participants reported that they planned to teachfor that long. In addition, nearly half of TEI participants reported that“teaching has always been their calling,” compared to only 12 percent ofTeach For America participants. Thus, one way that programs can pro-mote low attrition is to select individuals who are predisposed to a careerin teaching. Besides the obvious finding regarding participant selection,we found that school context, coursework, and undergraduate institutionselectivity all contributed to participants’ career plans.
Effective Alternative Teacher Certification Programs 19
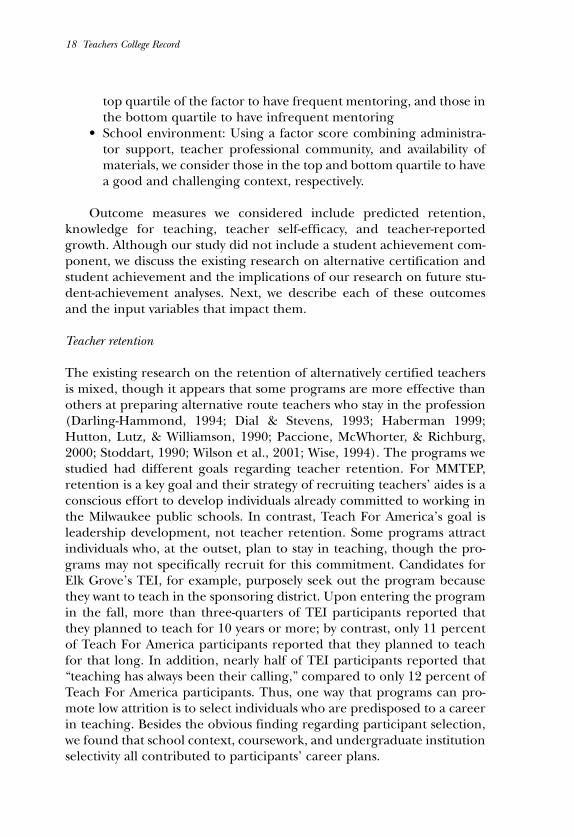
At the end of the first year in their programs, those participants whowere working in a positive school environment had the most positive out-looks for retention (see Exhibit 5). Specifically, participants who workedin good school contexts were significantly more likely to have decided toteach three or more years than participants who worked in challengingschool contexts. At the same time, participants in challenging school con-texts were far more likely to be undecided about their future career plansthan participants working in good school contexts.
Perhaps even more telling was the effect of school context on thoseparticipants who were undecided about their career plans when theybegan their program. Participants who were undecided in the fall weresignificantly more likely to have decided to make a career out of teachingif they worked in a good school context than in a challenging school con-text (see Exhibit 6). In contrast, over three-quarters of participants whowere undecided in the fall remained undecided in the spring if they hadworked in a challenging school context.
Exhibit 5. Participants’ Teaching Plans After 1 Year in the Program, by School Context**
**p < .01.Source: SRI Survey of Alternative Certification Program Participants (2004).
21
2
36
41
47
11
16
27
0%
10%
20%
30%
40%
50%
60%
10 years or more 3-9 years 2 years or fewer Undecided
Par
ticip
ants
Good school context Challenging school context

20 Teachers College Record
School context was the most important factor in participants’ careerplans, though coursework and the competitiveness of participants’ uni-versities also were influential. Forty percent of participants who receivedvaluable coursework planned to teach 10 years or more, compared toonly 22 percent of those who received less valuable coursework. Thosefrom less competitive universities also planned a longer career in teach-ing than those from more competitive universities; 61 percent versus 23percent planned to teach for 10 years or more, respectively.
Other factors such as mentoring and previous teaching experiencedid not appear to have as much of an influence on participants’ careerplans. Readers should be careful not to over-interpret these findings,however. While mentoring did not appear to have an impact on partici-pants’ career plans, only a small minority of participants received thekinds of mentoring support that they found most valuable. Similarly,while having experience in the classroom did not seem to influence par-ticipants’ plans, teaching experience did impact participants in otherways, discussed below. Rather than suggesting that mentoring does notinfluence retention, our finding is that the quality of the school place-
Exhibit 6. Teaching Plans of Participants Who Were Undecided in the Fall After 1 Year in the Program,by School Context***
***p < .001.
Source: SRI Survey of Alternative Certification Program Participants (2004).
173
4040
81
4510
0%
10%
20%
30%
40%
50%
60%
70%
80%
90%
100%
10 years or more 3-9 years 2 years or fewer Undecided
Par
ticip
ants
Good school context Challenging school context

Effective Alternative Teacher Certification Programs 21
ment is key to increasing the predicted retention of alternative certifica-tion participants.
Participant knowledge for teaching
A complicated outcome we measured was participants’ knowledge forteaching. Teacher knowledge includes both command of the subject mat-ter to be taught and the knowledge of how to teach that particular sub-ject matter. Specifically, teachers need the following types of knowledgeto be effective: knowledge of the content itself, which includes commoncontent knowledge and specialized knowledge for teaching; knowledgeof content and students; and knowledge of content and teaching (Ball &Bass, 2003; Ball, Hill, & Bass, 2005). Measuring teachers’ knowledge is achallenging task. We needed instruments that were reliable and valid,and that were sensitive enough to measure differences among respon-dents and changes in respondents over time.
To increase the precision of our survey, we used items from the Studyof Instructional Improvement (SII) being conducted by researchers atthe University of Michigan (Deborah Ball, David Cohen, and BrianRowan, Principal Investigators). SII researchers have developed a bank ofsurvey items that measure teachers’ knowledge for teaching reading/lan-guage arts and mathematics at the elementary level (see, for example,Hill, Schilling, & Ball, 2004; Phelps & Schilling, 2004). Our intent inusing the SII items was to use already field-tested items.
The SII items have been tested extensively and have been tied to stu-dent achievement and classroom practice. Tests on the items measuringreading knowledge suggest that they effectively measure knowledge forteaching reading rather than simply reading ability. A recent studyreported that teachers and non-teachers showed no significant differ-ence in common reading ability; however, teachers scored significantlyhigher than non-teachers on the measure of content knowledge forteaching reading (Phelps, 2005). Another study showed a positive rela-tionship between teacher knowledge in mathematics and studentachievement (Hill, Rowan, & Ball, 2005).
Although the knowledge items are tested and reliable, we presentthese data with several caveats. First, the survey items were not developedfor novice teachers, though novices are the target population of thisstudy. Thus, the survey items had been thoroughly tested for reliabilityand validity by the developers, but they had not been tested for the spe-cific population of teachers we surveyed. Second, we were limited in thenumber of knowledge questions we could pose in our survey. Becauseour survey was more comprehensive, asking about background, program
22 Teachers College Record
experiences, and outcomes, in addition to knowledge for teaching, wehad to select a sample of questions in the broader area of knowledge tokeep the survey to a manageable size. From the bank of items, weselected six reading testlets (comprising 29 questions), and 10 mathtestlets (comprising 31 questions), varying in content and difficulty.Further, the questions were not matched to the teacher-preparation cur-ricula of the various programs. The questions capture a range of knowl-edge used by elementary school teachers, but are not necessarily taughtby the seven alternative certification programs.
In addition, the use of these items had several implications for oursample. First, since the survey items were developed for elementaryschool teachers, we present data for this population of teachers only.Thus, our sample size in some of the programs is notably decreased, andthere are no measures for NC TEACH participants, because that pro-gram only prepares secondary school teachers. Second, our design calledfor surveying participants at the beginning of their program and again atthe end of the first year. For several of the programs, we were able to sur-vey participants within their first week of training. For a few, however, wewere not able to administer the pre-program survey until part-waythrough the first year. So, for example, Texas Region XIII and MMTEPparticipants had essentially no training at the administration of the firstsurvey. Some New York participants, on the other hand, had already com-pleted their summer training prior to completing the survey. Differencesin initial scores and growth scores could be contributed, in part, to thevariances in the timing of when the initial survey was administered.
We conducted a factor analysis of the knowledge for teaching itemsand found that the items comprised three distinct constructs.6 The firstfactor, content knowledge, measures reading and mathematics contentknowledge not specifically related to knowledge about teaching. The sec-ond factor, knowledge for teaching reading, measures teachers’ knowledge ofstrategies for teaching reading. The third factor, knowledge for teachingmathematics, measures teachers’ ability to understand students’ thinkingin mathematics. We also found a single factor solution that we use to dis-cuss overall knowledge for teaching.7
We were interested in measuring participants’ knowledge both in thefall and in the spring. The fall measures are important because they rep-resent what the participants initially bring to their students. We hypothe-sized that there were two variables that could possibly impact fall knowl-edge measures—participants’ intellectual competencies (either innate orlearned), and their previous experience in classrooms—since the knowl-edge measures were both of content and of understanding students andpedagogy. The spring measures provide insight into the contribution of
Effective Alternative Teacher Certification Programs 23
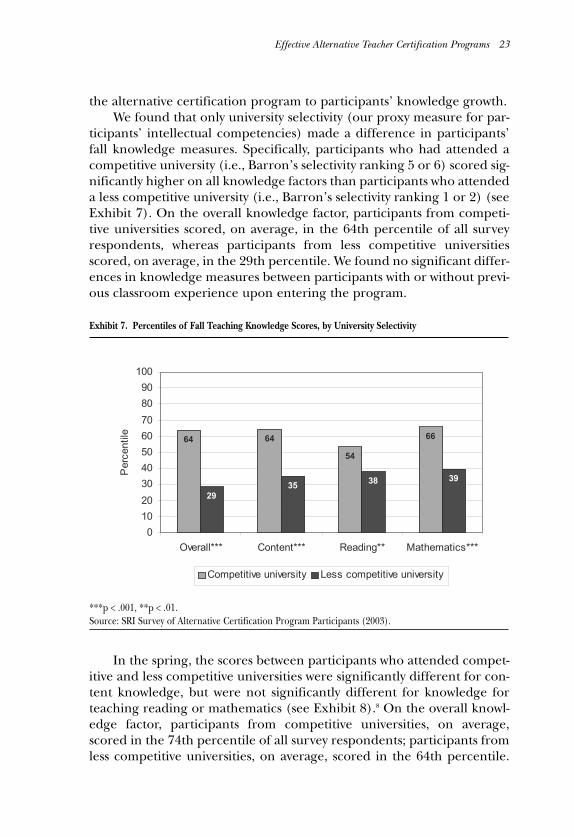
the alternative certification program to participants’ knowledge growth.We found that only university selectivity (our proxy measure for par-
ticipants’ intellectual competencies) made a difference in participants’fall knowledge measures. Specifically, participants who had attended acompetitive university (i.e., Barron’s selectivity ranking 5 or 6) scored sig-nificantly higher on all knowledge factors than participants who attendeda less competitive university (i.e., Barron’s selectivity ranking 1 or 2) (seeExhibit 7). On the overall knowledge factor, participants from competi-tive universities scored, on average, in the 64th percentile of all surveyrespondents, whereas participants from less competitive universitiesscored, on average, in the 29th percentile. We found no significant differ-ences in knowledge measures between participants with or without previ-ous classroom experience upon entering the program.
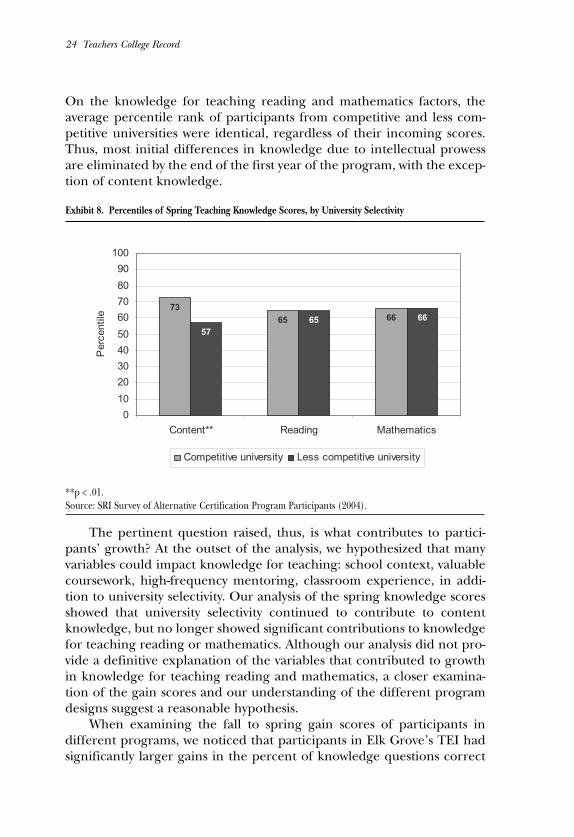
In the spring, the scores between participants who attended compet-itive and less competitive universities were significantly different for con-tent knowledge, but were not significantly different for knowledge forteaching reading or mathematics (see Exhibit 8).8 On the overall knowl-edge factor, participants from competitive universities, on average,scored in the 74th percentile of all survey respondents; participants fromless competitive universities, on average, scored in the 64th percentile.
Exhibit 7. Percentiles of Fall Teaching Knowledge Scores, by University Selectivity
***p < .001, **p < .01.Source: SRI Survey of Alternative Certification Program Participants (2003).
64 64
54
66
2935 38 39
0102030405060708090
100
Overall*** Content*** Reading** Mathematics***
Per
cent
ile
Competitive university Less competitive university
24 Teachers College Record
On the knowledge for teaching reading and mathematics factors, theaverage percentile rank of participants from competitive and less com-petitive universities were identical, regardless of their incoming scores.Thus, most initial differences in knowledge due to intellectual prowessare eliminated by the end of the first year of the program, with the excep-tion of content knowledge.
The pertinent question raised, thus, is what contributes to partici-pants’ growth? At the outset of the analysis, we hypothesized that manyvariables could impact knowledge for teaching: school context, valuablecoursework, high-frequency mentoring, classroom experience, in addi-tion to university selectivity. Our analysis of the spring knowledge scoresshowed that university selectivity continued to contribute to contentknowledge, but no longer showed significant contributions to knowledgefor teaching reading or mathematics. Although our analysis did not pro-vide a definitive explanation of the variables that contributed to growthin knowledge for teaching reading and mathematics, a closer examina-tion of the gain scores and our understanding of the different programdesigns suggest a reasonable hypothesis.
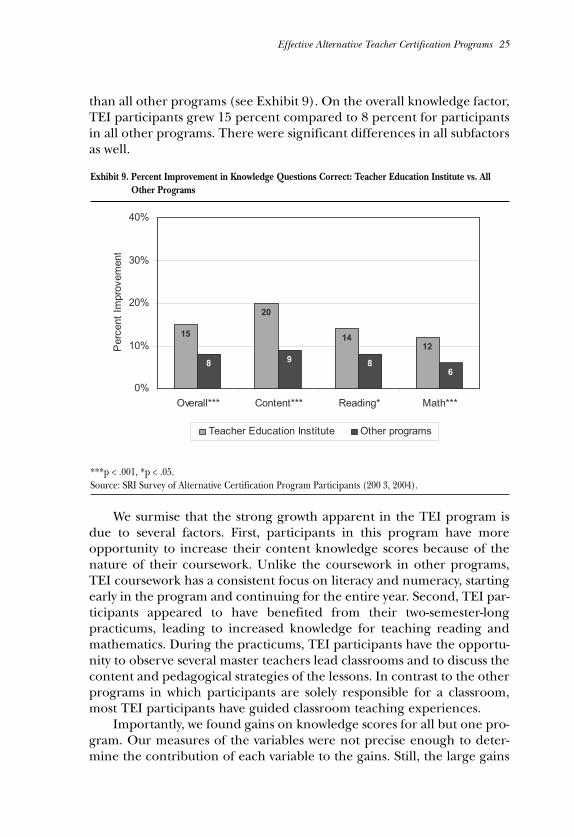
When examining the fall to spring gain scores of participants in different programs, we noticed that participants in Elk Grove’s TEI hadsignificantly larger gains in the percent of knowledge questions correct
Exhibit 8. Percentiles of Spring Teaching Knowledge Scores, by University Selectivity
**p < .01.Source: SRI Survey of Alternative Certification Program Participants (2004).
7365 66
5765 66
0102030405060708090
100
Content** Reading Mathematics
Per
cent
ile
Competitive university Less competitive university
Effective Alternative Teacher Certification Programs 25
than all other programs (see Exhibit 9). On the overall knowledge factor,TEI participants grew 15 percent compared to 8 percent for participantsin all other programs. There were significant differences in all subfactorsas well.
We surmise that the strong growth apparent in the TEI program isdue to several factors. First, participants in this program have moreopportunity to increase their content knowledge scores because of thenature of their coursework. Unlike the coursework in other programs,TEI coursework has a consistent focus on literacy and numeracy, startingearly in the program and continuing for the entire year. Second, TEI par-ticipants appeared to have benefited from their two-semester-longpracticums, leading to increased knowledge for teaching reading andmathematics. During the practicums, TEI participants have the opportu-nity to observe several master teachers lead classrooms and to discuss thecontent and pedagogical strategies of the lessons. In contrast to the otherprograms in which participants are solely responsible for a classroom,most TEI participants have guided classroom teaching experiences.
Importantly, we found gains on knowledge scores for all but one pro-gram. Our measures of the variables were not precise enough to deter-mine the contribution of each variable to the gains. Still, the large gains
Exhibit 9. Percent Improvement in Knowledge Questions Correct: Teacher Education Institute vs. AllOther Programs
***p < .001, *p < .05.Source: SRI Survey of Alternative Certification Program Participants (200 3, 2004).
1214
20
15
6898
0%
10%
20%
30%
40%
Overall*** Content*** Reading* Math***
Per
cent
Impr
ovem
ent
Teacher Education Institute Other programs

26 Teachers College Record
among TEI participants led us to hypothesize that the interaction ofguided classroom teaching, coursework with a strong and consistent con-tent emphasis, and other in-school supports increases knowledge toteach scores among all participants, not just those from competitive uni-versities and colleges.
Teacher efficacy
Another outcome variable we analyzed was teachers’ self-efficacy, a char-acteristic that is important to foster early in the career (Darling-Hammond, Chung, & Frelow, 2002). Reviewing literature on teacher effi-cacy, Tschannen-Moran, Hoy, and Hoy (1998) reported that self-efficacyhas been found to be related to student achievement, motivation, andstudents’ sense of efficacy.
Teacher efficacy was impacted by three input factors: teacher experi-ence, school context, and coursework. Because alternative certificationparticipants begin teaching prior to receiving a majority of their training,we were curious about their efficacy going into their programs. We foundthat alternative certification participants who had prior experience in a
Exhibit 10. Percent of Participants Agreeing with Various Statements about Self-Efficacy in the Fall, byExperience
***p < .001, **p < .01, *p < .05.Source: SRI Survey of Alternative Certification Program Participants (2004)
58
58
79
33
46
67
0% 20% 40% 60% 80% 100%
I currently have the necessary knowledge andskills to teach effectively***
I feel confident in my ability to address theneeds of English language learners*
I feel confident in my ability to handle a rangeof classroom management and discipline
situations**
Participants
Classroom experience No classroom experience

Effective Alternative Teacher Certification Programs 27
classroom were significantly more likely to be confident in their teachingabilities than participants with no classroom experience. Specifically,teachers with experience felt more confident with classroom manage-ment, their ability to address the needs of English-language learners, andtheir general ability to teach effectively (see Exhibit 10).
The impact of having prior classroom experience continuedthroughout the first year of the program. In the following spring, just asin the fall, teachers who had prior classroom experience felt more confi-dent in their teaching abilities than those with no prior classroom expe-rience (see Exhibit 11). Over four-fifths (87%) of participants with priorclassroom experience reported that they have the necessary knowledgeand skills to teach effectively, compared to just over two-thirds (68%) ofparticipants with no such experience.
School context, like prior teaching experience, also impactedteacher efficacy. A supportive context can be empowering, making teach-ers feel like they have the skills and knowledge to be successful in theclassroom. A challenging school context, on the other hand, can makealternative certification participants question their own abilities. On all
Exhibit 11. Percent of Participants Agreeing with Various Statements about Self-Efficacy in the Spring, byExperience
**p < .01, *p < .05.Source: SRI Survey of Alternative Certification Program Participants (2004).
62
63
88
87
45
48
78
68
0% 20% 40% 60% 80% 100%
I currently have the necessary knowledgeand skills to teach effectively**
I feel confident in my ability to handle arange of classroom management and
discipline situations
I feel confident in my ability to address theneeds of English language learners*
I feel confident in my ability to address theneeds of special education students*
Participants
Classroom experience No classroom experience
28 Teachers College Record
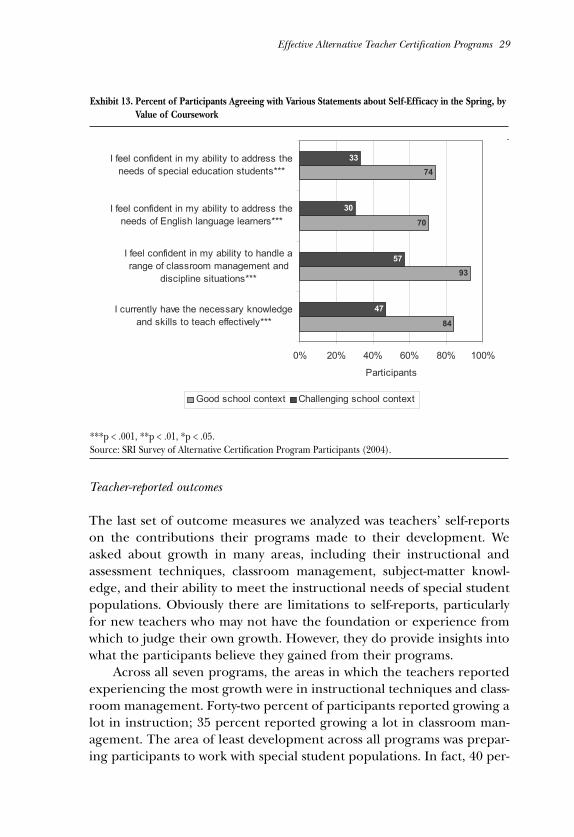
four of the efficacy measures, participants in good school contexts hadstronger feelings of efficacy than teachers in challenging school contexts(see Exhibit 12). They feel more confident in their ability to address theneeds of special education students (74% vs. 33%, respectively) and theirability to address the needs of English-language learners (70% vs. 30%).They also had more confidence with regard to their classroom manage-ment (93% vs. 57%), and in their knowledge and skills to teach effec-tively (8%4 vs. 47%).
Coursework, too, had an impact on teacher efficacy. Alternative cer-tification participants who felt that their coursework was valuable weresignificantly more likely to have stronger feelings of efficacy than teach-ers who reported their coursework as not valuable (see Exhibit 13). Aswith context, coursework impacted all measures of teacher efficacy.
Thus, teacher efficacy is enhanced by previous experience, a goodschool context, and valued coursework. Next, we examine teacher-reported outcomes.
Exhibit 12. Percent of Participants Agreeing with Various Statements about Self-Efficacy in the Spring, bySchool Context
***p < .001.Source: SRI Survey of Alternative Certification Program Participants (2004).
84
93
70
74
47
57
30
33
0% 20% 40% 60% 80% 100%
I currently have the necessary knowledgeand skills to teach effectively***
I feel confident in my ability to handle arange of classroom management and
discipline situations***
I feel confident in my ability to address theneeds of English language learners***
I feel confident in my ability to address theneeds of special education students***
Participants
Good school context Challenging school context
Effective Alternative Teacher Certification Programs 29
Teacher-reported outcomes
The last set of outcome measures we analyzed was teachers’ self-reportson the contributions their programs made to their development. Weasked about growth in many areas, including their instructional andassessment techniques, classroom management, subject-matter knowl-edge, and their ability to meet the instructional needs of special studentpopulations. Obviously there are limitations to self-reports, particularlyfor new teachers who may not have the foundation or experience fromwhich to judge their own growth. However, they do provide insights intowhat the participants believe they gained from their programs.
Across all seven programs, the areas in which the teachers reportedexperiencing the most growth were in instructional techniques and class-room management. Forty-two percent of participants reported growing alot in instruction; 35 percent reported growing a lot in classroom man-agement. The area of least development across all programs was prepar-ing participants to work with special student populations. In fact, 40 per-
Exhibit 13. Percent of Participants Agreeing with Various Statements about Self-Efficacy in the Spring, byValue of Coursework
***p < .001, **p < .01, *p < .05. Source: SRI Survey of Alternative Certification Program Participants (2004).
84
93
70
74
47
57
30
33
0% 20% 40% 60% 80% 100%
I currently have the necessary knowledgeand skills to teach effectively***
I feel confident in my ability to handle arange of classroom management and
discipline situations***
I feel confident in my ability to address theneeds of English language learners***
I feel confident in my ability to address theneeds of special education students***
Participants
Good school context Challenging school context
30 Teachers College Record
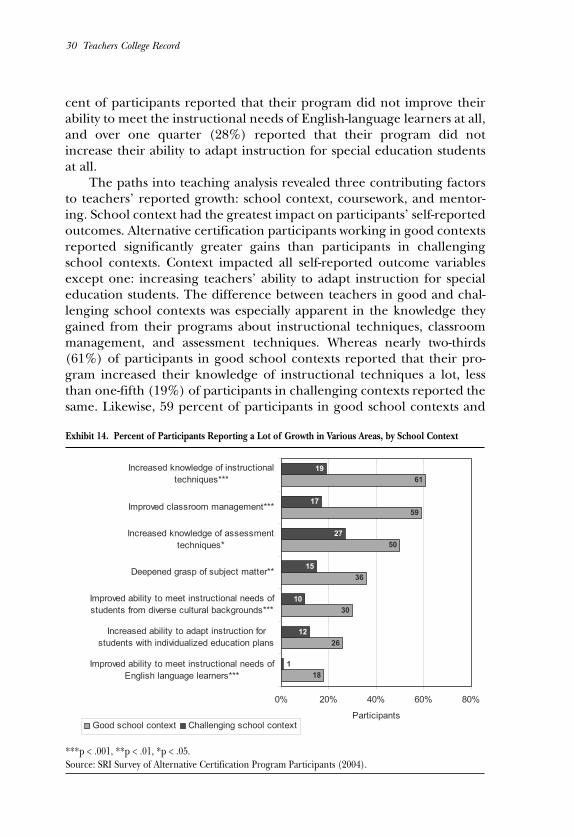
cent of participants reported that their program did not improve theirability to meet the instructional needs of English-language learners at all,and over one quarter (28%) reported that their program did notincrease their ability to adapt instruction for special education studentsat all.
The paths into teaching analysis revealed three contributing factorsto teachers’ reported growth: school context, coursework, and mentor-ing. School context had the greatest impact on participants’ self-reportedoutcomes. Alternative certification participants working in good contextsreported significantly greater gains than participants in challengingschool contexts. Context impacted all self-reported outcome variablesexcept one: increasing teachers’ ability to adapt instruction for specialeducation students. The difference between teachers in good and chal-lenging school contexts was especially apparent in the knowledge theygained from their programs about instructional techniques, classroommanagement, and assessment techniques. Whereas nearly two-thirds(61%) of participants in good school contexts reported that their pro-gram increased their knowledge of instructional techniques a lot, lessthan one-fifth (19%) of participants in challenging contexts reported thesame. Likewise, 59 percent of participants in good school contexts and
Exhibit 14. Percent of Participants Reporting a Lot of Growth in Various Areas, by School Context
***p < .001, **p < .01, *p < .05.Source: SRI Survey of Alternative Certification Program Participants (2004).
18
26
30
36
50
59
61
1
12
10
15
27
17
19
0% 20% 40% 60% 80%
Improved ability to meet instructional needs ofEnglish language learners***
Increased ability to adapt instruction forstudents with individualized education plans
Improved ability to meet instructional needs ofstudents from diverse cultural backgrounds***
Deepened grasp of subject matter**
Increased knowledge of assessmenttechniques*
Improved classroom management***
Increased knowledge of instructionaltechniques***
ParticipantsGood school context Challenging school context

Effective Alternative Teacher Certification Programs 31
only 17 percent of participants in challenging contexts reported thattheir program improved their classroom management a lot (see Exhibit14).
Despite the bad press that much teacher-preparation courseworkreceives, there were significant differences in teachers’ self-reports ofgrowth between those who identified their coursework as valuable andthose who reported their coursework to be of no value (see Exhibit 15).With the exception of improving participants’ ability to meet the instruc-tional needs of English-language learners, coursework seemed to make adifference. Teachers who identified their coursework as valuable (com-pared to those who identified their coursework as not valuable) reportedthat their program increased their instructional techniques a lot (50% vs.25%, respectively), increased their knowledge of assessment techniques(42% vs. 15%), and improved their classroom management (43% vs.18%). On one outcome—increasing teachers’ abilities to adapt instruc-tion for students with individualized education plans—coursework wasthe only input variable to show a difference. Clearly alternative certifica-
Exhibit 15. Percent of Participants Reporting a Lot of Growth in Various Areas, by Value of Coursework
***p < .001. Source: SRI Survey of Alternative Certification Program Participants (2004).
18
26
30
36
50
59
61
1
12
10
15
27
17
19
0% 20% 40% 60% 80%
Improved ability to meet instructional needs ofEnglish language learners***
Increased ability to adapt instruction forstudents with individualized education plans
Improved ability to meet instructional needs ofstudents from diverse cultural backgrounds***
Deepened grasp of subject matter**
Increased knowledge of assessmenttechniques*
Improved classroom management***
Increased knowledge of instructionaltechniques***
ParticipantsGood school context Challenging school context

32 Teachers College Record
tion participants feel that good coursework is beneficial to their growth.Despite the heavy emphasis placed on mentoring by many of the pro-
grams and by the literature on alternative certification, mentoringimpacted fewer self-reported growth outcomes than either school con-text or coursework. Alternative certification participants with more fre-quent mentoring reported that their program impacted their subject-matter knowledge, their ability to meet the instructional needs ofEnglish-language learners and students from diverse cultural back-grounds, and their classroom management (see Exhibit 16).
Despite the limits of teacher self-reports, we did find strong connec-tions between teacher growth and a variety of program inputs.
Student learning and alternative certification teachers
The contribution of alternative certification teachers to their students’
Exhibit 16. Percent of Participants Reporting a Lot of Growth in Various Areas, by Frequency ofMentoring
***p < .001, *p < .05.Source: SRI Survey of Alternative Certification Program Participants (2004).
13
23
32
35
36
38
47
5
17
16
19
22
23
41
0% 10% 20% 30% 40% 50%
Improved ability to meet instructional needs ofEnglish language learners***
Increased ability to adapt instruction forstudents with individualized education plans
Improved ability to meet instructional needs ofstudents from diverse cultural backgrounds*
Deepened grasp of subject matter*
Increased knowledge of assessment techniques
Improved classroom management*
Increased knowledge of instructional techniques
ParticipantsFrequent mentoring Infrequent mentoring

Effective Alternative Teacher Certification Programs 33
learning is both the most important outcome of an effective alternativecertification program and the most difficult to accurately measure. Thusfar, there is no definitive research on alternative certification teachersand student achievement. Conducting a large-scale student achievementstudy was beyond the scope of this study. And, although this study hadhoped to draw on existing research of the seven case study programs, wefound no solid studies that could adequately address questions about stu-dent achievement.
Existing studies of the relationship between a teacher’s route into theprofession and student achievement gains are the subject of considerablecontroversy. Although there is solid research showing, for example, thatstudents in secondary mathematics classes learn more from teachers withmathematics certification, studies have not yet shown whether the type ofmathematics certification (standard, alternative, emergency) makes a dif-ference (Goldhaber & Brewer, 2000). Several reports reveal no signifi-cant differences in student performances by students of teachers with dif-ferent types of certification (Miller, McKenna, & McKenna, 1998;Stafford & Barrow, 1994). Other studies have found differences. Laczko-Kerr (2002) found that the students of Teach For America (TFA) partic-ipants performed similarly to other under-certified teachers yet did notperform as well as the students of certified teachers. Raymond, Fletcher,and Luque (2001) found that TFA participants in Houston producedmore positive learning gains, and with greater regularity, than did othernew teachers and all other teachers in the district, regardless of years ofexperience. This study has been criticized on methodological grounds,however (Laczko-Kerr, 2002; National Commission on Teaching andAmerica’s Future, 2001).9 Further, Darling-Hammond, Holtzman, Gatlin,and Heilig (2005) reanalyzed the Houston data and reached the oppo-site conclusion. They found that certified teachers consistently producedsignificantly stronger student achievement gains than did uncertifiedteachers. In addition, they found that alternatively certified teachers,including Teach For America teachers, were generally less effective thancertified teachers at raising student achievement. Not surprisingly, thatstudy received sharp criticism from Teach for America proponents.
Another recent study of alternative certification and student achieve-ment employed an experimental design that compared achievementscores of students randomly assigned to either a Teach For Americateacher or another novice or veteran teacher in the same elementaryschool (Decker, Mayer, & Glazerman, 2004). The study found that stu-dents of Teach For America teachers outscored the control group of non-Teach For America teachers by three percentile points on the mathemat-ics portion of the Iowa Test of Basic Skills. In addition, students of Teach

34 Teachers College Record
For America teachers scored about the same as the control group on thereading portion of the exam. Critics of the study raised concerns aboutthe comparison group and pointed to the low achievement levels of bothgroups of students, and argued that the study’s conclusions should havecalled into question the efficacy of Teach For America as a strategy toremedy low student achievement (Darling-Hammond et al., 2005;Viadero, 2004). Nonetheless, the study is one of very few that havetracked the student achievement of a program’s graduates.
Our study was designed to draw on local program evaluations, butwas not designed to collect original data on student achievement. Whilethere were at least three studies of Teach For America (described above),we found no other comparable student achievement studies on the othersix programs we examined. However, our examination of alternative cer-tification programs and participants raises serious questions about thevalue of student achievement studies that try to compare traditional andalternative certification programs, or compare different alternative certi-fication programs. Despite the desire of both researchers and policy-mak-ers to have definitive student achievement studies of alternative and tra-ditional certification, our research suggests that the variation within pro-grams and among participants is so great that the program is probablythe wrong unit of analysis. We suspect that until researchers can figureout how to cut down on the variation, we will continue to see studentachievement studies that contradict each other or show minor differ-ences. If student achievement studies are to better inform efforts toimprove teacher preparation, then the studies will need to understandhow the mix of a participant’s education, background, experience, pre-service coursework, school context, mentoring support, and in-servicecoursework combines into a path into teaching that is more or less effec-tive at promoting student learning. Simply comparing student achieve-ment of teachers from one program to another wrongly assumes that theprogram will be implemented as designed, the participants will experi-ence the program in the same ways, and that the participants arrive at theprogram at the same starting point. Ultimately, the variation within pro-grams is as great as the variation across programs, rendering program-to-program comparisons unhelpful.
While a complex study of teachers’ paths into the profession wouldbe a major contribution to the field, the contributions of individualinputs to various outcomes uncovered in our research have implicationsfor improving student achievement. As we pointed out earlier, teacherretention, knowledge for teaching, and teacher efficacy have all beenassociated with higher student achievement. Thus, our findings suggestthat alternative certification programs that can produce new teachers

Effective Alternative Teacher Certification Programs 35
who will stay in teaching for more than a few years, demonstrate knowl-edge for teaching, and have strong teacher efficacy are much more likelyto produce student achievement gains than those that do not.
Next, we review the results of our paths into teaching analysis and dis-cuss the implications of the findings for the development of effectivealternative certification programs.
SUMMARY OF OUTCOMES
The paths into teaching analysis revealed that each input factor con-tributed in some way, and that some input factors appeared to contributea great deal to some positive outcomes. Next, we discuss each of the fac-tors and the implications of each for alternative certification programs.The factors associated with positive outcomes are presented in Exhibit 17.
School Context
Most notably, alternative certification participants working in schoolswith strong leadership, adequate supplies and materials, and a collegialwork environment were more likely to plan to stay in teaching, had moreconfidence in their teaching skills, and had a stronger sense of profes-sional growth than those working in challenging schools. Clearly, place-ment matters.
Our case studies underscored this point through powerful, personalstories. We observed and interviewed teachers who were overwhelmed inschools characterized by unruly and undisciplined students, an absenceof leadership, dreary facilities, a lack of basic supplies and materials, iso-lated teachers, and fear and mistrust. Although we did find some exam-ples of alternative certification teachers who were managing in suchschools, more often we found individuals who were exhausted, frustrated, and ready to quit. Three of the teachers from the original sample did quit before the year was out, and each was working in a highly
Exhibit 17. Factors Associated with Positive Outcomes
Undergraduate Previousuniversity classroom School selectivity experience context Coursework Mentoring
Teacherknowledge XRetention XEfficacy X X XReported growth X X X
36 Teachers College Record
dysfunctional school. Many more who were working in such schoolsreported that they planned to leave at the end of the school year.
By contrast, in other schools that served similar populations of stu-dents, we found alternative certification teachers who were equallyexhausted, but positive about their teaching and their decision to pursuean alternative route. These teachers pointed to the help they receivedfrom the school leadership and their colleagues, and to the overall schoolclimate. In these schools, the principal presented a clear vision for theschool, books and materials were ample, the building was clean and well-maintained even if old, and the interactions between teachers were posi-tive and friendly.
Alternative certification programs are likely to face a big challenge inensuring that their participants are placed in schools where they have anopportunity to learn and succeed. Many programs exist to amelioratelocal teacher shortages. If a program’s purpose is to find people to workin hard-to-staff, often dysfunctional, schools, it is unlikely they have muchcontrol over placement decisions. But, our findings are quite clear: agood school context is the most pervasive contributor to positive out-comes for teachers. Thus, an effective alternative certification programshould make the placement of its participants a primary focus. In themajority of cases studied, treatments were the same for participants in allplacements, although the needs were higher for teachers in challengingschool environments. When alternative certification programs cannotcontrol placement, accommodating for challenging school environmentsis of utmost importance. In addition, the importance of school contextsuggests that policy-makers have an obligation to address the problem ofdysfunctional schools with strategies that do more than alleviate teachershortages.
Coursework
Despite some critics’ negative assessments of teacher-preparation course-work, coursework made a major contribution to teachers’ sense of effi-cacy and professional growth. Although we did not analyze the content ofcoursework, our analysis of the course requirements, observations ofclasses, and interviews with participants suggested that much of thecoursework was designed to be relevant to the immediate needs of theparticipants.
Through the case studies, we found that the value of the courseworkwas directly tied to other factors in the participants’ experiences.Previous teaching experience appeared to provide a framework forunderstanding and application of the coursework. In addition, school
Effective Alternative Teacher Certification Programs 37
context appeared to play a role. Teachers in challenging school settingsappeared to be at a disadvantage in applying the lessons of the course-work.
Coursework also had its limits. Few alternative certification partici-pants reported that their coursework contributed greatly to their abilityto teach special education students and English-language learners. Inaddition, coursework did not appear to contribute to improvements inknowledge for teaching reading and mathematics or their content knowl-edge in those areas.
Our evidence suggests that an effective alternative certification pro-gram should have a carefully crafted and well-timed sequence of course-work that is relevant to the challenges facing alternative certified teach-ers. Much more needs to be known about the characteristics of effectivecoursework and the other factors (classroom experience, school context)that enable the participant to apply the coursework. Coursework shouldbe relevant both to participants with and without classroom experience,and to those in both supportive and challenging environments. Programsalso would benefit from more attention to the specific skills and knowl-edge associated with teaching different subject areas.
University selectivity and teaching experience
Other research has demonstrated that a strong educational backgroundcan translate into student learning gains (Wayne & Youngs, 2003). Andcommon sense tells us that having well-educated teachers is desirable formany reasons. Our research found that education background does con-tribute to performance on measures of teacher knowledge. This findingis particularly important as other research suggests that subject knowl-edge for teaching is related to student achievement (Hill et al., 2005). Atthe same time, it is notable that educational background did not appearto be a factor in teachers’ efficacy, predicted retention, or self-reports ofgrowth. Regardless, effective alternative certification programs shouldselect well-educated individuals or take steps to strengthen candidates’subject-matter knowledge and knowledge about teaching.
In addition, previous teaching experience contributed to teachers’sense of efficacy, a characteristic previously shown to be related to stu-dent achievement. Individuals with significant classroom experiencebring a set of attitudes and beliefs that may enhance their performancein an alternative certification program. However, participants with previ-ous classroom experience were no more likely to have plans to stay inteaching than participants without previous classroom experience.Further, previous teaching experience did not appear to have an effect
38 Teachers College Record
on teacher knowledge. The role of previous teaching experience inpreparing teachers in alternative certification programs requires moreresearch. At the very least, our findings suggest that the needs of experi-enced and inexperienced candidates differ, and effective alternative cer-tification programs recognize their differences.
Mentoring
Given the importance that programs place on mentoring, it was unex-pected to see somewhat limited contributions of mentoring on the out-come measures. Frequent mentoring was an important factor in teacher-reported growth in various areas of teaching skills and knowledge, but itdid not appear to be a factor in the other outcome areas—predictedretention, knowledge for teaching, or efficacy. Although much moreneeds to be known about mentoring, our hypothesis is that much of thementoring that participants received was of low quality. Only a small frac-tion of participants reported that their mentoring was very frequent orprovided the kinds of assistance that they most valued. That said, mentor-ing still remains a key characteristic of an effective alternative certifica-tion program. What is missing is a concerted effort by programs to pro-vide the training and resources mentors need to be effective.
CONCLUSION
Our findings indicate that an effective alternative certification programis careful to place candidates in school settings that feature strong lead-ership, a collegial atmosphere, and adequate supplies and materials.Only the most exceptional candidates can succeed in dysfunctionalschools. Effective alternative certification programs select well-educatedindividuals or take steps to strengthen candidates’ subject-matter knowl-edge, and recognize that previous classroom experience is an advantage.In addition, effective programs provide carefully constructed and timelycoursework that is tailored to candidates’ backgrounds and the chal-lenges that candidates face in their schools. Effective programs also pro-vide each candidate with a trained mentor who is given the time andresources to plan lessons with the candidates, share curriculum ideas,demonstrate lessons, and provide feedback after frequent classroomobservations.
While our research clearly points to the contributions of each ofthese characteristics, a simplistic list masks the complexity of preparingteachers through alternative routes. Because of the variation in how indi-viduals experience the same alternative certification program, as well as

Effective Alternative Teacher Certification Programs 39
the variation in support and training within programs, the creation ofeffective programs defies simple recipes. In order to effectively prepareteachers, programs need to accurately assess each participant’s teachingskills, knowledge, and performance at critical junctures, beginning withtheir selection and continuing throughout their training. Thus, effectiveprograms also need to collect data on their participants’ developmentthrough multiple methods (assessments, portfolios of teacher assign-ments and student work, observations, and interviews). Programs alsoneed to assess each participant’s teaching context and determine addi-tional supports that may be necessary. Then, programs need to use all theinformation to tailor the training and supports to each participant’sneed. This approach is especially important considering that programshave little control over contextual factors that we have shown to greatlyimpact teacher development.
Although our research was focused on alternative certification pro-grams, our findings are relevant to all forms of teacher preparation. Theblurring of the line between traditional and alternative certificationroutes and our finding that paths into teaching is the appropriate unit ofanalysis suggests that educational background, school context, previousteaching experience, coursework, and mentoring all contribute to a newteacher’s success.
In addition, our research suggests that the proper mix of candidates’backgrounds, program supports, and school placement can produce newteachers who are effective starting on the first day of school. The conven-tional wisdom that all new teachers must struggle during their first yearis both inaccurate and a disservice to teachers and students. Thus, thefinal key characteristic of effective alternative certification programs isthat they reject the assumption that floundering is a necessary part ofnew teachers’ experiences. Instead, effective programs embrace theunconventional view that new teachers and their students cannot afforda lost year.
Finally, the study’s findings point to the need for additional researchon alternative certification. Much more needs to be known about the rel-ative contributions of the various components of a path into teaching.Studies that compare the student achievement of alternative certificationparticipants with similar backgrounds, support, and school placementsare essential to confirm the findings of our study. Unfortunately, toomuch of the research in progress attempts to make program-to-programcomparisons, a research design that is likely to find minor differences.Our study only began to explore inside the black box of alternative certi-fication. Much more needs to be known about what and how participantsin these programs learn, how programs can be tailored to address the

40 Teachers College Record
needs of a diverse set of participants, and how program components suchas coursework and mentoring can be strengthened.
Despite the need for additional research, policy-makers should notwait to improve alternative certification. Our research reveals the prelim-inary roadmap to effective alternative certification programs.
APPENDIX A: CASE STUDY PROGRAMS
The following descriptions of the seven case study programs are based ondata collected between 2003 and 2004. Though the programs may havechanged since then, we provide these descriptions because they depictthe programs as we researched them.
The Teacher Education Institute (TEI) in the Elk Grove, California, UnifiedSchool District
TEI serves about 100 participants annually, and offers certification for allgrade levels, K-12, and in all subject areas. Operated as a partnershipbetween the Elk Grove Unified School District in northern Californiaand San Francisco State University, the program aims to meet the dis-trict’s growing need for credentialed teachers and to increase teacherquality by training teachers specifically in the district’s curriculum andinstructional practices.
TEI is based on an apprenticeship model and includes a combina-tion of coursework, observations, and student teaching. After attending80 hours of coursework during the summer, program participants spendthe fall semester taking courses three days per week and participating ina student teaching internship for 16 hours per week. Internships are con-ducted with a “master teacher coach” who guides the intern’s develop-ment. After an 80-hour intersession course, participants spend the springin a second internship for four days per week. Both the fall and springinternships include two weeks in which the participant is a sole classroomteacher. Coursework continues in the spring, albeit at the reduced rate offive hours per week.
Entry requirements into TEI include a bachelor’s degree and a min-imum grade point average of 2.5. The program is funded through partic-ipant tuition and fees, which total approximately $9,000 per year.
Milwaukee’s Metropolitan Multicultural Teacher Education Program (MMTEP)
A partnership between the University of Wisconsin-Milwaukee’s Schoolof Education, the Milwaukee Public Schools, the Milwaukee Teachers’

Effective Alternative Teacher Certification Programs 41
Education Association, and the University of Wisconsin-Extension,MMTEP is a teacher-preparation program designed specifically for indi-viduals who have been paraprofessionals or teacher’s aides in Milwaukeefor at least one year. The small program serves around 20 participants peryear and offers licensure for teaching grades 1–8. The program aims toprovide urban children living in poverty with effective teachers, recruitand prepare African-American and other minorities into the teachingprofession, and prepare teachers who will remain in the Milwaukee system.
During a six-week summer session, program participants take univer-sity classes and teach in Milwaukee’s summer schools. Their continuationin the program depends on a positive evaluation of their ability to relateto children and on their preparedness for assuming full-time teachingresponsibilities. During the following school year, participants serve asthe teacher of record, supported by a trained mentor who visits the class-room at least weekly throughout the year. Participants also continue tomeet weekly for their university courses during this time.
In addition to having been a paraprofessional or teacher aide inMilwaukee for at least 1 year, applicants must have a bachelor’s degree,pass interviews and background checks by both the Milwaukee PublicSchools and the University of Wisconsin-Milwaukee, and be admissible aspost-baccalaureate students to the university’s School of Education.
New Jersey’s Provisional Teacher Program
The New Jersey Provisional Teacher Program, established in 1984, wasthe first statewide alternative certification program in the country. It wasdesigned to allow career changers and other talented individuals stream-lined access to the teaching profession, and to eliminate the need to hireemergency teachers. To enroll in the program, individuals first obtain acertificate of eligibility authorizing them to seek a teaching position.Requirements include a bachelor’s degree with a minimum grade pointaverage of 2.75; a major in the discipline which the secondary school can-didates teach; and a passing score on the Praxis II subject assessment testor National Teacher Examination (NTE) programs specialty area test.On the individual obtaining the certificate of eligibility and accepting anoffer with a school, the hiring district registers the employment with thestate’s Office of Professional Development, the New Jersey Departmentof Education issues a provisional license, and the individual is recognizedas an alternative-route teacher.
While working under the provisional license, the teacher attends aformal program offered by one of 32 regional training centers. Located
42 Teachers College Record
across the state, most training centers are operated by universities,although three are run by district consortia. The employing district orschool also provides mentoring, supervision, and three evaluations—twoformative and one summative. The alternative-route teachers pay a men-tor $450 for full-time support during their initial 20 days of teaching, andan additional $550 for continued support over a 30-week period.
The New Jersey program offers certification in all grades and subjectareas. More than 40 percent of New Jersey’s teachers attain certificationthrough the Provisional Teacher Program. In 2002–03, 2,700 individualswere part of the program.
New York City Teaching Fellows Program
The New York City Teaching Fellows program was created to fill vacanciesin some of New York City’s lowest-performing schools. Having preparedabout 2,600 teachers in 2003, the Teaching Fellows program is one of thelargest alternative certification programs in the country.
The Teaching Fellows program is a two-year program in which partic-ipants simultaneously work toward certification and a master’s degree.Fellows participate in a two-month pre-service training during the sum-mer that includes master’s degree coursework; field placement work, inwhich Fellows observe and assist in classrooms; and Fellow Advisory meet-ings, in which Fellows meet together with an advisor to share experiencesand to learn practical classroom skills and management techniques. Inthe following two academic years, Fellows serve as teachers of record, andongoing program components include continued master’s degreecoursework, school-based mentors, university-based mentors, and meet-ings with other Fellows. Master’s degree coursework is provided by adozen local public and private colleges and universities.
The New Teacher Project works with the Fellows Program in recruit-ing and selecting candidates for the program. In addition to meeting theminimal requirements of a bachelor’s with a minimum grade point aver-age of 3.0, candidates must participate in an interview event in whichthey teach a sample lesson, discuss education-related articles, respond tospecific classroom issues, and engage in a one-on-one interview.
The program offers certification in all grades and content areas, butis especially dedicated to recruiting applicants eligible for and interestedin teaching in a high-need subject area: bilingual education, English,mathematics, science, Spanish, or special education. Fellows receive astipend during the pre-service training session to help defray living costs.However, they are responsible for $4,000 of tuition costs of their subsi-dized master’s degree program.

Effective Alternative Teacher Certification Programs 43
North Carolina’s NC TEACH
Established in 2000, NC TEACH (North Carolina Teachers of Excellencefor All Children) was designed to support mid-career professionals whowanted to switch to a career in education. Administered by the Universityof North Carolina Office of the President in collaboration with the NorthCarolina Department of Public Instruction, NC TEACH serves morethan 350 participants annually, and offers certification in middle grades(mathematics, science, social studies, and language arts), high school(mathematics, science, social studies, and English), and K-12 (Spanish,French, English as a second language add-on, and special populations).
NC TEACH participants attend an orientation followed by a five-week intensive summer institute of full-time coursework. Courses areoffered at each of 13 University of North Carolina host campuses. Aftersuccessfully completing the summer institute, participants teach full-timein a North Carolina public school while continuing to attend NC TEACHlicensure classes and seminars. While serving as the teacher of record,each participant is assigned a mentor by the local education agency.
Requirements for admission to NC TEACH include a bachelor’sdegree; a 2.5 cumulative grade point average or higher for all postsec-ondary work; a degree with a major in, or relevant to, the desired licen-sure area; and at least three years of full-time work experience since grad-uation from college. NC TEACH participants pay regular tuition rates totheir host universities’ graduate schools.
Teach For America
Teach For America (TFA) recruits new college graduates from competi-tive universities to serve as teachers in hard-to-staff urban and rural dis-tricts. The program’s overall goals are to close the achievement gap byproviding teachers to under-resourced schools and producing futureleaders who are committed to closing the achievement gap. Beyond min-imal requirements for applications (i.e., 2.5 cumulative grade point aver-age and a bachelor’s degree), TFA accepts corps members who haverecords of achievement, are committed to the TFA mission, acceptresponsibility for outcomes, demonstrate organizational ability, showrespect for others, and possess critical thinking skills.
TFA corps members attend a five-week summer training session, anda one- to two-week orientation in their placement region. Before the ses-sion and orientation take place, corps members are expected to com-plete assigned readings, conduct structured observations of teachersfocusing on specific topics covered in those readings, and hold follow-up
44 Teachers College Record
conversations with the teachers they observe. After completing the sum-mer training, TFA corps members become the teacher of record inanother classroom starting in the fall. During the school year, theyreceive ongoing support from the TFA regional office, including obser-vations with feedback; content- or grade-specific learning teams thatfocus on key teaching issues; other workshops on specific instructionalissues; discussion groups; and “all corps” meetings. TFA participants arealso expected to attend a certification program offered by a local univer-sity or other credentialing program.
TFA corps members make a two-year commitment to teaching. In2003, more than 1,800 corps members worked in 20 regions across thecountry.
Texas Region XIII Education Service Center’s Educator Certification Program
The Texas Region XIII Education Service Center’s EducatorCertification Program aims to recruit mid-career professional and recentcollege graduates in high-need subject areas. The Texas Region XIII program offers certification in elementary education, elementary/bilin-gual education, special education, middle education in specific contentareas, secondary education in specific content areas, and career andtechnology.
Before becoming teachers of record, program participants takecourses offered online and at the Region XIII training center in thespring. They also participate in a two-week field experience while contin-uing their coursework. Participants must find employment as an internin a school by October 1 to continue in the program. The vast majoritywho find a teaching job become teachers of record. During this internyear, they are supported by school-based mentors who are trained byRegion XIII and by program-based field supporters. Coursework alsocontinues during the intern year.
Program applicants must hold a bachelor’s degree with an overallgrade point average of 2.5 in all courses, or 2.75 in the last 60 semesterhours completed; provide evidence of competency in reading, writing,and mathematics through test records, college coursework, or a master’sdegree; have the required coursework and semester hours for the desiredcertificate area; participate in an online structured interview; provideprofessional references; and have daily access to a computer. In 2003,more than 300 participated in the program. Participants must paytuition, as well as testing and licensure fees, which total nearly $5,000.

Effective Alternative Teacher Certification Programs 45
APPENDIX B: QUANTITATIVE STUDY METHODS
Survey administration, response rate, and weighting
We administered the survey to participants in each of the seven programsonce before the program started (fall 2003) and at the end of their firstyear of teaching (spring 2004). In programs with less than 500 partici-pants (Texas Region XIII, TEI, MMTEP, and NC TEACH), we surveyedthe population. In the NYC Teaching Fellows Program, we surveyed arepresentative sample of 350 elementary and special education partici-pants. In New Jersey, we surveyed the population of three of the 32regional training centers. In Teach For America, we surveyed a represen-tative sample of 350 teachers from one summer training institute.
We used mixed methods of survey administration to maximize thesurvey response rate, which included administration during course time,where possible, and direct mailing to individuals. The survey was mailedto NYC Teaching Fellows directly in both the fall and the spring. Becauseof varying program schedules, and because of the multiple methods usedto collect the survey data, we accepted completed questionnairesbetween April and December 2003 for the pre-program survey, andbetween March and August 2004 for the post-program survey. Follow-up,which included mailing surveys and reminders to both home and schooladdresses and phone calls, was also conducted during this time, with afocus on programs with fewer respondents.
Exhibit B-1 displays the program populations at the time of each sur-vey, as well as how many participants were surveyed, how manyresponded, the response rate and the range of the weights used in theanalyses featured in this paper. In all analyses, participants were assignedweights based on the following characteristics: program, placement (gen-eral vs. special education and elementary vs. secondary), and status in theprogram (whether the participant was in the program in the fall only, thespring only, or both). There are multiple weights for each participant,depending on the analysis completed; the weight range is displayed inExhibit B-1.
After closing the survey, we conducted a non-response study of theNYC Fellows Program due to the low response rate for this program. Wesampled 10 non-respondents who represented a range of schools, basedon an official need rating assigned by the New York City Department ofEducation. Six of the 10 sampled teachers responded to the phone sur-vey in which we asked key survey questions and probed why they did notrespond. Several participants expressed that they never received the sur-vey, or that it was sent to a different address, and others said they did not
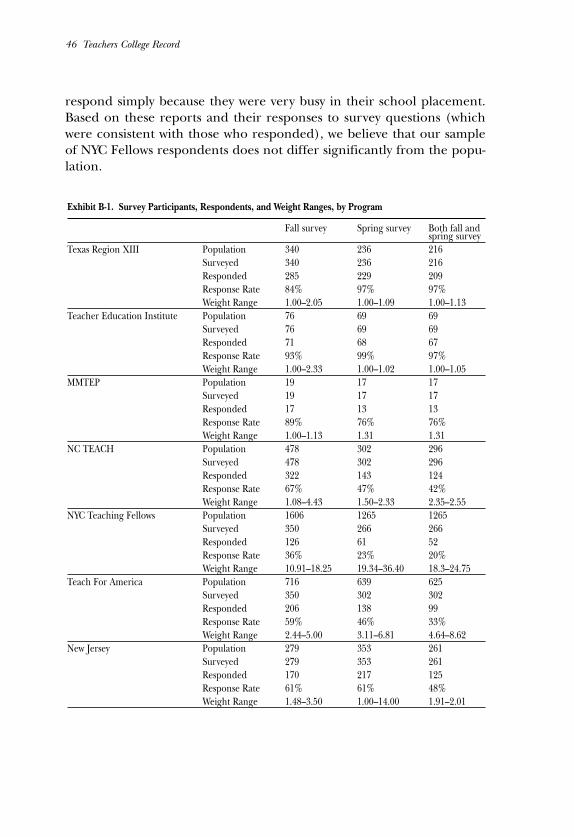
46 Teachers College Record
respond simply because they were very busy in their school placement.Based on these reports and their responses to survey questions (whichwere consistent with those who responded), we believe that our sampleof NYC Fellows respondents does not differ significantly from the popu-lation.
Exhibit B-1. Survey Participants, Respondents, and Weight Ranges, by Program
Fall survey Spring survey Both fall and spring survey
Texas Region XIII Population 340 236 216Surveyed 340 236 216Responded 285 229 209Response Rate 84% 97% 97%Weight Range 1.00–2.05 1.00–1.09 1.00–1.13
Teacher Education Institute Population 76 69 69Surveyed 76 69 69Responded 71 68 67Response Rate 93% 99% 97%Weight Range 1.00–2.33 1.00–1.02 1.00–1.05
MMTEP Population 19 17 17Surveyed 19 17 17Responded 17 13 13Response Rate 89% 76% 76%Weight Range 1.00–1.13 1.31 1.31
NC TEACH Population 478 302 296Surveyed 478 302 296Responded 322 143 124Response Rate 67% 47% 42%Weight Range 1.08–4.43 1.50–2.33 2.35–2.55
NYC Teaching Fellows Population 1606 1265 1265Surveyed 350 266 266Responded 126 61 52Response Rate 36% 23% 20%Weight Range 10.91–18.25 19.34–36.40 18.3–24.75
Teach For America Population 716 639 625Surveyed 350 302 302Responded 206 138 99Response Rate 59% 46% 33%Weight Range 2.44–5.00 3.11–6.81 4.64–8.62
New Jersey Population 279 353 261Surveyed 279 353 261Responded 170 217 125Response Rate 61% 61% 48%Weight Range 1.48–3.50 1.00–14.00 1.91–2.01

Effective Alternative Teacher Certification Programs 47
Factor analysis
We conducted factor analyses on all items that we believed were part of alatent factor. We used MPLUS statistical software because of its ability tobuild models with dichotomous and ordered categorical variables.MPLUS produces sample correlations, eigenvalues, and the following sta-tistics of model fit: (1) chi-square test, which, if significant, indicates apoor model fit; (2) the Root Mean Square Error of Approximation(RMSEA), which indicates satisfactory model fit if below 0.06; and (3) theRoot Mean Square Residual (RMR), which indicates satisfactory modelfit if below 0.08 (Hu & Bentler, 1999). It is important to note that the chi-square test is sensitive to sample size, with large samples often returningstatistically significant chi-square values. For this reason, our analysespaid particular attention to the RMR and RMSEA as indicators of modelfit, since neither is sensitive to sample size.
We initially conducted exploratory factor analyses (EFA). Based onthe results of the EFA, we selected the items to be included in each fac-tor. In most cases, we chose the factor with which the item loaded moststrongly; in a few cases where items had multiple strong loadings, wegrouped the item with the factor best fitting conceptually. Next, we dis-cuss how we created each of the factor scores for school context, teacherknowledge, and mentoring.
School context
The school context variable is a factor score comprised of three separatefactors: supportive administration, availability of materials, and teachercollaboration around instruction. The supportive administration andavailability of materials factors were part of a larger set of questions witha four-point Likert scale of agreement on various statements. The four-factor solution of these items, which included factors for teacher trustand teacher stress level, had an RMSEA of 0.06 and an RMR of 0.02, aswell as an eigenvalue that indicated a four-factor solution. The teachercollaboration items were part of a single analysis, with an RMSEA of 0.05and an RMR of 0.02, as well as an eigenvalue that indicated a one-factorsolution.
To create the school context factor score, we calculated the z-score ofeach item comprising the subfactors, using the unweighted mean andstandard deviation. We then summed the z-scores of the items thatbelong in the factor, and calculated a z-score of that sum, producingthree separate factor scores. To create the single school context factor, wesummed the scores of the three factors and calculated the z-score of the

48 Teachers College Record
sum, using the weighted mean and weighted standard deviation of thesum. The result of these score calculations was a single continuous vari-able, which at the high end of the distribution indicates a supportiveschool context, as defined by the factors, and at the low end indicates achallenging school context.
Frequency of mentoring
The frequency of mentoring variable was created by completing a factoranalysis on items with a five-point Likert scale of frequency of variousmentoring activities. Exploratory factor analyses found three separatefactors: (1) classroom visitation and feedback, (2) instructional planningand provision of materials, and (3) observations of the mentor’s teach-ing. This model produced an RMSEA of 0.06 and an RMR of 0.02. Inorder to create a factor score, we calculated the z-score of each item com-prising the subfactors, using the unweighted mean and standard devia-tion. We then summed the z-scores of the items that belong in the factor,and calculated a z-score of that sum. These calculations produced threeseparate factor scores. To create the single frequency of mentoring fac-tor, we summed the scores of the three factors and calculated the z-scoreof the sum, using the weighted mean and weighted standard deviation.The result of these score calculations was a single continuous variable,which at the high end of the distribution indicates frequent mentoringand at the low end indicates infrequent mentoring.
Knowledge for teaching
The teacher knowledge analysis was completed by conducting a factoranalysis on 56 dichotomous variables (with correct or incorrect answers).A missing data analysis was conducted, and only those respondents whoanswered over 80 percent of the questions in both the reading and mathsections were included. In addition, respondents who answered “don’tknow” to over 75 percent of the knowledge questions were omitted. Allothers were included, and missing responses were treated as incorrectanswers. Before conducting the factor analysis, items were grouped into16 testlets, or groups of similar questions. Exploratory factor analyses ofthese testlets found three separate factors: content knowledge (in bothreading and math), knowledge for teaching reading, and knowledge forteaching mathematics. This model produced an RMSEA of 0.01 and anRMR of 0.04. We also found a satisfactory one-factor solution, which pro-duced an RMSEA of 0.06 and an RMR of 0.06.
Because we were concerned with being able to make comparisons
Effective Alternative Teacher Certification Programs 49
between fall and spring score, we used the spring weighted means andweighted standard deviations to create both the fall and spring factorscores. We calculated the z-score of each item comprising the subfactors,using the unweighted mean and standard deviation. We then summedthe z-scores of the items that belonged in the factor, and calculated a z-score of that sum. To calculate growth scores, we subtracted the fall z-score from the spring z-score, then calculated the z-score of the differ-ence, using the weighted mean and standard deviation of the fall score.This analysis only included elementary school teachers, which notablydecreased our sample size, as well as eliminating from analysis NCTEACH, which only trains secondary teachers.
These calculations produced three separate factor scores and a one-factor solution that encompassed all three. The result of these score cal-culations was a single continuous variable, which at the high end of thedistribution indicates high achievement on the measure of teacherknowledge and at the low end indicates a poor achievement. Note that inconducting our exploratory regression analysis (discussed briefly below)we used the teacher knowledge factor scores. However, all teacher knowl-edge analyses discussed in the body of this report used a simple averagevariable of the percent correct in each of the domains identified by ourexploratory factor analysis.
Outcome analysis
In our analysis of paths into teaching, we were ultimately interested inwhich of the possible teacher characteristic and program treatment vari-ables made an impact on specific outcomes. Toward this end, our prelim-inary analysis of the data used each of the outcome variables (teacherknowledge, teacher efficacy, predicted retention, and teacher-reportedgrowth) as dependent variables in multiple regression analyses with thefollowing as independent variables: school context, coursework, fre-quency of mentoring, classroom experience, and university selectivity, aswell as program and placement variables, which were included in selectanalyses. Our strategy was to conduct stepwise regression analyses tostudy the relationships between program components, context, and out-comes, in order to examine the amount of variance in outcomes that isexplained by each of the inputs. Once we identified the key inputs foreach outcome variable, we completed the cross-tabulations presented inthe body of this paper. Regression results are available by request fromthe authors. We now turn to a discussion of each of the components ofthe analyses featured in this report.
School context. The school context factor score is a continuous vari-

50 Teachers College Record
able, with a low score indicating challenging school context and a highscore indicating a good school context. In the analyses represented in thebody of the report, respondents were divided into weighted quartiles,with those in the top quartile considered to be in a “good” context andthose in the bottom quartile considered to be in a “challenging” context.Note that these quartiles are not exactly even, due to response clustering.These two groups of participants are, indeed, teaching in quite differentsituations. For example, 83 percent of participants in good contextsreported that they have the instructional materials they need withoutpurchasing them, compared to only 6 percent in challenging contexts.Similarly, 76 percent of participants in good contexts talk at least weeklywith colleagues about instruction, compared to only 30 percent of thosein challenging school contexts. Finally, 88 percent of participants in goodcontexts reported that their administrator is trusted by teachers, com-pared to less than 5 percent of those in schools with a challenging con-text. See Exhibit B-2 for the number of participants in each category.
Coursework. We asked about the importance of coursework bothbefore and during the school year. In the body of the report, we consid-ered those who reported they received moderately or very importantcoursework at either point to have had valuable coursework, while all oth-ers (including those who did not receive coursework) were considered tohave received poor coursework. See Exhibit B-2 for the number of partic-ipants in each category.
Frequency of mentoring. The mentoring factor score is a continuousvariable, with a low score indicating low-frequency mentoring and a highscore indicating high-frequency mentoring. In the analyses representedin the body of the report, respondents were divided into quartiles, withthose in the top quartile considered to have received high-frequencymentoring and those in the bottom quartile considered to have receivedlow-frequency mentoring. Note that these quartiles are not exactly even,due to response clustering. Those in the high quartile received muchmore mentoring support; for example, 43 percent of those in the topquartile reported having planned lessons with their mentor at leastmonthly, while over 90 percent of those in the bottom quartile never par-ticipated in this activity. It is important to understand, however, that evenin the top quartile of mentoring frequency, over half of participantsreceived such support less than a few times over an entire year. SeeExhibit B-2 for the number of participants in each category.
Classroom experience. In the body of the report, we considered partici-pants experienced if they had nine months or more of classroom experi-ence and inexperienced if they had none. See Exhibit B-2 for the num-ber of participants in each category.
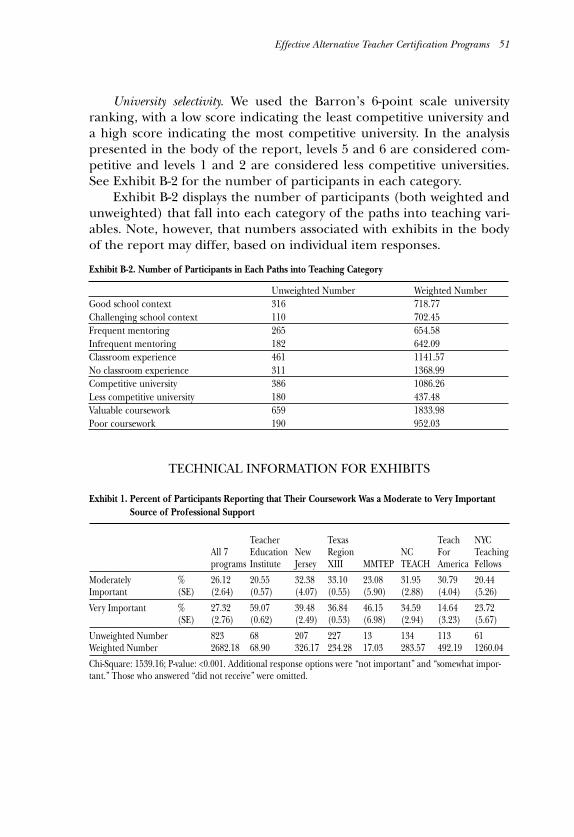
Effective Alternative Teacher Certification Programs 51
University selectivity. We used the Barron’s 6-point scale universityranking, with a low score indicating the least competitive university anda high score indicating the most competitive university. In the analysispresented in the body of the report, levels 5 and 6 are considered com-petitive and levels 1 and 2 are considered less competitive universities.See Exhibit B-2 for the number of participants in each category.
Exhibit B-2 displays the number of participants (both weighted andunweighted) that fall into each category of the paths into teaching vari-ables. Note, however, that numbers associated with exhibits in the bodyof the report may differ, based on individual item responses.
TECHNICAL INFORMATION FOR EXHIBITS
Exhibit B-2. Number of Participants in Each Paths into Teaching Category
Unweighted Number Weighted NumberGood school context 316 718.77Challenging school context 110 702.45Frequent mentoring 265 654.58Infrequent mentoring 182 642.09Classroom experience 461 1141.57No classroom experience 311 1368.99Competitive university 386 1086.26Less competitive university 180 437.48Valuable coursework 659 1833.98Poor coursework 190 952.03
Exhibit 1. Percent of Participants Reporting that Their Coursework Was a Moderate to Very ImportantSource of Professional Support
Teacher Texas Teach NYCAll 7 Education New Region NC For Teachingprograms Institute Jersey XIII MMTEP TEACH America Fellows
Moderately % 26.12 20.55 32.38 33.10 23.08 31.95 30.79 20.44Important (SE) (2.64) (0.57) (4.07) (0.55) (5.90) (2.88) (4.04) (5.26)
Very Important % 27.32 59.07 39.48 36.84 46.15 34.59 14.64 23.72(SE) (2.76) (0.62) (2.49) (0.53) (6.98) (2.94) (3.23) (5.67)
Unweighted Number 823 68 207 227 13 134 113 61Weighted Number 2682.18 68.90 326.17 234.28 17.03 283.57 492.19 1260.04
Chi-Square: 1539.16; P-value: <0.001. Additional response options were “not important” and “somewhat impor-tant.” Those who answered “did not receive” were omitted.

52 Teachers College Record
Exhibit 2. Frequency of Observations and Feedback from Program Staff and University Supervisors
Teacher Texas Teach NYCAll 7 Education New Region NC For Teachingprograms MMTEP Institute Jersey XIII TEACH America Fellows
At least monthly % 34.13 84.62 55.88 43.60 39.97 34.06 27.10 24.54(SE) (2.82) (5.05) (0.74) (1.75) (0.55) (5.98) (3.73) (2.72)
At least once % 53.88 15.38 44.12 51.43 59.58 46.50 72.90 49.91(SE) (2.94) (5.05) (0.74) (1.78) (0.55) (6.25) (3.73) (3.11)
Unweighted Number 855 13 68 213 227 61 137 136Weighted Number 2807.06 17.03 68.90 347.16 234.28 1260.04 592.73 286.92Chi-Square: 588.07, P-value: <0.001. “At least monthly” includes those answering “about monthly” or “at leastweekly;” “at least once” includes those answering “once” or “a few times.” “Never” was an additional responseoption.
Exhibit 3. Frequency of Observations and Feedback from In-School Mentors
Teacher NYC Texas TeachAll 7 Eduation Teaching Region NC New Forprograms Institute Fellows MMTEP XIII TEACH Jersey America
At least monthly % 69.06 86.76 82.61 76.92 73.09 57.14 55.92 50.09(SE) (2.42) (0.50) (4.85) (5.90) (0.52) (3.08) (4.24) (4.10)
At least once % 23.52 11.79 14.48 23.08 25.16 26.06 32.83 36.67(SE) (2.29) (0.50) (4.58) (5.90) (0.51) (2.74) (4.20) (4.01)
Unweighted Number 860 68 61 13 227 138 215 138Weighted Number 2817.53 68.90 1260.04 17.03 234.28 291.10 350.34 595.84Chi-Square: 727.34; P-value: <0.001. “At least monthly” includes those answering “about monthly” or “at leastweekly;” “at least once” includes those answering “once” or “a few times.” “Never” was an additional responseoption.
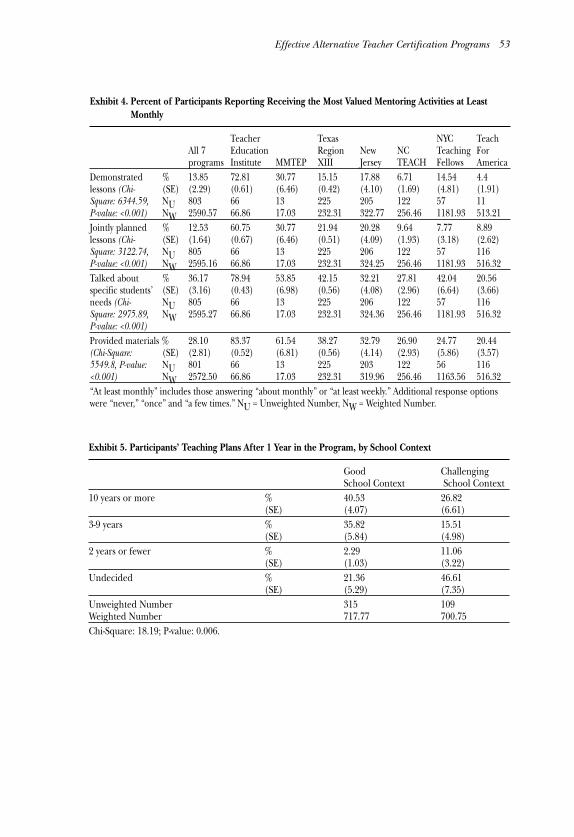
Effective Alternative Teacher Certification Programs 53
Exhibit 4. Percent of Participants Reporting Receiving the Most Valued Mentoring Activities at LeastMonthly
Teacher Texas NYC TeachAll 7 Education Region New NC Teaching Forprograms Institute MMTEP XIII Jersey TEACH Fellows America
Demonstrated % 13.85 72.81 30.77 15.15 17.88 6.71 14.54 4.4lessons (Chi- (SE) (2.29) (0.61) (6.46) (0.42) (4.10) (1.69) (4.81) (1.91)Square: 6344.59, NU 803 66 13 225 205 122 57 11P-value: <0.001) NW 2590.57 66.86 17.03 232.31 322.77 256.46 1181.93 513.21Jointly planned % 12.53 60.75 30.77 21.94 20.28 9.64 7.77 8.89lessons (Chi- (SE) (1.64) (0.67) (6.46) (0.51) (4.09) (1.93) (3.18) (2.62)Square: 3122.74, NU 805 66 13 225 206 122 57 116P-value: <0.001) NW 2595.16 66.86 17.03 232.31 324.25 256.46 1181.93 516.32Talked about % 36.17 78.94 53.85 42.15 32.21 27.81 42.04 20.56specific students’ (SE) (3.16) (0.43) (6.98) (0.56) (4.08) (2.96) (6.64) (3.66)needs (Chi- NU 805 66 13 225 206 122 57 116Square: 2975.89, NW 2595.27 66.86 17.03 232.31 324.36 256.46 1181.93 516.32P-value: <0.001)Provided materials % 28.10 83.37 61.54 38.27 32.79 26.90 24.77 20.44(Chi-Square: (SE) (2.81) (0.52) (6.81) (0.56) (4.14) (2.93) (5.86) (3.57)5549.8, P-value: NU 801 66 13 225 203 122 56 116<0.001) NW 2572.50 66.86 17.03 232.31 319.96 256.46 1163.56 516.32“At least monthly” includes those answering “about monthly” or “at least weekly.” Additional response optionswere “never,” “once” and “a few times.” NU = Unweighted Number, NW = Weighted Number.
Exhibit 5. Participants’ Teaching Plans After 1 Year in the Program, by School Context
Good ChallengingSchool Context School Context
10 years or more % 40.53 26.82(SE) (4.07) (6.61)
3-9 years % 35.82 15.51(SE) (5.84) (4.98)
2 years or fewer % 2.29 11.06(SE) (1.03) (3.22)
Undecided % 21.36 46.61(SE) (5.29) (7.35)
Unweighted Number 315 109Weighted Number 717.77 700.75Chi-Square: 18.19; P-value: 0.006.

54 Teachers College Record
Exhibit 6. Teaching Plans of Participants Who Were Undecided in the Fall After 1 Year in the Program,by School Context
Good ChallengingSchool Context School Context
10 years or more % 39.79 9.65(SE) (15.96) (7.94)
3-9 years % 40.37 5.20(SE) (16.22) (3.71)
2 years or fewer % 2.62 4.02(SE) (2.39) (2.65)
Undecided % 17.22 81.13(SE) (6.69) (9.23)
Unweighted Number 47 21Weighted Number 176.81 230.98Chi-Square: 117.65; P-value: <0.001.
Exhibit 7. Percentiles of Fall Teaching Knowledge Scores, by University Selectivity
Less Competitive Percentile: Competitive University UniversityOverall (Wald F: 10.93, P-value: <0.001) 64 29Content (Wald F: 8.84, P-value: <0.001) 64 35Reading (Wald F: 5.02, P-value: 0.007) 54 38Mathematics (Wald F: 6.76, P-value: 0.001) 66 39Unweighted Number 161 48Weighted Number 638.84 187.66The average raw score for each group was translated into a percentile rank. By request of SII researchers,we do not report raw scores or the statistics associated with them, with the exception of tests of signifi-cance, which were conducted using means of raw scores. This analysis is cross-sectional (all fall respon-dents are included).
Exhibit 8. Percentiles of Spring Teaching Knowledge Scores, by University Selectivity
Less Competitive Percentile: Competitive University UniversityContent (Wald F: 4.81, P-value: 0.008) 73 57Reading (Wald F: 1.44, P-value: 0.237) 65 65Mathematics (Wald F: 1.08, P-value: 0.341) 66 66Unweighted Number 117 41Weighted Number 593.53 130.94The average raw score for each group was translated into a percentile rank (using the fall scale). By requestof SII researchers, we do not report raw scores or the statistics associated with them, with the exception oftests of significance, which were conducted using means of raw scores. This analysis is cross-sectional (allspring respondents are included).

Effective Alternative Teacher Certification Programs 55
Exhibit 9. Percent Improvement in Knowledge Questions Correct: Teacher Education Institute vs. All Other Programs
TeacherPercent Improvement: Education Institute Other ProgramsOverall (Wald F: 28.01, P-value: <0.001) 14.93 7.89Content (Wald F: 44.36, P-value: <0.001) 19.88 8.88Reading (Wald F: 5.35, P-value: 0.021) 14.37 8.11Mathematics (Wald F: 10.75, P-value: 0.001) 12.00 6.40Unweighted Number 44 300Weighted Number 46.20 1573.65To calculate percent improvement, we divided the average of the individual growth scores by the totalnumber of items in each test group. By request of SII researchers, we do not report raw scores or the sta-tistics associated with them, with the exception of tests of significance, which were conducted using meansof raw growth scores.
Exhibit 10. Percent of Participants Agreeing with Various Statements about Self-Efficacy in the Fall, byExperience
No Classroom Classroom Experience Experience
I feel confident in my ability to handle a % 79.43 66.62range of classroom management and (SE) (2.18) (3.09)discipline situations (Chi-Square: 11.35, NU 607 441P-value: 0.004) NW 1340.04 1694.82I feel confident in my ability to address the % 57.86 45.68needs of English-language learners (Chi- (SE) (2.90) (3.25)Square: 7.37, P-value: 0.025) NU 606 439
NW 1338.54 1676.84I currently have the necessary knowledge % 57.50 32.99and skills to teach effectively (Chi-Square: (SE) (2.84) (3.20)32.99, P-value: <0.001) NU 607 441
NW 1340.04 1694.82Response options were “strongly disagree,” “disagree,” “agree,” and “strongly agree.” NU/W =Unweighted/Weighted Number.
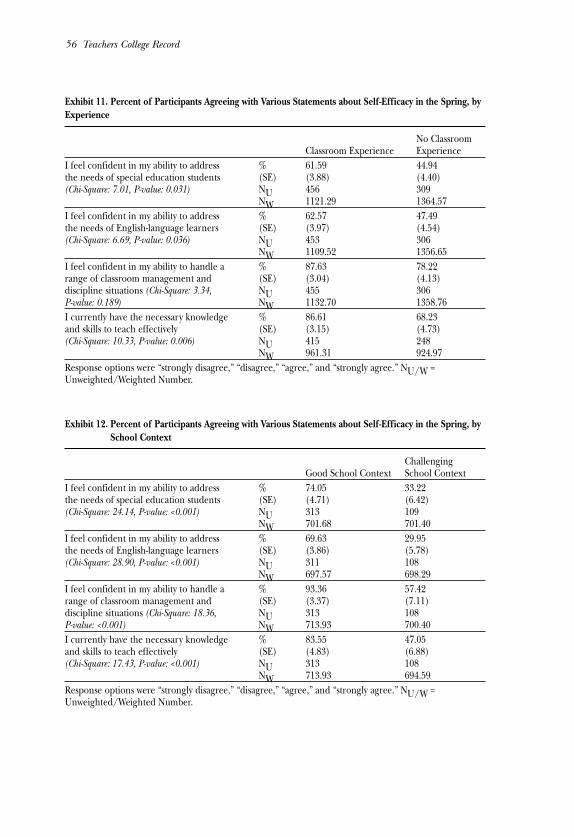
56 Teachers College Record
Exhibit 11. Percent of Participants Agreeing with Various Statements about Self-Efficacy in the Spring, byExperience
No Classroom Classroom Experience Experience
I feel confident in my ability to address % 61.59 44.94the needs of special education students (SE) (3.88) (4.40)(Chi-Square: 7.01, P-value: 0.031) NU 456 309
NW 1121.29 1364.57I feel confident in my ability to address % 62.57 47.49the needs of English-language learners (SE) (3.97) (4.54)(Chi-Square: 6.69, P-value: 0.036) NU 453 306
NW 1109.52 1356.65I feel confident in my ability to handle a % 87.63 78.22range of classroom management and (SE) (3.04) (4.13)discipline situations (Chi-Square: 3.34, NU 455 306P-value: 0.189) NW 1132.70 1358.76I currently have the necessary knowledge % 86.61 68.23and skills to teach effectively (SE) (3.15) (4.73)(Chi-Square: 10.33, P-value: 0.006) NU 415 248
NW 961.31 924.97Response options were “strongly disagree,” “disagree,” “agree,” and “strongly agree.” NU/W =Unweighted/Weighted Number.
Exhibit 12. Percent of Participants Agreeing with Various Statements about Self-Efficacy in the Spring, bySchool Context
ChallengingGood School Context School Context
I feel confident in my ability to address % 74.05 33.22the needs of special education students (SE) (4.71) (6.42)(Chi-Square: 24.14, P-value: <0.001) NU 313 109
NW 701.68 701.40I feel confident in my ability to address % 69.63 29.95the needs of English-language learners (SE) (3.86) (5.78)(Chi-Square: 28.90, P-value: <0.001) NU 311 108
NW 697.57 698.29I feel confident in my ability to handle a % 93.36 57.42range of classroom management and (SE) (3.37) (7.11)discipline situations (Chi-Square: 18.36, NU 313 108P-value: <0.001) NW 713.93 700.40I currently have the necessary knowledge % 83.55 47.05and skills to teach effectively (SE) (4.83) (6.88)(Chi-Square: 17.43, P-value: <0.001) NU 313 108
NW 713.93 694.59Response options were “strongly disagree,” “disagree,” “agree,” and “strongly agree.” NU/W =Unweighted/Weighted Number.
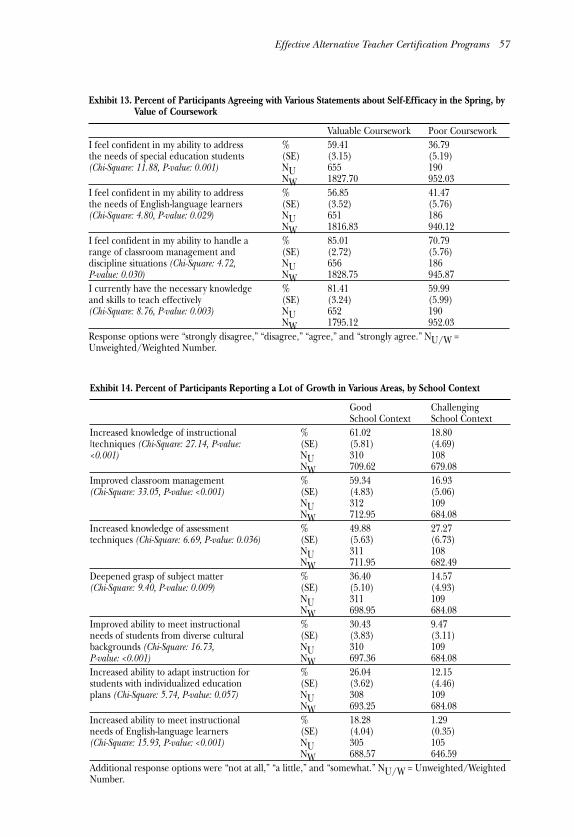
Effective Alternative Teacher Certification Programs 57
Exhibit 13. Percent of Participants Agreeing with Various Statements about Self-Efficacy in the Spring, byValue of Coursework
Valuable Coursework Poor CourseworkI feel confident in my ability to address % 59.41 36.79the needs of special education students (SE) (3.15) (5.19)(Chi-Square: 11.88, P-value: 0.001) NU 655 190
NW 1827.70 952.03I feel confident in my ability to address % 56.85 41.47the needs of English-language learners (SE) (3.52) (5.76)(Chi-Square: 4.80, P-value: 0.029) NU 651 186
NW 1816.83 940.12I feel confident in my ability to handle a % 85.01 70.79range of classroom management and (SE) (2.72) (5.76)discipline situations (Chi-Square: 4.72, NU 656 186P-value: 0.030) NW 1828.75 945.87I currently have the necessary knowledge % 81.41 59.99and skills to teach effectively (SE) (3.24) (5.99)(Chi-Square: 8.76, P-value: 0.003) NU 652 190
NW 1795.12 952.03Response options were “strongly disagree,” “disagree,” “agree,” and “strongly agree.” NU/W =Unweighted/Weighted Number.
Exhibit 14. Percent of Participants Reporting a Lot of Growth in Various Areas, by School Context
Good ChallengingSchool Context School Context
Increased knowledge of instructional % 61.02 18.80|techniques (Chi-Square: 27.14, P-value: (SE) (5.81) (4.69)<0.001) NU 310 108
NW 709.62 679.08Improved classroom management % 59.34 16.93(Chi-Square: 33.05, P-value: <0.001) (SE) (4.83) (5.06)
NU 312 109NW 712.95 684.08
Increased knowledge of assessment % 49.88 27.27techniques (Chi-Square: 6.69, P-value: 0.036) (SE) (5.63) (6.73)
NU 311 108NW 711.95 682.49
Deepened grasp of subject matter % 36.40 14.57(Chi-Square: 9.40, P-value: 0.009) (SE) (5.10) (4.93)
NU 311 109NW 698.95 684.08
Improved ability to meet instructional % 30.43 9.47needs of students from diverse cultural (SE) (3.83) (3.11)backgrounds (Chi-Square: 16.73, NU 310 109P-value: <0.001) NW 697.36 684.08Increased ability to adapt instruction for % 26.04 12.15students with individualized education (SE) (3.62) (4.46)plans (Chi-Square: 5.74, P-value: 0.057) NU 308 109
NW 693.25 684.08Increased ability to meet instructional % 18.28 1.29needs of English-language learners (SE) (4.04) (0.35)(Chi-Square: 15.93, P-value: <0.001) NU 305 105
NW 688.57 646.59Additional response options were “not at all,” “a little,” and “somewhat.” NU/W = Unweighted/WeightedNumber.
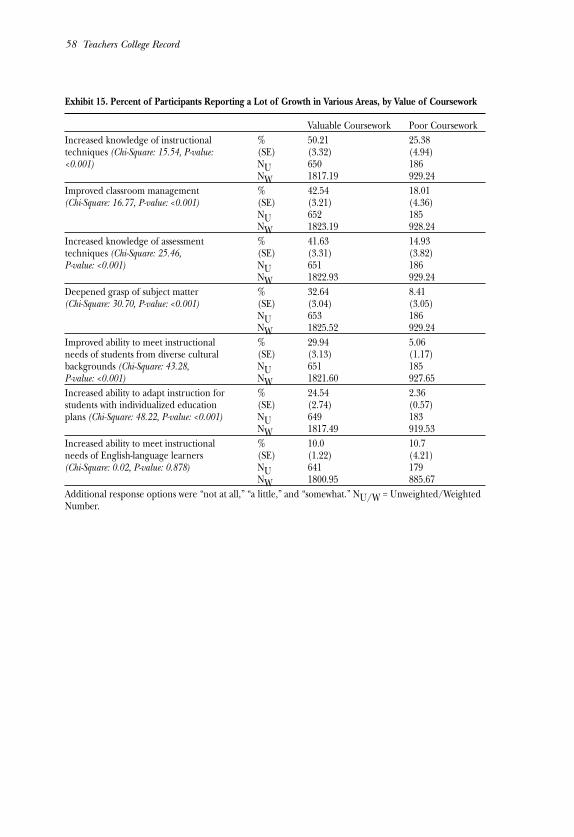
58 Teachers College Record
Exhibit 15. Percent of Participants Reporting a Lot of Growth in Various Areas, by Value of Coursework
Valuable Coursework Poor CourseworkIncreased knowledge of instructional % 50.21 25.38techniques (Chi-Square: 15.54, P-value: (SE) (3.32) (4.94)<0.001) NU 650 186
NW 1817.19 929.24Improved classroom management % 42.54 18.01(Chi-Square: 16.77, P-value: <0.001) (SE) (3.21) (4.36)
NU 652 185NW 1823.19 928.24
Increased knowledge of assessment % 41.63 14.93techniques (Chi-Square: 25.46, (SE) (3.31) (3.82)P-value: <0.001) NU 651 186
NW 1822.93 929.24Deepened grasp of subject matter % 32.64 8.41(Chi-Square: 30.70, P-value: <0.001) (SE) (3.04) (3.05)
NU 653 186NW 1825.52 929.24
Improved ability to meet instructional % 29.94 5.06needs of students from diverse cultural (SE) (3.13) (1.17)backgrounds (Chi-Square: 43.28, NU 651 185P-value: <0.001) NW 1821.60 927.65Increased ability to adapt instruction for % 24.54 2.36students with individualized education (SE) (2.74) (0.57)plans (Chi-Square: 48.22, P-value: <0.001) NU 649 183
NW 1817.49 919.53Increased ability to meet instructional % 10.0 10.7needs of English-language learners (SE) (1.22) (4.21)(Chi-Square: 0.02, P-value: 0.878) NU 641 179
NW 1800.95 885.67Additional response options were “not at all,” “a little,” and “somewhat.” NU/W = Unweighted/WeightedNumber.

Effective Alternative Teacher Certification Programs 59
Exhibit 16. Percent of Participants Reporting a Lot of Growth in Various Areas, by Frequency ofMentoring
Frequent Mentoring Infrequent MentoringIncreased knowledge of instructional % 46.58 40.83techniques (Chi-Square: 0.55, P-value: 0.760) (SE) (5.68) (5.51)
NU 263 181NW 651.25 637.09
Improved classroom management % 38.27 22.91(Chi-Square: 6.04, P-value: 0.049) (SE) (4.73) (3.96)
NU 265 181NW 654.58 639.76
Increased knowledge of assessment % 35.79 22.42techniques (Chi-Square: 4.50, P-value: 0.106) (SE) (4.88) (4.09)
NU 264 181NW 653.58 640.50
Deepened grasp of subject matter % 35.13 18.46(Chi-Square: 6.97, P-value: 0.031) (SE) (4.83) (4.72)
NU 265 182NW 654.58 642.09
Improved ability to meet instructional % 32.24 16.07needs of students from diverse cultural (SE) (5.40) (3.95)backgrounds (Chi-Square: 6.07, P-value: 0.049) NU 264 181
NW 652.99 639.76Increased ability to adapt instruction for % 23.38 16.52students with individualized education (SE) (3.80) (3.80)plans (Chi-Square: 1.68, P-value: 0.433) NU 264 180
NW 652.99 632.95Increased ability to meet instructional % 13.23 4.86needs of English-language learners (SE) (1.69) (0.95)(Chi-Square: 18.22, P-value: <0.001) NU 259 179
NW 622.91 631.36Additional response options were “not at all,” “a little,” and “somewhat.” NU/W = Unweighted/WeightedNumber.

60 Teachers College Record
Acknowledgements
This report was made possible by a grant from Carnegie Corporation of New York.The statements made and views expressed are solely the responsibility of theauthors.
For their many contributions to this paper, the authors would like to acknowledgethe entire research team: Nancy Adelman, Katherine Baisden, Barnett Berry,Kristin Bosetti, Christopher Chang-Ross, H. Alix Gallagher, Paul Hu, HaroldJavitz, Dylan Johnson, Andrea Lash, John Luczak, Diana Montgomery, TiffanyPrice, and Andrew Wayne. We would also like to thank Dan Fallon, Ken Zeichner,Heather Hill, Jeffrey Phelps, Deborah Ball, and Julie Gainsburg for their helpfulfeedback. Finally, this research would not have been possible without the coopera-tion of the program staff, principals, and teachers in each of the seven programsstudied. We are grateful for the time they contributed for interviews, and for allow-ing us to observe their work.
Notes
1. Insights Into Alternative Certification: Initial Findings from a National Study (Humphrey& Wechsler, 2005), was published by Teachers College Record and is available online athttp://www.sri.com/policy/cep/pubs/teachers/AltCert_TCR_article.pdf
2 This article is the culmination of a three-year study sponsored by the CarnegieCorporation of New York, and is the third of three reports on the subject. The first report(Humphrey, Wechsler, Bosetti, Wayne, & Adelman, 2002) reviewed the existing research onalternative certification, posited a theoretical framework for the overall study, and pre-sented the study design. The second report (Humphrey & Wechsler, 2005) examined themyths surrounding alternative certification’s participants and programs.
3 Our survey methodology is elaborated in Appendix B. 4 Note that university selectivity is defined differently in this paper than in the previ-
ous report (Humphrey & Wechsler, 2005). The categories were altered for the analyses fea-tured in this paper to create more distinct groups than the previous variable allowed.
5 Some of the teaching experience reported by New Jersey teachers may have beencaused by delays in their paperwork. The Newark Star-Ledger (Teachers held up by state log-jam, October 5, 2004) reported more than 1,000 new teachers had experienced delays inreceiving their teaching certificates. Presumably, some of these new teachers were in thealternative certification programs.
6 For further information on the analysis, including factor loadings, fit statistics, andfactor score calculations, see Appendix B.
7 Note that the factors we identified differ somewhat from the factors identified bythe item developers at the University of Michigan.
8 In order to observe growth between fall and spring, the average scores on the springsurvey were compared to the percentile rankings for the fall survey.
9 The National Commission on Teaching and America’s Future (2001) criticized thestudy on a number of factors including the “extraordinarily unqualified group of new hires”(p. 2) against which the TFA candidates were compared. All of the TFA teachers were col-
Effective Alternative Teacher Certification Programs 61
lege graduates while in only one of the five years of the study did all of the other new teach-ers possess college degrees (they ranged from 65% to 94%). Additionally, all of the TFAteachers were enrolled in the alternative certification program but it is unknown how manyof the non-TFA teachers participated in an alternative certification program. Furthermore,it is unknown how many non-TFA teachers had received certification prior to starting in thedistrict. Laczko-Kerr (2002) recommends dismissing this TFA study due to lack of scientificrigor as the data are not available for independent verification.
References
Ball, D. L., & Bass, H. (2003). Toward a practice-based theory of mathematical knowledgefor teaching. In B. Davis & E. Simmt (Eds.), Proceedings of the 2002 Annual Meeting of theCanadian Mathematics Education Study Group, (pp. 3–14). Canada: CMESG/GCEDM.
Ball, D. L., Hill, H. C, & Bass, H. (2005). Who knows mathematics well enough to teachthird grade, and how can we decide? American Educator, Fall 2005, 14–46.
Ballou, D., & Podgursky, M. (1997). Teacher pay and teacher quality. Kalamazoo, MI: W. E.Upjohn Institute for Employment Research.
Barron’s Educational Services, Inc. Profiles of American colleges, 25th Edition. (2002).Hauppauge, NY:Author.
Darling-Hammond, L. (1994). Who will speak for the children? How Teach For Americahurts urban schools and students. Phi Delta Kappan, 76(1), 21–34.
Darling-Hammond, L., Chung, R., & Frelow, F. with the assistance of Fischer, H. (2002).Variation in teacher preparation: How well do different pathways prepare teachers toteach? Journal of Teacher Education, 53(4), 286–302.
Darling-Hammond, L., Holtzman, D. J., Gatlin, S. J., & Heilig, J. V. (2005). Does teacher prepa-ration matter? Evidence about teacher certification, Teach For America, and teacher effectiveness.Stanford, CA: Stanford University.
Decker, P. T., Mayer, D. P., & Glazerman, S. (2004). The effects of Teach For America on students:Findings from a national evaluation. Princeton, NJ: Mathematica Policy Research, Inc.
Dial, M., & Stevens, C. J. (1993). Introduction: The context of alternative teacher certifica-tion. Education and Urban Society, 26(1), 4–17.
Feistritzer, E. (2005). Alternative teacher certification: A state-by-state analysis 2005. Washington,DC: National Center for Education Information.
Goldhaber, D. D., & Brewer, D. J. (2000). Does teacher certification matter?: High schoolcertification status and student achievement. Educational Evaluation and Policy Analysis,22(2), 129–146.
Haberman, M. (1999). Increasing the number of high-quality African American teachers inurban schools. Journal of Instructional Psychology, 26(4), 208–212.
Hill, H., Rowan, B., & Ball, D. L. (2005). Effects of teachers’ mathematical knowledge forteaching on student achievement. American Educational Research Journal, 42, 371–406.
Hill, H., Schilling, S., & Ball, D. L. (2004). Developing measures of teachers’ mathematicsknowledge for teaching. Elementary School Journal, 105, 11–30.
Hu, L., & Bentler, P. M. (1999). Cutoff criteria in fix indexes in covariance structure analy-sis: Conventional criteria versus new alternatives. Structural Equation Modeling, 6(1),1–55. Also cited in Mplus for Windows: An Introduction. Retrieved November10, 2004,from http://www.utexas.edu/its/rc/tutorials/stat/mplus/
Humphrey, D. C. & Wechsler, M. E. (2005). Insights into alternative certification: Initialfindings from a national study. Teachers College Record, 9/2/05. Available athttp://www.tcrecord.org (ID Number 12145).
62 Teachers College Record
Humphrey, D. C., Wechsler, M., Bosetti, K., Wayne, A., & Adelman, N. (2002). Alternative cer-tification: Design for a national study. Menlo Park, CA: SRI International.
Hutton, J. B., Lutz, F. W., & Williamson, J. L. (1990). Characteristics, attitudes, and perfor-mances of alternative certification interns. Education Research Quarterly, 14(1), 38–48.
Laczko-Kerr, I. (2002, April). The effects of teacher certification on student achievement: An analy-sis of Stanford Nine achievement for students with emergency and standard certified teachers.Paper presented at the meeting of the American Education Research Association, NewOrleans, LA.
Lopez, A., Lash, A., Schaffner, M., Shields, P., & Wagner, M. (2004). Review of research on theimpact of beginning teacher induction on teacher quality and retention. Menlo Park, CA: SRIInternational.
Miller, J. W., McKenna, M. C., & McKenna, B. A. (1998). A comparison of alternatively andtraditionally prepared teachers. Journal of Teacher Education, 49, 165–176.
National Commission on Teaching and America’s Future (2001). Facts to consider aboutTeach For America: An evaluation of teacher differences and student outcomes inHouston, Texas. A bulletin from Focus on Teaching Quality (The electronic newsletter ofNCTAF) August, 2001. Retrieved on (insert date) at http://www.nctaf.org/publica-tions/FocusBulletin_Aug2001.htm
Teachers held up by state’s logjam. (2004, October 5). Newark Star-Ledger.Paccione, A. V., McWhorter, B. A., & Richburg, R. W., (2000). Effective teacher preparation
for nontraditional candidates. In D. J. McIntyre & S. M. Byrd (Eds.), Research on effectivemodels for teacher education: Teacher education yearbook VIII (pp. 111–126). Thousand Oaks,CA: Corwin Press.
Phelps, G. (2005). Just knowing how to read isn’t enough! What teachers need to know about the con-tent of reading. Manuscript submitted for publication.
Phelps, G., & Schilling, S. (2004). Developing measures of content knowledge for teachingreading. Elementary School Journal, 105, 31–48.
Raymond, M., Fletcher, S. H., & Luque, J. (2001). Teach For America: An evaluation of teacherdifferences and student outcomes in Houston, Texas. Stanford, CA: CREDO, HooverInstitution. Retrieved on May 10, 2002, from http://credo.stanford.edu/html/publica-tions.html.
Stafford, D., & Barrow, G. (1994). Houston’s alternative certification program. EducationalForum, 58(2), 193–200.
Stoddart, T. (1990). Los Angeles Unified School District Intern Program: Recruiting andpreparing teachers for an urban context. Peabody Journal of Education, 67(3), 84–122.
Tschannen-Moran, M., Hoy, A. W., & Hoy, W. K. (1998). Teacher efficacy: Its meaning andmeasure. Review of Educational Research, 68(2), 202–248.
U.S. Department of Education, Office of Postsecondary Education. (2004). Meeting thehighly qualified teachers challenge: The Secretary’s third annual report on teacher quality.Washington, DC: Author.
Viadero, D. (2004). Study finds benefits in Teach For America. Education Week, 23(40), 1,26.
Wayne, A. J., & Youngs, P. (2003). Teacher characteristics and student achievement gains: Areview. Review of Educational Research, 73(1), 89–122.
Wilson, S. M., Floden, R. E., & Ferrini-Mundy, J. (February, 2001). Teacher preparationresearch: Current knowledge, gaps, and recommendations. Seattle, WA: Center for the Study ofTeaching and Policy.
Wise, A. (1994). Choosing between professionalism and amateurism. The Educational Forum,58(2), 139–146.

Effective Alternative Teacher Certification Programs 63
DANIEL C. HUMPHREY is the Associate Director for SRI International’sCenter for Education Policy. His research is focused on teacher policyand urban school reform. He currently leads studies of TeacherInduction in the Midwest, Teachers for a New Era at California StateUniversity at Northridge, National Board Certified Teachers and Low-performing Schools, and Trends in Teacher Content Knowledge. Recentpublications include “Sharing the Wealth: National Board CertifiedTeachers and the Students that Need Them Most” (Humphrey, Koppich,& Hough, 2005, Education Policy Analysis Archives) and “Insights intoAlternative Certification: Initial Findings from a National Study”(Humphrey & Wechsler, 2005, Teachers College Record).
MARJORIE E. WECHSLER is a senior policy analyst for SRIInternational’s Center for Education Policy. Much of her recent work hasconcentrated on teacher development throughout the teaching careerincluding preparation, induction, and continuing professional develop-ment. She also specializes in school- and district-level reform, and under-standing how districts can be supportive of the work of schools and pro-mote strong instructional practices. Recent publications include“Insights into Alternative Certification: Initial Findings from a NationalStudy” (Humphrey & Wechsler, 2005, Teachers College Record).
HEATHER J. HOUGH is a doctoral candidate in Administration andPolicy Analysis at Stanford University and was a research analyst for SRIInternational’s Center for Education Policy. Much of her recent researchhas focused on teacher training and professional development and teach-ers’ roles in school improvement. Recent publications include “Sharingthe Wealth: National Board Certified Teachers and the Students thatNeed Them Most” (Humphrey, Koppich, & Hough, 2005, Education PolicyAnalysis Archives).