3. student, teacher, and school characteristics
TRANSCRIPT

11
This chapter presents demographic and socioeco-nomic characteristics of students, teachers, and schools. These are considered as fixed characteristics of individuals and of the system and are thus treated in our models as antecedent conditions to teaching and learning. To facilitate comparisons, descriptive results are reported by jurisdiction and language. Analytical results are presented in two forms. First, comparisons are made of reading proficiency levels and mean scores between various groups, based on the characteristics of interest. Second, these char-acteristics were entered into a regression equation as predictors of achievement in reading. Regression analysis allows the effect of each variable to be examined while controlling for other variables in the model.
In subsequent parts of this report, these background variables are treated as covariates,5 as they are gener-ally not within the control of the school system, and their influence on achievement is considered to be largely independent of educational policy or practice.
That is not to say that the system should not take these variables into account. In particular, since an important goal of schooling is to promote equity, it is appropriate to develop policies that can help overcome any disadvantage created by socioeconomic or other background characteristics.
Student characteristics
Student gender
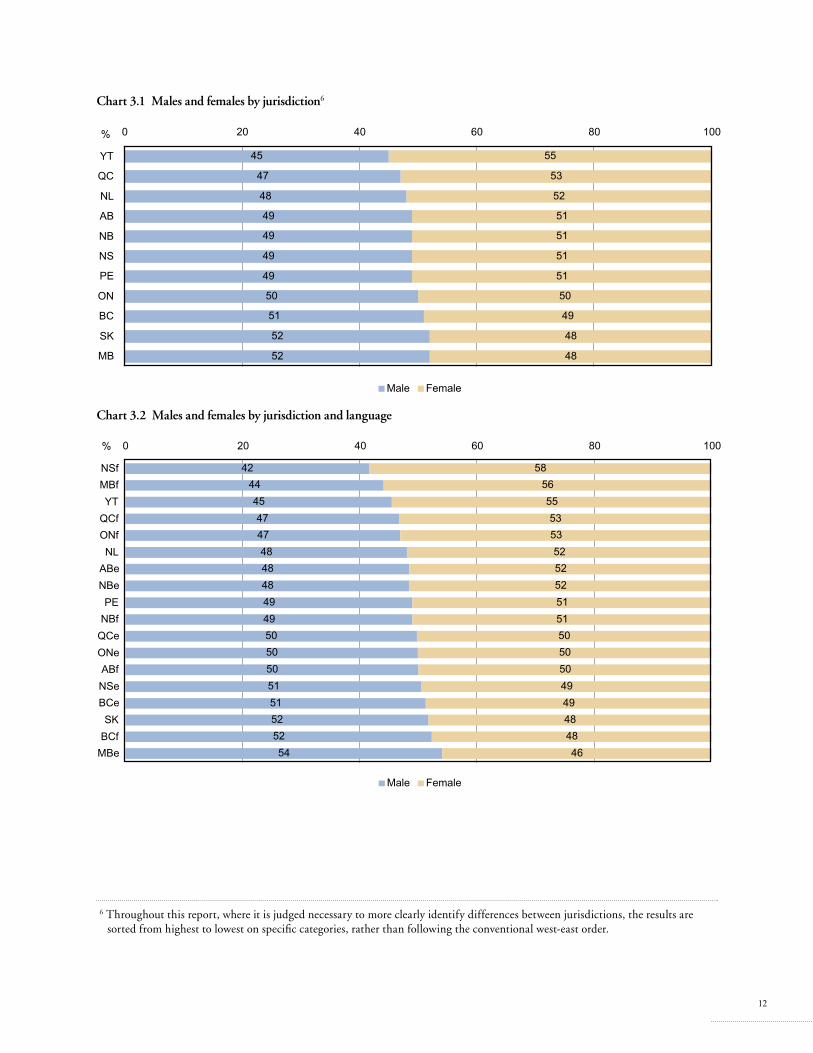
Charts 3.1 and 3.2 give the gender distribution of students by jurisdiction and language. Generally, the proportions of males and females would be expected to depart from the expected 50% each only by random amounts, based on sampling error. However, statistically significant differences were found in several jurisdictions in particular, the overall proportions of males in francophone populations (specifically, in Manitoba and Nova Scotia) and in the Yukon were less than expected.
3. sTudenT, TeaCher, and sChool CharaCTerIsTICs
5 A covariate is a variable that is entered into a regression equation to act as a control against other variables of more direct interest. The effects for the variables of interest are computed after controlling for the covariates.
12
Chart 3.1 males and females by jurisdiction6
Male Female
45
47
48
49
49
49
49
50
51
52
52
55
53
52
51
51
51
51
50
49
48
48
0 20 40 60 80 100
YT
QC
NL
AB
NB
NS
PE
ON
BC
SK
MB
%
Chart 3.2 males and females by jurisdiction and language
424445474748484849495050505151525254
585655535352525251515050504949484846
0 20 40 60 80 100
NSfMBfYT
QCfONfNL
ABeNBePE
NBfQCeONeABfNSeBCeSK
BCfMBe
%
Male Female
6 Throughout this report, where it is judged necessary to more clearly identify differences between jurisdictions, the results are sorted from highest to lowest on specific categories, rather than following the conventional west-east order.

13
Gender differences in reading proficiency levels are shown in Chart 3.3, and differences in mean read-ing scores by gender are shown in Chart 3.4.7 The comparison of means shows that females outperform males by a statistically significant margin. This is consistent with the results of many other studies. There appears to be no diminishment in the gender
differences that have been known for some time and that have been the subject of considerable policy debate. It is interesting to note, as well, that the differences in male and female participation rates in the test may have had a small impact on the reported performance levels for jurisdictions in which these differences are found.
Chart 3.3 reading proficiency levels by gender
Level 1 Level 2 Level 3
13
9
68
65
19
26
0 20 40 60 80 100
Male
Female
%
Chart 3.4 mean reading scores by gender
490
513
400 420 440 460 480 500 520 540 560 580 600
Male
Female
7 For simplicity, throughout this report, differences between means of groups (rather than percentages at each level for groups) will be used to determine the statistical significance of the effects on reading scores of individual variables.

14
Because PCAP is an age-based, rather than a grade-based, assessment, students writing the assessment were found at more than one grade level. As Charts 3.5 and 3.6 show, most students were in grade 8 (secondary 2) at the time the test was written. The percentages at lower grade levels were generally
low, though they were slightly higher in Quebec than in other jurisdictions.8 The percentages at higher grade levels were more variable, ranging from 8% in Nova Scotia (French) to 38% in Prince Edward Island.
Grade level
Chart 3.5 grade levels of PCaP students by jurisdiction
5
6
4
3
3
4
5
6
7
7
11
38
28
27
25
25
25
25
21
20
12
10 1
56
65
69
72
72
71
69
73
73
82
78
0 20 40 60 80 100
PE
NB
MB
BC
YT
ON
AB
NL
SK
NS
QC
%
Grade 6 Grade 7 (secondary 1) Grade 8 (secondary 2) Grade 9 (secondary 3) Grade 10 (secondary 4)
8 Fewer than 1% of students were found in grades 6 and 10 (secondary 4), so these percentages are not visible on the chart.

15
Chart 3.6 grade levels of PCaP students by jurisdiction and language
566
35
73445
26
2787
124
3828282828
262525252524
2120 2
2017
139
8
566565
6967
6772717170
7573
7673
7580
7988
0 20 40 60 80 100
PENBfNBeONfMBeABfYT
BCeONeABeMBfNL
BCfSK
QCeNSeQCfNSf
%
Grade 6 Grade 7 (secondary 1) Grade 8 (secondary 2) Grade 9 (secondary 3) Grade 10 (secondary 4)
1
Performance is associated with grade level, as revealed in Charts 3.7 and 3.8.9 In particular, students in grade 7 (secondary 1) have significantly lower mean scores than those in the two higher
grades. The difference between grade 8 (secondary 2) and grade 9 (secondary 3) students is also statisti-cally significant, though not as large as that for grade 7 (secondary 1).
Chart 3.7 reading proficiency levels by grade
Level 1 Level 2 Level 3
27
10
8
63
67
67
10
23
25
0 20 40 60 80 100
Grade 7(secondary 1)
Grade 8(secondary 2)
Grade 9(secondary 3)
%
9 Grades 6 and 10 (secondary 4) were dropped from these comparisons because of small numbers.

16
Chart 3.8 mean reading scores by grade
444
503
515
400 420 440 460 480 500 520 540 560 580 600
Grade 7(secondary 1)
Grade 8(secondary 2)
Grade 9(secondary 3)
Language
The PCAP populations were defined by the language of the school and the tests were written in that language. However, the language of the school may not be the same as that used outside the school. Students were therefore asked to identify the language they used most often at home. Responses to this question by population are given in Chart 3.9. For most anglophone populations, English is spoken by a large majority of respondents and almost no one speaks French. However, the percentage speaking a language at home other than English or French
is close to 17% in Ontario (English) and British Columbia (English). The pattern for francophone populations is quite different, with majorities of these populations speaking French only in Quebec and New Brunswick. In most other jurisdictions, the francophone population is much smaller and is functioning mainly in an English-speaking environ-ment outside the school. Aboriginal languages were reported as spoken at home by 1% of students or fewer in most jurisdictions.

17
The relationship of language to achievement is reported only briefly here, as a separate report is being prepared on this issue. For purposes of this analysis, the overall English and French populations were further divided into whether they represent the majority or the minority official language. Majority French and Minority English, of course, are unique to Quebec, while Majority English and Minority French are found across the other jurisdictions.
Chart 3.10 shows the proportions of each of these groups who speak each of the official languages at
home. The patterns for the two majority groups and for Minority English are similar, with most students speaking the same language at home as the language of the test. However, the result for the Minority French population is quite different, with only 40% of this group speaking English at home. This clearly illustrates the point that many Minority French students are functioning in a language environment different from the language of the school. The impli-cations of this for achievement will be investigated in detail in the language report.
Chart 3.9 language most often spoken at home by jurisdiction and language
8383
8889
5979
491
4355
949696
9386
9664
12
1132
1388
5039
312
3687
161610987777643332
2
11
2
1
1
1
11
1
11111
1
11
0 20 40 60 80 100
BCeONeABeMBeBCf
QCeQCfPE
ABfONfSK
NSeYT
NBeMBfNL
NSfNBf
%
English French Aboriginal Other

18
Chart 3.10 language spoken at home by majority and minority language groups
English French Other
88
4
82
40
1
84
9
53
10
11
9
7
0 20 40 60 80 100
Majority English
Majority French
Minority English
Minority French
%
Chart 3.11 shows reading proficiency levels and Chart 3.12 shows mean reading scores for four population groupings defined by language and by majority and minority status within the jurisdiction. The largest difference evident from Chart 3.11 is the difference between the Majority French population and all others. More members of this population perform at level 3 than do members of any other population, regardless of the language spoken at
home. However, Chart 3.12 shows that the mean dif-ference between the two Majority French subgroups is not statistically significant because the small number of English speakers in this population results in a large error. Chart 3.12 also shows a statistically significant difference within the Majority English population between those who speak English and those who speak French at home. None of the other within-population differences are significant.
Chart 3.11 reading proficiency levels by majority and minority language and language spoken at home
10
24
16
7
15
21
21
19
71
65
47
53
70
68
63
62
19
12
37
39
15
11
15
20
0 20 40 60 80 100
English
French
English
French
English
French
English
French
Maj
ority
E
nglis
h M
ajor
ity
Fren
ch
Min
ority
E
nglis
h M
inor
ity
Fren
ch
%
Level 1 Level 2 Level 3

19
Chart 3.13 mother’s education by jurisdiction
7
7
10
8
9
9
8
8
10
11
14
18
16
14
19
19
19
19
21
19
23
22
18
22
23
16
15
19
20
16
19
18
18
4
4
4
5
6
6
5
5
5
5
4
41
40
39
37
36
36
36
34
34
31
28
13
11
11
15
16
10
11
17
13
14
14
0 20 40 60 80 100
AB
ON
YT
BC
MB
QC
PE
SK
NS
NB
NL
%
< high school Completed high school Some education after high school Completed college or cégep Some university education University degree
Chart 3.12 mean reading scores by majority and minority language and language spoken at home
497
446
515
540
486
452
465
481
400 420 440 460 480 500 520 540 560 580 600
English
French
English
French
English
French
English
French
Maj
ority
E
nglis
h M
ajor
ity
Fren
ch
Min
ority
E
nglis
h M
inor
ity
Fren
ch
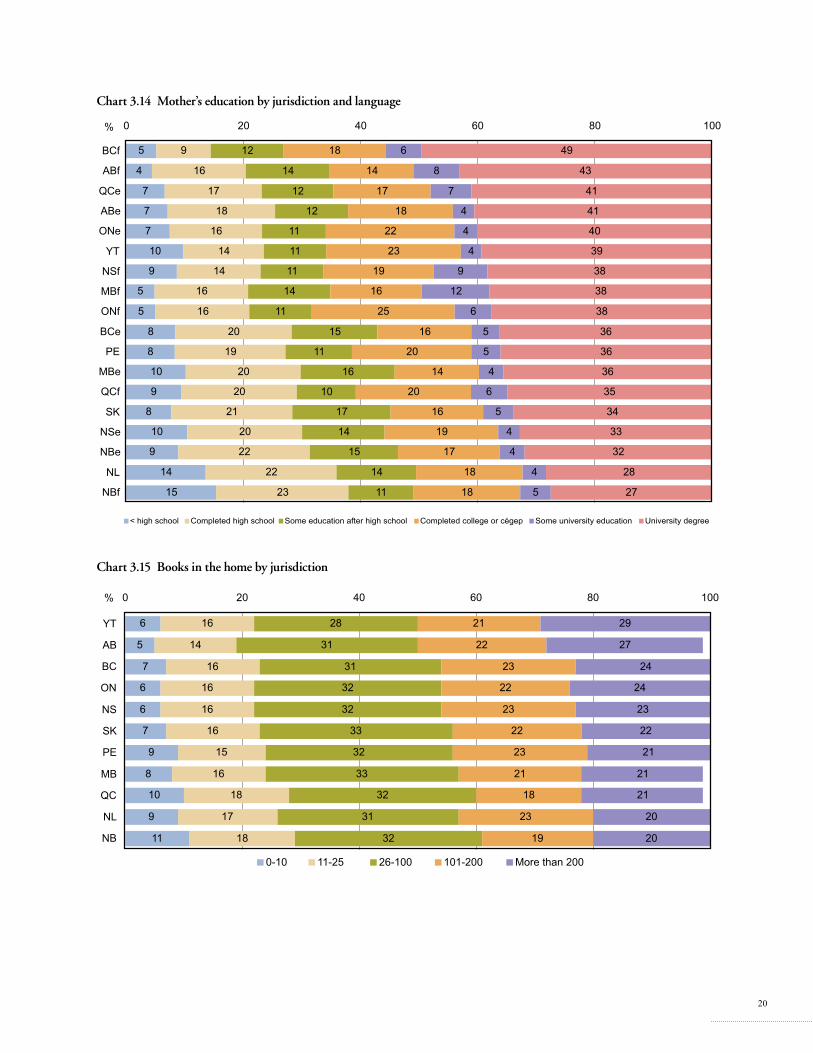
Two indicators of student socioeconomic status — mother’s education and the number of books in the home — were included on the questionnaire. Charts 3.13 to 3.16 give results on these two indicators by jurisdiction and language. Differences between jurisdictions are not large. Interestingly, Minority French populations in the western provinces and in
Nova Scotia show slightly higher levels of mother’s education than the Majority English populations in the same jurisdictions, while francophone populations in Quebec and New Brunswick show slightly lower levels of mother’s education than their anglophone counterparts.
Student socioeconomic status
20
Chart 3.14 mother’s education by jurisdiction and language
5
4
7
7
7
10
9
5
5
8
8
10
9
8
10
9
14
15
9
16
17
18
16
14
14
16
16
20
19
20
20
21
20
22
22
23
18
14
17
18
22
23
19
16
25
16
20
14
20
16
19
17
18
18
6
8
7
4
4
4
9
12
6
5
5
4
6
5
4
4
4
5
49
43
41
41
40
39
38
38
38
36
36
36
35
34
33
32
28
27
12
14
12
12
11
11
11
14
11
15
11
16
10
17
14
15
14
11
0 20 40 60 80 100
BCf
ABf
QCe
ABe
ONe
YT
NSf
MBf
ONf
BCe
PE
MBe
QCf
SK
NSe
NBe
NL
NBf
%
< high school Completed high school Some education after high school Completed college or cégep Some university education University degree
Chart 3.15 books in the home by jurisdiction
6
5
7
6
6
7
9
8
10
9
11
16
14
16
16
16
16
15
16
18
17
18
21
22
23
22
23
22
23
21
18
23
19
29
27
24
24
23
22
21
21
21
20
20
28
31
31
32
32
33
32
33
32
31
32
0 20 40 60 80 100
YT
AB
BC
ON
NS
SK
PE
MB
QC
NL
NB
%
0-10 11-25 26-100 101-200 More than 200

21
The relationships between these two variables and reading proficiency levels are given in Charts 3.17 and 3.18. Mean score comparisons by these variables appear in Charts 3.19 and 3.20. The pattern is quite
clear here. Having a mother with a higher level of education and having more books at home are both associated with higher performance.
Chart 3.17 reading proficiency levels by mother’s education
16
13
8
8
11
7
71
70
72
68
57
60
13
17
20
24
31
33
0 20 40 60 80 100
< high school
Completed high school
Some education after high school
Completed college or cégep
Some university education
University degree
%
Level 1 Level 2 Level 3
Chart 3.16 books in the home by jurisdiction and language
567
566768789811
911
719
1616
1914
141615
151516
161516
1917
1917
26
2021
1923
24222323
2122222321
1723
1721
13
34292827
25242424232221212120202019
12
2528
2731
31323132
3333333234
3331
3235
31
0 20 40 60 80 100
BCfYT
ABfABeQCeONeBCeNSeNBeSK
MBfPE
MBeQCfNL
ONfNSfNBf
%
0-10 11-25 26-100 101-200 More than 200

22
Chart 3.18 reading proficiency levels by books in the home
25
16
11
7
6
67
70
70
66
59
8
14
19
27
35
0 20 40 60 80 100%
Level 1 Level 2 Level 3
0-10
11-25
26-100
101-200
More than 200
Chart 3.19 mean reading scores by mother’s education
472
489
500
510
519
531
400 420 440 460 480 500 520 540 560 580 600
< high school
Completed high school
Some education after high school
Completed college or cégep
Some university education
University degree
Chart 3.20 mean reading scores by number of books in the home
442
473
495
518
536
400 420 440 460 480 500 520 540 560 580 600
0-10
11-25
26-100
101-200
More than 200

23
Charts 3.21 and 3.22 show that most students in all jurisdictions were born in Canada. The percentage of students born outside of Canada are quite variable across jurisdictions, ranging from 14% to 16% in
British Columbia (both languages) and Ontario (English) down to 2% or less in Manitoba (French), New Brunswick (French), Nova Scotia (French), and Newfoundland and Labrador.
Immigration status
Chart 3.21 Percentage of students born in Canada, and not born in Canada, by jurisdiction
86
87
91
92
93
93
96
96
97
97
98
14
13
9
8
7
7
4
4
3
3
2
0 20 40 60 80 100
BC
ON
AB
QC
MB
PE
SK
YT
NB
NS
NL
%
Born in Canada Not born in Canada
Chart 3.22 Percentage of students born in Canada, and not born in Canada, by jurisdiction and language
84
86
86
88
91
92
92
93
93
94
96
96
96
97
98
98
99
99
16
14
14
12
9
8
8
7
7
6
4
4
4
3
2
2
1
1
0 20 40 60 80 100
BCf
BCe
ONe
ABf
ABe
MBe
QCe
QCf
PE
ONf
SK
NBe
YT
NSe
MBf
NL
NBf
NSf
%
Born in Canada Not born in Canada

24
The impact of immigration status on reading profi-ciency levels is given in Chart 3.23 and the effect on mean reading scores is given in Chart 3.24.
These differences are small but statistically sig-nificant, with those born in Canada performing at higher levels.
Chart 3.23 reading proficiency levels by place of birth (born in Canada, not born in Canada)
11
16
67
65
23
19
0 20 40 60 80 100
Born in Canada
Not born in Canada
%
Level 1 Level 2 Level 3
Chart 3.24 mean reading scores by place of birth (born in Canada, not born in Canada)
503
490
400 420 440 460 480 500 520 540 560 580 600
Born in Canada
Not born in Canada
25
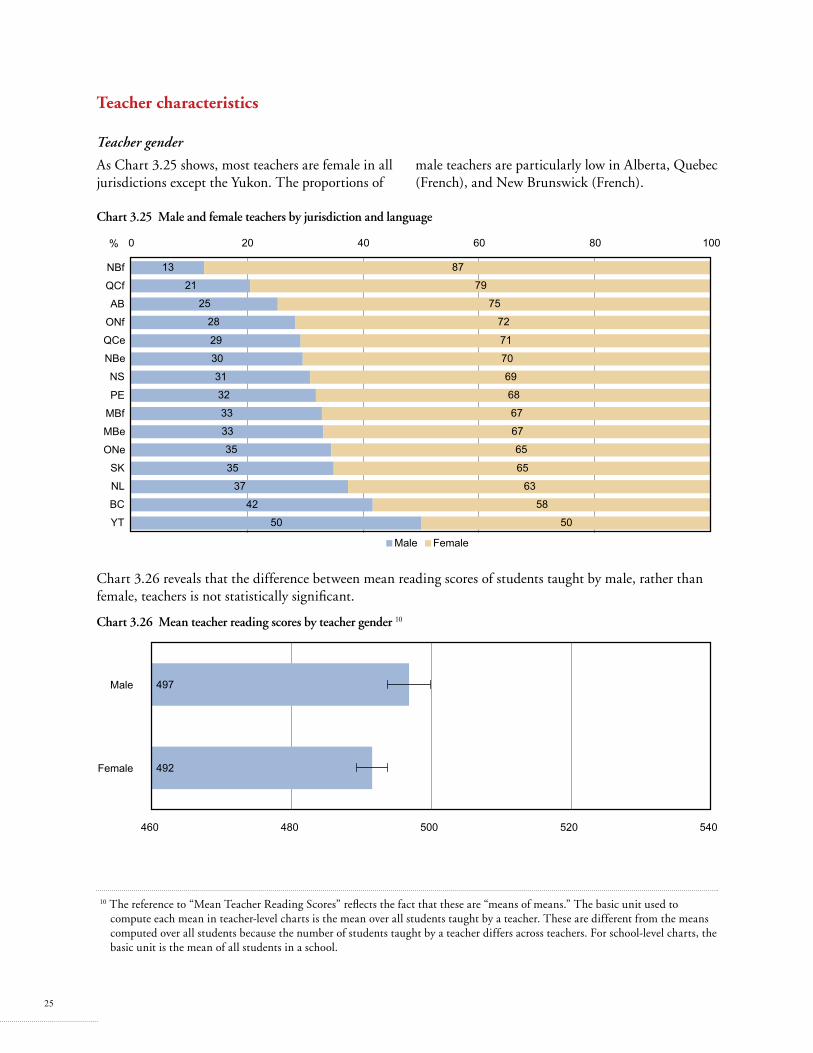
As Chart 3.25 shows, most teachers are female in all jurisdictions except the Yukon. The proportions of
male teachers are particularly low in Alberta, Quebec (French), and New Brunswick (French).
Teacher characteristics
Teacher gender
Chart 3.25 male and female teachers by jurisdiction and language
13
21
25
28
29
30
31
32
33
33
35
35
37
42
50
87
79
75
72
71
70
69
68
67
67
65
65
63
58
50
0 20 40 60 80 100
NBf
QCf
AB
ONf
QCe
NBe
NS
PE
MBf
MBe
ONe
SK
NL
BC
YT
%
Male Female
Chart 3.26 reveals that the difference between mean reading scores of students taught by male, rather than female, teachers is not statistically significant.
Chart 3.26 mean teacher reading scores by teacher gender 10
497
492
460 480 500 520 540
Male
Female
10 The reference to “Mean Teacher Reading Scores” reflects the fact that these are “means of means.” The basic unit used to compute each mean in teacher-level charts is the mean over all students taught by a teacher. These are different from the means computed over all students because the number of students taught by a teacher differs across teachers. For school-level charts, the basic unit is the mean of all students in a school.

26
Chart 3.27 shows a wide range of teacher experience in all jurisdictions. The charts for most jurisdictions suggest that a trend toward an aging teaching force experienced over the past decade may be reversing itself, with the proportion of teachers with less than
five years’ and five to ten years’ experience now being generally higher than the proportions of teachers in older age groups, particularly those with more than 20 years’ experience — even though this last group represents a wider range of years.
Teaching experience
Chart 3.27 range of teaching experience by jurisdiction and language
1831
2320
27
3034
2631
2427
3134
29
31
1826
1625
26
2428
2824
3136
2426
29
25
187
2014
10
97
1014
141010
94
14
2926
242322
2019
1919
1715141313
11
1710
1717
14
1711
1612
1413
2118
25
19
0 20 40 60 80 100
NLQCeMBfSKAB
MBeNBeBCNSPE
ONeQCfONfYT
NBf
%
Less than 5 years 5 to 10 years 11 to 15 years 16 to 20 years More than 20 years
Chart 3.28 indicates that higher reading scores are attained by students taught by the most highly experienced teachers (those with more than 20 years’
experience). The mean reading scores of students of teachers in the other experience ranges are not significantly different from each other.
Chart 3.28 mean teacher reading scores by teacher experience
487
493
493
492
506
460 480 500 520 540
Less than 5 years
5 to 10 years
11 to 15 years
16 to 20 years
More than 20 years

27
In most jurisdictions, there are strong incentives for teachers to improve their qualifications, particularly through acquiring additional university degree credentials. Chart 3.29 shows a wide variation in the degree combinations held. While most teachers hold the B.Ed. degree, the proportion holding the B.Ed. as the only degree varies widely across jurisdictions.
In three jurisdictions — Saskatchewan, Quebec (French), and New Brunswick (French) — more than half of all teachers hold the B.Ed. only. In other jurisdictions, a majority of teachers holds two degrees. The most common combination is the B.Ed. and B.A. However, this is also widely variable.
Teacher qualifications and specialization in language arts
Chart 3.29 Teacher undergraduate university degrees by jurisdiction and language
2
2
1
2
3
1
3
1
1
4
1
1
2
68
60
60
45
37
35
31
22
21
17
15
12
9
6
3
9
20
26
35
40
41
40
49
43
61
59
54
52
67
67
6
3
8
4
3
5
4
6
6
12
9
3
9
5
4
6
12
12
3
12
6
10
5
4
11
11
9
1
3
0 20 40 60 80 100
QCf
SK
NBf
AB
YT
MBe
QCe
MBf
BC
NBe
NS
PE
ONf
NL
ONe
%
None B.Ed. Only B.Ed - B.A B.Ed.- B.Sc B.Ed.- Other
Note: Because of missing data, numbers do not sum to 100%.

28
Chart 3.30 gives the percentages of teachers holding advanced degrees (master’s or higher). In most jurisdictions, the percentage is 20 or less. The largest
percentages are found in Newfoundland and Labrador, Nova Scotia, Prince Edward Island, and Quebec (English).
Chart 3.30 Percentage of teachers holding graduate degrees by jurisdiction and language
38
29
27
26
22
22
20
18
18
15
12
12
10
9
9
0 20 40 60 80 100
NL
NS
PE
QCe
BC
ONe
QCf
MBf
ONf
NBe
AB
YT
SK
MBe
NBf
%
Chart 3.31 shows that there are only small differ-ences in mean reading scores achievement across various teacher degree combinations. The exception
is the “B.Ed. – Other undergrad.” combination, for which achievement is significantly higher than for any of the other combinations.
Chart 3.31 mean teacher reading scores by teacher university degrees
490
485
484
504
491
460 480 500 520 540
B.Ed. Only
B.Ed - B.A
B.Ed.- B.Sc
B.Ed.- Other
Graduate

29
Chart 3.32 gives the percentages of teachers who indicated that they had focused on a subject related to the teaching of language arts as part of their teacher education. Similar proportions identified
themselves as language arts specialists in their teach-ing assignment. These results clearly indicate that most teachers involved in language arts at this level may be considered specialists in this area.
Chart 3.32 Percentage of teachers specializing in language arts by jurisdiction and language
707374757778
80808181828383
8687
302726252322
20201919181717
1413
0 20 40 60 80 100
ONfNBfSKPEAB
MBfQCeONe
BCMBeNBeNSYTNL
QCf
%
Language arts specialists Non-Language arts specialists
A third question in this sequence asked teachers to report the number of days of professional develop-ment in language arts they had participated in over the previous five years. These results are shown in
Chart 3.33, with the pattern indicating wide variation in participation both within and across jurisdictions.
Chart 3.33 days of language arts professional development in the past five years by jurisdiction and language
36777
1214
818
112628
2630
17
112118
2223
2223
2724
2831
2726
2717
2320
2323
2021
1423
1723
9131413
17
4733
2928
262525
2216
1413131312
8
162122
2023
1925
2124
2420
1921
1842
0 20 40 60 80 100
NSONe
BCNBeMBfAB
ONfMBeQCe
SKNBfNL
QCfPEYT
%
None 1 to 2 days 3 to 4 days 5 to 8 days 9 or more days

30
Chart 3.34 indicates that both actual and perceived specialization in language arts is significantly associated with achievement but that the number of
days of professional development in language arts has no effect.
Chart 3.34 mean teacher reading scores by teacher language arts specialization and professional development
495
485
499
485
494
490
493
492
496
493
460 480 500 520 540
Yes
No
Yes
No
None
1 to 2 days
3 to 4 days
5 to 8 days
9 or more days
Total
Teac
her
educ
atio
n LA
sp
ecia
lizat
ion
Sel
f rep
orte
d LA
sp
ecia
lizat
ion
Day
s LA
pro
fess
iona
l de
velo
pmen
t
School characteristicsSchool size
Two measures of school size were used in PCAP: total enrolment and enrolment in grade 8 (secondary 2), the most common grade level for 13-year-olds. Charts 3.35 and 3.36 show the distri-butions of these two measures. It is clear from these charts that school size varies widely both within and
across jurisdictions. Quebec (French) has the largest proportion of schools with total enrolment greater than 1,000. British Columbia and Quebec (French) have the most schools with grade 8 (secondary 2)enrolments greater than 100. These differences likely reflect differences in the way in which grades are configured in the schools.

31
Chart 3.35 Total school enrolment by jurisdiction and language
5
5
1
12
3
5
7
4
8
2
9
31
22
21
10
17
27
54
44
64
66
71
79
54
76
80
58
64
65
79
25
37
28
30
25
23
18
14
37
21
11
10
14
14
11
52
30
17
14
8
6
4
3 1
1
0 20 40 60 80 100
QCf
BC
ONe
QCe
NBe
MBe
NBf
ONf
AB
NS
SK
YT
MBf
PE
NL
%
Less than 100 101 to 500 501 to 1,000 More than 1,000
Chart 3.36 grade 8 (secondary 2) enrolment by jurisdiction and language
8 17
21 29
14 31
29 29
42 47
40 69
48 47
39
4 3
13 17
16 16
22 24
32 19
31 10
23 33
40
5 2
10 10
24 15
13 11
4 17
9
9 9 12
8 7
9 4
18 10
9 11
4
5 10
9 6
4
76 71
48 40
28 28 28 26
18 17 15
10 10
6 4
0 20 40 60 80 100
QCfBCAB
QCeNS
MBeONeNBe
PEMBf
NLYT
ONfSK
NBf
%
Less than 25 26 to 50 51 to 75 76 to 100 More than 100

32
Chart 3.37 shows the effect of enrolment on mean reading scores. The general trend for overall enrol-ment is in the direction of higher achievement in larger schools. The pattern for grade 8 (secondary 2)
enrolment is more mixed, with the two categories with more than 75 grade 8s outperforming those with enrolment in the 26-50 range.
Chart 3.37 mean school reading scores by school enrolment
486
485
500
510
493
481
490
502
498
460 480 500 520 540
Less than 100
101 to 500
501 to 1,000
More than 1,000
Less than 25
26 to 50
51 to 75
76 to 100
More than 100
Tota
l enr
olm
ent
Gra
de 8
(sec
onda
ry 2
) en
rolm
ent
Chart 3.38 shows the percentages of schools identified by their principals as public or private. It is evident that the number of private schools is very small in most jurisdictions, with the notable
exceptions of Quebec, where both language groups show close to one-third private schools, and British Columbia, where the proportion exceeds 20%.
School governance
Chart 3.38 school governance by jurisdiction and language
67 70
77 88
92 96 97 98 98 99 100 100 100 100 100
33 30
23 12
8 4 3 2 2 1
0 20 40 60 80 100
QCfQCe
BCMBe
ABNLPESK
ONfONeMBfNBeNBfNSYT
%
Public Private
33
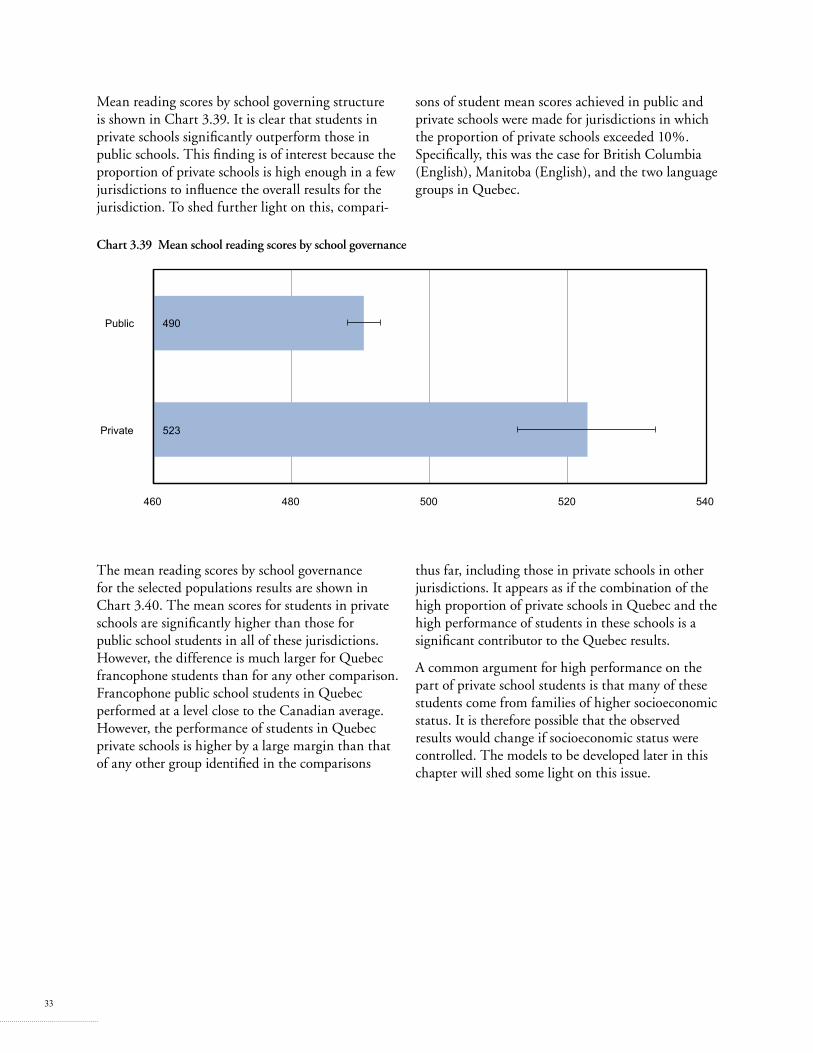
Mean reading scores by school governing structure is shown in Chart 3.39. It is clear that students in private schools significantly outperform those in public schools. This finding is of interest because the proportion of private schools is high enough in a few jurisdictions to influence the overall results for the jurisdiction. To shed further light on this, compari-
sons of student mean scores achieved in public and private schools were made for jurisdictions in which the proportion of private schools exceeded 10%. Specifically, this was the case for British Columbia (English), Manitoba (English), and the two language groups in Quebec.
Chart 3.39 mean school reading scores by school governance
490
523
460 480 500 520 540
Public
Private
The mean reading scores by school governance for the selected populations results are shown in Chart 3.40. The mean scores for students in private schools are significantly higher than those for public school students in all of these jurisdictions. However, the difference is much larger for Quebec francophone students than for any other comparison. Francophone public school students in Quebec performed at a level close to the Canadian average. However, the performance of students in Quebec private schools is higher by a large margin than that of any other group identified in the comparisons
thus far, including those in private schools in other jurisdictions. It appears as if the combination of the high proportion of private schools in Quebec and the high performance of students in these schools is a significant contributor to the Quebec results.
A common argument for high performance on the part of private school students is that many of these students come from families of higher socioeconomic status. It is therefore possible that the observed results would change if socioeconomic status were controlled. The models to be developed later in this chapter will shed some light on this issue.

34
Chart 3.40 mean student reading scores by school governance, selected populations
400 420 440 460 480 500 520 540 560 580 600
Public
Private
Public
Private
Public
Private
Public
Private
BC
e M
Be
QC
e Q
Cf
482
510
472
514
465
506
506
578
Two indicators of the diversity of school populations, the proportion of students in English or French as a second language (ESL/FSL)11 programs and the proportion of students of Aboriginal ancestry in the school were included in the school questionnaire. The percentage of schools for these two variables are given in Charts 3.41 and 3.42. Manitoba (French)
stands out as having by far the most schools with high proportions of ESL/FSL students. This is likely a function of the inclusion of French immersion students in the French population for that province. Again, note that Manitoba is the only jurisdiction where French immersion students are reported with the French population.
Diversity of student populations
Chart 3.41 Percentages of schools with esl/fsl students by jurisdiction and language
21 74
62 87
95 94
86 89
100 100 99
98 97
94 92
18 12
21 5
5 10
8
2 1
1
7
16 4
8 4
2 1
3 3
2
4 1
45 10 10
4 3
1
1 1
1
0 20 40 60 80 100
MBfQCeONfQCfNSABBC
ONePEYTSKNL
NBeNBf
MBe
%
0% to 25% of students 26% to 50% of students 51% to 75% of students 76% to 100% of students
11 The terms ESL and FSL refer to students whose first language is different from the language of the school. Many ESL/FSL students are from immigrant families, but some are from Canadian families who send their children to schools that function in the official language other than their home language.
35
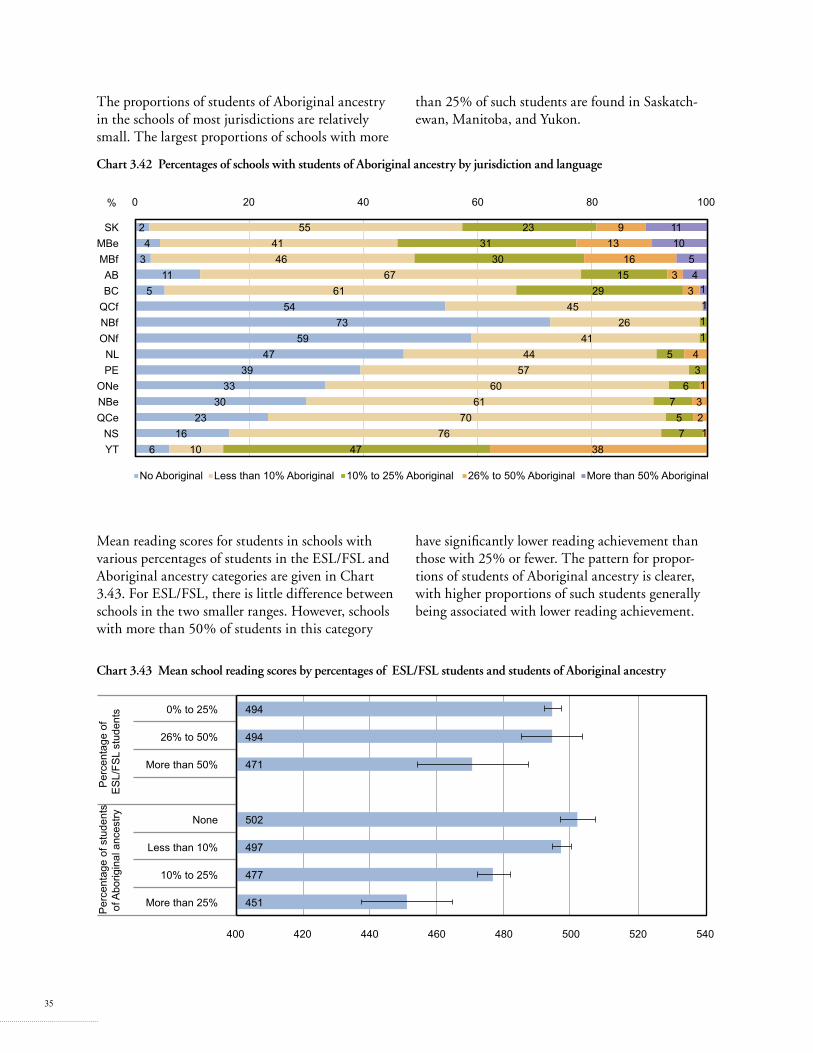
Mean reading scores for students in schools with various percentages of students in the ESL/FSL and Aboriginal ancestry categories are given in Chart 3.43. For ESL/FSL, there is little difference between schools in the two smaller ranges. However, schools with more than 50% of students in this category
have significantly lower reading achievement than those with 25% or fewer. The pattern for propor-tions of students of Aboriginal ancestry is clearer, with higher proportions of such students generally being associated with lower reading achievement.
Chart 3.43 mean school reading scores by percentages of esl/fsl students and students of aboriginal ancestry
494
494
471
502
497
477
451
400 420 440 460 480 500 520 540
0% to 25%
26% to 50%
More than 50%
None
Less than 10%
10% to 25%
More than 25%
Per
cent
age
of
ES
L/FS
L st
uden
tsP
erce
ntag
e of
stu
dent
s o
f Abo
rigin
al a
nces
tryThe proportions of students of Aboriginal ancestry in the schools of most jurisdictions are relatively small. The largest proportions of schools with more
than 25% of such students are found in Saskatch-ewan, Manitoba, and Yukon.
Chart 3.42 Percentages of schools with students of aboriginal ancestry by jurisdiction and language
2 4
3 11
5 54
73 59
47 39
33 30
23 16
6
55 41 46
67 61
45 26
41 44
57 60
61 70
76 10
23 31
30 15
29
1 1
5 3
6 7
5 7
47
9 13
16 3
3
4
1 3 2 1
38
11 10
5 4
1 1
0 20 40 60 80 100
SKMBeMBfABBC
QCfNBfONf
NLPE
ONeNBeQCe
NSYT
%
No Aboriginal Less than 10% Aboriginal 10% to 25% Aboriginal 26% to 50% Aboriginal More than 50% Aboriginal

36
Chart 3.44 shows the percentages of schools in communities of various sizes by jurisdiction and language. This distribution reflects the overall proportion of the populations in various jurisdic-tions that are located in large urban versus small rural locations and is not directly linked to overall population size for the jurisdiction. The position of Manitoba (both language groups) best illustrates
this, as the distribution is clearly related to the high proportion of the Manitoba population located in the city of Winnipeg. The same comment is true for Quebec (English), which relates to the relatively large percentage of the Quebec anglophone popula-tion located in Montreal. By contrast, the Ontario francophone population is much more widely dispersed across various community sizes.
School locations by community size
Chart 3.44 Percentage of schools by community size by jurisdiction and language
19 45
25 35
18 14
10 23
59 44
80 78
67 66
45
19 3
18 12
7 14
13 28
17 11
7 11
19 24
24
12 3 13
6 13
31 30
13 7
7 10 3
14 7
20
5 5
1 4
26 17
29 23
14 37
3 8
3 10
46 45 43 42
35 23
18 14
3
0 20 40 60 80 100
QCeMBfAB
MBeONeQCfBC
ONfNSSKPENL YT
NBfNBe
%
Fewer than 5,000 5,000 to 25,000 25,000 to 100,000 100,000 to 500,000 More than 500,000

37
Mean school reading scores by community size are given in Chart 3.45. This shows that schools located in communities with populations greater than 25,000 perform better than those in the two
smaller community-size categories but that there are no significant differences among the “larger than 25,000” categories.
Chart 3.45 mean school reading scores by community size
485
482
501
497
496
460 480 500 520 540
Fewer than 5,000
5,000 to 25,000
25,000 to 100,000
100,000 to 500,000
More than 500,000

38
Multivariate effects
Statistical note
Multiple regression analysis. Achievement is influenced by a large number of factors, which may act independently or in combination to affect the outcome. For example, results already presented indicate that both mother’s education and the number of books in the home influence reading achievement. However, these two factors themselves are correlated. If taken together, one may be more prominent than the other or one may have no effect once the other is accounted for. In survey research, the standard statistical technique for isolating effects is known as multiple regression analysis or regression modelling. This technique is based on an equation in which the outcome (or dependent variable) is seen as a linear combination of a series of factors (predictors or independent variables). The contribution of any one predictor to the outcome is represented by a regression coefficient, the value of which depends on the effect of the predictor itself and of the other variables in the model. The relative sizes of the regression coefficients in a particular model may be used to indicate the relative contributions of the factors of interest. Models that include or exclude a particular variable may also be used to identify the unique contribution of that variable while controlling for others.
Multilevel modelling. The PCAP sampling model is a two-stage one, with schools sampled at a first stage and students within schools at a second. Students are thus said to be “nested” within schools. This is multilevel modelling, which is a variation on the regression analysis used in situ-ations where the samples exhibit such a hierarchical structure. Models are developed at each level (i.e., the school level and the students-within-school level) and the models are then combined to yield regression coefficients that represent effects at both the student level and the school level. Both student- and school-level variables can be included as predictors in the model, and the relative amount of variation in student achievement contributed by differences between students and differ-ences between schools can be computed. Most of the regression models used in this report are of this nature. For the most part, the results may be interpreted in the same way as for single-level models. However, the confidence intervals are different in the two cases because of the way the errors are computed.
Interpreting regression coefficients. Many of the results in this report are presented in the form of regression coefficients. In general, a regression coefficient may be interpreted as representing the change in the outcome (in this case, reading achievement) that would be expected from one unit change in the predictor (contextual factor of interest). Bivariate coefficients (sometimes called “absolute effects”) are those for the relationship between a single predictor and the outcome, without controlling for other variables. Multivariate coefficients (sometimes called “relative effects” or “unique effects”) refer to the effects of a particular predictor while controlling for all other predictors in the equation.
The statistical significance of regression coefficients is determined from the confidence interval in the same way as described earlier. The specific reference point is a coefficient of zero, which would indicate that the factor has no correlation with the outcome variable (reading achievement in this case). A coefficient may thus be said to be statistically greater than (or less than) zero if the error bar does not overlap the zero point. The absolute values of the coefficients for different variables cannot be compared directly in all cases because these depend on the scales used. We can say that one variable has a larger or smaller effect than another only if the two scales are the same.
39
The models used are two-level models (student and school), as described in the statistical note.
12 Teacher variables are not included in the models because the average number of students taught by a teacher was not sufficient to meet the requirements for multilevel modelling. In a few cases throughout the report, teacher variables have been aggregated to the school and examined as school-level variables.
13 This lack of comparability is sometimes adjusted by reporting all coefficients in standard score terms. This allows the coefficient to be interpreted as corresponding to the change in the outcome variable for one standard deviation change in the predictor. However, the concept of standard deviation is, itself, difficult to interpret for categorical variables. It was therefore considered simpler to use the original scales instead of converting to standard scores.
Chart 3.46 shows the bivariate and multivariate effects of student-level and school-level demographic variables.12 The models used are two-level models (student and school), as described in the statistical note.
It is important to note that the coefficients reported in Chart 3.44 are not directly comparable across variables because the variables are on different scales.13 Effects for dichotomous variables (gender, language spoken at home, born in Canada, public school/private school) are comparable because each simply represents values of zero or one. In other cases, the size of the effect depends on the number of categories on the scale. For example, mother’s education and books in the home consist of several categories, as shown in Charts 3.13 and 3.15.
For any one variable, effects are comparable across the bivariate and multivariate models. It is also appropriate to interpret the confidence intervals in terms of whether they are significantly different from zero and to compare confidence intervals for the bivariate and multivariate models for a single variable.
For dichotomous variables, the regression coefficient may be interpreted as the average difference in read-ing score between those possessing the characteristic and those not possessing it. For example, in reading, being female conveys a 21-point advantage over being male when the gender variable is taken alone. This
advantage changes slightly (but not in a statistically significant way) to 19 points, when all other variables in the model are controlled.
For variables with more than two values, the coef-ficient represents the effect of a change of one point on the scale used. For example, an increase of one unit on the “books in the home” scale conveys an advantage of 11 points in reading when “books in the home” is taken alone. This advantage increases to 18 points (a statistically significant difference) after controlling for other variables in the model. In this case, we can say that the effect of books in the home is masked by other variables in the bivariate case, so that the full effect is not clear until the other variables are controlled.
At the student level, being female, being in a higher grade, speaking English or French at home, having been born in Canada, having more books in the home, and having a mother with a higher level of education all have positive bivariate effects on achievement. The effect of speaking any other language at home is not statistically significant.
At the school level, larger school size, private schools, and larger community size have positive bivariate effects on reading achievement. The effect of grade 8 (secondary 2) enrolment is not statistically significant.
For most variables at both levels, the multivariate effects are not significantly different from the bivariate ones, indicating that the effect of each demographic variable is largely independent of any of the other variables in the model. The effect of grade level is suppressed slightly in the presence of other student-level variables. The effect of books in the home increases, while that for mother’s education diminishes slightly in the full model compared to the bivariate models. This suggests that books in the home may be a more useful indicator of socioeconomic status (SES) than mother’s education,

40
especially since many students were unable to answer the latter question. The effects of speaking English in the home shifts from positive to nonsignificant once other variables are accounted for.
The effect of private schools deserves further attention because of the large effects for Quebec francophone students reported above. There is a general perception that private schools are attended mainly by students from relatively affluent families. While there was no direct measure of “affluence” in PCAP, two measures of socioeconomic status — mother’s education and books in the home — were available. Cross-tabulating these with public school/private school attendance revealed that more private
than public school students had mothers who had completed a university degree (54% compared to 35%). In addition, more private school than public school students (32% compared to 22%) reported having more than 200 books in the home. However, the model used here shows approximately the same effect (close to 40 points at the canadian level) in both the bivariate and multivariate models. Hence, controlling for the two available SES vari-ables, along with other demographic characteristics, makes little difference to the size of the public school/private school difference. Nevertheless, it is possible that introducing other variables into the model, as will be done in subsequent chapters, may change this interpretation.
Chart 3.46 regression coefficients for student and school demographic variables14
20.51
29.81
9.31
11.26
9.05
16.31
20.92
-6.43
11.84
1.98
36.76
-6.97
3.59
19.13
21.01
10.57
17.76
5.97
-4.10
28.75
0.36
11.42
1.21
42.37 -6.59
3.27
-60 -40 -20 0 20 40 60
Gender (female)
Grade
Born in Canada
Books in home
Mother's Education
English spoken at home
French spoken at home
Other language spoken at home
Total school enrolment
Grade 8 (secondary 2) enrolment
Private school
Percentage of ESL/FSL students
Community size
Stu
dent
S
choo
l
Bivariate Multivariate
14 It is important to note that the coefficients reported in the chart are not directly comparable across variables because the variables are on different scales. Effects for dichotomous variables (gender, language spoken at home, born in Canada, public school/pri vate school) are comparable because each simply represents values of zero or one. In other cases, the size of the effect depends on the number of categories on the scale. For any one variable, effects are comparable across the bivariate and multivariate models.