chapter three plant selection, collection, extraction and
TRANSCRIPT

CHAPTER THREE
Plant selection, collection, extraction and analysis of selected species
3.1. Introduction
Renewed interest in the therapeutic potential of medicinal plants means that researchers are concerned not only
with validating ethnopharmacological usage of plant, but also with identifying, isolating and characterizing the
active components (Fennell eta/. , 2004). However, the presence of numerous inactive components makes the
screening and isolation of the target component(s) extremely cumbersome (Sticher, 2008). In choosing medicinal
plants for scientific evaluation of their biological activities and validation of ethnopharmacological usage, some
criteria such as
• Evidence of ethnopharmacological usage by the native population.
• The ailment(s) which the plant(s) is used to cure.
• The availability of the plant in its natural habitat.
• The sustainable use of the part(s) of the plant (root, leaves, stem, bark or whole plant) (Baker et a/.,
1995; Vander Watt and Pretorious, 2001 ).
• Mode of preparation and administration by traditional healers must also be considered.
Plant quality and pre-treatment are also important determinant of the phytochemical constituents and invariably
the biological activities of an extract. These factors depend on plant parts used, genetic variation, geographical
location, climatic conditions, collection period, drying methods, and storage conditions. Due to these possible
variations, plant material from recognized botanical gardens or herbaria is usually recommended because they
are protected, correctly identified and serve as reliable sources for subsequent collections. Preparation of
voucher specimens is also an important aspect of medicinal plant research. Standard procedures for pre
treatment of plant materials have been developed (Eioff et a/. , 2008). The basic steps include pre-washing if
necessary, air drying under shade at room temperature, grinding into powder and storage in an air tight container
at appropriate temperature (room or refrigerated).
In view of limited resources and the large number of potential medicinal plants to be studied, efficient systems of
evaluation need to be developed for rapid phytochemical and biological screening. The first step is the use of
appropriate extraction process to remove the phytochemical from the plant cellular matrix (Sticher, 2008).
Extraction processes need to be exhaustive, efficient, simple, rapid and inexpensive in extracting targeted
compound(s). A number of extraction methods such as soxhlet, percolation, maceration, digestion, reflux, and
steam distillation have been developed over the years (Sticher, 2008). However, solid-liquid extraction with a
suitable range of solvents remains the most viable, convenient and effective procedure widely in use. The plant
39

extracts are usually qualitatively analyzed for chemical composition (phytochemical fingerprint) and biological
activities (for example bioautography for antimicrobial assay, antioxidative profiling with DPPH radical solution,
acetyl cholinesterase inhibition) on thin layer chromatography (TLC). These plant pre-treatment methods,
extraction and analyses were employed in this chapter to determine qualitatively the phytochemical constituents
and biological activities of selected plant extracts. The plants studied were selected based on literature
documentation of their use in South African traditional medicine (SATM) as antidiarrhoeal agents and results
from preliminary antimicrobial studies on some of the species in the phytomedicine tree project.
3.2. Solid-liquid extraction
Extraction is first pre-purification step in the isolation and characterization of active compound(s) of a medicinal
plant (Sticher, 2008). Selective removal of interfering components from solid plant material involves a five-unit
operation:
• Mixing of plant material and extractant.
• Solubilisation of the solute with the aid of a shaker or sonicator.
• Filtration of the mixture to remove solutes and extractant from the plant residue.
• Drying of sample using technique such as freeze drying, evaporation under vacuum (rota-evaporation)
or air drying.
• Recovery of the solute extract.
The type of extractant may range from non-polar to polar solvent depending on the targeted class of bioactive
component(s). Though the method is relatively simple, some of the drawbacks include: long extraction time,
labour intensive, high solvent consumption and inadequate reproducibility. In traditional medicine practice,
ethanol and water are the most widely used extractants. The bioactive components of medicinal plants are
usually unknown, and the nature of the extractant used affects the composition of the crude extract. Therefore,
solvents such as hexane, dichloromethane, ethyl acetate, acetone, methanol, propanol, water or a combination
of solvents are used in laboratory settings. Acetone has been adjudged to be the best extractant of plant extract
for bioassay because it extracts a broad spectrum of components (polar and non-polar), is miscible with all other
solvents, is highly volatile, and exhibit low toxicity to biological organisms in various assays (Eioff, 1998).
Temperature is also an important factor in extraction, drying and storage of plant extracts because of varying
compound stability due to chemical degradation, losses by volatilization and oxidation. Milder extracting and
drying temperatures are required to avoid loss of activity by plant extracts possibly due to thermal decomposition.
Storage of plant extracts, fractions or isolated pure compounds should be done at 4°C in the dark to avoid any
negative influence of temperature and light.
40

3.3. Liquid-liquid fractionation
Solvent partitioning of extracts allows a finer separation of the plant constituents into fractions of different
polarity. Bioactivity-guided fractionation, where the fractions are tested following separation to quickly identify
and isolate the agents responsible for bioactivity is a desirable step in medicinal plant research. The solvent
partition process involves the use of two immiscible solvents of different polarities. Various solvents are used
starting with non-polar (hexane, dichloromethane, diethyl ether) to medium polar (chloroform, ethyl acetate), and
finally more polar solvent (acetone, methanol, butanol and water).
3.4. Thin layer chromatography (TLC)
3.4.1. Phytochemical fingerprints
TLC is widely used in natural product extract analysis, stability tests of extracts and finished products, and in
sample quality control (Cimpoiu, 2006). TLC fingerprints of medicinal plants and extracts can be used for
identification and quality control of medicinal preparations. The identification of separated components can be
achieved on the basis of retention factor (Rf) values and colour spots. In relation to other chromatographic
methods, TLC offers the simplest and cheapest means of detecting natural product constituents, requiring little
sample clean-up and equipment (Nyiredy and Glowniak, 2001 ). Characteristic features of TLC include: analysis
of many samples and comparison of their phytochemical profiles on the same plate; results can be stored and
communicated as images (picture, video or scanned) and flexibility in the choice of mobile and stationary phase
(Cimpoiu, 2006). Identification of compounds can be done using three different mobile phases on the same
stationary phase or three different stationary phases with one mobile phase to develop the fingerprint of the
extracts and standards. If the difference in Rf values is less than 0.03, then the compounds is identified without
further isolation (Nyiredy and Glowniak, 2001 ). However, position isomeric compounds such as ursane and
oleanane derivatives can have superimpose or close Rf values, making them inseparable.
Visualization of separated compounds is achieved by natural colour in daylight or by fluorescent quenching on
254 nm (for conjugated double bonds or extended n electron systems) or 366 nm UV light. Some commercial
plate absorbents contain fluorescent dye that lights when placed under UV light and compounds are indicated
with blue, green, brown, red or purple areas against a fluorescent background. Visualization of chromatogram
under UV light at 366 nm shows orange-yellow bands for flavonoids and blue fluorescent bands for phenolic
acids (Males and Medic-Saric, 2001 ). Many chromogenic spray reagents are also available for specific classes of
compounds or serve as indicators for broad classes of compounds. Examples are vanillin/sulphuric acid solution,
anisaldehyde and ferric chloride-potassium ferricyanide given intense blue bands for phenolic compounds
(Wettasinghe eta/., 2001).
41

3.5. Materials and Methods
3.5.1. Selection of South Africa medicinal plants for antidiarrhoeal screening
For this project, 27 plant species from nine families (Table 3.1) were selected for preliminary screening based on
the following criteria:
1. Ethnopharmacological use of the plant in the management of diarrhoea locally,
2. Phylogenetic relationship to other plants used in treatment diarrhoea due to the possibility of their
producing related chemical compounds (chemotaxonomy),
3. Medicinal plants reportedly used in countries other than South Africa but naturalized or endogenous in
South African flora,
4. Preliminary pharmacological evaluation of the medicinal plant from the phytomedical laboratory of the
Department of Paraclinical Sciences (University of Pretoria),
5. Absence of published literature describing antidiarrhoea and biological studies, and
6. Their availability for evaluation.
A literature review on the selected plants for antidiarrhoea and other biological studies yielded little or no
previous research work.
3.5.2. Collection of plant materials
The leaves of the 27 plants were collected from the Marie van der Schijff Botanical Garden University of Pretoria
Main Campus at Hatfield, Pretoria or from Phytomedicine Programme tree project stored samples. The plants
were identified and authenticated by Ms. Lorraine Middleton and Magda Nel at the University of Pretoria
Botanical Garden. Voucher specimens were maintained at the HGWJ Schweikert Herbarium of the Department
of Plant Science, University of Pretoria, Hatfield Campus, Pretoria, South Africa.
3.5.3. Preparation of plant material and optimization of phenolic-enriched extraction process
Plant leaves collected were pre-treated according to Phytomedicine programme (University of Pretoria) standard
protocol. In brief, the leaves were sorted from the stem, packed in a well perforated bag and air dried under
shade at room temperature for 2 week. The dried leaves were ground, powdered and kept in an air tight
polyethylene bag until needed for the extraction process. Simultaneous extraction and fractionation of the leaves
using a mixture of 70% acetone acidified with 0.1% HCI and hexane. The chlorophyll, fat and wax-enriched
hexane fraction was decanted from the phenolic-enriched 70% acetone fraction.
42
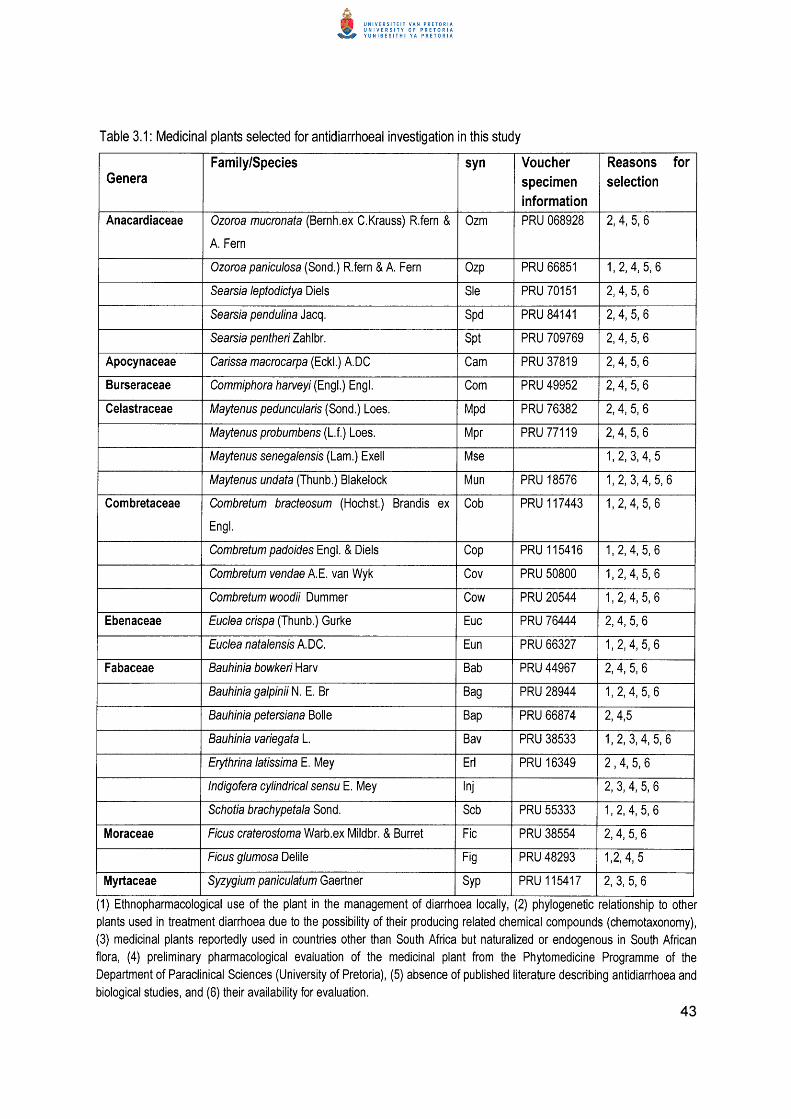
Table 3.1: Medicinal plants selected for antidiarrhoeal investigation in this study
Family/Species syn Voucher Reasons for Genera specimen selection
information Anacardiaceae Ozoroa mucronata (Bernh.ex C.Krauss) R.fern & Ozm PRU 068928 2,4, 5, 6
A. Fern
Ozoroa paniculosa (Sond.) R.fern & A. Fern Ozp PRU 66851 1,2,4,5,6
Searsia leptodictya Diels Sle PRU 70151 2,4, 5, 6
Searsia pendulina Jacq. Spd PRU 84141 2,4, 5,6
Searsia pentheri Zahlbr. Spt PRU 709769 2,4, 5,6
Apocynaceae Carissa macrocarpa (Eckl.) A. DC Cam PRU 37819 2,4, 5, 6
Burseraceae Commiphora harveyi (Engl.) Engl. Com PRU 49952 2,4, 5,6
Celastraceae Maytenus peduncularis (Sond.) Loes. Mpd PRU 76382 2,4,5, 6
Maytenus probumbens (L. f.) Loes. Mpr PRU77119 2,4, 5,6
Maytenus senegalensis (Lam.) Exell Mse 1,2,3,4, 5
Maytenus undata (Thunb.) Blakelock Mun PRU 18576 1, 2, 3,4,5,6
Combretaceae Combretum bracteosum (Hochst.) Brandis ex Cob PRU 117443 1, 2, 4, 5, 6
Engl.
Combretum padoides Engl. & Diels Cop PRU 115416 1, 2,4,5, 6
Combretum vendae A. E. van Wyk Cov PRU 50800 1, 2,4,5, 6
Combretum woodii Dummer Cow PRU 20544 1, 2,4, 5,6
Ebenaceae Euclea crispa (Thunb.) Gurke Euc PRU 76444 2,4, 5,6
Euclea natalensis A. DC. Eun PRU 66327 1,2,4, 5,6
Fabaceae Bauhinia bowkeri Harv Bab PRU 44967 2,4, 5,6
Bauhinia galpinii N. E. Br Bag PRU 28944 1, 2,4, 5,6
Bauhinia petersiana Bolle Bap PRU 66874 2, 4,5
Bauhinia variegata L. Bav PRU 38533 1,2,3,4,5,6
Erythrina latissima E. Mey Erl PRU 16349 2 l 4, 5, 6
lndigofera cylindrical sensu E. Mey lnj 2, 3,4,5, 6
Schotia brachypetala Sond. Scb PRU 55333 1, 2, 4, 5, 6
Moraceae Ficus craterostoma Warb.ex Mildbr. & Burret Fie PRU 38554 2,4,5,6
Ficus glumosa Delile Fig PRU 48293 1,2, 4, 5
Myrtaceae Syzygium paniculatum Gaertner Syp PRU 115417 2, 3, 5,6
( 1) Ethnopharmacological use of the plant 1n the management of diarrhoea locally, (2) phylogenetic relationship to other plants used in treatment diarrhoea due to the possibility of their producing related chemical compounds (chemotaxonomy), (3) medicinal plants reportedly used in countries other than South Africa but naturalized or endogenous in South African flora, (4) preliminary pharmacological evaluation of the medicinal plant from the Phytomedicine Programme of the Department of Paraclinical Sciences (University of Pretoria), (5) absence of published literature describing antidiarrhoea and biological studies, and (6) their availability for evaluation.
43

The acetone residue was removed by evaporation under vacuum using a rotary evaporator at 40°C. The residual
water fractions were divided into two portions (A and B). Portion A was freeze dried and served as the crude
extract while portion B was fractionated using solvents of increasing polarities as presented in Figure 3.1. The
crude extracts and fractions were reconstituted in various suitable solvents for the biological assays.
I Plant material I Simultaneous extraction and fractionation with acidified 70% acetone and n-Hexane ,
+ + I Hexane fraction (HD I Crude extract
+ + +
Portion A (dried as crude Portion B (Liquid-liquid extract) (CRE) partition using solvent of
+ different polarities
+ Phytochemical evaluation of phenolic components (total phenolics, non tannin + + + + phenolics, total tannins, condensed Dich lorometh ane Ethyl acetate n-Butanol Residual water tannin, gallotannin, total flavonoids, fraction (DCMf) fraction (EAf) fraction (Bf) fraction ( RWD flavonol, anthocyanidin)
Fig. 3.1. Flow chart for the extraction, phytochemical analysis and fractionation of plant material
3.5.4. Phytochemical profiling
The phytochemical profiles of the crude extracts and fractions were determined using thin layer chromatography
(TLC) by spotting 10 IJI of solution at a concentration of 10 mg/ml. The plates were developed with various
combinations of hexane (H), ethyl acetate (E), formic acid (F), acetic acid (A), chloroform (C), methanol (M),
water (W), benzene (B) and ammonia (Am) at different ratio to create eluting solvent of varied polarities. The
combination with ratios in parenthesis that were used:
(1) E: F: A: W (70:5:5:10)
(2) E: F: A: W (70:5:15:10)
(3) E: M: Am (90:20:15)
(4) H: E: F (90:1 0:2),
(5) H: E: F (70:30:2)
(6) H: E: F (50:50:2)
(7) (B: E: Am (90:10:1)
(8) C: E: F (50:40:1 0)
44

(9) E: M: W: F (50:6.5:5:2)
(1 0) H: E: F (20:80:2)
The developed TLC plates were sprayed with vanillin/H2S04 solution and heated at 1 00°C to allow colour
development (FAO/IAEA, 2000). Other reagents such as ferric chloride-potassium ferricyanide and p
anisaldehyde/H2S04 (acetic acid, 5 ml; cone. H2S04, 25 ml; ethanol, 425 ml; water, 25 ml) (Kubata eta/., 2005)
were also used.
3.6. Quantification of the phenolic constituents of the extracts
3.6. 1. Determination of total phenolic constituents
The total phenolic composition of the extracts was determined using the Folin-Ciocalteau method as described
by Makkar (2003), with some modifications. Crude extracts (50 l-JI) at a concentration of 1.0 mg/ml were
dispensed into a test tube and made up to 500 l-JI with distilled water. Subsequently, 250 l-JI of commercial Folin
Ciocalteau reagent diluted with distilled water (1 :1) and 1250 l-JI of 20% sodium carbonate solution were added to
the extract. The mixture was vortexed and the absorbance recorded at 725 nm (using a Versamax microplate
reader) after 40 min at room temperature. Total phenolic content (expressed as mg gallic acid/g dry weight) was
calculated from the standard curve (0.0019 - 0.25 mg/ml gallic acid) using the following best fit equation: Ac=
4.9022 x TP (mg GAE), R2=0.98, where Ac is the absorbance of the extracts in presence of an indicator and TP
is the total phenolics.
3.6.2. Determination of total tannin
The total tannin content of the extracts was determined using polyvinylpyrrolidone (PVPP) binding method
(Makkar, 2003). The bound mixtures were prepared by mixing 100 mg of PVPP, 1 .0 ml of distilled water and 1.0
ml of tannin-containing extracts in a centrifuge tube. The mixtures were mixed thoroughly and kept at 4°C for 15
min and then filtered. The filtrate (100 l-JI) was transferred into a test tube and the phenolic content was evaluated
as described in section 3.6.1 above. Non-tannin phenolic constituents were determined from the standard curve
of catechin expressed as catechin equivalent in mg/g dry material. The standard curve equation is y = 4.9022x +
c, where y is absorbance, x is mg Gallic acid, c=O, R2=0.9804). The tannin content was calculated as the
difference between the total phenolic and non-phenolic content of the extracts because the tannin was bound
and precipitated by PVPP.
3.6.3. Determination of proanthocyanidin
The proanthocyanidin content of the extracts was determined using the butanoi-HCI assay as described by
Makkar, 2003. The extract (500 l-JI) was dispensed into a test tube and diluted to 10 ml with 70% acetone. Three
ml of the 95/5 butanoi/HCI reagent and 100 l-JI of 2% ferric ammonium sulphate in 2N HCI were added. The test
45
tubes were loosely covered and heated in a boiling water bath for 50 min. The absorbance was recorded at 550
nm (using a Versamax microplate reader) after the tubes and contents were cooled to room temperature.
Absorbance of the unheated mixture was used as blank.
3.6.4. Determination of condensed tannin
The condensed tannin content of the extracts was determined using the vanillin/HCI assay described by Heimler
et a/., 2006. To 0.5 ml of the extract measured into a test tube, 3 ml of vanillin reagent consisting of 4%
concentrated HCI and 0.5% of vanillin in methanol was added. The mixture was allowed to stand for 15 min. The
absorbance was recorded at 500 nm (using a Versamax microplate reader) against methanol as the blank. The
condensed tannin content of the extracts expressed as mg catechin equivalent per gram (mg CE/g) dry plant
material was calculated from the standard curve ranged from 0.0019 to 0.25 mg/ml using the following equation:
A = 0.1791 x (CT) mg CE + 0.0504, R2=0.94, where A is the absorbance of the extracts in presence of an
indicator and CT is the condensed tannin content.
3.6.5. Determination of hydrolysable tannin (gallotannin)
The gallotannin content of the extracts was determined with the potassium iodate assay (Vermerris and
Nicholson, 2006). To 3 ml of the extract, 1 ml of saturated solution of potassium iodate was added and allowed to
stand at room temperature for 40 min. The absorbance was read at 550 nm (using a Versamax microplate
reader).Triplicate analyses were conducted and the mean values and standard deviations were calculated. A
standard curve was prepared using gallic acid under the same conditions as the extracts and results expressed
as gallic acid equivalent (GAE)/g dry plant material using the following best fit equation: A = 0.8264 x GT (mg
GAE) + 0.0392, R2=0.92, where A is the absorbance of the extracts in presence of an indicator and GT is the
gallotannin content of the extract.
3.6.6. Determination of total flavonoids and flavonol
The total flavonoid content of the extracts was determined by the aluminium chloride method described by Abdei
Hameed et a/ (2009) with some modification. Briefly 100 !JI of the extract was mixed with 100 IJI of 20% AICb
and two drops of glacial acetic acid. The mixture was diluted with methanol to 3000 !JI. Absorbance was read at
415 nm with the Versamax microplate reader after 40 min. Blank samples were prepared with the extract without
AICb. A standard curve was prepared using quercetin (3.9-500 !Jg/ml) in methanol under the same conditions.
The total flavonoid content of the extracts expressed as mg quercetin equivalent/g of dry plant material was
calculated from the best fit curve using the following equation: A= 4.9747 x mg quercetin, R2=0.9846, where A is
the absorbance of the extracts in presence of an indicator and TF is the total flavonoid content.
46

The flavonol content of the extracts was also determined by the aluminium chloride method described by Abdei
Hameed eta/ (2009) with some modification. The extract (1 ml) was mixed with 1 ml of 20 mg/ml AICb and 3 ml
of 50 mg/ml of CH3COONa. A standard curve was prepared using quercetin (0.0019 - 0.0312 mg/ml) in
methanol under the same conditions. Absorbance was read at 440 nm (using a Versamax microplate reader)
after 2.5 h. The flavonol content of the extracts expressed as mg quercetin equivalentlg of dry plant material was
calculated from the best fit curve using the following equation: A= 34.046 x mg quercetin, R2=0.9853, where A is
the absorbance of the extracts in presence of an indicator and FLL is the flavonol content.
3.6.7. Determination of anthocyannin
The total anthocyanin content of the extracts was determined by a pH differential method with 96-well microplate
(Lee eta/, 2008; Lee eta/., 2005) using a microplate reader (Versamax). Absorbance was measured at 520 nm
and 700 nm in buffers at pH 1.0 and 4.5 using a molar coefficient of 29,600. Results were expressed as mg
cyanidin-3-glucoside equivalentlg dry plant material using equations 1 and 2 (Lee eta/., 2005).
A= (As2o-A7oo) pH 1.0 - (As2o-A7oo) pH 4.5
Anthocyanin (cyanidin-3-glucose equivalent mg/L) =Ax MW x DF x 103/ox I 2
Where MW (molecular weight) = 449.2 g/mol for cyanidin-3-glucose (cyn-3-glu); DF = dilution factor; I = path
length in em; D = 26900 molar extinction coefficient in L x mol-1x cm-1 for cyn-3-glu; 103 factor for conversion
from g to mg.
3.7. Results
3.7.1. Yield of extractions and fractionations processes
The yield of the phenolic-enriched crude extracts and the fractions of various polarities using hexane,
dichloromethane, ethyl acetate, butanol and residual water are presented in Table. 3.2. The 70% acetone was an
extremely efficient extractant with an average of 34.61 ±5.84% extracted. The maximum yield was obtained for
the crude extracts of S. leptodicya (48.50±12.47% g/g dried plant material) followed by 0 paniculosa
(43.87±6.60% g/g dried plant material) whileS. pentheri (21.13±2.67 g/g dried plant material) yielded the least.
There was a surprisingly high standard deviation between the three repetitions with a single extraction with new
plant material. This may have been caused by a difference in the particle size of samples. The extraction process
efficiently removed the chlorophyll from the bulk 70% acetone extractant into hexane fraction. In most cases
there was a difference between the percentage extracted and the total percentage of all the fractions. This loss
may be ascribed to solubility difficulties encountered with the dried residual water fraction which could not be
reconstituted due to the formation of insoluble complexes between the polyphenolics and other high molecular
47

weight components such as polysaccharides and possibly alkaloids. Unfortunately at that stage a freeze drying
was not available. This problem may have been partially resolved if the water fraction was freeze dried. To
evaluate the degree to which the different plant species contain compounds of different polarity the percentafe of
quantiy present in the crude extract into the different fractions was calculated (Table 3.2).
Table 3.2. The percentage yield of the crude extracts and various fractions (g/g dried plant material)
Plant spp Crude Hexane DCM ETOAc Butanol Residual Insoluble
Water ppt
Bab 33.25±0.83 3.44±0.15 1.39±0.16 2.45±0.34 9.91±1.09 7.47±0.41 8.27±1.87
Bag 38.83±6.18 2.38±0.35 1.31±0.27 2.70±0.21 15.05±1.16 8.93±0.18 10.90±2.94
Bap 32.23±2.84 1.67±0.17 1.71±0.17 3.30±0.78 11.82±0.48 8.71±1.23 7.69±2.53
Bav 31.62±5.46 1.83±0.07 1.90±0.23 2.98±0.17 10.65±1.68 8.07±0.13
Erl 22.12±0.32 1.35±0.55 0.34±0.05 0.26±0.06 6.63±2.20 10.44±0.96 2.77±1.87
Inc 36.15±1.62 1.58±0.17 0.78±0.08 1.71±0.32 12.10±0.66 9.31±1.51 7.84±2.47
Scb 30.15±3.47 1.53±0.49 1.14±0.40 1.58±0.06 11.54±1.00 7.39±1.93 6.21±1.30
Cob 34.24±3.08 1.27±0.21 3.39±1.13 3.28±0.44 8.15±0.30 8.81 ±1.40
Cop 39.96±0.78 2.33±0.51 3.31±0.68 3.56±0.18 17.42±0.79 7.43±1.06 1.84±0.96
Cov 38.77±0.48 1.33±0.47 2.86±0.24 3.13±0.51 14.82±2.53 12.08±0.16 2.74±1.06
Cow 36.88±3.39 3.95±1.75 2.07±0.38 2.67±0.41 12.35±2.99 8.39±0.52 7.41±3.29
Ozm 30.65±2.44 2.0±0.20 0.86±0.11 1.03±0.01 7.28±1.53 14.25±2.08 2.66±1.02
Ozp 43.87±6.60 6.57±0.55 1.55±0.38 4.30±0.82 14.54±0.96 8.81±2.02 8.62±1.77
Sle 48.50±12.47 5.85±0.61 1.49±0.30 4.25±0.52 10.30±1.82 9.29±0.89 13.28±3.34
Spd 33.76±0.28 5.05±0.69 0.98±0.28 3.03±0.35 12.21 ±0.81 11.40±3.31 1.96±0.53
Spt 21.13±2.67 2.96±0.30 1.50±0.25 1.04±0.28 6.34±0.17 8.80±1.50 1.62±0.89
Mpd 33.12±1.07 3.80±0.04 1.22±0.14 1.32±0.08 8.89±0.92 13.39±1.92 4.24±1.98
Mpr 35.10±4.77 3.05±0.28 1.18±0.31 0.90±0.28 8.50±1.31 12.41±0.47 4.78±1.35
Mse 37.89±3.05 3.75±0.40 1.20±0.14 1.30±0.08 8.77±0.91 13.21 ±1.89 10.08±2.71
Mun 36.89±4.67 1.42±0.18 1.63±0.48 1.08±0.46 10.88±0.46 12.08±1.77 3.13±1.57
Euc 34.97±1.90 2.76±0.56 1.49±0.32 2.05±0.16 13.44±0.86 10.81±0.30 2.84±0.73
Eun 32.83±3.19 2.05±0.82 1.73±0.21 2.35±0.45 10.89±1.39 12.'6±1.96 2.77±1.87
Fie 25.68±3.22 1.50±0.06 0.63±0.07 0.91±0.07 7.59±1.93 9.39±0.30 2.69±1.36
Fig 35.22±4.04 1.82±0.11 1.13±0.16 1.44±0.17 12.84±1.43 8.35±0.58 10.54±2.55
Cam 40.80±1.57 2.21±0.13 0.90±0.08 2.73±0.42 10.77±2.67 11.04±1.92 9.77±3.54
Com 33.09±1.19 1.01±0.04 1.06±0.28 1.64±0.08 10.39±4.81 7.80±0.59 5.37±1.85
Syp 36.80±8.10 1.44±0.20 0.78±0.06 1.10±0.17 8.34±1.89 10.60±0.40 5.95±2.64
48

3.7.2. Phytochemical screening (fingerprints)
The TLC phytochemical profiles of the crude extracts and fractions of the 27 plant species investigated are
presented in Figs 3.1-3.4. Figures 3.1, 3.2, 3.3, and 3.4 are the TLC fingerprints of the crude, hexane fraction,
dichloromethanefraction, ethyl acetate fraction developed with three mobile phases of different polarities for
each fraction.
In each chromatogram the order from left to right was Bab (Bauhinia bowken), Bag (Bauhinia galpinil), Bap
(Bauhinia petersiana), Bav (Bauhinia variegata), Erl (Erythrina latissima), Inc (lndigofera cylindrica), Scb
(Schotia brachypetala), Cob (Combretum bracteosum), Cop (Combretum padoides), Cov (Combretum vendae),
Cow (Combretum woodit), Ozm (Ozoroa mucronata), Ozp (Ozoroa panicu/osa), Sle (Searsia leptodictya), Spd
(Searsia pendulina), Spt (Searsia penthen), Mpd (Maytenus peduncularis), Mpr (Maytenus procumbens), Mse
(Maytenus senegalensis), Mun (Maytenus undata), Cam (Carissa macrocarpa), Com (Commiphora harveyt),
Syp ( Syzygium paniculatum).
Fig.3.2. Chromatograms of 100 1-19 of crude extracts of different plant species developed with ethyl acetate: acetic acid: formic acid: water (75:5:5:10) (top), ethyl acetate: acetic acid: formic acid: water (70:5:15:10) (middle) and ethyl acetate: methanol: ammonia (90:20:15) (bottom) and visualized with vanillin sulphuric acid. For identity of plant species see under section 3.7.2 or under abbreviations used.
49

The chromatograms revealed complex mixture of compounds which exhibited different coloured reactions with
the vanillin/H2S04 spray reagent. The classes of compounds in the extracts include terpenoids (purple or bluish
purple) (Taganna eta/., 2011) and phenolics such as flavonoids (yellow, pinkish or orange), stilbenes (bright red
to dark pink colour), and proanthocyanidins (pink colour). The phenolic components were confirmed by blue
black spots with ferric chloride-potassium ferric cyanide reagents (Wettasinghe et a/., 2001) while the flavonoids
were confirmed by yellow spot (Rijke et a/., 2006) with aluminium chloride/acetic acid spray reagent
(AICb/CH3COOH).
Fig. 3.3: Chromatograms of the hexane fractions of different plant species developed with hexane: ethyl acetate: formic acid (90:10:2) (top), hexane: ethyl acetate: formic acid (70:30:2) (middle), and benzene: ethyl acetate: ammonia (90:10:1 ) (bottom) and visualized with vanillin sulphuric acid. For identity of plant species see under section 3.7.2 or under abbreviations used.
50

Characterization of the phytochemical profiles of the extracts indicated that the extraction method and
extractants used resulted in splitting the complex mixtures into polar components concentrated in the 70%
acetone component (crude extracts) and non-polar compounds concentrated in the hexane component. From
the chromatogram, the crude extracts contained phenolics (especially flavonoids and proanthocyanidin) and
terpenoids. The hexane and dichloromethane fractions contained prominent spots for terpenoids while the ethyl
acetate fractions had prominent spots typical of flavonoid and other phenolic compounds.
Fig 3.4: Chromatograms of the dichloromethane fractions of different plant species developed with hexane: ethyl acetate: formic acid (70:30:2) top, hexane: ethyl acetate: formic acid (50:50:2) (middle) and chloroform: ethyl acetate: formic acid (50:40: 1 0) bottom and visualized with vanillin sulphuric acid. For identity of plant species see under section 3.7.2 or under
abbreviations used.
51

Fig 3.5 Chromatograms of the ethyl acetate fractions of different plant species developed with chloroform: ethyl acetate: formic acid (50:40:10) (top), hexane: ethyl acetate: formic acid (10:90:10) (middle) and ethyl acetate: methanol: water: formic acid (100:13:10:2) (bottom) and visualized with vanill in sulphuric acid. For identity of plant species see under section 3.8.2 or under abbreviations used.
3.7.3. Phenolic composition of the crude extracts
In this study, the total phenolic, total tannin, condensed tannin, proanthocyanidin, hydrolysable tannin as
gallotannin, flavonoids and flavonol constituents of the phenolic-enriched crude extracts were evaluated using
various standard protocols. The total polyphenolic and non-tannin phenolic constituent of each crude extract was
evaluated using the Folin-Ciocalteau reagent. All the 27 extracts contain significant amount of polyphenols and
non-tannin compounds; however, the quantity varied widely between the species (74.91 ± 1.26 - 467.0± 15.8
mg GAE/g plant material) (Fig.3.6).
Among the different extracts tested, the highest content of polyphenols was Combretum padoides (467.0±15.8
mg GAE/g plant material) which did not differ significantly (P<0.05) to Combretum vendae with (444.20±15.4 mg
GAE/g plant material). These two plant species were followed by Carissa macrocarpa (354.15±3.01 mg GAE/g
plant material), Commiphora harveyi (362.60±2.1 0 mg GAE/g plant material), Euclea natalensis (204.98±1.89
mg GAE/g plant material), Ozoroa panicu/osa (370.89±4.80 mg GAE/g plant material) and Searsia pendulina 52
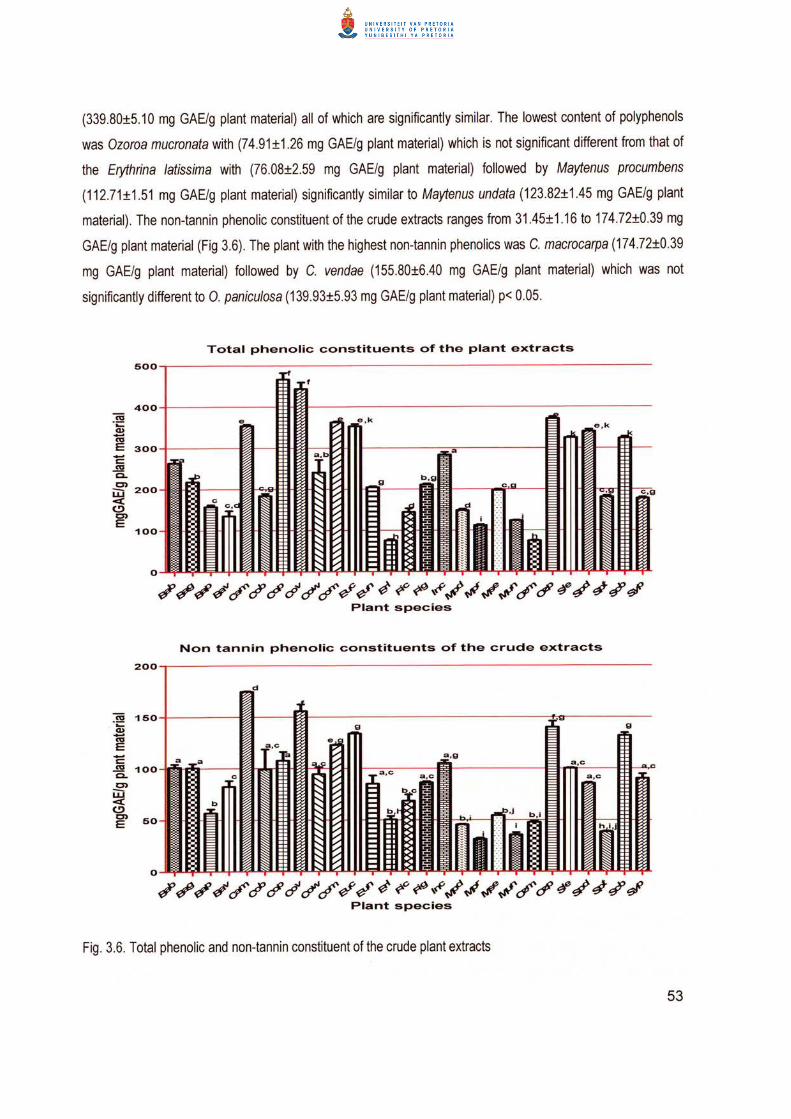
(339.80±5.1 0 mg GAE/g plant material) all of which are significantly simi lar. The lowest content of polyphenols
was Ozoroa mucronata with (7 4.91 ±1.26 mg GAE/g plant material) which is not significant different from that of
the Erythrina /atissima with (76.08±2.59 mg GAE/g plant material) followed by Maytenus procumbens
(112.71 ±1.51 mg GAE/g plant material) significantly similar to Maytenus undata (123.82±1 .45 mg GAE/g plant
material). The non-tannin phenolic constituent of the crude extracts ranges from 31.45±1.16 to 17 4.72±0.39 mg
GAE/g plant material (Fig 3.6). The plant with the highest non-tannin phenolics was C. macrocarpa (174.72±0.39
mg GAE/g plant material) followed by C. vendae (155.80±6.40 mg GAE/g plant material) which was not
significantly different to 0. paniculosa (139.93±5.93 mg GAE/g plant material) p< 0.05.
Total phenolic constituents of the plant extracts
~~~#/~~~~~~~~~~~~#~#~~~~#~~ Plant species
Non tannin phenolic constituents of the crude extracts
-~ 150
2 cu E -c::
..!!! a.. 100
~ w <( (.!) 0')
50 E
o~~...£t~=~u::ra.........._
~~~#/~~~~/~~~~~~~#~#~~~~#~~ Plant species
Fig. 3.6. Total phenolic and non-tannin constituent of the crude plant extracts
53

The plant with lowest content of non-tannin phenolic was M. procumbens (31.46±1.16 mg GAE/g plant material)
which was not significantly different toM. undata (35.64±2.12 mg GAE/g plant material) p< 0.05.
The total tannin content of the extracts ranged from 25.55±0.81 to 359.40±8.30 mg GAE/g plant material
(Fig.3.6). The highest tannin constituent was C. padoides (359.40±8.30 mg GAE/g plant material) and was
mainly hydrolysable gallotannin (305.80±19.09 mg GAE/g plant material) (Fig 3.7). This was followed by C.
vendae (288.40±8.30 mg GAE/g plant material) which also contained high hydrolysable gallotannin
(197.60±12.79 mg GAE/g plant material)
Total tannin constituents o'f the crude extracts
400~---------------------------------------------------
~ 3004-----------~~------------------------------------·;;:: Q)
~ -c:: S 200~----------~~~VHI~------------------~ c.. en
~ (!)
~ 1 00 ~I-I'Ot~-
o~........,.~...a.;---
l.n
~~~~/~~~~/~#¢~~~/~~/~~~~#~~ Plant species
Condensed tannin composition o'f the crude extracts
~~~~/~~~~/~#¢~~~/~~/~~~~#~~ Plant species
Fig. 3.7. Total tannin and condensed tannin of the crude extracts
The hydrolysable gallotannin constituents of C. vendae were not significantly different (p< 0.05) to that for Euclea
crispa and lndigofera cylindrical at 199.36±17.61 and 185.21±11.50 mg GAE/g plant material respectively. E.
latissima had the lowest tannin content at 25.55±0.81 mg GAE/g plant material followed by 0. mucronata at
54

27.17±0.18 mg GAE/g plant material. For both these plants the tannin content was mainly proanthocyanidin at
33.42±3.76 and 19.88±2.51 mg LE/g plant material respectively (Fig 3.8).
Proanthocyanidin composition of the crude extracts
250
e
200 (ij "i:: Q) ...... co 150 E c b co c.. -E' 100 w ,j _J 0)
E 50
0
~~~#/~~~~/~~~~~~~#~#~~~~#~~ Plant species
Gallotannin composition of the crude extracts
3004-----------~~--------------------------------------
0~~~~~~~~~~~~~~
~~~#/~~~~/~~~~~~~#~#~~~~#~~ Plant species
Fig. 3.8. Proanthocyanidin and gallotannin constituent of the crude extracts
The condensed tannin content ranged from 6.99±0.32 to 183.53±1 0.10 mg CE/g plant material. Bauhinia ga/pinii
had the highest condensed tannin at 183.53±1 0.10 mg CE/g plant material. This was followed by C. macrocarpa,
Bauhinia bowkeri, and Combretum bracteosum at 125.0±2.72, 120.02±8.37 and 121.90±5.50 mg CE/g plant
material respectively, which are not significantly different (p<0.05) from each other. 0. mucronata had the lowest
55

condensed tannin at 6.99±0.32 mg CE/g plant material followed by M. pendulina at 7.32±1.20 mg CE/g plant
material and E. latissima at 11.90±0.8 mg CE/g plant material.
The highest proanthocyanidin content was found in C. macrocarpa at 213.10±7.00 mg LE/g plant material
followed by S. leptodictya, B. galpinii, and Searsia pendulina at 126.54±6.46, 121.08±2.20 and 117.83±2.24 mg
LE/g plant material respectively. Statistically, S. leptodictya, B. galpinii, and Searsia pendulina were not
significantly different (p<0.05) for their proanthocyanidin content. M. procumbens and S. pentheri had the lowest
proanthocyanidin content at 10.46±1.76 and 10.08±2.24 mg LE/g plant material respectively.
Total 'flavonoid composition o'f the crude extracts
- 160~-----------------------------r----------~------~--C'a ·a:: Q)
~ ~ 100~----------~~--~ ~~--~~~--------~------~-"'iS.. en w
CJ
~ 60 -t--~H=I-
0
~~~~/~~~~/~~~~~~~~~~~~~~#~~ Plant species
Flavonol composition of the crude extracts
20~----------------------------------------------------
-~ 15 Q)
~ i 10~------------------------------'C... CD w a
h
~ 5~----------~~~~H ~~~~ k
0
~~~~~~~~~/~~~~~~~#~~~~~~#~~ Plant species
Fig. 3.9. Total flavonoids and the flavonol constituent of the crude extracts
The total flavonoid ranged from 11.27±3.37 to 176.87±5.96 mg QE/g plant material. The highest flavonoid
content was present in Schotia brachypetala at 176.87±5.96 mg QE/g plant material followed by 0. panicu/osa 56

168.27±5.96 mg QE/g plant material. No significant difference (p<0.05) was present between the two plant (Fig
3.9). The lowest flavonoid content was present in M. senegalensis at 11.27±3.37 mg QE/g plant material. The
highest flavonol content was present forM. procumbens at 17.85±0.20 mg QE/g plant material followed by C.
padoides at 8.81±0.13 mg QE/g plant material. The lowest flavonol content was C. bracteosum at 0.13±0.07 mg
QE/g plant material.
3.8. Discussion
3.8.1. Yield
The extraction of phenolic constituents from plant matrix is complex and is influenced by their chemical nature,
extraction method, sample particle size, solvent as well as presence of interfering substances. Phenolics can
also complex with carbohydrates, proteins, and other plant components like alkaloids. High molecular weight
phenolics and their complexes are usually insoluble and solubility is also a function of the solvent polarity Naczk
and Shahidi, 2004). Consequently, phenolic extracts composed of varied classes of phenolics present in different
proportion with the degree of solubility in the solvent system as the primary determinant. In this experiment,
simultaneous extraction and fractionation using acidified 70% acetone and n-hexane was adopted. Two
immiscible phases of phenolic-enriched acetone solution (low phase) and chlorophyll-enriched terpenoids
containing hexane (upper phase) were obtained.
The extraction process is an important factor for assessing the biological activity of medicinal plant extracts
(Berlin and Berlin, 2005) as it influence yield of the extracts, extractive capacity of an extractant, and quality
parameter of the herbal preparations (Albuquerque and Hanazaki, 2006). Low polar solvent extractants such as
hexane, petroleum ether and dichloromethane extract non polar compounds mainly of terpenoids or highly
methoxylated phenolics. In contrast, medium and high polar solvents such as ethyl acetate, acetone, methanol,
ethanol water or mixture of these solvents extract the polar compounds ranging from simple phenolics to
complex polymeric phenolics (tannins).
3.8.2. Thin layer chromatogram
TLC fingerprints of the plant leaf crude extracts and fractions showed complex mixtures of non-polar to polar
compounds. TLC was used as qualitative method to characterize and document the phytochemical profiles of the
extracts as a fingerprint. The phytochemical constituents of plants depend on several factors including seasonal
changes, biotic (genetic) and abiotic (climatic stress, infection and soil fertility) factors (Moure eta/., 2001 ). TLC
analyses help in monitoring composition of the extracts and fractions to ensure that no component(s) are lost
during processing. It also provides a means of comparing phytochemical composition of different plant extracts
developed side by side.
57

When comparing TLC fingerprints of the hexane fractions and the crude extracts from the extraction process,
hexane fractions were enriched with non-polar components while the crude extracts were enriched with polar
components, mostly of phenolic compounds. Solvents (2) E: F: A: W (70:5:15:10), (5) H: E: F (70:30:2), (8) C: E:
F (50:40:10) and (9) E: M: W: F (50:6.5:5:2) were the best mobile phase obtainable for preparing TLC fingerprint
of the crude extract, hexane fractions, dichloromethane fractions and ethyl acetate fractions respectively in this
work.
Polyphenolic compounds are important bioactive component of medicinal plant extract exhibiting various
pharmacological properties (Vundac et a/., 2007). Phenolic-enriched extracts have been reported to correlate
with a wide range of physiological and health benefits which include antiallergenic, antiviral, antibacterial,
antifungal (Pietta, 2000), antisecretory, antispasmolytic, antimotility (Yue et a/., 2004), anti-inflammatory,
immunomodulatory and parasitic activities. In traditional medicine preparation of plant extract recipe, water or
ethanolic solutions are the main extractants.
3.8.3. Phenolic constituents of the crude extracts
Polyphenolic compounds are important bioactive component of medicinal plant extract exhibiting various
pharmacological properties (Vundac et a/., 2007). Phenolics form one of the main classes of secondary
metabolites and several thousand (among them over 8,150 flavonoids) different compounds have been identified
with a large range of structures: monomeric, dimeric and polymeric phenolics (Lattanzio eta/., 2006). Several
classes of phenolics have been categorized on the basis of their basic skeleton. These groups of phytochemicals
are primarily natural antioxidants which act as reducing agent, metal chelators and single oxygen quenchers.
Phenolic-enriched extracts have been reported to correlate with a wide range of physiological and health benefits
other than antioxidative activity.
Polyphenolic compounds have antidiarrhoea properties exhibiting one or more activities against diarrhoea
pathogenesis. These may include antiallergenic, antiviral, antibacterial, antifungal (Pietta, 2000), antisecretory,
antispasmolytic, antimotility (Yue eta/., 2004), anti-inflammatory, immunomodulatory and parasitic activities. In
traditional medicine preparation of plant extract recipe, water or ethanolic solutions are the main extractants.
These extractants extract more or less polar compounds made majorly of phenolic compounds. Specific types of
phenolic compounds present in the crude extracts are therefore evaluated.
Flavonoids are C6-C3-C6 polyphenolic compounds present in food, beverage and medicinal plants. They have
been reported to have useful pharmacological properties including anti-inflammatory activity, enzyme inhibitors,
antiallergic, anti-inflammatory, antiviral, antispasmolytic, pro-secretory (Yue et a/., 2004) and antimicrobial
activity. Flavonoids are known to act on the inflammatory response via many routes and block molecules like
58

COX, iNOS, cytokines, nuclear factor-KB and matrix metalloproteinases. In addition, flavonoids have good
antioxidant, free radical scavengers that donate hydrogen, inhibit lipid peroxidation (Rauha, 2001; Havsteen,
2002) and metal ion chelators. However, the antioxidant power of flavonoids depends on some important
structural prerequisites such as the number and the arrangement of hydroxyl groups, the extent of structural
conjugation and the presence of electron-donating and electron-accepting substituents on the ring structure
(Miliauskas et a/. , 2005). These groups of phytochemicals are known to play some beneficial roles in the
prevention of many oxidative and inflammatory diseases (Arts and Hollman, 2005) inhibiting oxidative and
inflammatory enzymes (Middleton eta/., 2000).
Gallotannins are complex sugar esters of gallic acid and together with the related sugar esters of ellagic acid
(ellagitannins) made up the hydrolysable tannins. Gallotannins exhibit biological activities including antimicrobial,
antiviral, anti-inflammatory to anticancer and antiviral properties (Erde'lyi et a/., 2005). The mechanisms
underlying the anti-inflammatory effect of tannins include the scavenging of radicals, and inhibition of the
expression of inflammatory mediators, such as some cytokines, inducible nitric-oxide synthase, and
cyclooxygenase-2 (Polya, 2003; Erde'lyi eta/., 2005).
Condensed tannins also referred to as proanthocyanidins are oligomers or polymers essentially derived from
flavan-3-ol and their derivatives via carbon to carbon (C-C).or rarely C-0-C links. They differ structurally
according to the number of hydroxyl groups on both aromatic rings (rind A and B) and the stereochemistry of the
asymmetric carbons of the heterocyclic ring (ring C). Condensed tannins are classified according to their
hydroxylation pattern into several subgroups including procyanidins (3,5,7,3' ,4'-0H), prodelphinidins,
(3,5,7,3',4',5'-0H), propelargonidins (3,5,7,4'-0H), profisetinidins (3,7,3',4'-0H), prorobinetinidins (3,7,3',4',5'-
0H), proguibourtinidins (3,7,4'-0H), proteracacinidins (3,7,8,4'-0H), and promelacacinidins (3,7,8, 3',4'-0H) (Cos
et a/., 2003). As with other polyphenols, tannin structures are suitable for free radical scavenging activities
serving as an excellent hydrogen or electron donors to form radicals that are relatively stable due to
delocalization resulting from resonance and unavailability of site for attack by molecular oxygen (Mello et a/,
2005). Tannins can also binds to some free radical producing enzymes forming an insoluble tannin-protein
complex (astringent characteristic), complex with catalytic metallic ions making it unavailable to initiate oxidation
reaction, and inhibiting lipid peroxidation process (Russo eta/, 2005; Mello eta/, 2005). These compounds are
antagonists of hormone receptors or inhibitors of enzymes such as cyclooxygenase enzymes (Polya, 2003).
Tannins have the ability to protect renal renal cells against ischemia reperfusion injury (Yokozawa eta/, 1997)
characterized by an overproduction of 02'-due to both an electron leak in the mitochondrial respiration chain and
the conversion of xanthine dehydrogenase to xanthine oxidase (Wernes and Lucchesi, 1990). The protective
action of tannins in this process is related to direct inhibition of enzymatic function of xanthine oxidase activity
(Russo eta/, 2005). 59

Production of reactive species (H202, 02·-, and OH') and peroxynitrite occurs at the site of inflammation and
contributes to the exacerbation of inflammatory disease and tissue damage. In acute inflammation or chronic
inflammations, the production of 02·- is increased at a rate that overwhelms the capacity of the endogenous SOD
enzyme defence to dissipate. Reduction in the 02·- generation can decrease side-effects of the radical in
inflammatory conditions. Tannins have been demonstrated to exhibit anti-inflammatory activity by exerting anti
oxidative properties in reducing 02·- and malondialdehyde (MDA) production, plasma extravasations and cell
migration mainly of leukocytes and potentates the activity of SOD in radical scavenging (Nardi eta/, 2007). It
shows that reactive species are most important mediators that provokes or sustain inflammatory processes and
consequently, their annihilation by antioxidants and radical scavenger can alleviate inflammation (Delaporte eta/,
2002; Geronikaki and Garalas, 2006).
3.9. Conclusion
The extraction methods used optimally extract the phytochemical constituent from the powdered leaves. The
extraction process adopted in this work separated the phytochemicals into non-polar hexane portion and polar
water soluble portion in the first step. In addition to taxonomic identification and authentication of medicinal plant,
chemical characterization is also an important and useful means of quality control as it directly correlate with
pharmacological functions. The TLC fingerprints revealed the complexity of plant extracts and fractions with
chemical compositions of a wide range of polarities. For the optimization of the TLC fingerprinting more than one
mobile phase were used to obtain a representative chromatogram of the extracts. In this study, combination of
fingerprint with multicomponent quantification of the phenolic compositions was adopted as a good method for
chemical profiling of the plants.
There was a strong similarity in the chromatograms of Erythrina Jatissima, Combretum vendae and Combretum
woodii. Erythrina and Combretum are not closely related and the similarity may be an example of convergent
evolution. Combretum vendae and C. woodii are however, closely related as part of the subgenus Combretum
and the results indicate the potential use of chemical markers in taxonomy.
60

CHAPTER FOUR
Antimicrobial activities of the plant extracts against potential diarrhoeal pathogens
4.0. Introduction
Infectious disease defined as an illness caused by a specific pathogen or its toxins that result from transmission
of the causative agent or its virulence effectors from an infected person, animal or reservoir to a vulnerable host.
The susceptibility of host to infectious pathogens, disease development, progression and severity depends on
the age, gender, genetic, immune and nutritional status. Infectious diseases represent a leading cause of
morbidity and mortality worldwide despite the advancement in orthodox medicine accounting for more than 26%
of all death with developing countries carrying the major burden (Becker et a/., 2006). Infections are also
considered to be a major contributing factor associated with reduced performance in food animals during growth.
Particularly, persistent infections account for slow growth, suboptimal feeding efficiency and economic loss in the
livestock industry (Borghetti eta/., 2009). The infective pathogens include bacteria, fungi, viruses, protozoa and
parasites which manifest their virulence through different mechanisms (see section 2.2 for detailed discussion).
The discovery of antibiotics in 1928 and subsequent development in 1940 as medical treatment provides
effective and efficient therapeutic agents for controlling almost all infectious diseases including many feared and
contagious infections. Antibiotics are effective in curing many infectious diseases, but they also enhance
selection of resistant microbes as some pathogens rapidly became resistant to many of the originally susceptible
drugs (Barbour eta/, 2004).
At present, the pharmaceutical drugs available to control antibiotic-resistant bacteria are becoming limited. The
indiscriminate use and abuse of antibiotics has led to the development of antimicrobial resistance strains and
toxicity of some drugs to human and animals (Barton, 2000; Parekh and Chanda, 2007). As a result of these
problems, European Union (EU) with EU-directive 1831/2003 imposed ban on the use of antibiotics as growth
factor in animal production with effect from 2006 to avoid cross resistance problem with human pathogens and
chemical residues in foods (Makkar eta/, 2007).
Drug resistance of human and animal pathogenic microbes and parasites has created a serious problem
worldwide as previously treatable ailments such as diarrhoea (including dysentery and cholera), and tuberculosis
are now more difficult and expensive to treat. The mechanisms of microbial resistance to antibiotic include
(Dwyer eta/., 2009):
~ Genetic alterations which involved the physical exchange of genetic material with another organism (via
plasmid conjugation, phage-based transduction, or horizontal transformation), the activation of latent
mobile genetic elements (transposons or cryptic genes), and the mutagenesis of its own DNA.
61

~ Chromosomal mutagenesis arises directly from interaction between the chromosome and the
antibacterial agent or antibiotic-induced oxidative stress, or indirectly from the bacterium's error prone
DNA polymerases during the repair of a broad spectrum of DNA lesions.
The situations have complicated by the treatment of infectious diseases in immunocompromised patients. These
negative health trends necessitate for a new prevention and treatment of infectious diseases including diarrhoea.
Medicinal plants have also featured as therapeutic agents used by the world population for basic health care
needs and to combat many kinds of infectious diseases worldwide (Voravuthikunchai and Limsuwan, 2006).
Medicinal plants have curative properties due to the presence of complex mixture of phytochemicals acting
individually or synergistically to exert the associated therapeutic effects. Some of the plant compounds may be
novel bioactive substances that can be effective as therapeutic agents for treating ailments such as infectious
diarrhoea. These phytochemicals exhibit their antidiarrhoeal effects through various mechanisms such as
antimicrobial (Lutherodt eta/, 1999), increasing colonic water and electrolytic re-absorption, inhibition of intestinal
motility (Oben et a/, 2006) and anti-secretory effects (Rao et a/, 1997). There is considerable research in the
screening of natural products from extracts of edible and medicinal plants for the development of alternative
drugs to prevent and curtail the emergence of drug-resistance pathogens or other forms of ailments.
4.1. Qualitative antimicrobial (Bioautography) assay
This refers to the direct bioactivity test on developed TLC plates as a means of localizing the biological activity
such as microbial growth inhibition, enzymatic inhibition or antioxidative properties of extracts to the particular
active compound(s). This helps in focusing attention on the relevant components of an extract (Saxena et a/.,
1995) Fractionation of medicinal plant extracts in combination with bioautography provides an efficient and
relative cheap method for bioactivity-guided isolation of target compound(s) (Hostettman et a/., 1997). Practical
application of bioautography in activity guided isolation includes enzyme inhibition assay such as the Ellman
method for cholinesterase inhibitors (Ellman eta/., 1961 ). In this method, the developed TLC plate is sprayed
with a substrate, enzyme and indicator to determine the inhibition by colour variation (white zone against yellow
background) (Rhee eta/. , 2001).
In the antimicrobial bioassay, two bioautography methods are available. Firstly, the agar diffusion method
involves pouring a layer of inoculated agar solution of the microbes on the developed TLC plate and allowed to
set, and the bioactive zone(s) are transferred to the agar gel by diffusion where they can inhibit the growth of the
microorganism (Fig 4.1 ). Secondly, the direct method involves spraying of microorganism broth inoculant onto
the TLC plate (Homans and Fuchs, 1970) and incubating in humid conditions to facilitate the growth of the
organism. Microbial growth inhibitions are recognized based on the ability of the living microorganism to
62

transform tetrazolium salts to a coloured formazan product. White spots against an intense purple coloured
background indicate the compound(s) that kill the tested microorganism (Hostettman and Martson, 2002).
Classification of microbiological methods for biological detection
Bioautography
Disc
Cylinder
Hole-plate assay
,-------+! Agar dilution
:rube assay
Contact
Immersion
Direct
Fig 4.1. The classification of microbiological methods for biological detection (Adopted from Choma and Grzelak,
2011)
4.2. Quantitative antimicrobial activity (Minimum inhibitory concentration (MIC)) assay
Among the quantitative antimicrobial methods used in evaluating plant extract activity, agar diffusion assay
(Greenwood, 1989) and two-fold serial micro-dilution assay (Eioff, 1998) are the most common in phytomedicine
research. Sensitivity of the two protocols and their mechanisms varied widely. The mechanism of agar diffusion
is the movement of bioactive compounds through the solid agar medium to kill or inhibit the growth of organism it
may come in contact with. However, agar diffusion assays may sometimes lead to a false negative resu lt, due to
influence of the agar type, salt concentration, incubation temperature molecular size of the antimicrobial
components (Greenwood, 1989), and limited diffusion of bioactive component in agar medium. The two-fold
serial micro-dilution assay depend on direct contact between the test sample and organism is adjudged to be 30
times more sensitive than the other methods used to screen plant extracts for antimicrobial activity (Eioff, 1998).
Although, the effective solubility and miscibility of the bioactive component in the test medium such as the non
polar compounds like terpenes, alkaloid and highly methoxylated phenolics is a limiting factor.
4.3. Selection of microorganisms used in the study
The selection of the microorganisms for antibacterial evaluation in this study was based on their known
pathogenic effects in both human and animals with emphasis on diarrhoeal pathogens. Pathogenic E. coli has
been implicated in diseases such as diarrhoea, haemorrhagic colitis, haemolytic uremic syndrome and
thrombocytopenic purpura (Voravuthikunchai and Limsuwan, 2006). Enterococcus faecalis has been implicated
in causing enteric infection with diarrhoeal effects (Butler, 2006). Pseudomonas aeruginosa strains cause
diseases such as mastitis, abortions and upper respiratory complications (Masika and Afolayan, 2002).
Staphylococcus aureus is one of the prominent microbes causing skin infection such as boils, abscesses,
carbuncles and sepsis of wounds and it also produces toxins causing diarrhoea and vomiting (Maregesi et a/, 63

2008). Candida albicans is a typical opportunistic pathogen causing diarrhoea (Gambhir eta/, 2006), oral and
vaginal candidiasis (Shai et a/, 2008) especially in immunocompromised individuals due to unexpected
opportunity by a failure of host defence. Cryptococcus neoformans has been implicated in causing life
threatening meningoencephalitis (Xue eta/, 2007) and pneumonia in immunocompromised individuals (Hamza et
a/, 2006).
4.4. Material and Methods
4.4.1. Microorganism strains
Two standard strains of Gram-positive bacteria (Staphylococcus aureus ATCC 29213, Pseudomonas aeruginosa
ATCC 25922) and two standard strains of Gram-negative bacteria (Escherichia coli ATCC 27853, Enterococcus
faeca/is ATCC 29212) were used for antibacterial assay. Three clinical pathogenic fungi namely yeasts (Candida
albicans, Cryptococcus neoformans) and mould (Aspergillus fumigatus) (All fungal strains obtained from the
Department of Veterinary Tropical Diseases, Faculty of Veterinary Sciences, University of Pretoria) were used.
4.4.2. Culturing of the Bacteria
The bacterial strains were maintained in Mueller Hinton agar (MHA) (Fiuka, Spain) while the fungi were
maintained in Sabouraud dextrose agar (Merck, Germany) at 4°C under anaerobic conditions. All the organisms
were subcultured every 2 weeks. Before testing, the bacterial inoculums were prepared and cultivated in Mueller
Hinton broth for 12 h at incubation temperature of 37°C. The fungi inoculums were prepared in Sabouraud
dextrose broth (SOB,). The microbial cultures were serially diluted (10 fold increments) in sterile broth to obtain
the cell suspension of 1.0 x1os CFU/ml.
4.4.3. Bioautography against some pathogenic microorganisms
Bioautography was undertaken to ascertain the number of active compound(s) present in crude extracts and
fractions. TLC plates were developed as described in section 3.5.4 (Pp 43 - 44), and sprayed with overnight
cultures of Staphylococcus aureus, Pseudomonas aeruginosa, Escherichia coli, Enterococcus faecalis, Candida
albicans, Cryptococcus neoforman) and Aspergillus fumigatus in a biosafety class II fume carbinet (Labotec
South Africa. The sprayed chromatograms were incubated at 37°C for 12-16 h before spraying with tetrazolium
violet (INT). The inhibitory activity of any components was evident as clear white zones against the purple/red
background.
4.4.4. Determination of Minimum Inhibitory Concentration (MIC) against the bacteria pathogens
The minimum inhibitory concentration (MIC) for the crude extract and fractions against bacteria were evaluated
using the twofold serial dilution assay with tetrazolium violet added as growth indicator (Eioff, 1998). The extracts
64

(1 00 IJI) at an initial concentration of 1.0 x 1 04 1Jg/ml was serially diluted with distilled water up to 50% in 96-well
microtitre plate to prepare solution range between 5000 IJg/ml first well and 40 !Jg/mllast well. The bacterial ( 1 00
!JI) inoculants from 12 h broth cultures (section 4.4.2) diluted to 1:100 were added to each well to obtain final
extract concentration range of 2500 IJg/ml first well and 20 IJg/ml last well. Gentamicin (25 !Jg/ml first well and
0.18 !Jg/ml last well) was used as positive control and the solvent used in dissolving the extract was used as
negative control. Final volume in each well was 200 IJI. The plates were incubated for 24 h at 37°C and 100%
relative humidity. The inhibition of the bacteria were visualised by adding 40 !JI of aqueous p-iodonitrotetrazolium
violet (I NT) (Sigma) to each well (concentration 200 !Jg/ml). The plates were incubated for another 1 h and MIC
was determined as the lowest concentrations of test sample before purple formazan colour were observed.
4.4.5. Determination of Minimum Inhibitory Concentration (MIC) against the fungal pathogens
Minimum inhibitory concentrations (MIC) against three pathogenic fungi were determined using twofold serial
dilution assay as described above by Eloff, 1998 with the following modification of Masoko et a/, 2005. The
fungal inoculants (1 00 !JI) were in fresh Sabouraud dextrose broth and positive controls was amphotericin 8 (50
!Jg/ml first well and 0.4 !Jg/ml last well) and negative controls was 70% acetone, final visualization of inhibitory
activity was obtained after an incubation for 24 h at 37°C, and 100% relative humidity.
4.5. Results
4.5.1. Microbial bioautography
The TLC bioautography of the crude extracts and fractions of the 27 plant species tested against standard strain
bacteria and clinical fungal isolates are presented in Fig 4.2-4.12.
Fig. 4.2. Bioautography of hexane (upper) fraction of different plant species against S. aureus (Bab (Bauhinia bowken),
Bag (Bauhinia galpinil), Bap (Bauhinia petersiana),Cam (Carissa macrocarpa), , Cop (Combretum padoides), Cov (Combretum vendae), Cow (Combretum woodit), Com (Commiphora harveyt), Euc (Euclea crispa), Eun (Euclea natalensis), Erl (Erythrina latissima), Fie (Ficus craterestoma), Fig (Ficus glumosa) developed with hexane: ethyl acetae: formic acid (70:30))
65

The antimicrobial activities of the extracts were concentrated on the non-polar-enriched hexane fraction while the
polar enriched components no sign of microbial inhibition.
Fig. 4.3. Bioautography of dichloromethane fractions of different plant species against S. aureus (Bab (Bauhtnta
bowken), Bag (Bauhinia galpinit), Bap (Bauhinia petersiana),Bav (Bauhinia variegata) Cam (Carissa macrocarpa), , Cop (Combretum padoides), Cov (Combretum vendae), Cow (Combretum woodit), Com (Commiphora harveyt), Euc (Euclea crispa), Eun (Euclea natalensis), Erl (Erythrina latissima), Fie (Ficus craterestoma), Fig (Ficus glumosa) developed with chloroform: ethylacetate: formic acid (100:13:10)).
Fig. 4.4. Bioautography of hexane fractions of different plant species against E. faecalis (Bab (Bauhtnia bowken), Bag
(Bauhinia galpinit), Bap (Bauhinia petersiana),Cam (Carissa macrocarpa), Cop (Combretum padoides), Cov (Combretum vendae), Cow (Combretum woodit), Com (Commiphora harveyt), Euc (Euclea crispa), Eun (Euclea natalensis), Erl (Erythrina latissima), Fie (Ficus craterestoma), Fig (Ficus glumosa) developed with hexane: ethyl acetae: formic acid (70:30))
66

Fig. 4.5. Bioautography of dichloromethane fractions of different plant species against E. coli (Bab (Bauhinia bowken),
Bag (Bauhinia galpinil), Bap (Bauhinia petersiana),Bav (Bauhinia variegata) Cam (Carissa macrocarpa), , Cop (Combretum padoides), Cov (Combretum vendae), Cow (Combretum woodil), Com (Commiphora harvey1), Euc (Euclea crispa), Eun (Euclea natalensis), Erl (Erythrina latissima), Fie (Ficus craterestoma) developed with chloroform: ethylacetate: formic acid (100:13:10)).
Fig. 4.6. Bioautography of dichloromethane fractions of different plant species against E. faecalis (Bab (Bauhinia
bowken), Bag (Bauhinia galpini1), Bap (Bauhinia petersiana),Bav (Bauhinia variegata) Cam (Carissa macrocarpa), , Cop (Combretum padoides), Cov (Combretum vendae), Cow (Combretum woodil), Com (Commiphora harvey1), Euc (Euclea crispa), Eun (Euclea natalensis), Erl (Erythrina latissima), Fie (Ficus craterestoma), Fig (Ficus glumosa) developed with chloroform: ethylacetate: formic acid (100:13:10)).
67

Fig. 4.7. Bioautography of hexane of different plant speicies against C. neoformans (Ozm (Ozoroa mucronata), Ozp
(Ozoroa paniculosa), Sle (Searsia leptodictya), Spd (Searsia pendulina), Spt (Searsia penthen), Mpd (Maytenus peduncularis), Mpr (Maytenus procumbens), Mse (Maytenus senegalensis), Mun (Maytenus undata), Cam (Carissa macrocarpa), Com (Commiphora harvey1), Syp (Syzygium paniculatum)).
Fig. 4.8. Bioautography of dichloromethane fractions against C. neoformans (Ozm (Ozoroa mucronata), Ozp (Ozoroa
panicu/osa), Sle (Searsia leptodictya), Spd (Searsia pendulina), Spt (Searsia penthen), Mpd (Maytenus peduncularis), Mpr (Maytenus procumbens), Mse (Maytenus senegalensis), Mun (Maytenus undata), Cam (Carissa macrocarpa), Com (Commiphora harvey1), Syp (Syzygium paniculatum))
68
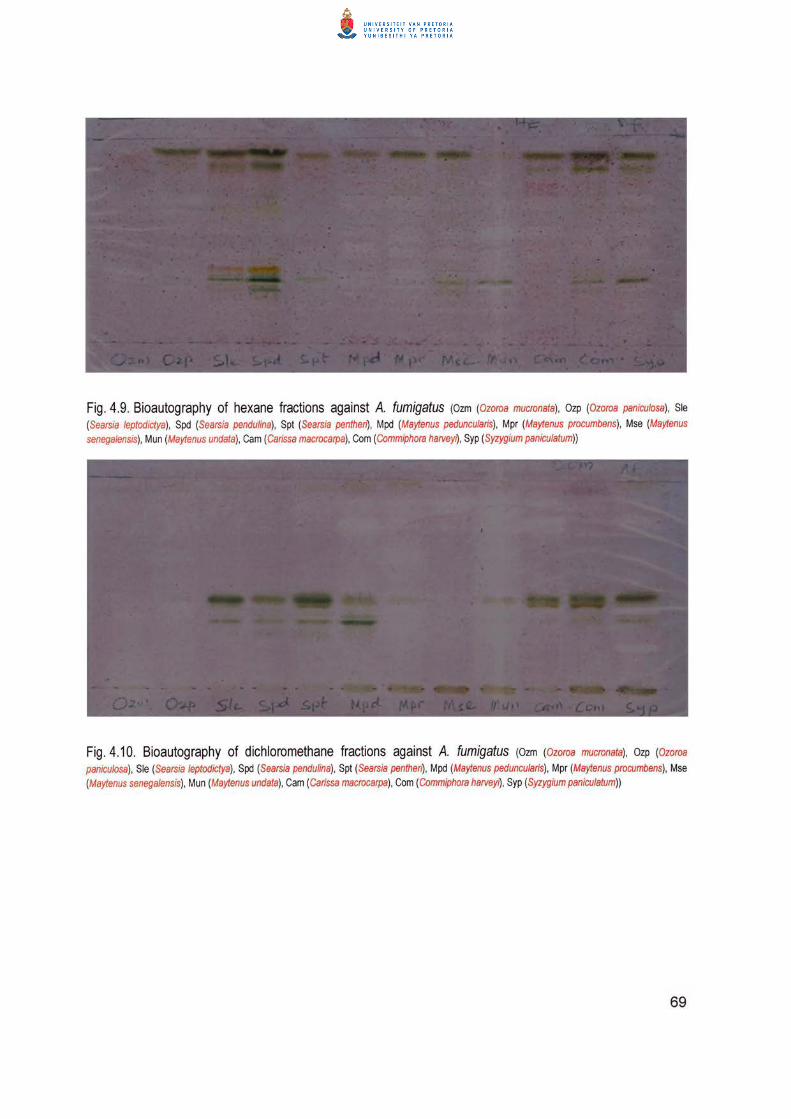
Fig. 4.9. Bioautography of hexane fractions against A. fumigatus (Ozm (Ozoroa mucronata), Ozp (Ozoroa paniculosa), Sle
(Searsia leptodictya), Spd (Searsia pendulina), Spt (Searsia penthert), Mpd (Maytenus peduncularis), Mpr (Maytenus procumbens), Mse (Maytenus senegalensis), Mun (Maytenus undata), Cam (Carissa macrocarpa), Com (Commiphora harvey1), Syp (Syzygium paniculatum))
Fig. 4.1 0. Bioautography of dichloromethane fractions against A. fumigatus (Ozm (Ozoroa mucronata), Ozp (Ozoroa
paniculosa), Sle (Searsia leptodictya), Spd (Searsia pendulina), Spt (Searsia penthen), Mpd (Maytenus peduncularis), Mpr (Maytenus procumbens), Mse (Maytenus senegalensis), Mun (Maytenus undata), Cam (Carissa macrocarpa), Com (Commiphora harvey1), Syp (Syzygium paniculatum))
69

Fig. 4.11 . Bioautography of hexane fractions against C. albicans (Ozm (Ozoroa mucronata), Ozp (Ozoroa paniculosa), Sle
(Searsia leptodictya), Spd (Searsia pendulina), Spt (Searsia penthen), Mpd (Maytenus peduncularis), Mpr (Maytenus procumbens), Mse (Maytenus senegalensis), Mun (Maytenus undata), Cam (Carissa macrocarpa), Com (Commiphora harveyt), Syp (Syzygium panicu/atum)).
Fig. 4.12. Bioautography of dichloromethane fractions against C. albicans (Ozm (Ozoroa mucronata), Ozp (Ozoroa
paniculosa), Sle (Searsia /eptodictya), Spd (Searsia pendulina), Spt (Searsia penthen), Mpd (Maytenus peduncularis), Mpr (Maytenus procumbens), Mse (Maytenus senegalensis), Mun (Maytenus undata), Cam (Carissa macrocarpa), Com (Commiphora harveyt), Syp (Syzygium paniculatum))
4.5.2. Minimum inhibitory concentration (MIC)
The antibacterial activities of the phenolic-enriched extracts, fractions and sub-fractions of different polarities of
27 plant species evaluated against 4 microorganisms (two gram positive and two gram negative bacteria) are
70

presented in Table 4.1. The results are presented as minimum inhibitory concentrations (1-Jg/ml) against tested
bacteria and the fungi. The extracts and fractions of the plant species tested exhibited average to good degree of
inhibition against the growth of all the tested bacteria and fungi strains. The extracts and fractions exhibited high
potency or growth inhibition at concentration between 19 and >2500 1-Jg/ml for the various different organisms. In
this investigation, hexane and dichloromethane fractions had significant and broad-spectrum antimicrobial
activities against all tested microbial strains.
The most susceptible bacterium to the crude extract is E. faecalis with MIG ranged from 78 to 1250 1-Jg/ml and
the least susceptible bacterium to the crude phenolic-enriched extract is E. coli with MIG ranging from 312 to
2500 1-Jg/ml. However, all the microorganisms tested are highly susceptible to hexane and dichloromethane
fractions with MICs ranging from 19 to 1250 1-Jg/ml. Some of the interesting results include the hexane and
dichloromethane fractions of C. padoides, C. vendae, C. woodii, B. galpinii, M. penducu/aris, M. procumbens, S.
leptodictya and S. pendulina with MICs of 19 - 39 1-Jg/ml against E. coli. The hexane and dichloromethane
fractions of C. padoides, C. vendae, C. woodii, M. penducularis, M. procumbens, M. senegalensis, 0. mucronata,
0. panicu/osa, S. leptodictya and S. pentheri also exhibited good microbial growth inhibitory activity against E.
faecalis with MICs between 19 - 78 1-Jg/ml.
Growth inhibition activities against S. aureus of interest include hexane, dichloromethane, ethyl acetate, butanol
fractions of B. ga/pinii and C. vendae (MIG 39 - 156 ~g/ml); hexane and dichloromethane fractions of C.
padoides, 0. mucronata and S. pentheri (19- 78 ~g/ml), and hexane, dichloromethane, ethyl acetate fractions of
0. panicu/osa, S. /eptodictya and S. pendulina (19- 39 ~g/ml).
Pseudomonas aeruginosa is also susceptible to growth inhibition by hydrogen and dichloromethane of C.
padoides, E. Jatissima, M. pendicularis, M. procumbens, and M. senegalensis with MICs of 19 - 78 1-Jg/ml;
hydrogen, dichloromethane, ethyl acetate M. undata, 0. paniculosa, S. leptodictya, S. pendulina and S. pentheri
with MICs of 19 - 78 1-Jg/ml. The reference antibiotic (gentamicin) exhibited good antibacterial activity against the
four tested bacterial strains with MIG ranged between 0.18 and 1.56 1-Jg/ml.
71

Table 4.1. Minimum inhibitory concentration (MIC) of the crude extracts and fraction against E. coli and E.
faecal is
E. coli E. faecalis Plant CRE Hf DCMf ETOAc Butanol Water CRE Hf DCMf ETO Butanol Water spp Ac Bab 625 39 156 312 156 >2500 78 312 312 39 78 312 Bag 312 39 156 312 156 312 156 156 39 156 78 312 Bap 312 78 156 312 625 312 78 156 312 78 39 312 Bav 625 78 156 156 156 312 312 312 625 39 39 312 Cam 312 156 156 156 312 312 312 312 78 156 Cob 312 39 156 312 156 >2500 156 312 312 39 78 312 Cop 156 19 19 312 39 >2500 78 19 19 156 78 312 Cov 312 39 39 156 156 312 156 39 78 78 78 39 Cow 625 39 39 312 156 >2500 156 39 78 78 78 312 Cmh 625 312 39 78 312 156 156 156 78 156 Erl 1250 156 19 156 156 1250 156 78 19 78 78 1250 Euc 312 625 78 78 156 156 312 156 156 78 Eun 312 312 312 78 156 625 312 312 156 156 Fie 2500 312 78 312 312 2500 78 312 312 312 Fig 1250 1250 312 312 625 156 Inc 1250 312 1250 312 Mpd 312 39 39 78 625 39 39 156 1250 Mpr 1250 39 39 156 1250 >2500 39 39 156 625 Mse 2500 78 78 156 1250 2500 39 39 312 625 Mun 1250 312 156 156 >2500 312 156 156 312 2500 Ozm 1250 78 39 156 312 625 39 19 625 1250 Ozp 1250 78 39 39 625 1250 39 19 156 78 Sle 1250 39 39 78 2500 625 39 19 156 625 Spd 1250 39 39 78 1250 625 156 19 312 625 Spt 2500 39 39 156 2500 1250 39 19 156 1250 Scb 625 312 156 39 156 1250 1250 78 312 39 78 2500 Syp 625 312 312 39 156 312 1250 312 156 39 156 1250
72

Table 4.1. Cont ....... Minimum inhibitory concentration (MIC) of the crude extracts and fraction against S. aureus
and P. aeruginosa
S. aureus P. aeruginosa Plant spp CRE Hf DCMf ETOAc Butanol Water CRE Hf DCMf ETOAc Butanol Water
Bab 625 78 312 625 78 312 312 78 312 156 312 312 Bag 625 39 78 39 78 312 312 312 78 312 156 312 Bap 312 156 312 78 78 78 78 312 625 625 312 625 Bav 625 78 1250 - - - 156 78 625 625 312 625 Cam 312 312 156 156 78 312 156 625 312 78 Cob 625 78 312 156 78 312 312 78 312 625 156 312 Cop 156 19 39 156 156 312 156 78 39 312 19 312 Cov 156 39 78 78 39 39 156 156 156 156 39 312 Cow 312 39 78 156 156 312 625 312 156 312 312 312 Cmh 312 78 156 78 156 2500 1250 312 312 156 312 Erl 1250 78 312 78 312 2500 78 78 156 78 1250 Euc 156 312 312 78 312 156 312 625 156 39 Eun 312 312 625 312 312 625 625 625 312 78 Fie 2500 156 312 1250 1250 2500 156 312 625 156 Fig 625 312 625 1250 312 78 Inc 625 156 625 312 Mpd >2500 78 39 312 78 312 19 19 156 312
Mpr 1250 39 78 312 625 312 78 39 156 625 Mse 625 78 39 156 625 625 39 39 156 1250 Mun 625 156 156 156 312 312 78 78 78 2500 Ozm 2500 19 19 625 1250 312 156 39 312 2500 Ozp 156 19 19 78 156 156 39 39 78 156 Sle 312 19 19 78 312 625 39 39 39 625 Spd 312 78 78 39 625 625 78 78 19 2500 Spt 312 19 19 156 312 156 19 19 78 2500 Scb 156 1250 156 156 156 1250 156 312 156 156 156 1250 Syp 156 39 156 312 312 2500 156 156 156 78 312 1250
4.5.3. Minimum inhibitory concentration (MIC)
The phenolic-enriched crude extracts and fraction exhibited good to moderate growth inhibitory activities against
the three fungal strains of different morphology with MICs ranging from 19 to 2500 ~g/ml (Table 4.2). Candida
albicans demonstrated resistance to all the crude extracts and fractions with the exception of dichloromethane
and butanol fractions which had MICs of 19 - 78 ~g/ml. In contrast, Cryptococcus neoformans was sensitive to
majority of many crude extracts and fractions at the concentration ranging from 19 - 78 ~g/ml. The fungi were
susceptible to amphotericin B with the MIC ranges from 0.78- 6.25 ~g/ml.
73

Table 4.2. Minimum inhibitory concentration (MIC) of the crude extracts and fraction against C. albicans, C. neoformans and A. fumigatus Values below 100 J..lglml in different colour
C. albicans C. neoformans A. fumigatus Plantspp CRE H DCM ETOAc But Water CRE H DCM ETOAc But Water CRE H DCM ETOAc But Water Bab 625 625 78 156 39 39 156 312 78 78 39 39 2500 156 312 312 156 625 Bag 312 625 78 156 78 625 78 315 78 39 39 312 625 156 156 156 78 156 Bap 1250 156 78 156 156 625 78 625 39 39 156 78 625 312 78 78 156 156 Bav 312 - 156 78 625 78 - - 78 78 78 625 312 156 156 Cam 625 156 625 312 19 156 78 78 156 19 19 1250 625 19 1250 625 312 156 Cob 625 625 312 156 156 1250 78 625 625 39 19 39 312 312 156 156 312 625 Cop 312 312 19 312 156 625 39 156 625 19 312 312 156 156 78 78 156 625 Cov 1250 625 312 78 312 312 78 19 156 78 156 312 156 156 156 156 156 625 Cow 1250 625 19 156 78 625 78 312 312 39 156 312 156 156 78 78 78 625 Cmh 625 156 39 156 39 625 156 39 19 39 19 1250 625 39 19 1250 312 Erl 1250 156 156 625 312 78 19 625 1250 156 156 312 625 Euc 625 156 156 156 78 156 78 156 78 39 39 156 312 625 156 625 156 156 .· Eun 625 156 78 78 78 625 78 78 39 156 78 625 312 625 625 312 78 312 Fie 2500 78 39 156 39 312 312 78 19 156 39 625 1250 312 156 156 312 156 Fig 625 78 39 78 39 312 78 78 19 78 39 1250 625 78 78 78 625 312 Inc 1250 78 19 156 78 78 39 39 1250 78 156 Mpd 312 312 78 312 156 312 78 312 78 78 1250 2500 312 78 156 156 312 625 Mpr 1250 156 39 312 625 625 156 39 156 2500 1250 78 78 156 625 Mse 1250 78 39 156 156 625 156 156 39 78 78 1250 625 156 78 156 1250 312 Mun 1250 625 78 312 625 1250 156 1250 78 78 312 1250 625 625 156 625 625 Ozm 625 312 156 156 625 625 156 312 156 39 156 2500 625 39 156 39 156 1250 Ozp 312 156 78 156 312 625 78 312 39 39 156 1250 312 78 78 312 156 625 Sle 312 39 39 312 625 156 156 39 312 1250 625 78 39 156 312 Spd 625 39 78 156 625 625 312 156 39 39 156 625 625 78 39 156 78 312 Spt 2500 625 78 312 156 1250 312 1250 19 39 312 1250 2500 78 19 625 156 625 Scb 625 156 312 625 78 312 78 2500 312 78 19 625 Syp 312 156 156 625 312 625 156 78 39 78 39 1250 312 156 19 1250 2500 312
-
74
4.6. Discussion
4.6.1. Antimicrobial bioautography
The crude extracts and various fractions were screened qualitatively for growth inhibitory activity against 4
bacteria and 3 fungi representing different morphologies as yeasts and moulds. Many compounds present in the
non-polar enriched hexane fractions inhibited the growth of the organisms tested with several zones of
inhibitions.
However, the polar fractions exhibited poor individual inhibitory activities, and this may be due to the high
solubility of polar compounds in water, like flavonoids resulting in washing and spread of the compounds on the
TLC plate surface. Therefore, reducing the threshold inhibitory concentrations of the bioactive compounds on the
spot of the chromatogram against the organisms tested. Other factors may include the disruption of synergistic
effects of the individual compounds separated on TLC plates or the concentration of the bioactive components is
not sufficient to inhibit microbial growth.
A number of methods have been developed for effective and quick screening of microbial growth inhibitory
properties of compounds like the disc or agar diffusion assay adapted as agar-overlay methods (Rasoanaivo and
Ratsimamanga-Urverg, 1993). However, the differential diffusion of the bioactive compounds from the TLC plate
to the agar layer make the method unsuitable for certain class of compounds, especially the water-insoluble
types like terpenoids and non-polar compounds (Eioff, 1998). The direct bioautography method allows the
localization of a number of components with significant individual inhibitory activities against the tested
organisms. The characteristic features of this method are its quickness, efficiency, simplicity, high sample
throughput, small test sample size and no sophisticated equipment required. The method is adaptable and
applicable to all extracts that can be separated on TLC, against any organism capable of growing directly on TLC
plate surfaces.
4.6.2. Minimum inhibitory concentration (MIC)
In this investigation, in vitro antimicrobial efficacy of the crude 70% acetone leaf extracts and fractions derived
from 27 plants (13 genera across 9 families) used in South African traditional medicine for treating diarrhoea and
related ailments was quantitatively assessed on the basis of minimum inhibitory concentration (MIC). All the
plants evaluated exhibited varying degree of inhibitory effect against the standard strain of human and animal
pathogenic bacteria (Gram-positive as well as Gram-negative) and clinical isolate of pathogenic fungi. There
have been no specific cut-off values as a reference or standard for categorizing antimicrobial activity of plant
extracts and fractions. In this study, crude extracts and fractions with an MIC value less than 500 ~g/ml were
considered to have good activity and MIC value less than 100 ~g/ml were considered to have significant
75
antimicrobial activity of pharmacological interest according to the criterion by Rios and Recio (2005). A lower MIC
values indicated high effectiveness of the compound as antimicrobial agent as little quantity which may be below
toxicity level of the extracts can be applied without being harmful to the host.
Crude extracts of 4 out 27 had an MIC less than a 100 1-Jg/ml (Bauhinia bowkeri, Bauhinia ga/pinii, and
Combretum padoides) against E. faeca/is and Bauhinia petersiana against P. aeruginosa (78 1-Jg/ml). However,
the antimicrobial activities were potentiated in the fractions with the non-polar fractions of hexane (MIC ranges
from 19 to 312 1-Jg/ml) and dichloromethane (MIC ranges from 19 to 625 1-Jg/ml) enriched with terpenoids
exhibiting more broad-based potency compared with the polar fractions of ethyl acetate (MIC ranges from 39 to
1250 1-Jg/ml) and butanol (MIC ranges from 39 to <2500 1-Jg/ml). The MIC value less than 100 1-Jg/ml obtained for
some fractions were significant although much higher than that of the control antibiotic (gentamicin with an MIC
ranged from 0.18 to 1.56 ~g/ml against bacteria and amphotericin B with an MIC ranged from 0.78 to 6.25 ~g/ml
against fungi).
The water fractions have relatively low antimicrobial activities (MIC ranges from 312 to <2500 1-Jg/ml) except for
the C. vendae with an MIC value 39 1-Jg/ml against E. faecalis and S. aureus. In traditional medicine plant
preparation, water is used as the major extractant. The poor antimicrobial activity of water fractions of most of the
plants indicated that decoction or infusion may be less effective in infectious diseases. These observations are
consistent with most of the findings in other studies.
From the phytochemical evaluation, the crude extracts contain high level of polyphenolic compounds. The
activity of the extracts and polar fractions (ethyl acetate, butanol, and residual), though not exclusive to
polyphenolic compounds only would be expected to correlate to the respective constituents, the structural
configuration, functional groups and possible synergistic effects among the constituents. Members of this class of
compounds are known to have either bacteriostatic or bactericidal properties against most microorganisms
depending on the structure and concentration used. The mechanism of their antimicrobial activity may be related
to their fundamental properties of having the ability to form complex with protein and polysaccharides, thus the
capacity to inactivate microbial adhesions, enzymes, and cell envelope transport protein. The presence and
position of hydroxyl group in the phenolic structure determine and influence the antimicrobial activities of this
class of compounds (Taguri eta/, 2004). Phenolic compounds including tannins and flavonoids were found to
have high antimicrobial activity (Majhenic eta/, 2007; Vaquero eta/, 2007). Some mechanisms of antimicrobial
activity of phenolic compounds includes their ability to denature microbial proteins as surface-active agents
(Sousa eta/, 2006), ability to react with cellular membrane component which impairs both function and integrity
of cells (Raccach, 1984 ), and the reducing property of phenolics can influence the redox potential (Eh) of
microbial growth causing growth inhibition (Jay, 1996).
76

However, two methods are widely used in quantitative evaluation antimicrobial activities of plants extracts: Agar
disc diffusion method (NCCLS, 2002) and serial dilution method (Eioff, 1998). Both methods depend on the
effective solubility of the extracts in the test medium in order to obtain a maximum efficacy against the
organisms. However, some phenolic compounds form complex with proteins and other macromolecules present
in the test medium, therefore, get precipitated. While some extract components especially the non-polar are not
readily soluble in test medium which is more than 90% water in most cases. These factors may at times cause
reduction in the effectiveness of the plant extracts to inhibit microbial growth. The antimicrobial profiles indicated
that the extracts and fractions there from were active against Gram-positive and Gram negative bacteria, yeast
and mould fungi. The susceptibility of both bacteria and fungi to the extracts may be indicative of the presence of
broad-based bioactive compounds or general metabolic toxins.
Pathogenic enteric microorganisms present in contaminated food and water produces enterotoxins or irritants
that cause intestinal disorder such as diarrhoea. In vitro antimicrobial assays against standard strains of the
intestinal pathogens using the polyphenolic-rich crude extracts and fractions have demonstrated various degree
of microbial growth inhibition. The plant extracts and fractions investigated have moderate to good activities
against diarrhoeal standard strains such as E. coli, S. aureus and C. albicans and P. aeruginosa, thus validating
their use in traditional medicine for treatment of diarrhoea symptoms. The mechanisms involved in diarrhoea
symptoms are multifaceted and interwoven. It is, therefore, possible that extracts and fractions with moderate
antimicrobial activities could still have good antidiarrhoeal effects by elaborating other biological activities such
as antioxidant, anti-inflammatory, antisecretory, binding of toxins, and antimotility effects on the gastrointestinal
tract.
4.7. Conclusion
In infectious diarrhoea many bacteria, protozoa, virus and parasites have been implicated as causative agents.
These agents include Vibrio cholera, Escherichia coli, Shigella dysenteriae, Bacillus cereus, Stapylococcus
aureus, Clostridium difficile, Entamoeba histolytica, Salmonella typhi and Giardia Iamblia. Some viruses such as
Rotavirus and adenovirus have also been implicated as causative agent of diarrheal diseases. The infectious
mechanisms of the pathogenic strains of the enteric microbes include microbial adhesion and attachment,
localized effacement of the epithelial mucosa lining, production and elaboration of secretory enterotoxins,
production of cell-destroying cytotoxins, and direct epithelial cell invasion.
In this study, the emphases were on E, coli, S. aureus, E. faecalis, and C. albicans as diarrhoeal pathogens.
Seven virulence groups of diarrheagenic E. coli, namely enteropathogenic E. coli (EPEC), enterohaemorrhagic
E. coli (EHEC), enteroinvasive E. coli (EIEC), enterotoxigenic E. coli (ETEC), enteroaggregative E. coli
(EAggEC), diarrhoea-associated haemolytic E. coli (DHEC) and cytolethal distending toxin (CDT)-producing E.
77

coli have been classified (Clarke, 2001 ). On a global scale EPEC, EHEC, ETEC and EIEC are the most
important diarrhoeal agents accounting for 4-8%, 0-1%, 12-20% and 0-2% respectively in terms of total episodes
(Bhan, 2000). The virulence mechanisms of ETEC, EHEC, S. aureus, E. faecalis and some strains of V. cholerae
include production of endotoxin, cytotoxins and reactive species. The use of antimicrobial therapy with
microbicidal or microbiostatic mechanisms may not be effective in the diarrhoea cases involving these organisms
because the toxins if already present in contaminated food or water does not need the pathogens to exert
activity. Therefore, non-antimicrobial therapy may be required in such cases but antitoxins which can antagonize
toxin and receptor interactions. More work is needed in evaluating the antitoxin and antiadhesion of medicinal
plant extracts as other forms anti-infectious mechanisms.
Many of the plant extracts and fractions used have good activities especially the non-polar fractions of hexane
and dichloromethane against the pathogens tested, and this may explain the traditional use of these medicinal
plants.
Considering importance of oxidative burst such as ROS/RNS in the immune mechanisms and possible
consequences of cellular damages, if the resultant oxidative stress is not resolved by the endogenous
antioxidant system, the antioxidant potentials of the plants will be evaluated in the next chapter.
78