chapter seven - an-najah staff ppt1.pdfchapter seven 6/14/2010 nabil dmaiadi 1. money and network...
TRANSCRIPT

Chapter SevenChapter Seven
6/14/2010 1Nabil Dmaiadi

Money and Network SchedulesMoney and Network Schedules
2
Money and Network SchedulesMoney and Network Schedules
6/14/2010 Nabil Dmaiadi

Money and network schedules:
n ReminderReminder, cost was one of the elements of project
constraints triangle ( COST, TIME & QUALITY).
n An effective management tries to minimize and integrate
the above mentioned elements.
n CPM provides a mean for relating time and money.
3Nabil Dmaiadi6/14/2010

Money and network schedules (cont.):
n The application of resources to a project (materials,
manpower and machinery) related to another resource
which is MONEYMONEY.
n The value of the resources for each activity represents a
component of project cost.
4Nabil Dmaiadi6/14/2010
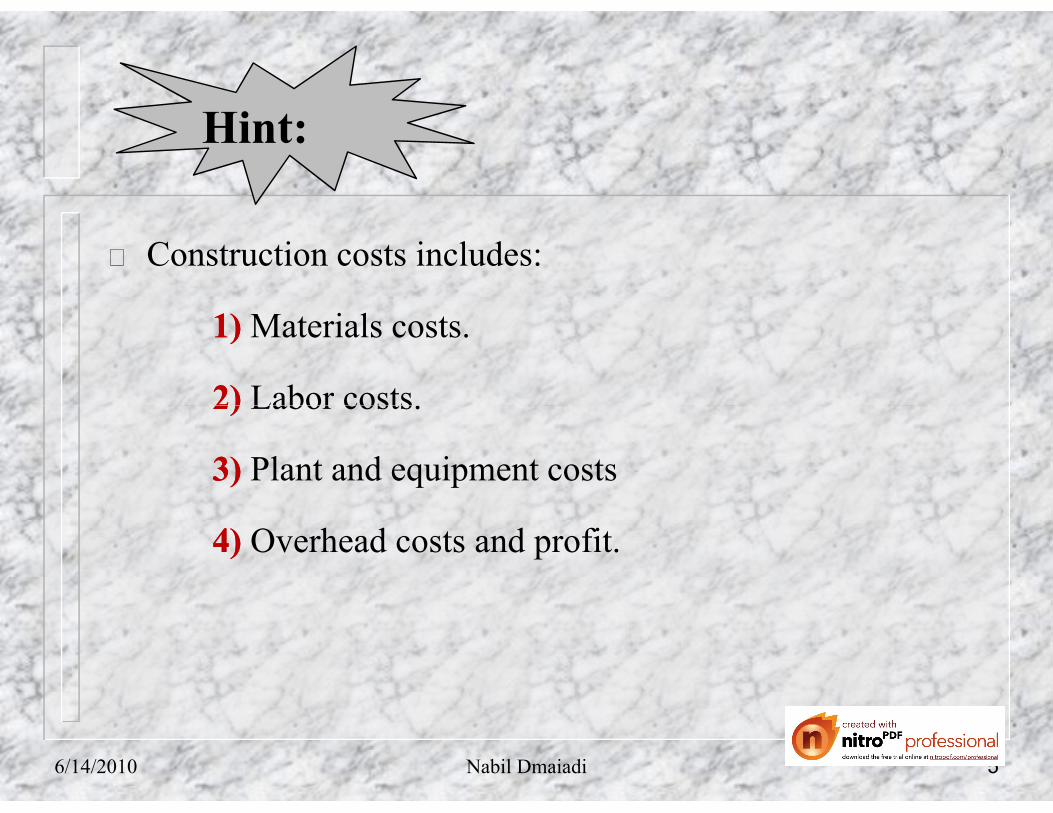
� Construction costs includes:
11)) Materials costs.
22)) Labor costs.
Hint:
22)) Labor costs.
33)) Plant and equipment costs
44)) Overhead costs and profit.
5Nabil Dmaiadi6/14/2010

4
6
3
2
A
B
C
F
E
I
K
11
13 0 6 19
17
10
16 6 6 22
16
6
10 0 6 16
12 13
16 6 6 22
19
Dur.ES
EF FF TF LF
LS
5 5
8
2
2
3
6
D
H
G
J
1
6 0 0 6
1 6
11 0 0 11
6
6
8 0 6 14
12
8
14 8 8 22
16
11
14 0 0 14
11
14
22 0 0 22
14
22
24 0 0 24
22
Name
6Nabil Dmaiadi6/14/2010

Activities cost:
Activity Duration ES TF Cost ( $)
A 5 1 0 650
C 5 6 0 1300
D 2 6 6 400
B 4 6 6 1450B 4 6 6 1450
H 6 8 8 500
E 6 10 6 1100
G 3 11 0 600
F 2 11 6 350
I 3 13 6 1000
J 8 14 0 1300
K 2 22 0 200
7Nabil Dmaiadi6/14/2010

2 4 6 8 10 12 14 16 18 20TimeTime
A
C
H
D
E
200
150 100 200 200
200 200 100
200 200
50 100 150
22 24
100 200 100 50
150
200 50 50
150 100 150
B 9H 9H 9H 9H100250 300 100
Total Total costcost
200 100 200 100 50 550550 400 500 750 450 600 300 350 150 200 100100150
F
E 200 200 100
150
I
J
K
200
100
150 100 150
100
100100
100 150 200 100100 150 100
100 100
100 100 100
G 200 200 200
350
8Nabil Dmaiadi6/14/2010

500
600
700
800
Total Total costcost
200 100 200 100 50 550550 400 500 750 450 600 300 350 150 200 100100150 100 100 100350
100
200
300
400
TimeTime2 4 6 8 10 12 14 16 18 20 22 24
9Nabil Dmaiadi6/14/2010
Overtrading:
�� OvertradingOvertrading::
arises when the current liabilities of a company exceed the
current assets, even though the business is solvent.current assets, even though the business is solvent.
10Nabil Dmaiadi6/14/2010

2 4 6 8 10 12 14 16 18 20TimeTime
A
C
H
D
E
200
150 100 200 200
200 200 100
200 200
50 100 150
22 24
100 200 100 50
150
200 50 50
150 100 150
B 9H 9H 9H 9H100250 300 100
Total Total costcost
200 100 200 100 50 550550 400 500 750 450 600 300 350 150 200 100100150
F
E 200 200 100
150
I
J
K
200
100
150 100 150
100
100100
100 150 200 100100 150 100
100 100
100 100 100
G 200 200 200
350
11Nabil Dmaiadi6/14/2010

36004000
Cash Flow Diagram
Total cost
44004800
5200560060006400
200 100 200 100 50 550550 400 500 750 450 600 300 350 150 200 100100150 100 100 100350
200 300 500 600 650 1550 21002500 30003750 4200 4800 51005450 5600 580059006000 615062506350 64501000Com. cost
400800
12001600
200024002800
3200
Time
2 4 6 8 10 12 14 16 18 20 22 24
3600
12Nabil Dmaiadi6/14/2010

The time value of money:
� Is an estimate of the cost to construct a specific project,
this include an acceptable allowance for profit and the
successful submittal of the lowest bid to an owner resulting
in the award of the contract.
� Ideal case, if the contractor estimated the cost of the
project exactly, then the amount of profit realized will be
exactly as originally allowed.13Nabil Dmaiadi6/14/2010

The time value of money (cont.):
� Is the value of the profit actually received the same aswas originally anticipated ?
� Time changes the value of the profit realized. Because ofinflation and the delay in the actual receipt of all revenuesthe profit once realized will no longer permit the contractorto purchase the same value of goods as when the bid wasoriginally submitted contractors are paid only after workhas been performed, this lag or delay in the receipts ofrevenues is often a considerable time after the costs ofconstruction are actually paid.
14Nabil Dmaiadi6/14/2010
Interest rates:
� If inflation was zero and the interest rate was zero ,it would
be simple matter to assess profitability.
� If inflation is an extremely low level, interest rate are� If inflation is an extremely low level, interest rate are
rarely at a level that they can be ignored.
� Contractors must be careful in selecting the appropriate
interest rate to use for the analysis of positive and negative
cash flow.
15Nabil Dmaiadi6/14/2010

Contractor cash disbursements:
� Over all interest rate for deficit funds flow should reflectthe cost of borrowing the money or If no money isborrowed the interest rate , should reflect the value ofopportunities.
� That are forgone for internal funds that are used to meet� That are forgone for internal funds that are used to meetfinancial obligations.
� The each flow analysis of a project entails an examinationof the disbursement of funds and the receipt of funds.
� Their timing has a direct impact on the amount of cashavailable or the deficit to be realized at differing timesduring the construction of a project.
16Nabil Dmaiadi6/14/2010

The disbursement of funds:
11-- LaborLabor::
� The cost of labor an a project can be substantial a rough
estimate put labor at approximately one- third of the total
cost of a construction project.
� However this is largely depending on the type of project
and the amount of work subcontracted.
� The timing of the disbursement of funds for labor is largely
dictated by law.17Nabil Dmaiadi6/14/2010

The disbursements of funds (cont.):
� Hourly wages are paid weekly the primary difference
between companies might be simply the day of the week
on which the wages are actually paid ,otherwise there are
few differences the wage rates and any overtime pay
should be included in the estimate as this in formation.
� Must be known prior to submitting the paid the time of the
payment of these wages is of particular concerns in the
cash flow analysis .
18Nabil Dmaiadi6/14/2010

The disbursements of funds (cont.):
� How is cash flow impacted when the equipment is owned
by the company ?
� A piece of equipment that has been purchased by the
company , without any outstanding loans does adverselycompany , without any outstanding loans does adversely
impact the cash flow of a company.
� However , the impact an cash flow of a company may be
different than the impact on the cash flow on project
because the company and the project are not viewed as
being are and the same .19Nabil Dmaiadi6/14/2010

The disbursements of funds (cont.):
22-- EquipmentEquipment::
� Equipment used on project will generally fall into one ofthe categories:
a- Equipment owned by two company .
b- Equipment leased or rented by the company .b- Equipment leased or rented by the company .
� For the cash flow analysis ,the type of ownership doesn’tsubstantially after the result, it is common that leasepayments be made or monthly basis. Rented equipment ispaid for on a monthly basis. Unless the equipment is rentedfor shorter periods such as by the day or by the week.
20Nabil Dmaiadi6/14/2010

The disbursements of funds (cont.):
� For cash flow purpose , payment for renting the company
owned equipment is generally an internal funds transfer
that occurs at the end of each month these as for as the
disbursement of funds is concerned , company owned
equipment is often similar to outside – owned equipment.
21Nabil Dmaiadi6/14/2010

The disbursements of funds (cont.):
33-- MaterialsMaterials::
� The cost of materials in corporate in a construction project
together with the labor and equipment costs ,continue the
bulk of the costs of construction.
� How are payments made for material ?
Materials are typically ordered from suppliers through
purchase orders or purchase agreements it is common for
materials to be delivered to the construction site before.
22Nabil Dmaiadi6/14/2010

The disbursements of funds (cont.):
� The contractor has any obligation to pay for them.
� A shortly, after the materials are delivered to the site
however the contractor is generally expected to pay for
them the actual payment arrangement vary between
supplier and these differences should be clearly understood.
� Materials ,are expected to be paid for approximately a
month from the time of delivery.
23Nabil Dmaiadi6/14/2010

The disbursements of funds (cont.):
44-- Sub contractors: Sub contractors:
� when a particular task requires specialized skills, certain
work items might be sub contracted.
� Sub contractors typically request payment for services
rendered on a monthly basis.
“pay when paid’’ provision essentially assure, the general
contractors that they will .not suffer a negative cash flow
on the subcontracted work.
24Nabil Dmaiadi6/14/2010

The disbursements of funds (cont.):
� It is also typical, for general contractors to include a
provision in the sub contractor agreements that payment
will be made to the subcontractors only after the general
contractor has received payment for that work from owner.
� In addition, the general contractor will commonly with
hold a portion of the payments due to the subcontractor as
retainage stated as a percent, which is typically the same as
retainage with held from the general contractor by the
owner. 25Nabil Dmaiadi6/14/2010

The disbursements of funds (cont.):
55-- Others : Others : � The general contractor, should have a clear under standing
of all expenditures to be incurred on a project this includesthe timing of the payments for these items.
� For example, insurance premiums, surety lees variouspermits and mobilization occur early in a project.
� A careful analysis should be made of all overhead items,whether project or have-office over head to determine thetiming of payments for these items.
26Nabil Dmaiadi6/14/2010

Contract provisions that impact cashflow:� The contractor must recognize that the cash flow to be
realized on a particular project will be dictated to some
extent by the contract.
� This is particularly true for the timing of the receipt of
revenues so it is important that the contract documents be
examined closely to fully under stand how the contracted
provisions will impact the cash flow on project.
27Nabil Dmaiadi6/14/2010

Contract provisions that impact cashflow (cont.):11-- Payment schedule: Payment schedule: � The type of contract dictates the general nature of payment
schedule.
ee..gg,, on a unit price contract the various pay items areenumerated in the bid itself. The list of pay items gives aenumerated in the bid itself. The list of pay items gives aclear idea of the information needed to conduct a cash flowanalysis.
� Other items that are not always pay items in a contractinclude form work, scaffolding and shoring these itemsmay be essential to deliver project, but do not, inthemselves impact any value to the project.
28Nabil Dmaiadi6/14/2010
Contract provisions that impact cashflow (cont.):22-- Retainage:Retainage:
� It is common in the construction industry for the owner to
withhold a stated percentage of the funds earned by the
contractor as retainage.contractor as retainage.
� The common retainage amount seems (10%).
� Obviously retention has an adverse impact on the
contractors cash flow.
29Nabil Dmaiadi6/14/2010

Contract provisions that impact cashflow (cont.):33-- Material :Material :� Long-lead time items may be purchased early to ensure
that they will be available when needed.
� The contractor should be examined to determine if� The contractor should be examined to determine ifpayment will be made for materials that are properly storedon site (or else where) or if payment will be made onlyupon installation .
� Of course, the storage of some materials may use upvaluable space and require regular monitoring. Thesefactors must be taken into consideration.
30Nabil Dmaiadi6/14/2010
Contract provisions that impact cashflow (cont.):44-- Mobilization :Mobilization :� It can be a large cost item and the contract wording for the
programs mobilization should be closely examined.
55-- MonthlyMonthly paymentpayment ::� The impact on cash flow is more severe if the contractor is
not paid until the 20th of the following month.
66-- FinalFinal paymentspayments::� It is common to be made from (1-3) months after
substantial completion. Generally its not made until afterthe punch list items have all been completed.
31Nabil Dmaiadi6/14/2010
Owner policies and practices thatimpact cash flow:
� Only experience or trade talk can help a contractor gain in
sight about an owner’s on-site practices.
� Obviously the owner actions either can be adverse to a
contractor or they might be in the contractors favor.
� The extent of detail required varies for different parties as
different purposes and being served.
32Nabil Dmaiadi6/14/2010

The Cash-Flow Analysis:
� Is a very meaningful term to most contracts who must be
sensitive to the issue of cash flow if they are to service.
� Cash flow analysis is an investigation of a project in wish� Cash flow analysis is an investigation of a project in wish
the focus is on the flow of money (including expenditures
and revenues of money).
� It consists of a detailed examination of the disbursement of
funds and the receipt of revenues.
33Nabil Dmaiadi6/14/2010

The Cash-Flow Analysis (cont.):
� Two major reasons for conducting a cash flow analysis:
11-- It revels surplus funds are available during a project or ifa negative cash positive will occurring during construction.
22-- It helps in establishing a appropriate marl up on a bid.
� Other parties will also how an interest in such analysis
(such as Bankers, sureties, insurance carriers, equipment
dealers, credit-reporting agencies, clients (owners),
business partners).
34Nabil Dmaiadi6/14/2010

Negative cash position:
� Negative cash position means that the revenues obtained
from a project insufficient to meet the financial obligations
(expenditures) of the project.
� In this case other fund from the company or from outside
sources must be used.
35Nabil Dmaiadi6/14/2010

Positive cash position:
� Positive cash position means that the revenues obtained
from a project exceed the financial obligations
(expenditures) of the project.
� In this case surplus (extra) fund available with the
contractor.
� And the contractor may invest this surplus funds for short
duration.
36Nabil Dmaiadi6/14/2010

The present worth of the cash flow:
� The simplest analysis is to convert the value of all funds toan equivalent present worth amount at the time of bidsubmittal or contractor award .
� This can be done by taking the present worth of thedifference between the anticipated funds receipts andanticipated disbursements.
� The analysis can be performed effectively if the flow of thefunds is accurately predicted and if an appropriate interestis utilized.
37Nabil Dmaiadi6/14/2010

The present worth of the cash flow(cont.):
� The analysis could be carried on further to include the
influence of varying the lines when the monthly payments
are received
� It is common for a general contractors profit margin to be
about (2-3)% .
� It is obvious the cost flow analysis can have a significant
impact on the decisions of a company.
38Nabil Dmaiadi6/14/2010

Cumu.Expenditures & Revenues
Time (Months) Cash-Flow Curve for revenue and expenditures
39Nabil Dmaiadi6/14/2010

Time-cost trade-off:
� It is possible that the originally project duration is notnecessarily the least time solution nor the least costschedule for the project in spite of the fact that eachactivity within the project was originally planed to be donein the most efficient (list cost manner).in the most efficient (list cost manner).
� Project cost elements:
11-- DirectDirect costscosts:
Related to putting the facility components in place.They represent the resources used by an activity (material,labor and equipment).
40Nabil Dmaiadi6/14/2010

Time-cost trade-off (cont.):
� The costs of materials and the cost of the subcontractor
work tend to be relatively fixed or not subject to
considerable variance.
� Over estimates on the productivity will result in a longer
duration to complete the project while under estimated the
costs will be below budget for that work item and the time
to complete the activity will also be reduced.
41Nabil Dmaiadi6/14/2010

Time-cost trade-off (cont.):
22-- Indirect Indirect job costs (job overheadjob costs (job overhead):):
� Costs that could not be attributed to a specific work item.
(such as, site offices, superintendents, security fence &
etc).
� These costs are generally incurred whether or not
productive work achieved.
� Longer project duration will result in higher indirect costs.
42Nabil Dmaiadi6/14/2010

Time-cost trade-off (cont.):
33-- Operating Operating Overhead costs (company overhead): Overhead costs (company overhead):
� If the cost cannot be attributed to any specific job, they are
operating overhead costs, costs of running business (head
office costs, communications & etc).
� These costs continue as long as the company exists even
one project is running.
43Nabil Dmaiadi6/14/2010

Time-cost trade-off (cont.):
44-- Profit:Profit:
� As with over head, profit is company–specific andrepresents the access monies earned by a firm over it’stotal costs.
� It is provide investors with return on their investment inthe company.
� It is necessary to consider a profit as a “cost” of a project.
44Nabil Dmaiadi6/14/2010

Time-cost trade-off (cont.):
� It is necessary to look of combination of project costs to
determined the over all cost of a project.
� By examining further the relationship between time
(e.g: project & activity duration and costs, it can be
determined how decision about one of the duration) about
one of these consideration relate to the other.
45Nabil Dmaiadi6/14/2010

Time-cost trade-off (cont.):
� A major issue in dealing with the trade–offs between timeand cost in determining exactly how much additionalmoney is necessary to decrease an activity’s duration.
� The specific problem is to determine the cost required toshorten an activity’s duration by one day.
� This cost per day then represents the slope of the curve thatplots the cost of an activity’s against the duration of theactivity.
46Nabil Dmaiadi6/14/2010

Time-cost trade-off (cont.):
� The shape of the time-cost relationship for activities varies
depending on the nature of the means required to make the
time reductions.
� The straight line relationship between activity duration and
cost will be assumed when project compression occurs.
47Nabil Dmaiadi6/14/2010

Time-cost trade-off (cont.):
48Nabil Dmaiadi6/14/2010

Logic of Time-Cost Trade-Off:
Assumption # (Assumption # (11):):
� Increasing or decreasing an activity’s duration will lead to increased direct costs for that activity. increased direct costs for that activity.
Assumption # (Assumption # (22): ):
� Decreasing a project’s duration will lead to lower indirect costs.
49Nabil Dmaiadi6/14/2010

General relation of direct costs to project duration Direct Costs
Project duration
50Nabil Dmaiadi6/14/2010

General relation of indirect costs to project duration Indirect Costs
Project duration
51Nabil Dmaiadi6/14/2010

Logic of Time-Cost Trade-Off (cont.):
Assumption # (Assumption # (33):):� A project’s duration can be decreased by decreasing the
duration of one or more critical activities on the criticalpath.
AssumptionAssumption ## ((44))::� Decreasing a project’s duration may increase or decrease
the total cost of a project depending upon whether theadditional direct costs required to decrease the activityduration are greater or less than indirect costs savings ofdecreasing the project’s duration.
52Nabil Dmaiadi6/14/2010

General relation of project costs to project duration
Project Costs
Total project costs
Project duration
Direct costs
indirect costs
53Nabil Dmaiadi6/14/2010

Logic of Time-Cost Trade-Off
In performing time-cost trade-off analysis it is necessary to determine the cost of decreasing the critical path by one day.
Naturally, the critical activity with the least direct cost slope (lowest additional cost per day of shortening )will be selected first to minimize the cost of shortening the project.
Nabil Dmaiadi 546/14/2010
A
1 11
D
9 82
F
8 1711 1 2525
B
9 2
110011
2
G
5 11
160016
11 9 16
250025
16
9H, 450 $ 5H, 250 $ 8H, 450 $
I
J
Nabil Dmaiadi 55
1 1
2002
1 9 8
176011
2 8 17
256019
11 1 25
260026
25
C
5 10
15807
2
E
4 15
198011
7 6 19
258817
11
H
Dur.ES
EF FF TF LF
LS
Resources
Activity desc.
8H, 200 $ 9H, 900 $ 5H, 1200 $ 4H, 1500 $
2H, 900 $4H, 400 $7H, 500 $
6/14/2010

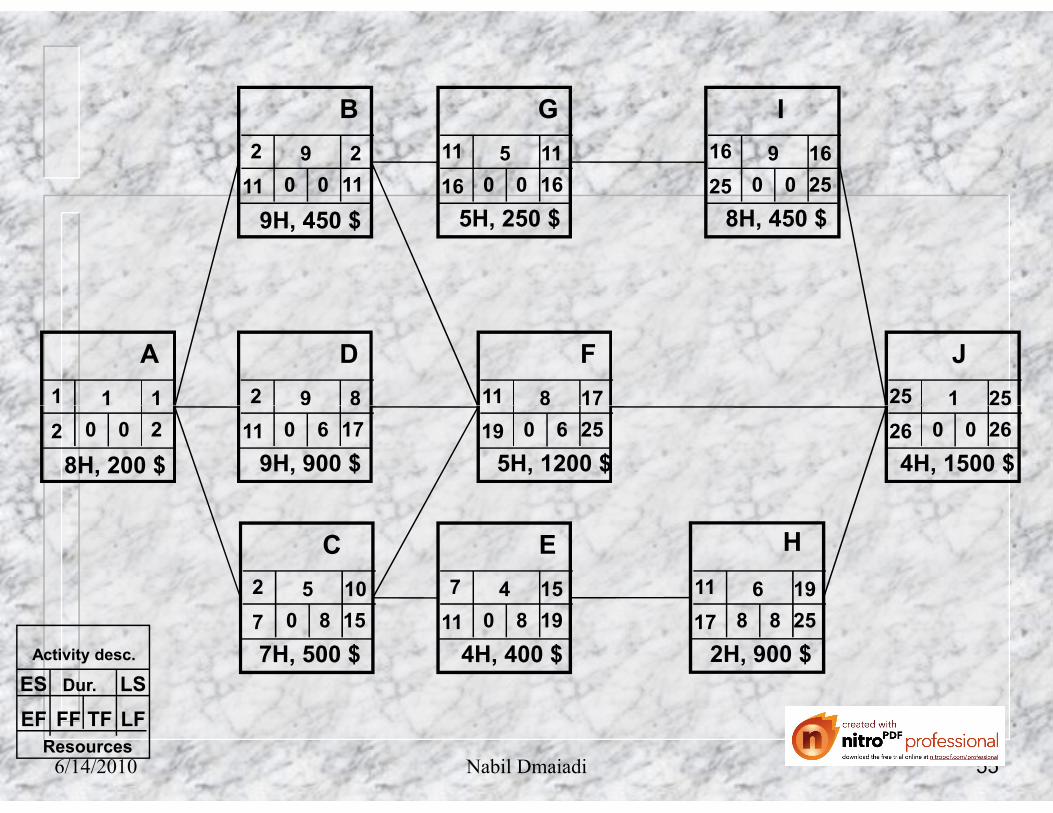
Activities Sort
Activity Duration LS TF Resource Cost ($)unit
A 1 1 0 8 H 200B 9 2 0 9 H 450D 9 8 6 9 H 900C 5 10 8 7 H 500
Nabil Dmaiadi 56
C 5 10 8 7 H 500G 5 11 0 5 H 250E 4 15 8 4 H 400I 9 16 0 8 H 450F 8 17 6 5 H 1200H 6 19 8 2 H 900J 1 25 0 4 H 1500
Activity sort with LS time as Major sort & TF and duration as Minor Sorts
6/14/2010

Time-Cost Trade-off
The previous analysis suggests that in performing Time-
Cost Trade-off analysis, it is necessary to determine the
cost of decreasing the critical path by one time unit (day,
month & etc).
Nabil Dmaiadi 57
month & etc).
Usually, select the activity with least shortening costs.
(lowest additional cost per day of shortening) to minimize
the additional costs of shortening.
6/14/2010

Reducing Project Duration
As the critical path of the network decreased, some non-
critical activities lose some amount of their total float.
Nabil Dmaiadi 58
A
B
C
D
F
6/14/2010

Reducing Project Duration
Thus, the extent to which an activity can be shortened and
still has the effect of shortening the project is limited by
the amount of total float exists in the parallel activities.
Nabil Dmaiadi 59
A
B
C
D
F
6/14/2010

Reducing Project Duration
As the projects duration decreases, the number of critical
paths through the network increases. `
Nabil Dmaiadi 60
A
B
C
D
F
6/14/2010

Reducing Project Duration
If more than one critical path exist, it is necessary to
reduce all critical paths in the network simultaneously,
`which becomes expensive.
Nabil Dmaiadi 61
A
B
C
D
F
6/14/2010

Four Different Solutions for EachNetwork The schedule can be viewed in several different ways in
order to satisfy the client. A client may with to perform the project in the least cost, or in the least time. Or in any manner satisfies him.
All Normal: the original network and activity duration result in all normal solution, based on each activity being performed in its “NORMAL” least cost manner.
Remember, it is not necessarily the least cost or least time solution to schedule a project.
Nabil Dmaiadi 626/14/2010

Four Different Solutions for EachNetwork
2) Least Cost: considering both direct and indirect costs, it
may be possible to find a project duration that minimizes
these total costs. By paying more to decrease one or more
critical activity (direct cost) and save greater indirect costs.
(Means that the result will be total cost saving.)
Nabil Dmaiadi 636/14/2010

General relation of project costs to project duration
Project Costs
Total project costs
Nabil Dmaiadi64Project duration
Direct costs
indirect costs
6/14/2010

Four Different Solutions for EachNetwork
3) Least Time: A project can be shortened beyond its
least cost duration. Until a point reached where no
activities in the critical path can be physically shortened
regardless of how many resources are applied. (results in
higher costs)
Nabil Dmaiadi 656/14/2010

Four Different Solutions for EachNetwork
4) All crash: in this solution, every activity has been
shortened as much as physically possible. Its duration shortened as much as physically possible. Its duration
the same as the least time solution, but its costs greater.
Because the direct cost increases without further
reductions in the indirect costs.
Nabil Dmaiadi 666/14/2010
Four Different Solutions for EachNetwork
All crash
A fully crashed schedule occurs when all activities
shortened to their shortest possible duration.
It is not an efficient approach since some non-critical
activities will be shortened without having any
shortening influence on the project duration.
Nabil Dmaiadi 676/14/2010

It wouldn’t be cost effective to randomly select anyactivity for shortening, this should be done in a rationalmanner.
Logically Reducing Project duration:
Nabil Dmaiadi
To begin time-cost trade-off in a systematic fashion Basiccomputations should be done :
a. First compute ESD & EFD for each activities .
b. Compute the link lag value, for each link betweenactivities ( LAGAB = ESDB – EFDA ).
6/14/2010 68

It should be clear that there is at least one path between the
first activity and last activity in the network for which all
the link lag values are 0.(The critical path).(other solution
can be derived by computing TF).
Logically Reducing Project duration:
Nabil Dmaiadi
can be derived by computing TF).
If the project is to be shortened, it is imperative that the
duration of one of the activities on the critical path is to be
shortened .
6/14/2010 69

Logically Reducing Project duration:
The logical choice for the first activity to be shorten, is the
activity which has the lowest incremental cost for making
duration reductions.
The selection of the activity to shorten must be based
solely on the minimum cost per day and not the cost of the
cycle.
70Nabil Dmaiadi6/14/2010

7 73
A
B
C F
E H
L9
9
12
2
9
16
23
23
J16
0
0 0
00
0 4
0
21
9
2
00
3
16
13
44
9
23
16
00
18 23
Reducing Project Duration to shortest possible duration Example:
Nabil Dmaiadi 71
Dur.ES
EF FF TF LF
LS
1 6
3
5
3
7
8
D G K
1
2
2
8
2
5
5
13
9
16
16
19
23
28
516
21
0
0
0
3
0
0
12
4
2
1
00 9
3
11
12
9
70
16
9
00
20
12
73
23
18
22
23
20
44
28
23
00
6/14/2010

Logically reducing Project Duration
In the previous network. Activity (A,B,F,H and L) forming
the critical path.
(The path with zero lag from the first to the last activity in
Nabil Dmaiadi 72
(The path with zero lag from the first to the last activity in
the network).
Any shortening of the project will result in an increase of
the direct cost of the project.
6/14/2010

The table below represents the duration – cost data for a project :
Logically Reducing Project duration:
Activity no.
Normal Duration
Crash Duration
NormalCost ($)
Crash Cost ($)
Days to shorten
Cost per day
A 1 1 800 800 0 -
B 7 4 1000 1600 3 200
C 6 4 300 500 2 100
Nabil Dmaiadi 73
D 3 2 400 800 1 100
E 3 1 100 200 2 50
F 7 5 500 800 2 150
G 8 4 200 1400 4 300
H 7 6 350 600 1 250
J 5 3 700 850 2 75
K 3 2 500 1000 1 500
L 5 4 4500 800 1 350
6/14/2010

Assume the following information exist about the various
activities:
Logically Reducing Project duration:
Activity A B F H L
Nabil Dmaiadi
Cost/day ∞ 200$ 150 250$ 350$
Cannot be shortened At any cost
Least cost activity to shorten
6/14/2010 74
Logically Reducing Project duration:
Without shortening the project will end after 27 days with
a cost of 5300 $. This is the normal duration cost.
Other consideration (such as overhead, liquidated damages
provisions, changes or needs of other project )may make it
desirable to complete the project in a shorter or longer
duration.
2010 756/14/2010 Nabil Dmaiadi

Logically reducing Project Duration
From the previous table, it can be noticed that activity F
has the least incremental shortening cost.( 150 $ per day).
Nabil Dmaiadi 76
E.g. Shortening F for 2 days costs 150 x 2 = 300 $.
Bear in mind, activities for shortening selected based on
cost per day. Not on cycle cost basis.
6/14/2010

Logically reducing Project Duration
How many days activity F could be shortened?
The answer in computing the Network Interaction Limit(NIL).
Nabil Dmaiadi 77
(NIL).
So, reducing activity F by 2 days will affect the link lagvalues of the succeeding activities and TF of parallel
activities.
6/14/2010
Logically reducing Project Duration
This can be determined graphically by drawing a linevertically down through the network. This vertical line willpass through the activity or activities being shorted andthrough any positive link lags that may be in the path of
Nabil Dmaiadi 78
through any positive link lags that may be in the path ofthe line.
A zero value link line can be crossed if it’s value will beincreased by the activity duration, being reduced.
6/14/2010

1 6 5
7 73
5
A
B
C F
E H
L1
2
2
8
9
14
9
12
2
9
14
21
21
26
5
J14
19
0
0
0
0
00
0 2
1
0
2
2
1
00
9
2
00
9
3
11
16
13
42
16
9
00
21
14
00
21
16
22 26
21
00
79Nabil Dmaiadi 79
33 8
D G K2
5
5
13
14
17
0
01
04
10
7
50 18
10
51 21
18
44ES
EF FF TF LF
LSDur
If activity F is shortened the link lag values of E-H & G-K willbe reduced by the same # of days .
6/14/2010

1 6 5
7 73
7
A
B
C F
E H
L1
2
2
8
9
16
9
12
2
9
16
23
23
28
5
J16
21
0
0 0
00
0 4
1
0
2
2
1
00
9
2
00
9
3
11
16
13
44
16
9
00
23
16
00
23
18
22 28
23
00
Nabil Dmaiadi 80
Dur.ES
EF FF TF LF
LS
33 8
D G K
8
2
5
5
13
16
19
0
0
3
04
12
9
70 20
12
73 23
20
44
6/14/2010

1 6 5
7 73
5
A
B
C F
E H
L1
2
2
8
9
14
9
12
2
9
14
21
21
26
5
J14
19
0
0 0
00
0 2
1
0
2
2
1
00
9
2
00
9
3
11
16
13
42
16
9
00
21
14
00
21
16
22 26
21
00
Nabil Dmaiadi 81
Dur.ES
EF FF TF LF
LS
33 8
D G K
2 8
2
5
5
13
14
14
17
2619
0
0
1
04
200 911
10
7
50
1600
18
10
51
2122
21
18
44
2600
6/14/2010

Summary of the first compressioncycle
Cycle
#
Activity to
shorten
Can be shortene
d
NIL Days shortene
d
Cost per day
Cost per
cycle
Total cost
Project duration
0 -- -- -- -- -- -- 5300 28
Nabil Dmaiadi 82
1 F 2 3 2 150 $ 300 $ 5600 26
The point at which one of the link lag values becomes 0 isknown as NIL.By observing activity F it can be shortened by two dayswhich is smallest of the link lag values or the NIL and themax # of days that an activity can be shortened.
6/14/2010

Identifying activities for 2nd
compression cycle:
Activity A B F H L
Nabil Dmaiadi 83
Cost/day ∞ 200$ ∞ 250$ 350$
As no additional critical paths were created when activity Fwas shortened by tow days the same activities are still underconsideration. As is readily observable activity should now beshortened.
6/14/2010

7 73
A
B
C F
E H
L
9
12
2
9
14
21
J
0
0 0
00
0 2
0
2
9
2
00 16
13
42 21
14
00
Nabil Dmaiadi 84
Dur.ES
EF FF TF LF
LS
1 6
3
5
3
5
8
D G K
1
2
2
8
2
5
5
13
9
14
14
17
21
26
514
19
0
0
0
1
0
0
1
2
4
2
1
00 9
3
11
10
7
50
16
9
00
18
10
51
21
16
22
21
18
44
26
21
00
6/14/2010

6 73
A
B
C F
E H
L
8
11
2
8
13
20
J
0
0 0
00
0 2
0
2
9
2
00 16
13
42 20
13
00
Nabil Dmaiadi 85
Dur.ES
EF FF TF LF
LS
1 6
3
5
3
5
8
D G K
1
2
2
8
2
5
5
13
8
13
13
16
20
25
513
18
0
0
0
0
0
0
0
2
4
2
1
00 8
2
00
9
6
40
13
8
00
17
9
40
20
15
22
20
17
44
25
20
00
6/14/2010

Identifying activities for 2nd
compression cycle:
Activity B can be shortened a total at 3 days at a cost of$200 per day. This is the lowest cost activity to shorten .The line drawn through the activity B and none zero linklag values shown that the NIL is one day. Activity B is
Nabil Dmaiadi 86
lag values shown that the NIL is one day. Activity B isshortened one day. Link lag values for C-F & G-K becomezero.
Always examine the number of days that an activity can beshortened and the number of days in the NIL ad select thesmallest of these two value.
6/14/2010

Summary of the 2nd compressioncycle
Cycle
#
Activity to
shorten
Can be shortene
d
NIL Days shortene
d
Cost per day
Cost per
cycle
Total cost
Project duration
0 -- -- -- -- -- -- 5300 28
Nabil Dmaiadi 87
0 -- -- -- -- -- -- 5300 28
1 F 2 3 2 150 $ 300 $ 5600 26
2 B 3 1 1 200 200 5800 25
6/14/2010

Identifying activities for 2nd
compression cycle:
The new project duration is 24 days and the cost of
compression is $5800.This last day of compression was
Nabil Dmaiadi 88
compression is $5800.This last day of compression was
achieved at a cost of $200 per day.
Note that activity C is now additional critical activity and
link lag value of G-K is 0.
6/14/2010

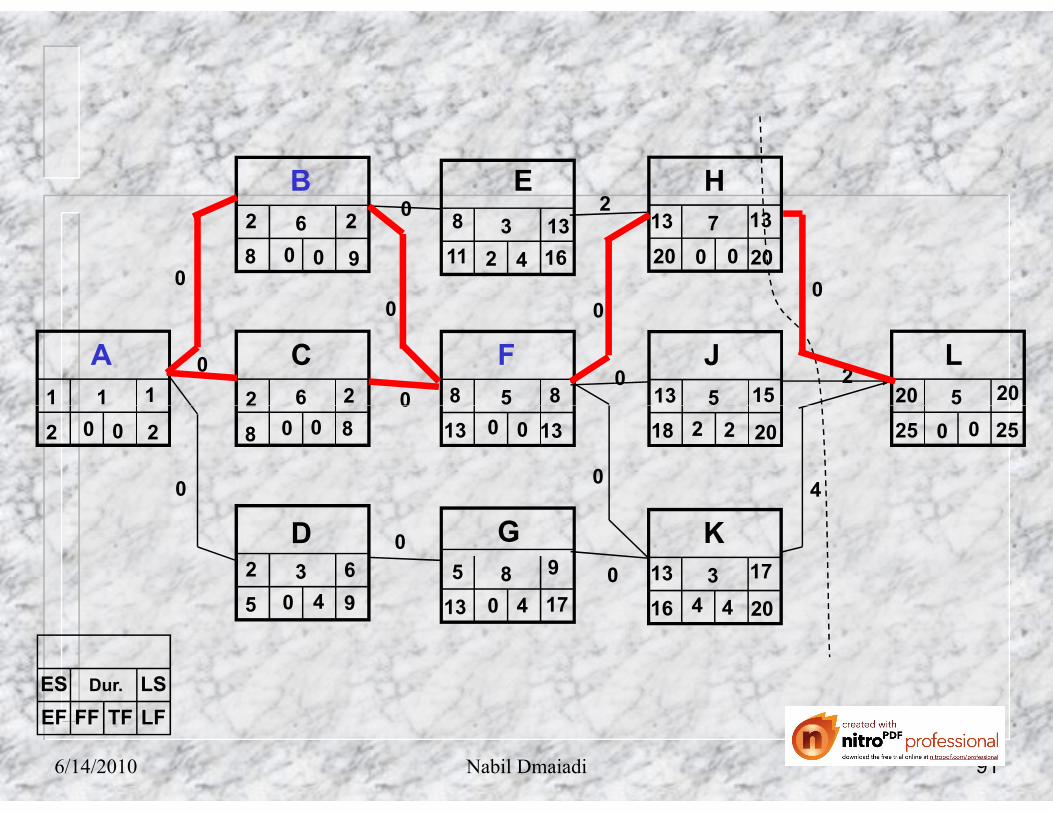
Identifying activities for 2nd
compression cycle:
To further reduce project duration consideration must be
given to shortening activities B & C (jointly), activity H or
activity L in this case, the decision is based solely on costs.
Activity H is selected for shortening.
Nabil Dmaiadi 89
Activity H is selected for shortening.
The NIL for shortening activity H is two days (link lag
value of J-L) but activity H can be shortened only one day,
so activity H will be shortened by one day. The project
duration is now 23 days and the cost is $6050.
6/14/2010

Identifying activities for 2nd
compression cycle:
After activity H is shortened by one day , note that link no
link lag values become 0 after step 3.link lag values become 0 after step 3.
The next iteration of time compression in the network
considers activity B & C (together) and activity L.
906/14/2010 Nabil Dmaiadi
1 6 5
6 73
5
A
B
C F
E H
L1 2 8
8
11
2
8
13
20
205
J13
0
00
00
0 2
0
0
21
9
2
00
2
16
13
42
8
20
13
00
15 20
Nabil Dmaiadi 91
Dur.ES
EF FF TF LF
LS
1 6
3
5
3
5
8
D G K
1
2
2
8
2
5
5
13
8
13
13
16
20
25
513
18
0
0
0
0
0
4
2
1
00 8
2
00
9
6
40
13
8
00
17
9
40
20
15
22
20
17
44
2500
6/14/2010

1 6 5
6 63
5
A
B
C F
E H
L1 2 8
8
11
2
8
13
19
195
J13
0
0 0
00
0 2
0
0
11
8
2
00
2
13
10
22
8
19
13
00
14 19
Nabil Dmaiadi 92
Dur.ES
EF FF TF LF
LS
33 8
D G K
2 8
2
5
5
13
13
13
16
2418
0
0
0
0
0
3
200 800
8
5
30
1300
16
8
30
1911
19
16
33
2400
6/14/2010
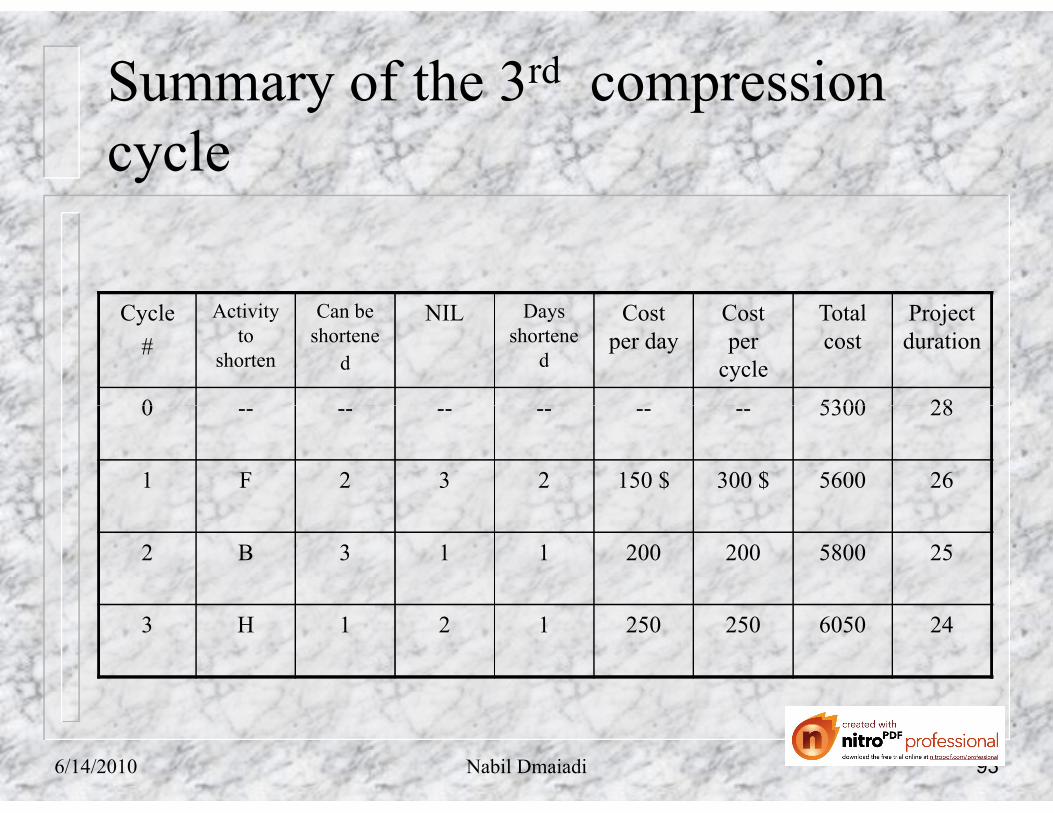
Summary of the 3rd compressioncycle
Cycle
#
Activity to
shorten
Can be shortene
d
NIL Days shortene
d
Cost per day
Cost per
cycle
Total cost
Project duration
0 -- -- -- -- -- -- 5300 28
Nabil Dmaiadi 93
0 -- -- -- -- -- -- 5300 28
1 F 2 3 2 150 $ 300 $ 5600 26
2 B 3 1 1 200 200 5800 25
3 H 1 2 1 250 250 6050 24
6/14/2010

Identifying activities for 3rd
compression cycle
Activity A B,C F H L
∞ ∞
Nabil Dmaiadi 94
Cost/day ∞ 300 ∞ 250$ 350$
6/14/2010

Identifying activities for 4th
compression cycle
Activity A B,C F H L
∞ ∞ ∞
Nabil Dmaiadi 95
Cost/day ∞ 300 ∞ ∞ 350$
6/14/2010

Identifying activities for 4th
compression cycle
The least costly options is to shorten activities B&C. note
that if B or only C were to be shortened. The project
duration would remain the same.
When activity B&C are jointly shortened, the section cut in
the network passes through. Link line K-L and link line F-
K the NIL can now be determined. To shorten activity
B&C, the NIL is 3. The link lag value of link line K-L .
966/14/2010 Nabil Dmaiadi

4 63
A
B
C F
E H
L6
6
9
2
6
11
17
17
J11
0
0 0
00
0 2
0
11
6
2
00
2
11
8
22
6
17
11
00
12 17
Nabil Dmaiadi 97
Dur.ES
EF FF TF LF
LS
1 4
3
5
3
5
8
D G K
1
2
2
6
2
5
5
13
6
11
13
16
17
22
511
16
0
0
0
0
2
0
0
1
1
2
1
00 6
2
00
6
3
10
11
6
00
14
6
10
17
12
11
17
14
11
22
17
00
6/14/2010

Summary of the 4th compressioncycle
Cycle
#
Activity to shorten
Can be shortened
NIL Days shortened
Cost per day
Cost per cycle
Total cost
Project duration
0 -- -- -- -- -- -- 5300 28
1 F 2 3 2 150 $ 300 $ 5600 26
Nabil Dmaiadi 98
1 F 2 3 2 150 $ 300 $ 5600 26
2 B 3 1 1 200 200 5800 25
3 H 1 2 1 250 250 6050 24
4 B,C 2 3 2 300 600 6650 24
6/14/2010

Logically Reducing Project duration:
Carful study of the network will reveal that in thiscompression step the link lag value of F-K will increasedas activity B&C are shortened. This compression cycle willresult in the link line F-K becoming positive.
By shortening the duration of activity B&C, the start finishdates of activity F will also be shortened, but this will notshorten the start of activity K.
The start date of activity K will dictated by the finish ofactivity G. As activity G is not altered by this compressionstep.
Nabil Dmaiadi6/14/2010 99

Logically Reducing Project duration:
The start of activity K is similarly unaltered . A review ofthe activity data shows that activity B and activity C caneach be shortened by only tow days. This the compressionin this step will be two days.
The link lag value for link F-K was increased by two dayswhile this may appear odd, it simply mean that activity Fwill be completed earlier than originally scheduled but thatthe completion date of activity G has not changed. This thestart date of activity K is not changed in these compressioncycle.
Nabil Dmaiadi6/14/2010 100

Logically Reducing Project duration:
The only activity remaining can be shortened is activity L
NIL for activity L is ∞ .A section cut through the networkwill not cut through any link lines so NIL is limit less thecompression is determined by the number of days that
Nabil Dmaiadi
compression is determined by the number of days thatactivity L can be shortened , namely one day.
At this point the network can’t be shortened further. Thispoint is reached whenever all activities in a critical pathcan no longer be shortened. While there are other activitiesthat can be shortened . The project duration would not bealtered by doing so.
6/14/2010 101

Identifying activities for 5th
compression cycle
Activity A B,C F H L
Nabil Dmaiadi 102
Cost/day ∞ ∞ ∞ ∞ 350$
6/14/2010

4 63
A
B
C F
E H
L
6
9
2
6
11
17
J
0
0 0
00
0 2
0
1
6
2
00 11
8
22 17
11
00
Nabil Dmaiadi 103
Dur.ES
EF FF TF LF
LS
1 4
3
5
3
5
8
D G K
1
2
2
6
2
5
5
13
6
11
13
16
17
22
511
16
0
0
0
0
2
0
01
1
2
1
00 6
2
00
6
3
10
11
6
00
14
6
10
17
12
11
17
14
11
22
17
00
6/14/2010

1 4 4
4 63
5
A
B
C F
E H
L1 2 6
6
9
2
6
11
17
175
J11
0
0 0
00
0 2
0
0
11
6
2
00
2
11
8
22
6
17
11
00
12 17
Nabil Dmaiadi 104
Dur.ES
EF FF TF LF
LS
1 4
3
4
3
5
8
D G K
1
2
2
6
2
5
5
13
6
11
13
16
17
21
511
16
0
0
0
2
0
1
2
1
00 6
2
00
6
3
10
11
6
00
14
6
10
17
12
11
17
14
11
21
17
00
6/14/2010

Summary of the 5th compressioncycle
Cycle
#
Activity to shorten
Can be shortened
NIL Days shortened
Cost per day
Cost per cycle
Total cost
Project duration
0 -- -- -- -- -- -- 5300 28
1 F 2 3 2 150 $ 300 $ 5600 26
Nabil Dmaiadi105
2 B 3 1 1 200 200 5800 25
3 H 1 2 1 250 250 6050 24
4 B,C 2 3 2 300 600 6650 22
5 L 1 ∞ 1 350 350 7000 21
6/14/2010

Identifying activities for 6th
compression cycle
Activity A B,C F H L
∞ ∞ ∞ ∞ ∞
Nabil Dmaiadi 106
Cost/day ∞ ∞ ∞ ∞ ∞
6/14/2010

Logically Reducing Project duration:
Note that the values if cost/day, increase consistently thisis a quick check to determine if an a obvious error righthave been made. The values must increase in eachsuccessive compression step.
Nabil Dmaiadi
In some rare cases the values could be equal, in this casethe scheduler actually may have more than one possibleactivity one activity to shorten at a given cost/day.
6/14/2010 107

Logically Reducing Project duration:
When this occurs, the scheduler must decide whichactivities to shorten first. Some sort at prioritization mustoccurs.
Nabil Dmaiadi
As general rule, under such circumstances higher priorityshould be given to the activity that occurs earlier in thenetwork. Other factors may also be present that mightestablish a deferent priority .
6/14/2010 108