chapter 9 the instruments of trade...
TRANSCRIPT

Chapter 9
The Instruments of Trade Policy

Copyright ©2015 Pearson Education, Inc. All rights reserved. 9-2
Preview
• Partial equilibrium analysis of tariffs in a single industry: supply, demand, and trade
• Costs and benefits of tariffs• Export subsidies• Import quotas• Voluntary export restraints• Local content requirements

Copyright ©2015 Pearson Education, Inc. All rights reserved. 9-3
Types of Tariffs
• A tariff is a tax levied when a good is imported.
• A specific tariff is levied as a fixed charge for each unit of imported goods.– For example, $3 per barrel of oil.
• An ad valorem tariff is levied as a fraction of the value of imported goods.– For example, 25% tariff on the value of imported
trucks.

Copyright ©2015 Pearson Education, Inc. All rights reserved. 9-4
Supply, Demand, and Trade in a Single Industry
• Consider how a tariff affects a single market, say that of wheat.
• Suppose that in the absence of trade the price of wheat is higher in Home than it is in Foreign.
• With trade, wheat will be shipped from Foreign to Home until the price difference is eliminated.

Copyright ©2015 Pearson Education, Inc. All rights reserved. 9-5
Supply, Demand, and Trade in a Single Industry (cont.)
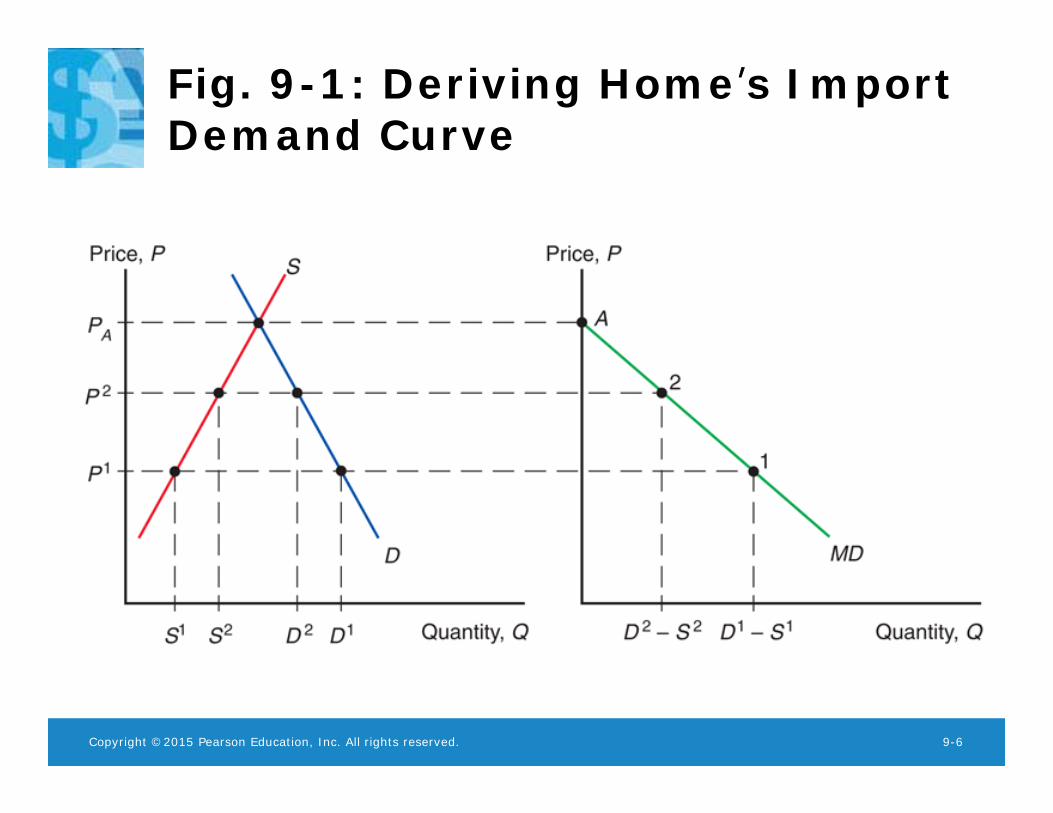
• An import demand curve is the difference between the quantity that Home consumers demand minus the quantity that Home producers supply, at each price.
• The Home import demand curve MD = D – S
intercepts the price axis at PA and is downward sloping:
– As price increases, the quantity of imports demanded declines.
Copyright ©2015 Pearson Education, Inc. All rights reserved. 9-6
Fig. 9-1: Deriving Home’s Import Demand Curve

Copyright ©2015 Pearson Education, Inc. All rights reserved. 9-7
Supply, Demand, and Trade in a Single Industry (cont.)
• An export supply curve is the difference between the quantity that Foreign producers supply minus the quantity that Foreign consumers demand, at each price.
• The Foreign export supply curve XS* = S* – D*
intersects the price axis at PA* and is
upward sloping: – As price increases, the quantity of exports
supplied rises.

Copyright ©2015 Pearson Education, Inc. All rights reserved. 9-8
Fig. 9-2: Deriving Foreign’s Export Supply Curve

Copyright ©2015 Pearson Education, Inc. All rights reserved. 9-9
Supply, Demand, and Trade in a Single Industry (cont.)
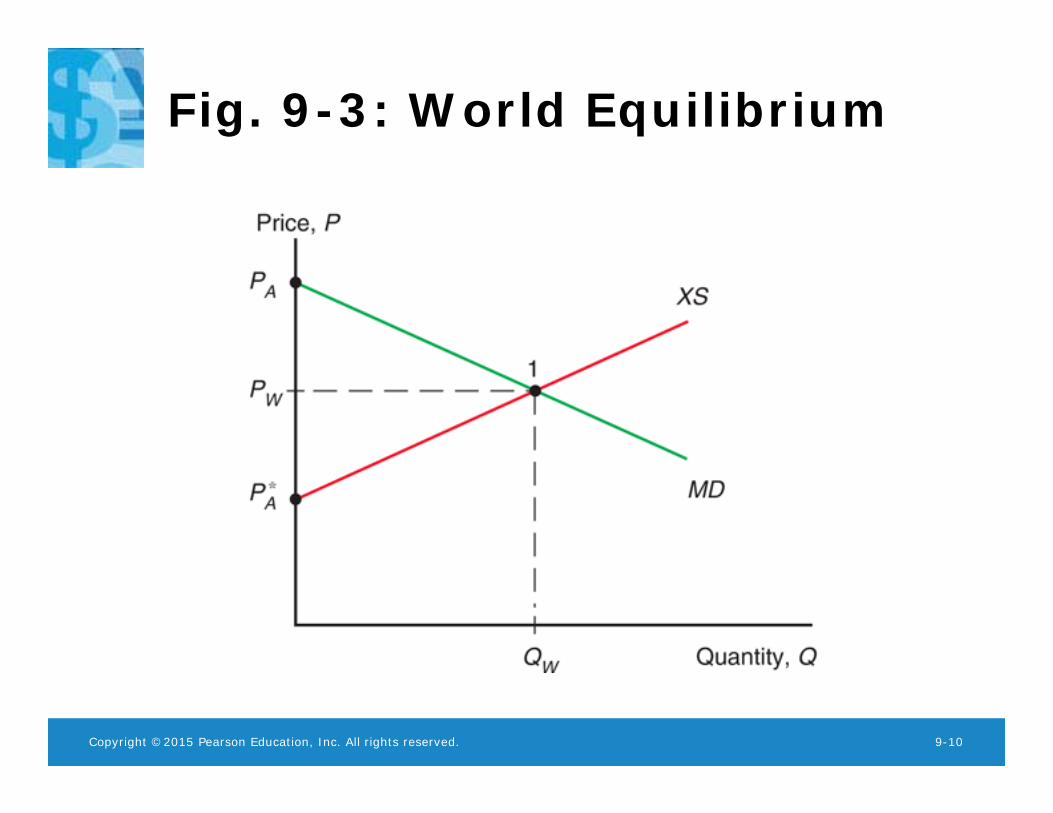
• In equilibrium, import demand = export supply,
home demand – home supply= foreign supply – foreign demand,
home demand + foreign demand = home supply + foreign supply,world demand = world supply.
Copyright ©2015 Pearson Education, Inc. All rights reserved. 9-10
Fig. 9-3: World Equilibrium

Copyright ©2015 Pearson Education, Inc. All rights reserved. 9-11
Effects of a Tariff
• A tariff acts like a transportation cost, making sellers unwilling to ship goods unless the Home price exceeds the Foreign price by the amount of the tariff:
PT – t = PT*
• A tariff makes the price rise in the Home market and fall in the Foreign market.

Copyright ©2015 Pearson Education, Inc. All rights reserved. 9-12
Fig. 9-4: Effects of a Tariff

Copyright ©2015 Pearson Education, Inc. All rights reserved. 9-13
Effects of a Tariff (cont.)
• Because the price in the Home market rises from PW under free trade to PT with the tariff,– Home producers supply more and Home
consumers demand less, so
– the quantity of imports falls from QW under free trade to QT with the tariff.

Copyright ©2015 Pearson Education, Inc. All rights reserved. 9-14
Effects of a Tariff (cont.)
• Because the price in the Foreign market falls from PW under free trade to PT
* with the tariff, – Foreign producers supply less, and Foreign
consumers demand more, so
– the quantity of exports falls from QW to QT .
Copyright ©2015 Pearson Education, Inc. All rights reserved. 9-15
Effects of a Tariff (cont.)
• The quantity of Home imports demanded equals the quantity of Foreign exports supplied when
PT – PT* = t
• The increase in the price in Home can be less than the amount of the tariff.– Part of the effect of the tariff causes the Foreign
export price to decline.
– But this effect is sometimes very small.
Copyright ©2015 Pearson Education, Inc. All rights reserved. 9-16
Effects of a Tariff in a Small Country
• When a country is “small,” it has no effect on the foreign (world) price because its demand is an insignificant part of world demand for the good.– The foreign price does not fall, but remains at Pw
.
– The price in the home market rises by the full amount of the tariff, to PT = Pw + t .

Copyright ©2015 Pearson Education, Inc. All rights reserved. 9-17
Fig. 9-5: A Tariff in a Small Country
Copyright ©2015 Pearson Education, Inc. All rights reserved. 9-18
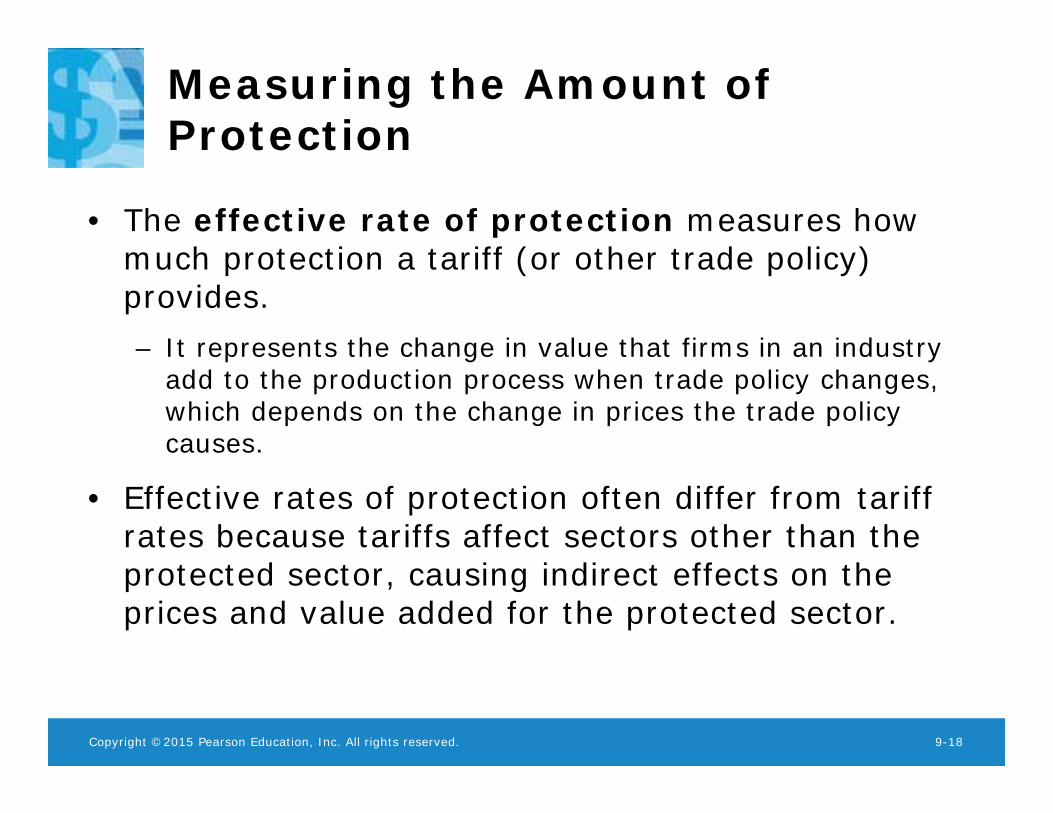
Measuring the Amount of Protection
• The effective rate of protection measures how much protection a tariff (or other trade policy) provides.– It represents the change in value that firms in an industry
add to the production process when trade policy changes, which depends on the change in prices the trade policy causes.
• Effective rates of protection often differ from tariff rates because tariffs affect sectors other than the protected sector, causing indirect effects on the prices and value added for the protected sector.

Copyright ©2015 Pearson Education, Inc. All rights reserved. 9-19
Measuring the Amount of Protection (cont.)
• For example, suppose that automobiles sell in world markets for $8,000, and they are made from factors of production worth $6,000.– The value added of the production process is
$8,000 – $6,000.
• Suppose that a country puts a 25% tariff on imported autos so that home auto assembly firms can now charge up to $10,000 instead of $8,000.

Copyright ©2015 Pearson Education, Inc. All rights reserved. 9-20
Measuring the Amount of Protection (cont.)
• The effective rate of protection for home auto assembly firms is the change in value added:
($4,000 – $2,000)/$2,000 = 100%
• In this case, the effective rate of protection is greater than the tariff rate.
Copyright ©2015 Pearson Education, Inc. All rights reserved. 9-21
Costs and Benefits of Tariffs
• A tariff raises the price of a good in the importing country, so it hurts consumers and benefits producers there.
• In addition, the government gains tariff revenue.
• How to measure these costs and benefits?
• Use the concepts of consumer surplus and producer surplus.

Copyright ©2015 Pearson Education, Inc. All rights reserved. 9-22
Consumer and Producer Surplus
• Consumer surplus measures the amount that consumers gain from purchases by computing the difference in the price actually paid from the maximum price they would be willing to pay for each unit consumed.– When price increases, the quantity demanded
decreases as well as the consumer surplus.

Copyright ©2015 Pearson Education, Inc. All rights reserved. 9-23
Fig. 9-6: Deriving Consumer Surplus from the Demand Curve

Copyright ©2015 Pearson Education, Inc. All rights reserved. 9-24
Fig. 9-7: Geometry of Consumer Surplus
Copyright ©2015 Pearson Education, Inc. All rights reserved. 9-25
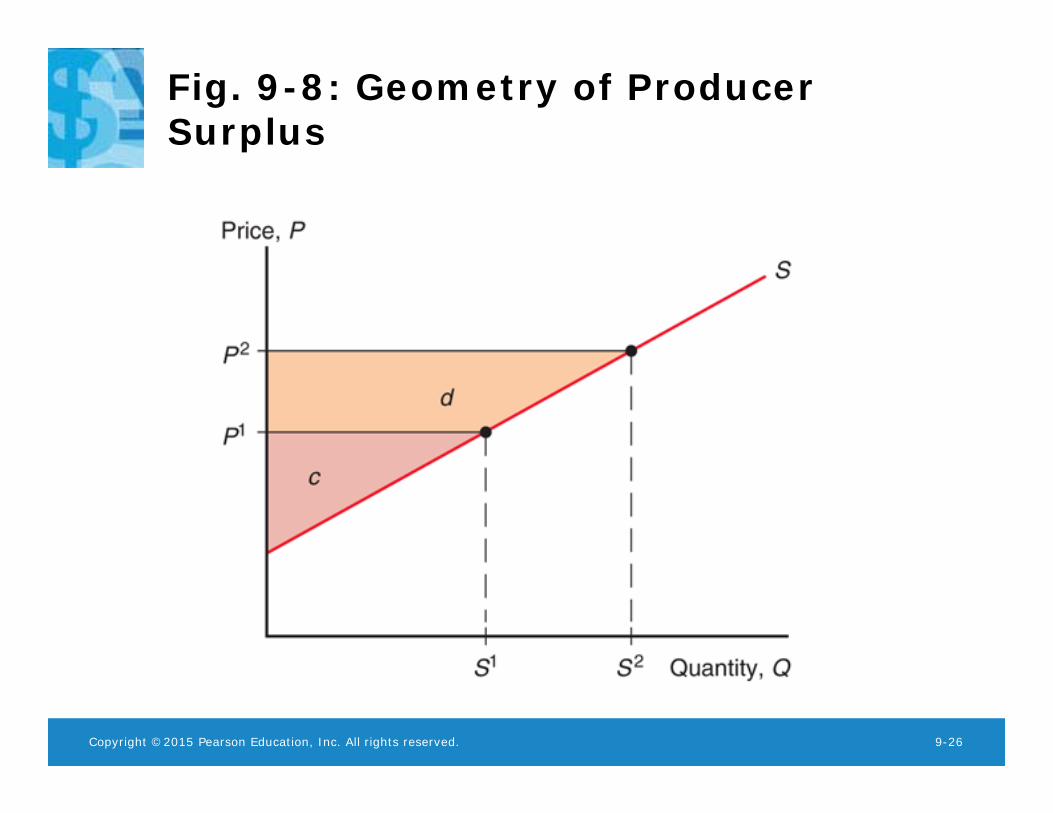
Consumer and Producer Surplus (cont.)
• Producer surplus measures the amount that producers gain from sales by computing the difference in the price received from the minimum price at which they would be willing to sell.– When price increases, the quantity supplied
increases as well as the producer surplus.
Copyright ©2015 Pearson Education, Inc. All rights reserved. 9-26
Fig. 9-8: Geometry of Producer Surplus

Copyright ©2015 Pearson Education, Inc. All rights reserved. 9-27
Measuring the Costs and Benefits of Tariffs
• A tariff raises the price in the importing country:– consumer surplus decreases (consumers worse off)
– producer surplus increases (producers better off).
– the government collects tariff revenue equal to the tariff rate times the quantity of imports with the tariff.
t QT = (PT –PT* ) (D2 – S2)
• Change in welfare due to the tariff is e – (b + d).

Copyright ©2015 Pearson Education, Inc. All rights reserved. 9-28
Fig. 9-9: Costs and Benefits of a Tariff for the Importing Country
Copyright ©2015 Pearson Education, Inc. All rights reserved. 9-29
Measuring the Costs and Benefits of Tariffs (cont.)
• For a “large” country, whose imports and exports affect world prices, the welfare effect of a tariff is ambiguous.
• The triangles b and d represent the efficiency loss.– The tariff distorts production and consumption decisions:
producers produce too much and consumers consume too little.
• The rectangle e represents the terms of trade gain. – The tariff lowers the Foreign price, allowing Home to buy
its imports cheaper.

Copyright ©2015 Pearson Education, Inc. All rights reserved. 9-30
Measuring the Costs and Benefits of Tariffs (cont.)
• Part of government revenue (rectangle e) represents the terms of trade gain, and part (rectangle c) represents some of the loss in consumer surplus.– The government gains at the expense of consumers and
foreigners.
• If the terms of trade gain exceed the efficiency loss, then national welfare will increase under a tariff, at the expense of foreign countries.– However, foreign countries are apt to retaliate.

Copyright ©2015 Pearson Education, Inc. All rights reserved. 9-31
Fig. 9-10: Net Welfare Effects of a Tariff
Copyright ©2015 Pearson Education, Inc. All rights reserved. 9-32
Measuring the Costs and Benefits of Tariffs (cont.)
• Tariffs can lead trading partners to retaliate with their own tariffs, thus hurting exporters in the country that first adopted the tariff.
• Tariffs can be hard to remove and large tariffs may induce producers to engage in wasteful activities to avoid paying tariffs.– Ford and Subaru install (then later remove)
seats in vans and pickups trucks to avoid U.S. tariff on imports of light commercial trucks.

Copyright ©2015 Pearson Education, Inc. All rights reserved. 9-33
Export Subsidy
• An export subsidy can also be specific or ad valorem:– A specific subsidy is a payment per unit exported.
– An ad valorem subsidy is a payment as a proportion of the value exported.
• An export subsidy raises the price in the exporting country, decreasing its consumer surplus (consumers worse off) and increasing its producer surplus (producers better off).
Copyright ©2015 Pearson Education, Inc. All rights reserved. 9-34
Export Subsidy (cont.)
• Also, government revenue falls due to paying s XS
* for the export subsidy.• An export subsidy lowers the price paid in
importing countries PS* = PS – s.
• In contrast to a tariff, an export subsidy worsens the terms of trade by lowering the price of exports in world markets.

Copyright ©2015 Pearson Education, Inc. All rights reserved. 9-35
Fig. 9-11: Effects of an Export Subsidy
Copyright ©2015 Pearson Education, Inc. All rights reserved. 9-36
Export Subsidy (cont.)
• An export subsidy damages national welfare.
• The triangles b and d represent the efficiency loss.– The export subsidy distorts production and consumption
decisions: producers produce too much and consumers consume too little compared to the market outcome.
• The area b + c + d + f + g represents the cost of the subsidy paid by the government. – The terms of trade decrease, because the price of exports
falls.
Copyright ©2015 Pearson Education, Inc. All rights reserved. 9-37
Export Subsidy in Europe
• The European Union’s Common Agricultural Policy sets high prices for agricultural products and subsidizes exports to dispose of excess output.– Subsidized exports reduce world prices of agricultural
products.
• The cost of this policy for European taxpayers is almost $30 billion more than its benefits (in 2007). Subsidy payments are about 22% of the value of farm output.– The EU has proposed that farmers receive direct payments
independent of the amount of production to help lower EU prices and reduce production.

Copyright ©2015 Pearson Education, Inc. All rights reserved. 9-38
Fig. 9-12: Europe’s Common Agricultural Policy

Copyright ©2015 Pearson Education, Inc. All rights reserved. 9-39
Import Quota
• An import quota is a restriction on the quantity of a good that may be imported.
• This restriction is usually enforced by issuing licenses or quota rights.
• A binding import quota will push up the price of the import because the quantity demanded will exceed the quantity supplied by Home producers and from imports.

Copyright ©2015 Pearson Education, Inc. All rights reserved. 9-40
Import Quota (cont.)
• When a quota instead of a tariff is used to restrict imports, the government receives no revenue.– Instead, the revenue from selling imports at high prices
goes to quota license holders.
– These extra revenues are called quota rents.
Copyright ©2015 Pearson Education, Inc. All rights reserved. 9-41
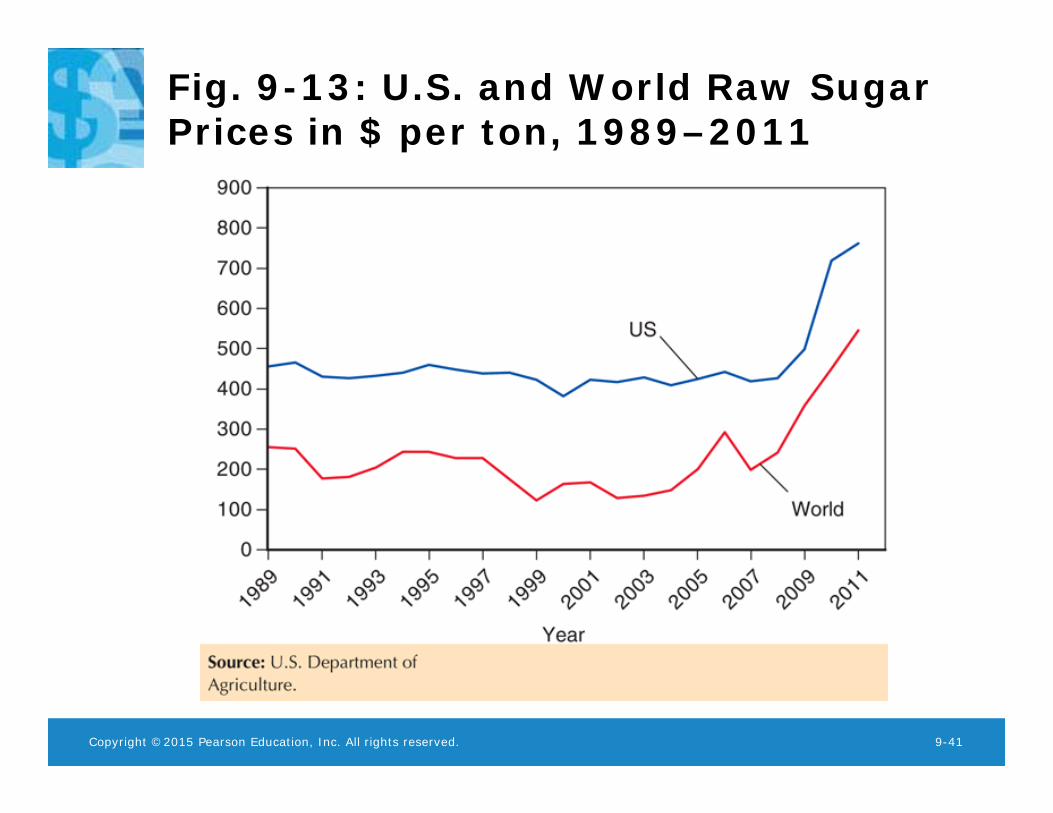
Fig. 9-13: U.S. and World Raw SugarPrices in $ per ton, 1989–2011

Copyright ©2015 Pearson Education, Inc. All rights reserved. 9-42
Fig. 9-14: Effects of the U.S. Import Quota on Sugar
Copyright ©2015 Pearson Education, Inc. All rights reserved. 9-43
Voluntary Export Restraint
• A voluntary export restraint works like an import quota, except that the quota is imposed by the exporting country rather than the importing country.
• These restraints are usually requested by the importing country.
• The profits or rents from this policy are earned by foreign governments or foreign producers.– Foreigners sell a restricted quantity at an increased price.
Copyright ©2015 Pearson Education, Inc. All rights reserved. 9-44
Local Content Requirement
• A local content requirement is a regulation that requires a specified fraction of a final good to be produced domestically.
• It may be specified in value terms, by requiring that some minimum share of the value of a good represent home value added, or in physical units.
Copyright ©2015 Pearson Education, Inc. All rights reserved. 9-45
Local Content Requirement (cont.)
• From the viewpoint of domestic producers of inputs, a local content requirement provides protection in the same way that an import quota would.
• From the viewpoint of firms that must buy home inputs, however, the requirement does not place a strict limit on imports, but allows firms to import more if they also use more home parts.

Copyright ©2015 Pearson Education, Inc. All rights reserved. 9-46
Local Content Requirement (cont.)
• Local content requirement provides neither government revenue (as a tariff would) nor quota rents.
• Instead, the difference between the prices of home goods and imports is averaged into the price of the final good and is passed on to consumers.
Copyright ©2015 Pearson Education, Inc. All rights reserved. 9-47
Local Content Requirement (cont.)
• Any public work project funded by the American Recovery and Re-Investment Act of 2009 (ARRA) must use U.S. iron, steel, and manufactured goods (unless foreign bid more than 25% lower).– The Bay Bridge linking San Francisco and Oakland did not
use ARRA funding because some key components would have been 23% ($400 million) more expensive.
• Delays due to having to show that some items are unavailable from U.S. sources.
• Has triggered protectionist clauses that shut U.S. firms out of opportunities abroad.
Copyright ©2015 Pearson Education, Inc. All rights reserved. 9-48
Other Trade Policies
• Export credit subsidies– A subsidized loan to exporters– U.S. Export-Import Bank subsidizes loans to U.S.
exporters.
• Government procurement– Government agencies are obligated to purchase from home
suppliers, even when they charge higher prices (or have inferior quality) compared to foreign suppliers.
• Bureaucratic regulations (red tape)– Safety, health, quality, or customs regulations can act as
a form of protection and trade restriction.
Copyright ©2015 Pearson Education, Inc. All rights reserved. 9-49
The Effects of Trade Policy
• For each trade policy, the price rises in the Home country adopting the policy.– Home producers supply more and gain. – Home consumers demand less and lose.
• The world price falls when Home is a “large” country that affects world prices.
• Tariffs generate government revenue; export subsidies drain it; import quotas do not affect government revenue.
• All these trade policies create production and consumption distortions.

Copyright ©2015 Pearson Education, Inc. All rights reserved. 9-50
Table 9-1: Effects of Alternative Trade Policies

Copyright ©2015 Pearson Education, Inc. All rights reserved. 9-51
Summary
1. A tariff increases the home price and the quantity supplied and reduces the quantity demanded and the quantity traded; also decreases the world price when the country is “large.”
2. A quota does the same; an export subsidy does the same.
3. Tariffs generate government revenue; export subsidies drain it; import quotas are revenue neutral.

Copyright ©2015 Pearson Education, Inc. All rights reserved. 9-52
Summary (cont.)
4. The welfare effect of a tariff, quota, or export subsidy can be measured by – efficiency loss from consumption and production
distortions.– terms of trade gain or loss.
5. With import quotas, voluntary export restraints, and local content requirements, the government of the importing country receives no revenue.
6. With voluntary export restraints and occasionally import quotas, quota rents go to foreigners.

Chapter 9
Appendix: Tariffs and Import
Quotas in the Presence of Monopoly

Copyright ©2015 Pearson Education, Inc. All rights reserved. 9-54
Fig. 9A-1: A Monopolist under Free Trade

Copyright ©2015 Pearson Education, Inc. All rights reserved. 9-55
Fig. 9A-2: A Monopolist Protected by a Tariff
Copyright ©2015 Pearson Education, Inc. All rights reserved. 9-56
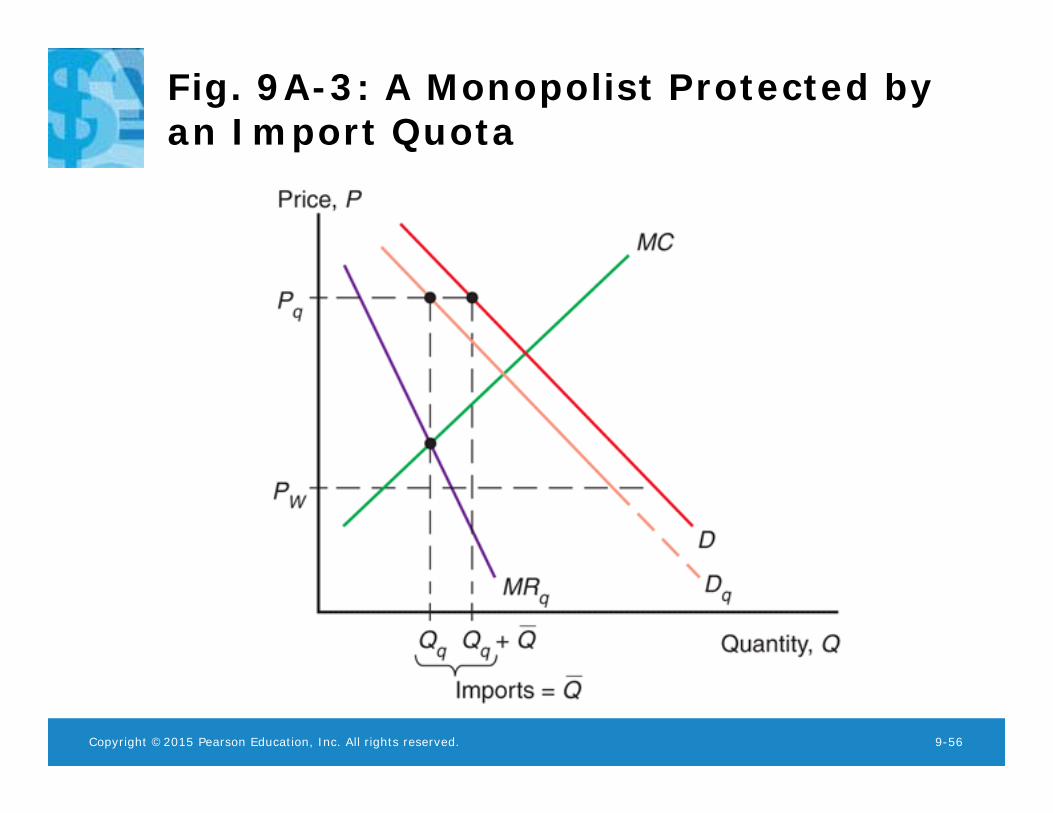
Fig. 9A-3: A Monopolist Protected by an Import Quota
Copyright ©2015 Pearson Education, Inc. All rights reserved. 9-57
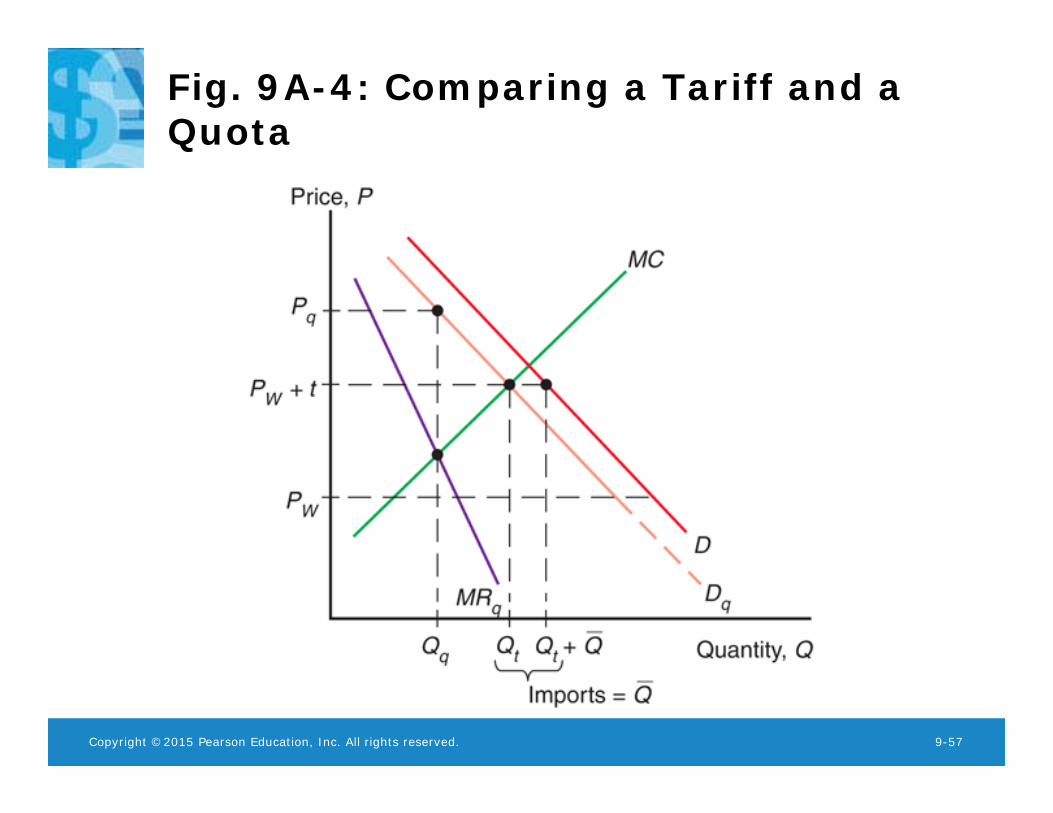
Fig. 9A-4: Comparing a Tariff and a Quota