chapter 7 scatterplots, association, and correlation © 2010 pearson education 1
TRANSCRIPT

Chapter 7Scatterplots, Association,
and Correlation
© 2010 Pearson Education
1

© 2010 Pearson Education
2
A scatterplot, which plots one quantitative variable against another, can be an effective display for data.
Scatterplots are the ideal way to picture associations between two quantitative variables.

© 2010 Pearson Education
3
7.1 Looking at Scatterplots
The direction of the association is important.
A pattern that runs from the upper left to the lower right is said to be negative.
A pattern running from the lower left to the upper right is called positive.

© 2010 Pearson Education
4
7.1 Looking at Scatterplots
The second thing to look for in a scatterplot is its form.
If there is a straight line relationship, it will appear as a cloud or swarm of points stretched out in a generallyconsistent, straight form. This is called linear form.
Sometimes the relationship curves gently, while still increasing or decreasing steadily; sometimes it curves sharply up then down.

© 2010 Pearson Education
5
7.1 Looking at Scatterplots
The third feature to look for in a scatterplot is the strength of the relationship.
Do the points appear tightly clustered in a single stream or do the points seem to be so variable and spread out that we can barely discern any trend or pattern?

© 2010 Pearson Education
6
7.1 Looking at Scatterplots
Finally, always look for the unexpected.
An outlier is an unusual observation, standing away from the overall pattern of the scatterplot.

© 2010 Pearson Education
7
7.2 Assigning Roles to Variables in Scatterplots
To make a scatterplot of two quantitative variables, assign one to the y-axis and the other to the x-axis.
Be sure to label the axes clearly, and indicate the scales of the axes with numbers.
Each variable has units, and these should appear with the display—usually near each axis.

© 2010 Pearson Education
8
7.2 Assigning Roles to Variables in Scatterplots
Each point is placed on a scatterplot at a position that corresponds to values of the two variables.
The point’s horizontal location is specified by its x-value, and its vertical location is specified by its y-value variable.
Together, these variables are known as coordinates and written (x, y).

© 2010 Pearson Education
9
7.2 Assigning Roles to Variables in Scatterplots
One variable plays the role of the explanatory or predictor variable, while the other takes on the role of the response variable.
We place the explanatory variable on the x-axis and the response variable on the y-axis.
The x- and y-variables are sometimes referred to as the independent and dependent variables, respectively.
© 2010 Pearson Education
10
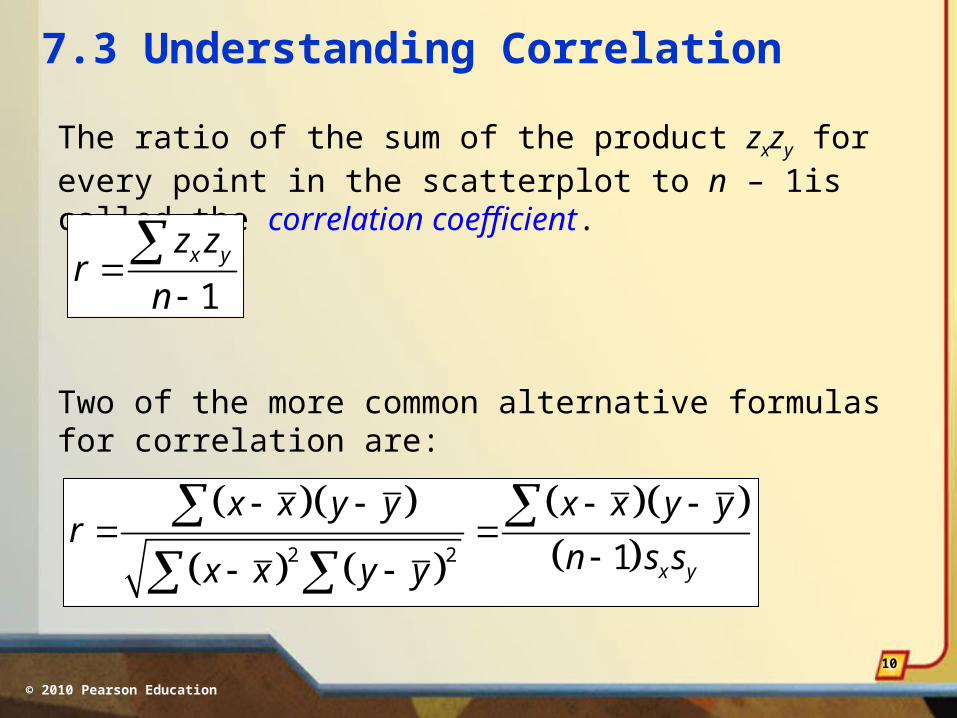
7.3 Understanding Correlation
The ratio of the sum of the product zxzy for every point in the scatterplot to n – 1is called the correlation coefficient.
1x yz z
rn
Two of the more common alternative formulas for correlation are:
2 2 1 x y
x x y y x x y yr
n s sx x y y

© 2010 Pearson Education
11
7.3 Understanding Correlation
Correlation Conditions
Correlation measures the strength of the linear association between two quantitative variables.

© 2010 Pearson Education
12
7.3 Understanding Correlation
Correlation Conditions
Before you use correlation, you must check three conditions:
• Quantitative Variables Condition: Correlationapplies only to quantitative variables.
• Linearity Condition: Correlation measures the strength only of the linear association.
• Outlier Condition: Unusual observations can distortthe correlation.

© 2010 Pearson Education
13
7.3 Understanding Correlation
Correlation Properties
• The sign of a correlation coefficient gives the direction of the association.
• Correlation is always between –1 and +1.
• Correlation treats x and y symmetrically.
• Correlation has no units.

© 2010 Pearson Education
14
7.3 Understanding Correlation
Correlation Properties
• Correlation is not affected by changes in the center or scale of either variable.
• Correlation measures the strength of the linear association between the two variables.
• Correlation is sensitive to unusual observations.

© 2010 Pearson Education
15
7.3 Understanding Correlation
Correlation Tables
Sometimes the correlations between each pair of variables in a data set are arranged in a table like the one below.

© 2010 Pearson Education
16
*7.4 Straightening Scatterplots
Example: After the Dow Jones Industrial Average, the S&P 500 is the most widely-watched index of U.S. stocks.
The time series plot of the data does not seem to indicate a strong linear association:

© 2010 Pearson Education
17
*7.4 Straightening Scatterplots
However, if we look at the logarithm of the S&P 500 over Time:
the plot looks straighter, so the correlation is now a more appropriate measure of association.

© 2010 Pearson Education
18
*7.4 Straightening Scatterplots
Simple transformations such as the logarithm, square root, or reciprocal can sometimes straighten a scatterplot’s form.

© 2010 Pearson Education
19
7.5 Lurking Variables and Causation
There is no way to conclude from a high correlation alonethat one variable causes the other.
There’s always the possibility that some third variable—a lurking variable—is simultaneously affecting both of the variables you have observed.

© 2010 Pearson Education
20
What Can Go Wrong?
• Don’t say “correlation” when you mean “association.”
• Don’t correlate categorical variables.
• Make sure the association is linear.
• Beware of outliers.
• Don’t confuse correlation with causation.
• Watch out for lurking variables.

© 2010 Pearson Education
21
What Have We Learned?
• Begin our investigation by looking at a scatterplot.
• The sign of the correlation tells us the direction of the association.
• The magnitude of the correlation tells us of the strength of a linear association.
• Correlation has no units, so shifting or scaling the data, standardizing, or even swapping the variables has no effect on the numerical value.

© 2010 Pearson Education
22
What Have We Learned?
To use correlation we have to check certain conditions forthe analysis to be valid:
• Check the Linearity Condition.
• Watch out for unusual observations.
We’ve learned not to make the mistake of assuming that a high correlation or strong association is evidence of a cause-and-effect relationship.