chapter 5 groundwater chemistry and...
TRANSCRIPT
58
CHAPTER 5
GROUNDWATER CHEMISTRY AND QUALITY
ASSESSMENT
5.1 INTRODUCTION
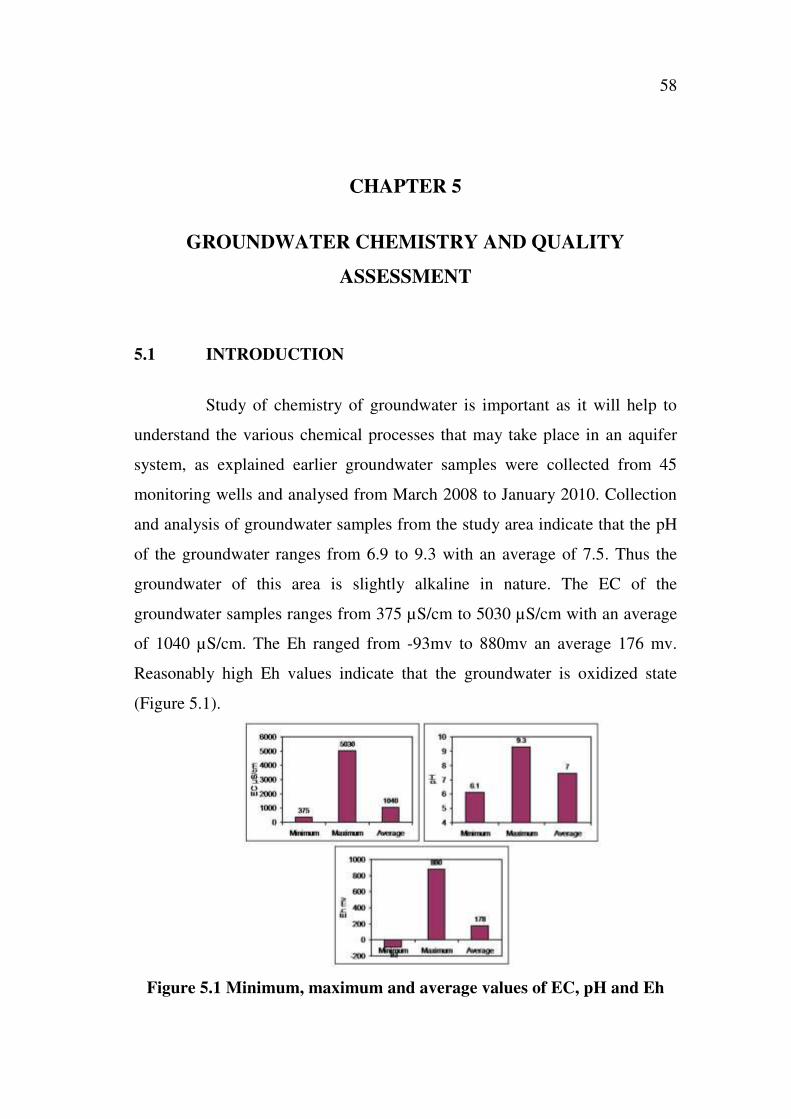
Study of chemistry of groundwater is important as it will help to
understand the various chemical processes that may take place in an aquifer
system, as explained earlier groundwater samples were collected from 45
monitoring wells and analysed from March 2008 to January 2010. Collection
and analysis of groundwater samples from the study area indicate that the pH
of the groundwater ranges from 6.9 to 9.3 with an average of 7.5. Thus the
groundwater of this area is slightly alkaline in nature. The EC of the
groundwater samples ranges from 375 µS/cm to 5030 µS/cm with an average
of 1040 µS/cm. The Eh ranged from -93mv to 880mv an average 176 mv.
Reasonably high Eh values indicate that the groundwater is oxidized state
(Figure 5.1).
Figure 5.1 Minimum, maximum and average values of EC, pH and Eh

59
5.2 MAJOR ION CHEMISTRY
The variation in the major ion concentration of groundwater of this
area is shown in the form of box plots (also called box-and-whisker plots)
(Figure 5.2). The line across the box represents the median, whereas the
bottom and top of the box show the locations of the first and third quartiles.
The whiskers are the lines that extend from the bottom and top of the box to
the lowest and highest concentrations of groundwater of the study area.
Figure 5.2 Box whisker diagram showing the variation of major ions in
groundwater
5.2.1 Groundwater types
The general order of dominance of cations in the groundwater of the
study area is Ca2+
>Na+ > Mg
2+ > K
+ while that for anions it is Cl
- >HCO3
- >
SO4-2
. Piper trilinear diagram (1944) was used to identify the groundwater
types. In this diagram (Figure 5.3), points of groundwater samples of the
study area gets plotted in the central diamond shaped field. The diamond
shaped field is divided into six major groundwater types such as CaHCO3,
NaCl, mixed CaNaHCO3, mixed CaMgCl, CaCl and NaHCO3 . The dominant
groundwater types of this area are Ca-HCO3, Na-Cl, Ca-Na-HCO3 and
Ca-Mg-Cl (Rajesh et al 2012). In general chemical composition of the

60
groundwater is mainly influenced by the composition of recharge of
rainwater, geological and hydrogeological variation within the aquifer. The
seasonal and spatial variations in the groundwater chemistry of this area are
discussed in the following sections.
Figure 5.3 Piper diagram showing the groundwater types of the study
area
5.3 TEMPORAL VARIATION
Seasonal variation in groundwater chemistry of an area is
essentially due to variations in groundwater recharge, land use, pumping, well
lithology and geochemical reactions. In general rainfall recharge is a major
source for variation in groundwater chemistry. In the study area rainfall
recharge occurs during the monsoon period from July to September and
evaporation is very high in April to June when the temperature rises to 44° C.
In the study area the concentration of major ions of groundwater, water level
and rainfall vary significantly with respect to time (Figure 5.4 and 5.5). In
some of the wells the groundwater level decreases the ionic concentration

61
increase. On the other hand in some cases when the groundwater level lowers
the ionic concentration of groundwater decrease. Similar results were
observed in the Arani Kortlai basin (Elango 1992), Rajmohan and Elango
(2006) and also observed in the hard rock region of Nalgonda District (Rajesh
et al 2012). There are two types of seasonal variations in groundwater ionic
concentrations are found in this study area (Figure 5.4 and 5.5).
The first type of variation occurs during the rainfall recharge as the
concentration of ions decreases in groundwater and the water level increases
(Figure 5.4). The decreasing concentrations of the major ions are due to the
dilution of groundwater by recharge of rainfall in the study area. In the second
type of variation, the concentration of ions in groundwater increases with
decreasing water level in some of the wells (Figure 5.5). During dry periods,
when the groundwater level decrease, the major ion concentration is increases
which indicate the processes of evaporation. Further, during the beginning of
monsoonal rainfall recharge, the recharging water dissolves the salts
deposited during the preceding dry months in the soil zone and takes them to
the groundwater, which increases the major ions in groundwater. If the
rainfall continues for more times, the concentration of major ion is decrease in
groundwater. As it is arid dry land where irrigation is practices use both
surface and groundwater, the water used for irrigation undergoes evaporation
leading to increase the concentration of ions. This evaporation enriched
irrigated water enters the groundwater zone as recharge, which is pumped
again for irrigation. Thus pumping of groundwater for irrigation and its
evaporation from the irrigated area leads to increase in concentration of salts
in the soil zone (Rajesh et al 2011). Thus the seasonal variation is mainly
controlled by the recharge processes apart from the other geochemical
processes which are discussed in the later sections.

62
Figure 5.4 temporal variations in rainfall, groundwater level and major
ion concentration
Figure 5.5 Temporal variation in rainfall, groundwater level and major
ion concentration
Well NO: 4
Well No: 2
63
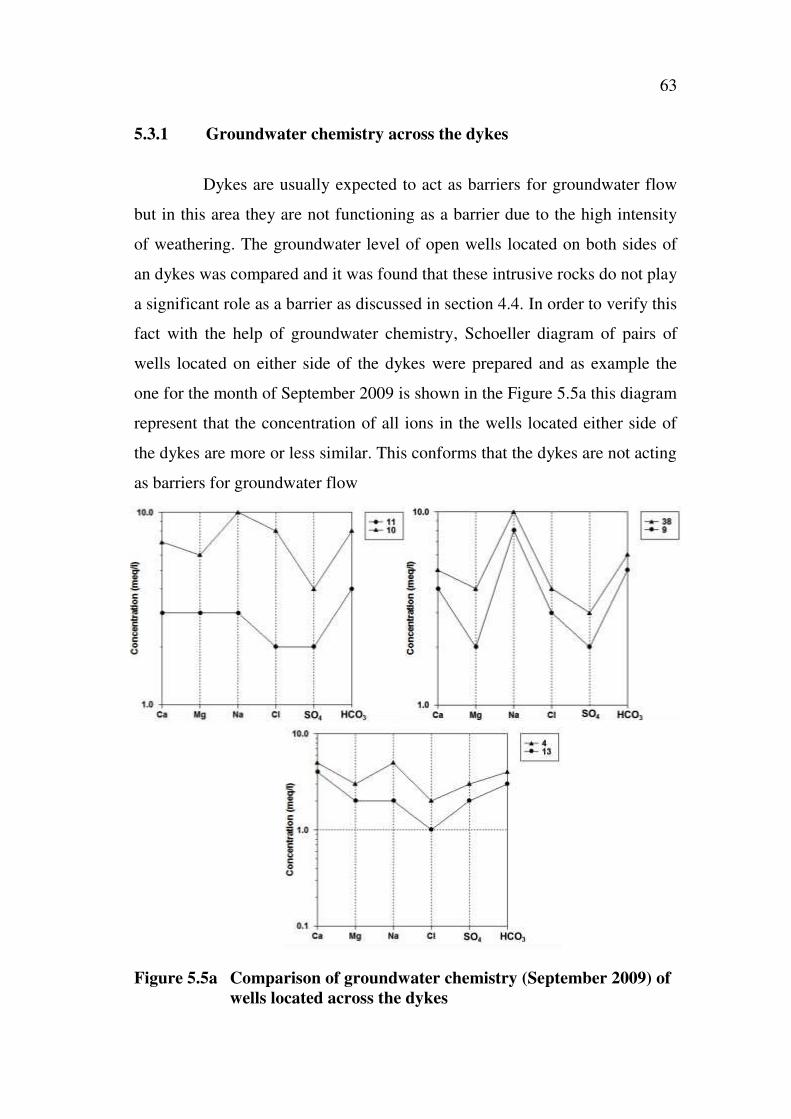
5.3.1 Groundwater chemistry across the dykes
Dykes are usually expected to act as barriers for groundwater flow
but in this area they are not functioning as a barrier due to the high intensity
of weathering. The groundwater level of open wells located on both sides of
an dykes was compared and it was found that these intrusive rocks do not play
a significant role as a barrier as discussed in section 4.4. In order to verify this
fact with the help of groundwater chemistry, Schoeller diagram of pairs of
wells located on either side of the dykes were prepared and as example the
one for the month of September 2009 is shown in the Figure 5.5a this diagram
represent that the concentration of all ions in the wells located either side of
the dykes are more or less similar. This conforms that the dykes are not acting
as barriers for groundwater flow
Figure 5.5a Comparison of groundwater chemistry (September 2009) of
wells located across the dykes

64
5.4 SPATIAL VARIATION
The study of spatial variation in major ion concentration of the
groundwater of this area will give information about the hydrochemical nature
of an aquifer. The concentration of sodium in groundwater (Figure 5.6) is
relatively high in the southeastern part of the area and it is low in the central
part of the study area. The potassium concentration is high in the south
eastern part and it is low in the north and southwestern part of the area
(Figure 5.7). Calcium concentration in groundwater is high in southeastern
part of the area, where as it is relatively low in groundwater in the
southwestern part of the area (Figure 5.8).
Figure 5.6 spatial variations in concentration of Na (mg/l) in
groundwater during November 2009

65
Figure 5.7 Spatial variations in concentration of K (mg/l) in
groundwater during November 2009
Figure 5.8 Spatial variation in concentration of Ca (mg/l) in
groundwater during November 2009

66
Spatial variation of magnesium concentration of groundwater is high in
southeastern part of the area and it is low in the southwestern and central part
of the area (Figure 5.9). The chloride concentration (Figure 5.10) in groundwater
is high in the southwestern and low in the central part of the area.
Figure 5.9 Spatial variation in concentration of of Mg (mg/l) in
groundwater during November 2009
Figure 5.10 Spatial variation in concentration of Cl (mg/l) in
groundwater during November 2009
67
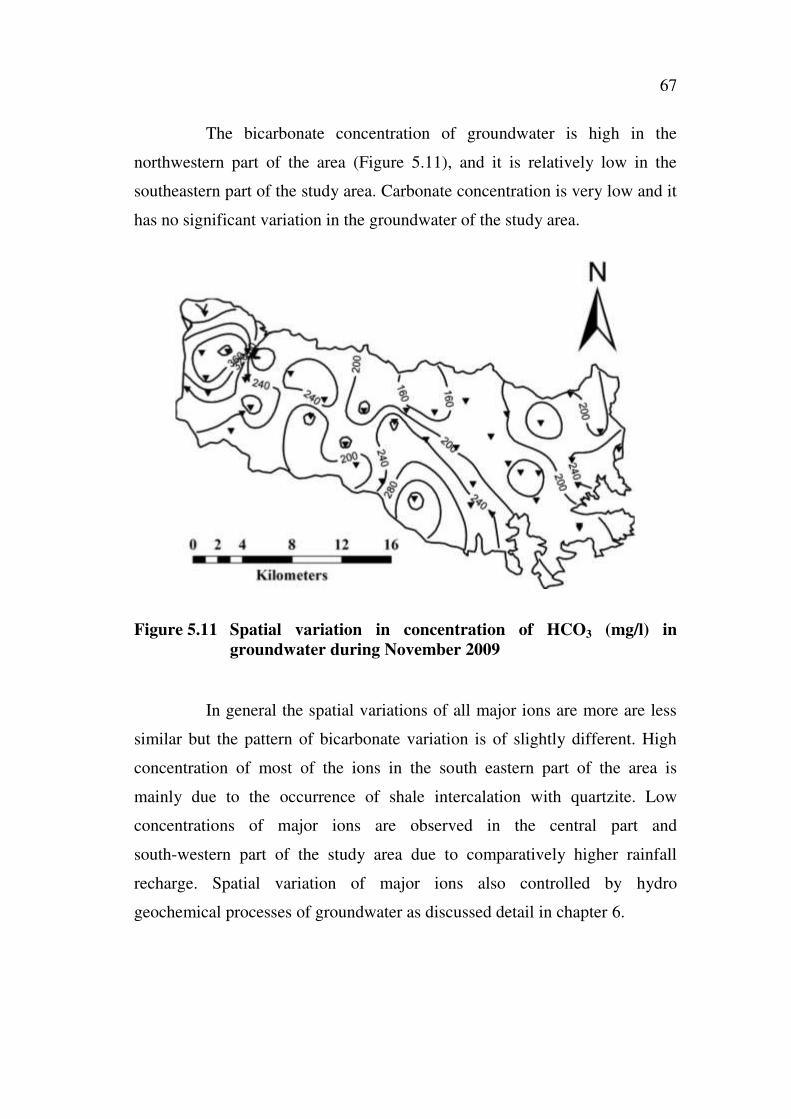
The bicarbonate concentration of groundwater is high in the
northwestern part of the area (Figure 5.11), and it is relatively low in the
southeastern part of the study area. Carbonate concentration is very low and it
has no significant variation in the groundwater of the study area.
Figure 5.11 Spatial variation in concentration of HCO3 (mg/l) in
groundwater during November 2009
In general the spatial variations of all major ions are more are less
similar but the pattern of bicarbonate variation is of slightly different. High
concentration of most of the ions in the south eastern part of the area is
mainly due to the occurrence of shale intercalation with quartzite. Low
concentrations of major ions are observed in the central part and
south-western part of the study area due to comparatively higher rainfall
recharge. Spatial variation of major ions also controlled by hydro
geochemical processes of groundwater as discussed detail in chapter 6.

68
5.5 QUALITY ASSESMENT
5.5.1 Drinking water quality
The groundwater chemistry was used to determine the suitability of
groundwater in the study area for drinking purpose by comparing with the
standard guideline values as suggested by the BIS (1991, 2003) Table 5.1.
The table represents the most desirable limits and maximum allowable limits
of various parameters. The pH, Mg, SO4 and HCO3 are within the permissible
limits. The TDS, F and NO3 exceed the permissible limits as shown in
Table 5.1.
Table. 5.1 Groundwater samples of the study area exceeding the
permissible limits suggested by BIS for drinking purposes
Parameters
BIS (1991,2003) Percentage of samples
exceeding permissible limits
N=450 Permissible limits
pH 9.2 NIL
TDS (mg/l) 1500 2
Ca (mg/l) 200 4
Mg (mg/l) 100 NIL
Cl (mg/l) 1000 NIL
SO4 (mg/l) 400 NIL
HCO3 (mg/l) 600 NIL
TH (mg/l) 600 1
F(mg/l) 1.5 25
NO3 (mg/l) 100 13
69
0102030405060708090
100
Fresh water Brackish
water
Saline water Brine water
< 1000 1000-10000 10000-100000 >100000
Ranges
Perc
en
tag
e Percentage of
samples
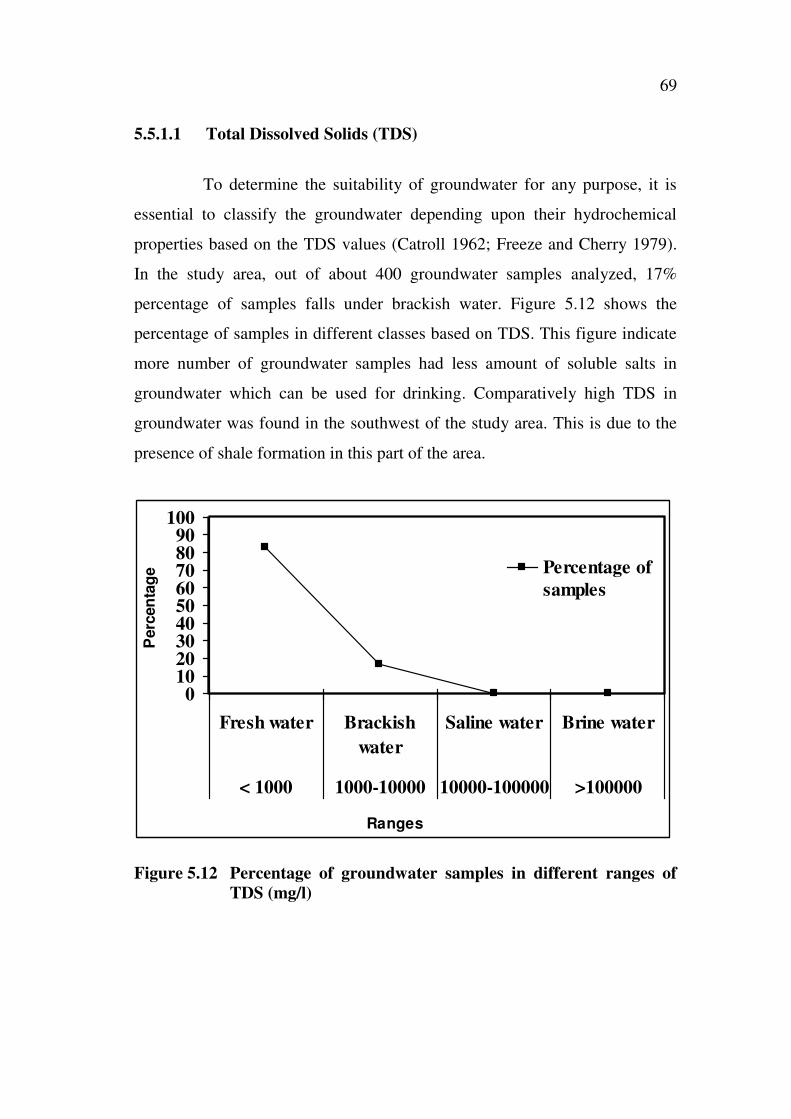
5.5.1.1 Total Dissolved Solids (TDS)
To determine the suitability of groundwater for any purpose, it is
essential to classify the groundwater depending upon their hydrochemical
properties based on the TDS values (Catroll 1962; Freeze and Cherry 1979).
In the study area, out of about 400 groundwater samples analyzed, 17%
percentage of samples falls under brackish water. Figure 5.12 shows the
percentage of samples in different classes based on TDS. This figure indicate
more number of groundwater samples had less amount of soluble salts in
groundwater which can be used for drinking. Comparatively high TDS in
groundwater was found in the southwest of the study area. This is due to the
presence of shale formation in this part of the area.
Figure 5.12 Percentage of groundwater samples in different ranges of
TDS (mg/l)

70
5.5.1.2 Total Hardness
The groundwater classification is based on Total Hardness (TH).
Majority of samples fall under hard and very hard category as given in this
Figure 5.13. TH of the groundwater was calculated using the formula given
below (5.1) (Sawyer et al 2003).
TH (as CaCO3) mg/l = (Ca + Mg) meq/l x 50 (5.1)
The hardness values range from 75 mg/l to 1926 mg/l with an
average value of 245 mg/l. The maximum allowable limit of TH for drinking
purpose is 600 mg/l and the most desirable limit is 200 mg/l as per the BIS
standard. Groundwater exceeding the limit of 300 mg/l is considered to be
very hard (Sawyer and McMcartly 1967). The 10% of groundwater samples
falls under moderately hard, 61% of falls in hard and remaining 29% of
samples are very hard. The graph (Figure 5.13) shows that the concentration
of TH as per the BIS (1991, 2003). Moderately hard to hard category present
in the central part of area. The southeastern part of the study area having very
hard category (Figure 5.14, 5.15). The CaCO3% of 26 soil samples collected
from this area ranges from 0.4% to 27.3%. They also observed preferential
formation of calcite in the chromusters while dolomite occurs only in the
Rhodustalfs.
The soils in the Nalgonda region are of Ustrothents and Rhodustalfs
types (Gajbhiye and Mandal 2000). Hence, it is reasonable to assume that
these minerals are reactive in groundwater environment and they can control
ion concentration (Rajesh et al 2012).

71
0102030405060708090
100
Soft Moderately
Hard
Hard Very Hard
<75 74 - 150 150 - 300 > 300Ranges
Perc
en
tag
e
Percentage of
samples
Figure 5.13 Percentage of groundwater samples in different ranges of
total hardness (mg/l)
Figure 5.14 Spatial variation of total hardness (mg/l) of groundwater
during November 2008

72
Figure 5.15 Spatial variation of total hardness (mg/l) of groundwater
during November 2009
5.5.2 Irrigation Water Quality
5.5.2.1 Salinity and Alkalinity Hazard
Salinity is the total amount of inorganic solid material dissolved in
any natural water, and water salinization relates to an increase in TDS and
overall chemical content of water. Electrical conductivity of groundwater of
this region ranges from 144 to 5030 µS/cm with an average of 1032 µS/cm
during the study period Quality of water to be used for irrigation based on
electrical conductivity (Ragunath 1987) is given in Table 5.2 and is found that
23% of samples fall in good, 61% of samples falls in permissible limit and
16% of samples exceed the permissible limits. The spatial variation of EC of
groundwater indicates that the groundwater is good to permissible category in
the central part of the study area. In the southeastern part of the study area the
groundwater is unsuitable (Figures 5.16 and 5.17) for irrigation. Excess
amount of dissolved ion such as sodium, bicarbonate and carbonate in

73
irrigation water will affect the agricultural soil physically and chemically,
thus will decrease the productivity of crops.
Table 5.2 Irrigation water quality based on electrical conductivity
EC (µS/cm) Water Class
Percentage of samples
N=450
< 250 Excellent NIL
250 - 750 Good 23
750 - 2000 Permissible 61
2000 - 3000 Doubtful 1
> 3000 Unsuitable 15
Figure 5.16 Spatial variation of EC (µS/cm) of groundwater during
November 2008

74
Figure 5.17 Spatial variation of EC (µS/cm) of groundwater during
November 2009
Excess salinity will reduce the osmotic activity of plants and this
interferes with the adsorption of water and nutrients from the soil (Saleh et al
1999).
Sodium concentration plays a major role in evaluating the
groundwater quality for irrigation because sodium causes an increase in the
hardness of soil as well as a reduction in its permeability (Tijani 1994). The
sodium or alkali hazard during the use of water for irrigation is expressed by
determining the sodium adsorption ratio (SAR) and it can be calculated by
equation (5.2) (Karanth 1987)
SAR=Na/ (Ca + Mg) 1/2
/2 (5.2)
where the concentrations are represented in meq/l
75
The SAR values ranges from 1 to 30 with an average value of 3.
Most of the groundwater samples of the study area fall in the low sodium
class (S1). This implies that no alkali hazard is anticipated to the crops in this
region. If the SAR values is greater than 6 to 9, it suggest that degree to which
irrigation water tends to enter into cation exchange reaction in soil. Sodium
replacing adsorbed calcium and magnesium is a risk as it causes damage to
the soil structure, as the soil will become more compact and impervious.
The analytical data plotted on the US salinity diagram (Richards
1954) suggest that groundwater samples (Figure 5.18) falls in the domain
C2S1, C3S1, indicating water of medium-high salinity and low sodium,
which can be utilized for irrigation in all types of soil with slight cause of
exchangeable sodium. Some of the samples fall in the domain C4S1
indicating high salinity and low alkalinity hazard. This water is desirable for
plants having good salt tolerance and its restrains its suitability for irrigation,
especially in soils with poor drainage. A few samples fall in the C3S2
domain. The groundwater of the study area in general falls into the categories
of good to moderate.
The sodium percentage (Na %) is calculated using the equation (5.3)
given below:
Na % = (Na + K) X 100/ (Ca + Mg + Na + K) (5.3)
where all the concentrations are expressed in meq/l
Most of groundwater samples (Table 5.3) fall in the good to
permissible category based on Na% (Ragunath 1987). The Wilcox (1955)
Diagram pertaining to sodium percentage and total concentration
(Figure 5.19) show that most of the groundwater samples fall in the domain of

76
excellent to good except for a few samples falling in the domain of good to
permissible, doubtful and unsuitable zones.
Figure 5.18 USSL classification of groundwater for irrigation purpose

77
Figure 5.19 Suitability of groundwater for irrigation purpose by Wilcox
diagram

78
Table 5.3 Suitability of groundwater for irrigation based on sodium
percentage
% Na Water Class
Percentage of samples
N=450
< 20 Excellent NIL
20 - 40 Good 25
40 - 60 Permissible 38
60 - 80 Doubtful 20
> 80 Unsuitable 17
5.5.2.2 Residual Sodium Carbonate
The excess of carbonate and bicarbonate in groundwater over the
sum of calcium and magnesium also influences the suitability of groundwater
for irrigation. This is denoted as residual sodium carbonate (RSC), which is
calculated by equation 5.4 as follows (Ragunath 1987)
RSC= (HCO3 + CO3) – (Ca +Mg) (5.4)
Where the concentration as represented as meq/l
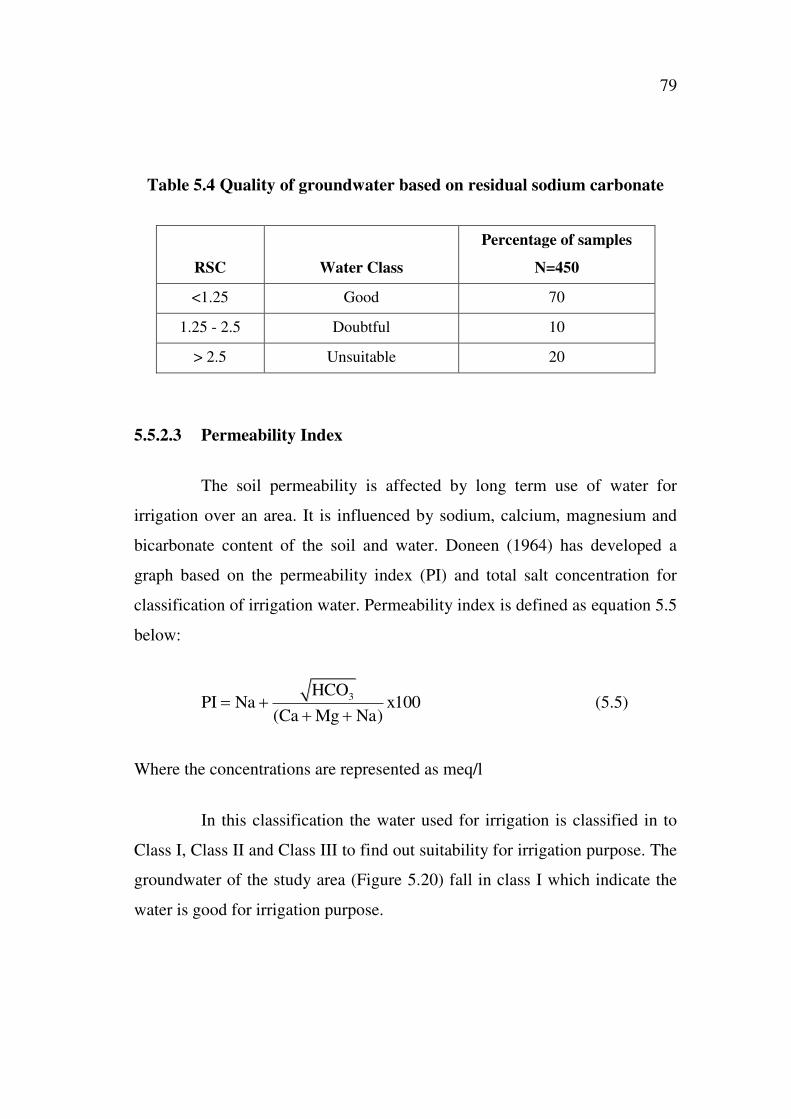
The classification of irrigation water based on the RSC values is
presented in Table 5.4. 70% of groundwater samples fall in good, 10% of
samples fall in doubtful and the remaining 20% of samples falls under
unsuitable category for irrigation.
79
Table 5.4 Quality of groundwater based on residual sodium carbonate
RSC Water Class
Percentage of samples
N=450
<1.25 Good 70
1.25 - 2.5 Doubtful 10
> 2.5 Unsuitable 20
5.5.2.3 Permeability Index
The soil permeability is affected by long term use of water for
irrigation over an area. It is influenced by sodium, calcium, magnesium and
bicarbonate content of the soil and water. Doneen (1964) has developed a
graph based on the permeability index (PI) and total salt concentration for
classification of irrigation water. Permeability index is defined as equation 5.5
below:
3HCO
PI Na x100(Ca Mg Na)
(5.5)
Where the concentrations are represented as meq/l
In this classification the water used for irrigation is classified in to
Class I, Class II and Class III to find out suitability for irrigation purpose. The
groundwater of the study area (Figure 5.20) fall in class I which indicate the
water is good for irrigation purpose.

80
Figure 5.20 Suitability of groundwater for irrigation purpose based on
permeability index