groundwater chemistry of the weaber plain: preliminary results
TRANSCRIPT

Research Library Research Library
Resource management technical reports Natural resources research
12-2011
Groundwater chemistry of the Weaber Plain: preliminary results Groundwater chemistry of the Weaber Plain: preliminary results
Adam Lillicrap
Paul Raper
Richard J. George Dr
D L. Bennett
Follow this and additional works at: https://researchlibrary.agric.wa.gov.au/rmtr
Part of the Agriculture Commons, Environmental Indicators and Impact Assessment Commons,
Environmental Monitoring Commons, Fresh Water Studies Commons, Hydrology Commons, Natural
Resources Management and Policy Commons, Soil Science Commons, and the Water Resource
Management Commons
Recommended Citation Recommended Citation Lillicrap, A, Raper, P, George, R J, and Bennett, D L. (2011), Groundwater chemistry of the Weaber Plain:
preliminary results. Department of Primary Industries and Regional Development, Western Australia, Perth. Report 368.
This report is brought to you for free and open access by the Natural resources research at Research Library. It has been accepted for inclusion in Resource management technical reports by an authorized administrator of Research Library. For more information, please contact [email protected].

Groundwater chemistry of the Weaber Plain:
preliminary results
RESOURCE MANAGEMENT TECHNICAL REPORT 368


ISSN 1039–7205
Resource Management Technical Report 368
Groundwater chemistry of the Weaber Plain: preliminary
results
Adam Lillicrap, Paul Raper, Richard George and Don Bennett
December 2011
Citation:
Lillicrap, AM, Raper, GP, George, RJ & Bennett, DL 2011, Groundwater chemistry of the Weaber Plain: preliminary results, Resource Management Technical Report 368, Department of Agriculture and Food, Western Australia.
Cover picture: Groundwater sampling on the Weaber Plain. Photo: Adam Lillicrap
Disclaimer
While all reasonable care has been taken in the preparation of the information in this document, the Chief Executive Officer of the Department of Agriculture and Food and its officers and the State of Western Australia accept no responsibility for any errors or omissions it may contain, whether caused by negligence or otherwise, or for any loss, however caused, arising from reliance on, or the use or release of, this information or any part of it.
Copyright © Western Australian Agriculture Authority, 2011
Copies of this document are available in alternative formats upon request.
3 Baron-Hay Court, South Perth WA 6151 Tel: (08) 9368 3333 Email: [email protected]
www.agric.wa.gov.au

Groundwater chemistry of the Weaber Plain
i
Contents
Contents ............................................................................................................................... i
Acknowledgments ............................................................................................................... iii
Summary .............................................................................................................................. v
1. Introduction ................................................................................................................ 1
2. Previous work ............................................................................................................ 4
2.1 Ivanhoe and Packsaddle groundwater salinity trends ...................................... 4
2.2 Weaber hydrochemical data ............................................................................. 4
3. Methods ...................................................................................................................... 8
3.1 Groundwater salinity trends .............................................................................. 8
3.2 Water-sampling program .................................................................................. 9
3.3 Suitability of groundwater for irrigation ............................................................. 14
4. Results ........................................................................................................................ 18
4.1 Groundwater salinity trends .............................................................................. 18
4.2 Groundwater salinity trends by soil type ........................................................... 24
4.3 Water sampling ................................................................................................. 25
4.4 Suitability of groundwater for direct and indirect irrigation ................................ 30
5. Discussion .................................................................................................................. 34
5.1 Groundwater salinity ......................................................................................... 34
5.2 Groundwater age .............................................................................................. 39
5.3 Suitability of Weaber Plain groundwater for irrigation ....................................... 39
5.4 Future water-quality monitoring ........................................................................ 40
6. Conclusions ............................................................................................................... 45
7. References .................................................................................................................. 46
Appendix A: Ivanhoe Plain water-quality plots ................................................................ 48
Appendix B: Weaber Plain water quality plots ................................................................. 56
Appendix C: Groundwater and surface-water sites sampled ......................................... 59
Groundwater chemistry of the Weaber Plain
ii
Appendix D: Analytical methods and detection limits .................................................... 61
Appendix E: Water-quality analysis results ...................................................................... 63
Appendix F: Piper diagram ................................................................................................. 76
Appendix G: Groundwater-modelling scenarios .............................................................. 77
Appendix H: Modelled water quality of groundwater to be discharged to the supply channel ................................................................................................................................. 78
Appendix I: Proposed groundwater monitoring ............................................................... 81

Groundwater chemistry of the Weaber Plain
iii
Acknowledgments
This project was initiated in April 2010 and Phase 1 completed in September 2010. More than 150 days of fieldwork were involved, and the project could not have been undertaken without the support of many people.
The authors would like to thank Peter Stubbs (Department of Regional Development), Brett Chivers (Benchmark) and Mark Pasalich (LandCorp) for their project support, funding and guidance.
The project was supported by a Technical Reference Group. The TRG members—Ken Lawrie (Geoscience Australia), Anthony Smith, Tim Munday (CSIRO), Gary Humphries (Department of Water), Ryan Vogwill (Department of Environment and Conservation) and Anthony Knapton (NRETAS)—are also thanked for their scientific review and leadership roles.
Geoff Strickland (Ord Irrigation Cooperative) and David Munday and Duncan Palmer (Department of Water) are thanked for their support, as are staff of the Department of Environment and Conservation, Kununurra.
We acknowledge Jenny McGuire, Peter McCafferty, Helena Rabiasz and the staff at the Chemistry Centre for all their help, especially for delivering water analysis results so promptly, and Fred Leaney, CSIRO Land and Water Laboratory, Adelaide, for his help with analyses and his guidance in interpreting CFC results.
Staff from the Department of Agriculture (Kununurra: Noel Wilson, Lorraine Hartle, Gae Plunkett, Tara Slaven; Bunbury: Terry Hill, Anella Conrades, Peter Gardiner; Perth: Mark Pridham; Albany: Terry Ralston, Naomi Franich, Joanne Francis, Greg Henderson) are thanked for logistics, analysis and review.
The authors acknowledge assistance of members of the Project Team: Bob Paul, John Simons, Russell Speed, Adele Kendle, Rosemary Smith, Grant Stainer and Arjen Ryder. We thank them for their support in preparation of the data for this report.
Bob Paul and Grant Stainer reviewed this report.
All digital aerial photographs used in the preparation of maps presented in this report were supplied by the Western Australian Land Information Authority.
Finally, a special thanks to our families for their support.

Groundwater chemistry of the Weaber Plain
iv

Groundwater chemistry of the Weaber Plain
v
Summary
The proposed 8000-ha Weaber Plain (Goomig) farmlands are located north-east of the existing, 14 000 ha, Ord River Irrigation Area (ORIA), 30 km from Kununurra in the East Kimberley region of Western Australia. The existing ORIA covers parts of the Ivanhoe and Packsaddle plains.
In 2008, the Ord Irrigation Expansion Project was approved by the Western Australian Government to develop irrigated agriculture on the Weaber Plain. Construction of the M2 supply channel connecting the ORIA and the Weaber Plain, and the final period of irrigation design, environmental management and related approval processes, commenced later in 2009. This process followed a protracted period of public and private industry planning and environmental assessment (Kinhill 2000).
This report summarises an analysis of groundwater salinity trends on the Ivanhoe and Weaber plains and the preliminary results of an intensive water-quality sampling program carried out in 2010 as part of Phase 1 of the project. The purpose of this report is to provide interim results to inform groundwater management plans required as part of the approval process for the development of the Weaber Plain.
The specific aims of this report are to:
forecast the salinity of groundwater that may have to be pumped for watertable control, by assessing past and present aquifer conditions on the ORIA (Ivanhoe Plain) and the Weaber Plain
assess the potential for disposal of this groundwater by mixing it with water from the M2 irrigation supply channel
make recommendations on long-term monitoring requirements for groundwater consistent with the ANZECC/ARMCANZ (2000) guidelines.
The Ivanhoe Plain groundwater salinity trends between 1984 and 2009 indicate that the development of the Weaber Plain for irrigated agriculture is unlikely to result in any significant change in groundwater salinity within the Ord palaeochannel. Furthermore, where groundwater salinities in the palaeochannel are very high, as in the north-eastern portion of the Weaber Plain, they are likely to decrease due to dilution with fresh irrigation-supply water. Groundwater salinities are highest under Aquitaine soils on the Weaber Plain, and, as proposed farm lots on Aquitaine soils will be leasehold, with some subject to deferred clearing, potential increases in groundwater salinity following development will be further limited.
An analysis to assess the option of pumping groundwater from the Ord River palaeochannel and discharging it to the irrigation supply channel showed that, while most of the groundwater is unsuitable for direct irrigation, when mixed with water from the M2 supply channel at calculated ratios it is suitable (based on USDA 1954 guidelines). The analysis indicated that the mean total dissolved solids (TDS) of groundwater in the palaeochannel would be about 1162 mg/L (Table 9), which agrees well with the 1200 mg/L predicted by the solute transport model produced by KBR (2011). At the modelled pumping rates of 540 to 769 mL/day, mixing this groundwater with supply-channel water at average and peak flow rates results in water of 170 to 200 mg/L TDS.

Groundwater chemistry of the Weaber Plain
vi
These results demonstrate that blending groundwater into the main supply channel will provide a viable option for managing groundwater-related risks on the Weaber Plain if, at some time in the future, aquifer management is required.
A network of 58 groundwater-monitoring bores at 44 sites is recommended as the basis of an ongoing water-quality monitoring program for the life of the development. The recommended network consists of bores to be monitored at a high intensity with dataloggers and low-intensity bores, plus eight reference bores. This report includes a list of required analytes for comparison to the ANZECC/ARMCANZ (2000) water-quality guidelines and a strategy to develop a baseline water-quality data set to ensure that the environmental impacts of the development are within required limits. Trigger mechanisms and guidelines for the escalation of groundwater-quality monitoring are also recommended, should any analyte exceed a baseline level by a set amount.

Groundwater chemistry of the Weaber Plain
1
1. Introduction
The Ord River Irrigation Area (ORIA) is located in the Kimberley region of the north-west of Western Australia, near the town of Kununurra (Figure 1). It was established in 1963 with the release of five farms and has developed to its current extent of 14 000 hectares.
The Weaber Plain is located north-east of the existing ORIA, 30 km from Kununurra. The area had been identified as being suitable for irrigated agriculture for many decades, but it was not until 2008 that the Ord Irrigation Expansion Project proposal, to develop 8000 ha of the Weaber Plain, was approved by the Western Australian Government. This area will be the first of several proposed areas (Ord West Bank, Mantinea, Carlton, Knox, Keep River and Cockatoo sands) to be developed, leading to the potential for irrigation of up to 52 000 ha. Annual demand for irrigation water supply from Lake Argyle has been calculated at 80 to 120 GL for the Weaber Plain, and up to 865 GL has been allocated for the entire irrigation area.After state government approval in 2008, the M2 supply channel connecting ORIA to the Weaber Plain was constructed, and the final period of irrigation design, environmental management and related approval processes began in 2009.
In late 2009, as part of this process, the Department of Agriculture and Food, Western Australia (DAFWA), with partners Kellogg Brown and Root Pty Ltd (KBR), undertook to deliver a groundwater management plan and contribute to the completion of a hydrodynamic plan to ensure sustainable development of the project area.
The requirement for these plans had been first established by the Environmental Protection Authority as part of the process of evaluating the 1998 Wesfarmers Marubeni proposal (Kinhill 2000). During this period, KBR and others had begun to address the joint issues of salinity and water quality within the proposed irrigation area, surrounding conservation buffers and the downstream Keep River. In addition to the requirement for an environmental impact statement by the State Government, the proposal has to meet commonwealth government environmental conditions, namely those related to the Environmental Protection and Biodiversity Conservation Act 1999, and also address any concerns of the Northern Territory Government.
Preparation of the groundwater management plan was undertaken in two stages. Stage 1, completed in February 2010 by KBR, consisted of a suite of groundwater model simulations using updated groundwater level, regolith and climate data informed by studies by Lawrie et al. (2010) and CSIRO (2009). During this work, it was determined that the existing groundwater data was inadequate for the purpose of substantiating modelled options to manage shallow watertables and salinity (KBR 2010). Some of the identified data deficiencies related directly to the proposal to pump groundwater from the Ord River palaeochannel, which runs under the Weaber Plain, to control the watertable. This included determining the suitability of the groundwater pumped from the palaeochannel, in terms of its quality, for mixing with the irrigation supply.
The conceptualisation of aquifer recharge processes was another area identified as requiring further investigation (KBR 2010), and the application of chlorofluorocarbon dating techniques was recognised as an appropriate method to improve the understanding of groundwater age and therefore recharge processes on the Weaber Plain.
Addressing the data deficiencies identified in the Stage 1 investigations formed the basis of Stage 2 of preparing the groundwater management plan. It was completed in October 2010

Groundwater chemistry of the Weaber Plain
2
by the Agricultural Resource Risk Management Division of DAFWA, and consisted of a program of fieldwork and subsequent modelling by KBR.
To address the lack of data on groundwater salinity, a review of historical groundwater-quality data for the current Ord River Irrigation Area on the Ivanhoe Plain was undertaken. The rationale was that the groundwater salinity response to irrigation of the Ivanhoe Plain would provide a first-order indication of the likely response to irrigation of the Weaber Plain. A detailed field sampling program on the Weaber Plain was also carried out to:
characterise the hydrochemistry of groundwater under the Weaber Plain
assess the suitability of mixing groundwater and surface water for irrigation
assist with the understanding of salinity processes
make recommendations for future monitoring.
This report presents a review of the historical data, reports the initial results of the baseline groundwater sampling and analysis program, and on this basis recommends a program for completion of the baseline survey and ongoing monitoring. The analyses and results presented here supersede those presented in Appendices H3 and H4 of the Stage 2 modelling report (KBR 2011).

Groundwater chemistry of the Weaber Plain
3
Fig
ure
1 S
tud
y a
rea lo
cali
ty m
ap

Groundwater chemistry of the Weaber Plain
4
2. Previous work
2.1 Ivanhoe and Packsaddle groundwater salinity trends
Previous analyses of groundwater salinity trends in the Ivanhoe and Packsaddle plain irrigation areas were undertaken by O’Boy et al. (2001) and Smith et al. (2007).
Patterns of salinity change were evident in some bores and appeared to reflect changes in local groundwater flow conditions. O’Boy et al. (2001) considered leakage from both the M1 supply channel and the D4 drain as the probable causes for observations of low salinity groundwater under parts of both the Packsaddle and Ivanhoe plains. The locations of supply channels and drains are shown in Figure 1 and Figure 8. Furthermore, Smith et al. (2007) noted that groundwater quality at several bores on the Packsaddle Plain had freshened to the point where the observed salinity was close to that of the irrigation water.
O’Boy et al. (2001) noted an inverse relationship between observed electrical conductivity (EC) and groundwater level under the southern, and parts of the northern, Ivanhoe Plain, i.e. EC increased as the watertable rose. In contrast, Smith et al. (2007) concluded that there had been no obvious trends in groundwater salinity under the Ivanhoe and Packsaddle plains during the previous twenty years.
2.2 Weaber hydrochemical data
Lawrie et al. (2010) and O’Boy et al. (2001) identified areas of saline groundwater and subsoils under the Weaber Plain. They argued that irrigation on the plain could potentially activate stored salts and impact on both agricultural production and the downstream environment. However, both acknowledged a lack of data and detailed understanding of the hydrochemistry of the ground and surface waters of the Weaber Plain to inform this risk assessment.
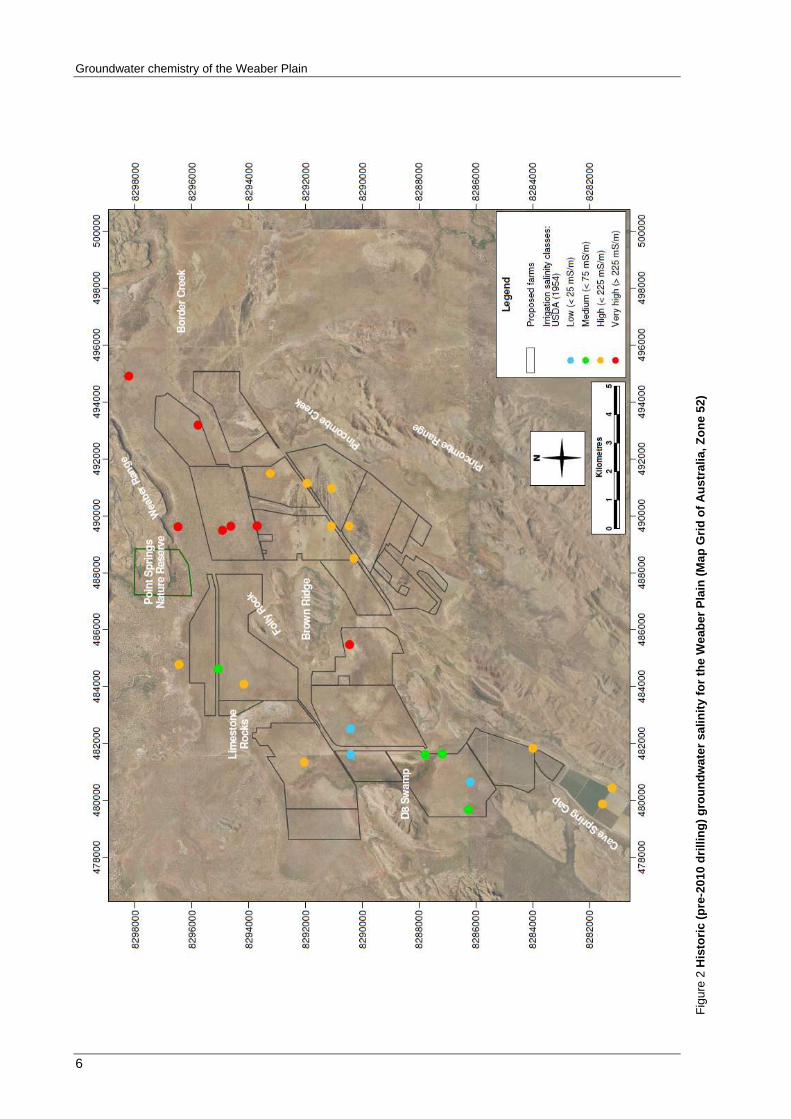
Basic chemical analyses of Weaber Plain groundwater have been reported in earlier hydrogeological reports (Laws 1983, Nixon 1997a, b). In these studies, the pH of all groundwater was neutral to slightly alkaline. The salinity of the groundwater (Figure 2) was highly variable, ranging from low (130 mg/L TDS) in the south-west, to very high in the north-east (19 000 mg/L TDS).
The chemical composition of groundwater is classified by the major ions: the cations sodium, potassium, calcium and magnesium, and the anions chloride, sulfate, bicarbonate and carbonate. Chloride is a conservative ion that is unreactive except for simple precipitation–dissolution. Sulfate will also behave conservatively under stable oxidation–reduction conditions and in the absence of sulfide minerals. Cation concentrations can be influenced by cation exchange with clays or by the weathering of basement rocks. The conservative nature of the anions, sulfate and chloride therefore makes them suitable for classifying water compositions.
Figure 3 shows the high variability in the chemical composition of the groundwater across the Weaber Plain. Anions showed the greatest variability, with lower salinity waters dominated by bicarbonate and higher salinity waters by chloride.
Sodium was the dominant cation in most groundwaters across the Weaber Plain. The groundwaters under the Weaber Plain showed similar characteristics to groundwaters in other sub-areas of the Ord River Irrigation Area, such as the Ivanhoe and Packsaddle plains

Groundwater chemistry of the Weaber Plain
5
(Smith et al. 2007). The groundwaters under both the Ivanhoe and Packsaddle plains were also dominated by sodium. Similarly, the dominant anion in lower salinity waters was bicarbonate, and, in higher salinity waters in the Ivanhoe and Packsaddle areas, chloride was dominant.
Groundwater chemistry of the Weaber Plain
6
Fig
ure
2 H
isto
ric (
pre
-2010 d
rill
ing
) g
rou
nd
wate
r sali
nit
y f
or
the W
eab
er
Pla
in (
Map
Gri
d o
f A
ustr
ali
a,
Zo
ne
52)

Groundwater chemistry of the Weaber Plain
7
Fig
ure
3 H
isto
ric (
pre
-2010 d
rill
ing
) d
om
inan
t g
rou
nd
wate
r c
ati
on
s a
nd
an
ion
s f
or
the W
eab
er
Pla
in (
Ma
p G
rid
of
Au
str
ali
a,
Zo
ne
52)

Groundwater chemistry of the Weaber Plain
8
3. Methods
3.1 Groundwater salinity trends
Groundwater level and salinity observations have been made at bores on the Ivanhoe and Weaber plains by the Department of Water (DoW) and DAFWA since the 1960s as part of the exploratory drilling program and monitoring of the irrigation development (a subset of the bores is shown in Figure 8 and Figure 9). The majority of the data is stored in the DoW’s WIN database, while some was only available from DAFWA, Kununurra.
Despite some long time series, groundwater salinity data for only two bores (4C and 11C) was available back to 1964. Bore CS10, on the Weaber Plain, has the longest, most complete record of groundwater salinity data, which covers the period since August 1978. For the majority of bores for which salinity data is available, reliable records start around 1984.
Salinity was measured either as total dissolved solids (TDS, mg/L) in the laboratory or as electrical conductivity (EC). In some cases, field-measured EC values were converted to TDS and stored in the WIN database as TDS. The majority of the groundwater salinity observations after 1985 were made in the field as EC, and stored in the database in that format. To convert EC observations to TDS, a regression equation was developed using data collected from groundwater exploration bores drilled by the Geological Survey of Western Australia in the Kununurra area (O’Boy et al. 2001), as concurrent observations of TDS and EC were available in that report. All salinity data were plotted as TDS values.
Evaluations of the data quality of groundwater level and TDS time series plots for both the Ivanhoe and Weaber plains were undertaken. Many of the apparent errors in the recorded EC data were attributed to errors in the recording of EC units, e.g. values measured in mS/m recorded as μS/cm, resulting in the recorded value being an order of magnitude lower than it should be. Doubtful EC records were omitted from the analysis, as the variability in the remaining time series was often high, and arbitrary correction of data points was considered inappropriate. In some time series, there were several data points that did not form part of a recognisable pattern with the majority of the data; however, these observations were not removed from the analysis where they were not different enough from the rest of the series to be confidently identified as recording errors.
Groundwater-level data was included in the plots so that any relationship between depth to groundwater and salinity could be recognised. Bores were then classified on the basis of the groundwater salinity trend displayed, and salinity values as at 1984 and 2009 were tabulated. The proportional change in groundwater salinity was also calculated for bores with sufficiently long time series. As monitoring of many bores ceased prior to 2009, the proportional change in groundwater salinity was calculated over the longest time period available for each bore, not necessarily for the period 1984 to 2009.
The data was then separated into bores within and outside the Ord River palaeochannel. On the Ivanhoe Plain, the mapping of Lawrie et al. (2010) was used to determine which bores fall within the palaeochannel. On the Weaber Plain, the revised extent of the palaeochannel presented by George et al. (2011) was used (Figure 8). GenStatTM 64-bit Release 14.1 (VSN International Ltd) was used to perform Mann-Whitney U (Wilcoxon rank-sum) tests on the data to ascertain whether there were any significant differences in salinity levels or trends between the two hydrogeological settings. In a separate analysis, the groundwater data for the Ivanhoe and Weaber plains was combined to increase statistical reliability, and the salinity data then separated on the basis of soil type, the two main types being Cununurra

Groundwater chemistry of the Weaber Plain
9
and Aquitaine clays. The salinity of groundwaters under these two soil types was also tested for statistically significant differences.
3.2 Water-sampling program
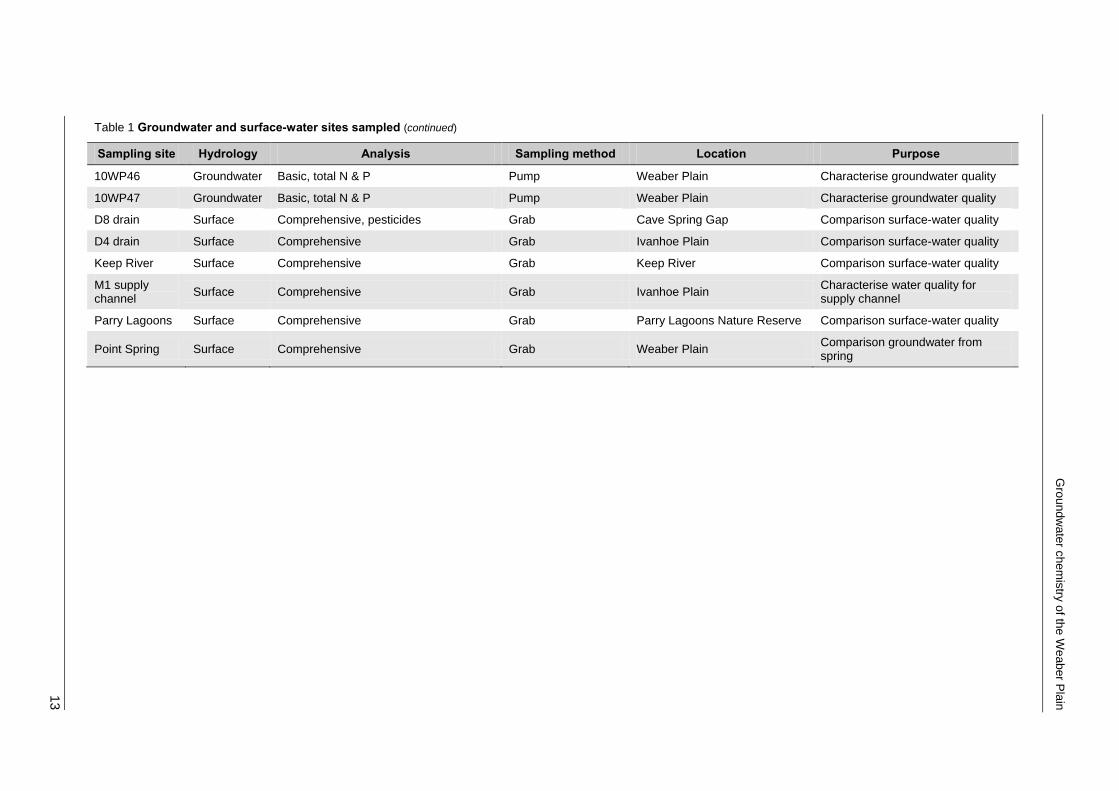
Thirty-two water samples were collected across the Weaber Plain and Ord River Irrigation Area (ORIA) during the 2010 dry season (August), consisting of six surface-water samples and 26 groundwater samples (Figure 4, Figure 5 and Table 1, Appendix C). Of the groundwater samples, 21 were collected from the Weaber Plain. All the bores (18 in total) that were drilled and completed in June and July 2010 for DAFWA (George et al. 2011) were sampled, along with seven existing DoW bores, to give a representative coverage of the proposed farming areas and buffer zones.
3.2.1 Sample collection
A QED MP-SP-6C low-flow pump was used to sample the existing DoW bores and four DAFWA bores that were to have the comprehensive chemical analyses (Figure 5 and Table1). Once the measured water-quality parameters (EC, pH and oxidation–reduction potential [ORP]) of the groundwater discharge had stabilised, water samples were collected. The remaining DAFWA bores were sampled with a bailer, as they had only recently been developed (less than six weeks prior to sampling), preparing them for water-quality sampling.
Surface-water samples were collected in the ORIA Stage 1 and on the Weaber Plain to provide background baseline hydrochemistry for comparison. Surface-water samples were collected with a thoroughly rinsed container. A more complete analysis of the surface-water chemistry of the Weaber Plain is presented by Bennett and George (2011).
Water samples for metal analysis were filtered and acidified. Samples for nutrient analysis were filtered. All water samples collected in the field were stored in a cooler, then transferred to a refrigerator. Nutrient samples were frozen. EC, temperature, pH, ORP and dissolved oxygen were measured in the field. Total alkalinity and total acidity were measured either in the field or within twelve hours of collection.

Groundwater chemistry of the Weaber Plain
10
Fig
ure
4 M
ap
sh
ow
ing
th
e lo
cati
on
s o
f sam
pli
ng
sit
es, w
ate
r ty
pe (
su
rfac
e-
or
gro
un
dw
ate
r),
sam
pli
ng
meth
od
s a
nd
ty
pe
of
ch
em
ica
l a
na
lysis
. S
ee
Fig
ure
5 f
or
deta
il o
f W
eab
er
Pla
in s
am
pli
ng
sit
es.

Groundwater chemistry of the Weaber Plain
11
Fig
ure
5 D
eta
il o
f W
eab
er
Pla
in w
ate
r-sam
pli
ng
sit
es,
wate
r ty
pe (
su
rface
- o
r g
rou
nd
wate
r),
sam
pli
ng
meth
od
s a
nd
ty
pe
of
ch
em
ical
an
aly
sis
(M
ap
Gri
d o
f A
us
trali
a,
Zo
ne 5
2).
See F
igu
re 4
fo
r an
overv
iew
of
all
sam
pli
ng
sit
es.

Gro
undw
ate
r chem
istry
of th
e W
eaber P
lain
12
Table 1 Groundwater and surface-water sites sampled
Sampling site Hydrology Analysis Sampling method Location Purpose
10WP39I Groundwater Comprehensive, pesticides, CFC Pump Weaber Plain Characterise groundwater quality
PB4M3D Groundwater Comprehensive, pesticides, CFC Pump Ivanhoe Plain Comparative groundwater quality
10WP33 Groundwater Comprehensive, pesticides, CFC Pump Weaber Plain Characterise groundwater quality
10WP36PB Groundwater Comprehensive, pesticides, CFC Pump Weaber Plain Characterise groundwater quality
WP17 Groundwater Comprehensive, pesticides Pump Weaber Plain Characterise groundwater quality
WP12M Groundwater Comprehensive Pump Weaber Plain Characterise groundwater quality
ORD22 (WP19) Groundwater Comprehensive Pump Weaber Plain Characterise groundwater quality
10WP35PB Groundwater Comprehensive Pump Weaber Plain Characterise groundwater quality
ORD20 (WP9) Groundwater Comprehensive Pump Weaber Plain Characterise groundwater quality
ORD21 (WP15) Groundwater Basic Pump Weaber Plain Characterise groundwater quality
WP16 Groundwater Basic Pump Weaber Plain Characterise groundwater quality
10WP32 Groundwater Basic Bailer Weaber Plain Characterise groundwater quality
10WP32PB Groundwater Basic, total N & P Pump Weaber Plain Characterise groundwater quality
10WP35N Groundwater Basic Bailer Weaber Plain Characterise groundwater quality
10WP35S Groundwater Basic Bailer Weaber Plain Characterise groundwater quality
10WP36N Groundwater Basic Bailer Weaber Plain Characterise groundwater quality
10WP36S Groundwater Basic Bailer Weaber Plain Characterise groundwater quality
10WP37 Groundwater Basic Bailer Weaber Plain Characterise groundwater quality
10WP38 Groundwater Basic Bailer Weaber Plain Characterise groundwater quality
10WP40 Groundwater Basic Bailer Weaber Plain Characterise groundwater quality
10WP41 Groundwater Basic Bailer Weaber Plain Characterise groundwater quality
WP5 Groundwater Basic Pump Weaber Plain Characterise groundwater quality
10WP42 Groundwater Basic, total N & P Pump Weaber Plain Characterise groundwater quality
(continued)
Gro
undw
ate
r chem
istry
of th
e W
eaber P
lain
13
Table 1 Groundwater and surface-water sites sampled (continued)
Sampling site Hydrology Analysis Sampling method Location Purpose
10WP46 Groundwater Basic, total N & P Pump Weaber Plain Characterise groundwater quality
10WP47 Groundwater Basic, total N & P Pump Weaber Plain Characterise groundwater quality
D8 drain Surface Comprehensive, pesticides Grab Cave Spring Gap Comparison surface-water quality
D4 drain Surface Comprehensive Grab Ivanhoe Plain Comparison surface-water quality
Keep River Surface Comprehensive Grab Keep River Comparison surface-water quality
M1 supply channel
Surface Comprehensive Grab Ivanhoe Plain Characterise water quality for supply channel
Parry Lagoons Surface Comprehensive Grab Parry Lagoons Nature Reserve Comparison surface-water quality
Point Spring Surface Comprehensive Grab Weaber Plain Comparison groundwater from spring

Groundwater chemistry of the Weaber Plain
14
Gro
undw
ate
r chem
istry
of th
e W
eaber P
lain
3.2.2 Sample analyses
Water samples were analysed for a range of inorganic parameters. There were two levels of analysis: basic and comprehensive (Table1). A list of analytes, analytical methods and detection limits is given in Appendix D. Pesticides (atrazine, simazine and related species plus endosulfan) were measured for six sites (Figure5). Water samples were analysed at the Chemistry Centre (WA) for inorganic species and pesticides.
Chlorofluorocarbon-11 (CFC-11) and Chlorofluorocarbon-12 (CFC-12) analysis was performed for four bores to estimate the relative age of these groundwaters (Figure 5 and Table 1). CFC analyses were performed by the CSIRO Land and Water Laboratory, Urrbrae (Adelaide). Triplicate samples were obtained with a low-flow pump following the methodology of Leaney (2007) and Puls and Barcelona (1996).
CFC-11 and CFC-12 concentrations in groundwater are measured by first stripping the CFC gas from the water sample under a stream of ultra-high-purity nitrogen gas. The CFC gas/nitrogen is then passed through a gas chromatograph where the CFC-11 and CFC-12 peaks are identified and measured separately. The CFC-11 and CFC-12 concentrations in the water are then converted to an age by determining the equivalent concentration in the atmosphere. The salinity of the water, recharge temperature (as determined by mean annual temperature) and surface elevation are required, and the resultant value is then matched to historically measured atmospheric data to give a CFC-11 and CFC-12 age. Analysis was undertaken by the CSIRO Isotope Analytical Service according to the method described by Busenberg and Plummer (1992).
3.3 Suitability of groundwater for irrigation
3.3.1 Assessment criteria
High salinities and sodium dominance can be problematic if the groundwaters were used for irrigation. High salinities can cause loss of production and death in plants, and high sodium levels in irrigation water can cause a decline in soil structure (USDA 1954). The sodium hazard is measured by the sodium absorption ratio (SAR), with the concentration of the ions expressed as milliequivalents per litre (meq/L):
2
CaMg
NaSAR
22
The USDA (1954) developed a classification system to assess the suitability of water for irrigation based on a series of hazard classes for sodium and salinity. Salinity can be estimated by measuring the electrical conductivity of water. The USDA developed their classification for salinity based on electrical conductivity1 and there are four classifications, C1 to C4. The sodium hazard is measured by SAR and also has four classifications, S1 to S4. These are shown in Table 2 and graphically in Figure 6.
1 Electrical conductivity is usually measured in mS/m. However the USDA (1954) used an earlier unit in
developing their classification system, micromhos/cm, which is equivalent to μS/cm
Note: 1 mS/m = 10 μS/cm

Groundwater chemistry of the Weaber Plain
15
Table 2 Salinity and sodium hazard classes (after USDA 1954)
Salinity hazard classes
Class EC (μS/cm) Description
C1 < 250 Low salinity water can be used for irrigation with most crops on most soils with little likelihood that soil salinity will develop. Some leaching is required, but this occurs under normal irrigation practices except in soils of extremely low permeability.
C2 251–750 Medium salinity water can be used if a moderate amount of leaching occurs. Plants with moderate salt tolerance can be grown in most cases without special practices for salinity control.
C3 751–2250 High salinity water cannot be used on soils with restricted drainage. Even with adequate drainage, special management for salinity control may be required and plants with good salt tolerance should be selected.
C4 > 2251 Very high salinity water is not suitable for irrigation under ordinary circumstances, but may be used occasionally under very special circumstances. The soil must be permeable, drainage must be adequate, irrigation water must be applied in excess to provide considerable leaching, and very salt tolerant crops should be selected.
Sodium hazard classes
Class Description
S1 Low sodium water can be used for irrigation on almost all soils with little danger of the development of harmful levels of exchangeable sodium.
S2 Medium sodium water will present an appreciable sodium hazard in fine-textured soils having high cation-exchange capacity, especially under low-leaching conditions, unless gypsum is present in the soil. This water may be used on coarse-textured or organic soils with good permeability.
S3 High sodium water may produce harmful levels of exchangeable sodium in most soils and will require special soil management—good drainage, high leaching, and organic matter additions. Gypsiferous soils may not develop harmful levels of exchangeable sodium from such waters. Chemical amendments may be required for replacement of exchangeable sodium, though amendments may not be feasible with waters of very high salinity.
S4 Very high sodium water is generally unsatisfactory for irrigation purposes except at low and perhaps medium salinity, where solution of calcium from the soil, or use of gypsum or other amendments, makes the use of these waters feasible.
The USDA (1954) classification was used by Ali et al. (2002) to assess the suitability of waters for irrigation. We have also used this classification system to assess suitability of groundwaters on the Weaber Plain for irrigation both directly and indirectly.
Ali et al. (2002) used the C3 category as the upper cut-off for assessing water as suitable for irrigation. The C3, high-salinity waters (EC between 75 mS/m and 225 mS/m) cannot be used on soils with restricted drainage and, even with adequate drainage, special management for salinity control may be required (USDA 1954). Furthermore, plants with high salt tolerance should be selected when irrigating with high-salinity waters (USDA 1954). As the soils of the Weaber Plain have high clay contents and potentially restricted drainage (Smolinski et al. 2011), we also used the C3 class (i.e. greater than 75 mS/m) as the upper salinity range for the suitability of irrigation waters.

Groundwater chemistry of the Weaber Plain
16
100 10000
6
13
19
26
32S
od
ium
Ha
zard
(SA
R)
250 750 2250C1 C2 C3 C4
S1
S2
S3
S4Sodium (Alkali) hazard:S1: LowS2: MediumS3: HighS4: Very high
Salinity hazard:
C1: LowC2: MediumC3: High
C4: Very high
Salinity Hazard (EC µS/cm)
C1-S4
C1-S3
C1-S2
C2-S4
C2-S3
C2-S2
C2-S1
C3-S4
C3-S3
C3-S2
C3-S1
C4-S4
C4-S3
C4-S2
C4-S1
C1-S1
Figure 6 USDA irrigation-water salinity and sodium hazard classes. The diagram shows hazard classes and cut-off thresholds (source: USDA 1954).
3.3.2 Assessment of groundwater for irrigation
Groundwater chemistry data was analysed in Microsoft Excel™ and AquaChem™ by Schlumberger Water Services. AquaChem™ has the in-built functionality to calculate salinity and hazard classes as per USDA (1954) classification and plot them.
Groundwater was first investigated for its suitability for direct irrigation. Then groundwater from various bores, chosen to provide a representative cross-section of groundwater quality for the Weaber Plain, was mixed with M1 supply-channel water at various ratios until the required water quality (< 75 mS/m) was reached. This was to estimate the level of dilution that would be required before groundwater would become suitable for irrigation. Waters from different sources were mixed, based on volumes and concentrations under the assumption that there were no chemical reactions to alter the ratio of ion concentrations.
3.3.3 Modelling water quality from mixing groundwater with supply-channel water
Under irrigation, the watertables beneath the Weaber Plain are forecast to rise (KBR 2011) and so would have the potential to induce salinity impacts on soils and surface waters (Ali et al. 2002). To manage the potential salinity issues, various groundwater-management scenarios (see KBR 2011) have been modelled (Appendix G). Under these scenarios, groundwater from the Ord palaeochannel under the Weaber Plain would be pumped to control watertable levels and disposed of either into the main supply channel or to the Keep River. The quality of water resulting from the mixing of groundwater with supply-channel water was modelled to assess its suitability for irrigation.

Groundwater chemistry of the Weaber Plain
17
To determine a representative composition of the pumped groundwater to be discharged into the supply channel, groundwaters from different parts of the Weaber Plain (bores: 10WP42, 10WP35PB, WP9 and 10WP32PB) were mixed in a model. The resultant water quality was then used as the groundwater quality input for further water-quality modelling.
Final water qualities were modelled for two different groundwater-pumping scenarios: the expected or most probable scenario, and the worst-case scenario. These were mixed with the supply-channel water assuming flow under both average and peak-flow conditions. Under the expected scenario, 4.4 GL of water would to be pumped from the palaeochannel over 200 days during the tropical dry season and discharged to the main supply channel (M2). Under a worst-case scenario, 6.15 GL of groundwater would be discharged to the main supply channel over 200 days. The resultant water quality of the M2 was modelled in AquaChem™ with flow rates in the supply channel of 540 ML/day under average conditions and 769 ML/day under peak-flow conditions (Table 3).
The water quality of the M2 supply channel was represented by water quality from the M1 supply channel. The supply rates of water from the ORIA Stage 1 under peak flows into the M2 supply water was determined by the total flow of the channel less groundwater inputs. The water quality was estimated by mixing total volumes and total loads from different water sources. The EC was estimated from total dissolved solids of the final water quality using a relationship developed from chemical sampling. This electrical conductivity was then used in subsequent analysis against USDA (1954) guidelines.
Table 3 Modelling scenario mixing different water sources at different ratios
Groundwater Flow rate (L/s)
Period (days)
4.4 GL groundwater pumped over 200 days 255 200
6.15 GL groundwater pumped over 200 days 356 200
Scenario Flow rate (L/s)
Mixing
ratio
Average channel flow * (540 ML/day)
Groundwater (4.4 GL for 200 days) 255 0.039
+ M1 supply channel 6 250 0.961
Total flow in channel 6 505 1.0
Groundwater (6.4 GL for 200 days) 356 0.054
M2 supply channel 6 250 0.946
Total flow in channel 6 606 1.0
Maximum channel flow (769 ML/day)
Groundwater (5 GL for 200 days) 255 0.029
+ M1 supply channel 8 645 0.971
Total flow in channel 8 900 1.0
Groundwater (6.4 GL for 200 days) 356 0.040
M2 supply channel 8 544 0.960
Total flow in channel 8 900 1.0
* Channel flow estimates: G. Munk, pers. comm.

Groundwater chemistry of the Weaber Plain
18
4. Results
4.1 Groundwater salinity trends
Figure 7 shows the linear regression describing the relationship between total dissolved solids and electrical conductivity for historical groundwater samples in the Kununurra area, based on the data presented by O’Boy et al. (2001). Besides the high R2 value, it is notable that, even though the groundwater samples were collected from the Ivanhoe, Weaber, Knox, Packsaddle and Mantinea plains, the relationship between TDS and EC was consistent for all groundwaters. This relationship was used to convert groundwater EC data to TDS for trend analysis. The groundwater salinity and water level plots for the Ivanhoe and Weaber plains are shown in Appendices A and B, respectively.
y = 0.61x
R2 = 0.98
0
5000
10000
15000
20000
25000
30000
35000
40000
0 10000 20000 30000 40000 50000 60000
EC (μS/cm)
TD
S (
mg
/L)
Figure 7 Linear regression equation for the relationship between total dissolved solids and electrical conductivity for groundwater samples in the Kununurra area (data from O’Boy et al. 2001, n = 85).
Groundwater levels under the Ivanhoe Plain have risen following clearing and development in the 1960s. They reached a new equilibrium at most bores in the late 1990s or early 2000s (Smith et al. 2007).
In response to irrigation and the increase in groundwater levels, six trend patterns were recognised in the Ivanhoe Plain groundwater salinity plots. These were:
decreasing: TDS values decreasing, usually as groundwater levels increased
increased variability: the variability of observed TDS values increased, usually as groundwater levels increased
increasing: TDS values increasing, usually as groundwater levels increased
no discernable trend: highly variable data, some possibly erroneous; the available data did not allow any trend to be confidently identified
no trend: TDS may be variable but remains within a relatively narrow range

Groundwater chemistry of the Weaber Plain
19
spike: TDS values increased then returned to a value approximating the originally observed value, generally, as the groundwater level reached a new equilibrium.
Groundwater salinity trends for all bores analysed are shown in Table 4 and summaries of the trends on the Ivanhoe and Weaber plains are shown in Table 5 and Table 6 respectively. A map of the bore locations classified by salinity trend is presented in Figure 8, and TDS values observed in 2009 are shown in Figure 9.
Table 4 shows that the mean groundwater salinity observed within the palaeochannel under the Ivanhoe Plain was 729 mg/L in 1984 (n = 20) and 750 mg/L in 2009 (n = 24). The table also shows that the mean groundwater salinity observed in bores outside the palaeochannel was 1918 mg/L in 1984 (n = 15) and 1958 mg/L in 2009 (n = 17). However, neither the observed groundwater salinities within the palaeochannel nor those observed elsewhere under the Ivanhoe Plain were normally distributed in 1984 or in 2009. The Mann-Whitney U (Wilcoxon rank-sum) tests revealed that, despite the quite different mean values shown in Table 4, the groundwater salinities within the palaeochannel were not statistically different to those observed under other parts of the irrigated area of the Ivanhoe Plain in 1984 or in 2009. Furthermore, 2009 groundwater salinities were not statistically different to those observed in 1984.
When only data from Ivanhoe Plain bores for which salinity observations in both 1984 and 2009 were considered, the mean groundwater salinity within the palaeochannel in 1984 was 675 mg/L and 947 mg/L in 2009 (n = 12). Similarly, the mean groundwater salinity outside the palaeochannel was 858 mg/L in 1984 and 562 mg/L in 2009 (n = 6). Again, the differences were not statistically significant.
Table 4 Groundwater salinity (as TDS) trends between 1984 and 2009 for bores on the Ivanhoe and Weaber plains grouped by hydrogeology, either within or outside the Ord palaeochannel
Bore Salinity observations
Salinity trend TDS TDS
change From To 1984 2009
Ivanhoe Plain – palaeochannel
4C 11-Jun-64 20-Oct-04 Increasing 750 1 500 100%
94-01 01-Feb-95 29-Apr-10 Spike 500 0%
94-02 01-Feb-95 29-Apr-10 Decreasing 180 -40%
94-13 01-Feb-95 30-Apr-10 Spike 230 -77%
94-24 01-Feb-95 30-Apr-10 No discernible trend 470
94-25 01-Feb-95 04-May-10 Increasing 150 50%
94-41 29-Mar-00 28-Apr-10 Spike 160 -36%
HI1-78 08-Jun-78 21-May-08 No trend 500 600 0%
HI3-78 11-Jun-78 23-May-05 Increasing 1 100 3 500 100%
ORD1 (CG3) 02-Jun-94 10-Nov-08 Increasing 600 50%
ORD3 (CG5) 03-Jun-94 23-Nov-05 Increasing 2 000 100%
ORD5 (CG1) 04-Jun-94 10-Nov-08 Spike 1 300 0%
ORD6 (CG2) 07-Jun-94 10-Nov-08 No trend 600 0%
PB1 31-May-83 23-Nov-05 No trend 350 400 0%
PB1M1 01-Jun-83 11-Nov-08 No trend 300 300 0%
PB1M4 03-Jul-83 29-Apr-10 Increasing 180 375 108%
PB2 08-Jun-83 23-May-05 Increasing 300 1 200 50%
(continued)

Groundwater chemistry of the Weaber Plain
20
Table 4 Groundwater salinity (as TDS) trends between 1984 and 2009 for bores on the Ivanhoe and Weaber plains grouped by hydrogeology, either within or outside the Ord palaeochannel (continued)
Bore Salinity observations
Salinity trend TDS TDS
change From To 1984 2009
PB2M1 08-Jun-83 23-May-05 Increased variability 300 1 000 50%
PB2M2 15-Dec-83 07-Nov-06 Increasing 276
PB2M4 15-Dec-83 03-May-05 No trend 334
PB4M3D 29-Mar-00 29-Apr-10 Decreasing 200 -88%
PN2D 13-May-83 24-Aug-08 Decreasing 3 800 -40%
PN2S 13-May-83 10-Nov-08 Increasing 300 39%
PN5D 11-May-83 11-Nov-08 Spike 650 730 -11%
PN5S 11-May-83 10-Nov-06 Increased variability 530 0%
PN6D 21-May-83 28-Apr-10 No trend 560 0%
PN6S 21-May-83 10-Nov-08 Decreasing 2 800 1 400 -50%
PN8D 11-May-83 10-Nov-08 Increased variability 330 120 0%
PN8S 11-May-83 23-May-05 No trend 380 0%
PN9D 06-May-83 10-Nov-08 Increased variability 540 240 0%
PN9S 06-May-83 07-Nov-06 Increasing 300 100%
PN11S 01-Apr-84 10-Nov-08 Increased variability 250 50%
Mean 729 750 16%
Ivanhoe Plain – non-palaeochannel
11C 29-May-64 25-May-95 No discernible trend 1 100
6D 07-May-82 28-Oct-92 No discernible trend 8 000
91-02 29-Mar-00 24-Aug-08 Spike 2 000 223%
94-14 29-Mar-00 04-May-10 No trend 2 100 0%
94-22 29-Mar-00 04-May-10 spike 120 -52%
94-32 01-Feb-95 24-Aug-08 No trend 600 0%
96-05 29-Mar-00 04-May-10 No trend 5 500 0%
96-06 29-Mar-00 24-Aug-08 No discernible trend 1 400 0%
ORD10 (GS4) 17-Jun-94 10-Nov-08 Increasing 10 000 233%
ORD12 (ML3) 18-Jun-94 10-Nov-08 No trend 600 0%
ORD4 (ML1) 04-Jun-94 23-Nov-05 Spike 2 500 0%
ORD41 (ML6) 29-Mar-00 04-May-10 Spike 100 -88%
ORD9 (GS2) 16-Jun-94 10-Nov-08 Spike 5 000 0%
PB3 28-Jun-83 22-Nov-05 No discernible trend 1 500
PB3M1 18-Jun-83 11-Nov-08 Increasing 1 500 2 000 33%
PB3M2 15-Dec-83 12-7-2000 Increasing 1 320
PB3M3S 03-Jul-83 10-May-02 No discernible trend 900
PN1S 18-May-83 10-Oct-08 Spike 5 300 0%
PN3D 18-May-83 06-May-93 Spike 1 200 -20%
PN3S 18-May-83 10-Nov-08 No trend 500 580 0%
PN7S 20-May-83 10-Nov-08 No trend 2 400 100 0%
(continued)

Groundwater chemistry of the Weaber Plain
21
Table 4 Groundwater salinity (as TDS) trends between 1984 and 2009 for bores on the Ivanhoe and Weaber plains grouped by hydrogeology, either within or outside the Ord palaeochannel (continued)
Bore Salinity
observations
Salinity trend
TDS TDS
change Bore
Salinity observati
ons
PN12S 27-May-83 10-May-02 Increasing 300 275%
PN14S 20-May-83 10-Nov-08 No trend 80 70 0%
PN15S 23-May-83 11-Jan-96 Decreasing -70%
V1506 03-Jul-83 10-Nov-08 No trend 70 120 0%
Mean 1 918 1 958 25%
Weaber Plain – palaeochannel
CS10 8-Aug-78 27-Nov-09 Increasing 400 880 76%
ORD8 (CG4) 15-Jun-94 10-Nov-08 Increasing 1 000 60%
WBS1112 2-Jul-83 25-Nov-09 No trend 560 600 0%
WP2 29-Aug-96 25-Nov-09 Increasing 570 714%
WP6 16-Sep-96 25-Nov-09 Increasing 830 105%
WP7 27-Aug-96 24-Nov-09 No trend 190 0%
WP11D 3-Nov-96 24-Nov-09 No trend 300 0%
WP15 29-Jul-94 30-Aug-10 No trend 12 000 0%
WP19 30-Jul-94 29-Aug-10 No trend 17 000 0%
Mean 480 3 708 106%
Weaber Plain – non-palaeochannel
CS2 15-Apr-84 30-Apr-04 Spike 100 0%
CS12E1R 15-Dec-83 26-Feb-05 Increasing 500 1 800 260%
CS12E2.5 2-Jul-83 25-Nov-09 Decreasing 3 000 2 100 -30%
CS13 2-Jul-83 18-Aug-88 No trend 560 0%
W2R 30-Jun-83 14-May-08 Decreasing 350 120 -76%
W5S1 4-May-83 30-Oct-08 Decreasing 2 800 400 -87%
W5S1.5 27-Jun-83 26-Oct-95 No trend 7 300 0%
W5S2R 24-Nov-06 27-Nov-09 Increasing 11 000 *
WP3 29-Aug-96 27-Nov-09 Increasing 90 29%
WP4 30-Aug-96 27-Nov-09 Increasing 90 29%
WP10 4-Nov-96 24-Nov-09 No trend 1 300 0%
WP12D 4-Nov-96 30-Aug-10 Decreasing 400 -84%
Mean 2 087 1 922 4%
* Strong increasing trend but time series too short to calculate % increase

Groundwater chemistry of the Weaber Plain
22
Table 5 Summary of groundwater salinity trends on the Ivanhoe Plain in response to development and irrigation
Salinity trend Palaeochannel bores
Other bores
Number % Number %
Decreasing 4 13% 1 4%
Increased variability 5 16% 0 0%
Increasing 10 31% 4 15%
No discernible trend 1 3% 5 19%
No trend 7 22% 8 31%
Spike 5 16% 8 31%
Total 32 26
Table 6 Summary of groundwater salinity trends on the Weaber Plain
Salinity trend Palaeochannel bores Other bores
Number % Number %
Decreasing 0 0% 4 33%
Increasing 4 44% 4 33%
No trend 5 56% 3 25%
Spike 0 0% 1 8%
Total 9 12

Groundwater chemistry of the Weaber Plain
23
Figure 8 Locations of groundwater bores on the Ivanhoe and Weaber plains classed by salinity trend (Map Grid of Australia, Zone 52)

Groundwater chemistry of the Weaber Plain
24
Figure 9 Locations of groundwater bores on the Ivanhoe and Weaber plains classed by TDS (mg/L), observed in 2009, overlain on AEM conductivity (mS/m) for 2–2.4 m BGL (Lawrie et al. 2010) (Map Grid of Australia, Zone 52)
4.2 Groundwater salinity trends by soil type
The mean observed groundwater salinity under Aquitaine soils on the Ivanhoe Plain was 2629 mg/L in 1984 (n = 7) and 2605 mg/L in 2009 (n = 11). By contrast, the mean groundwater salinities observed under Cununurra soils were 796 and 712 mg/L in 1984 (n = 21) and 2009 (n = 25) respectively. As with the analyses by hydrogeology, there was no statistically significant difference in groundwater salinity by soil type when only data from the Ivanhoe Plain were considered.
Groundwater chemistry of the Weaber Plain
25
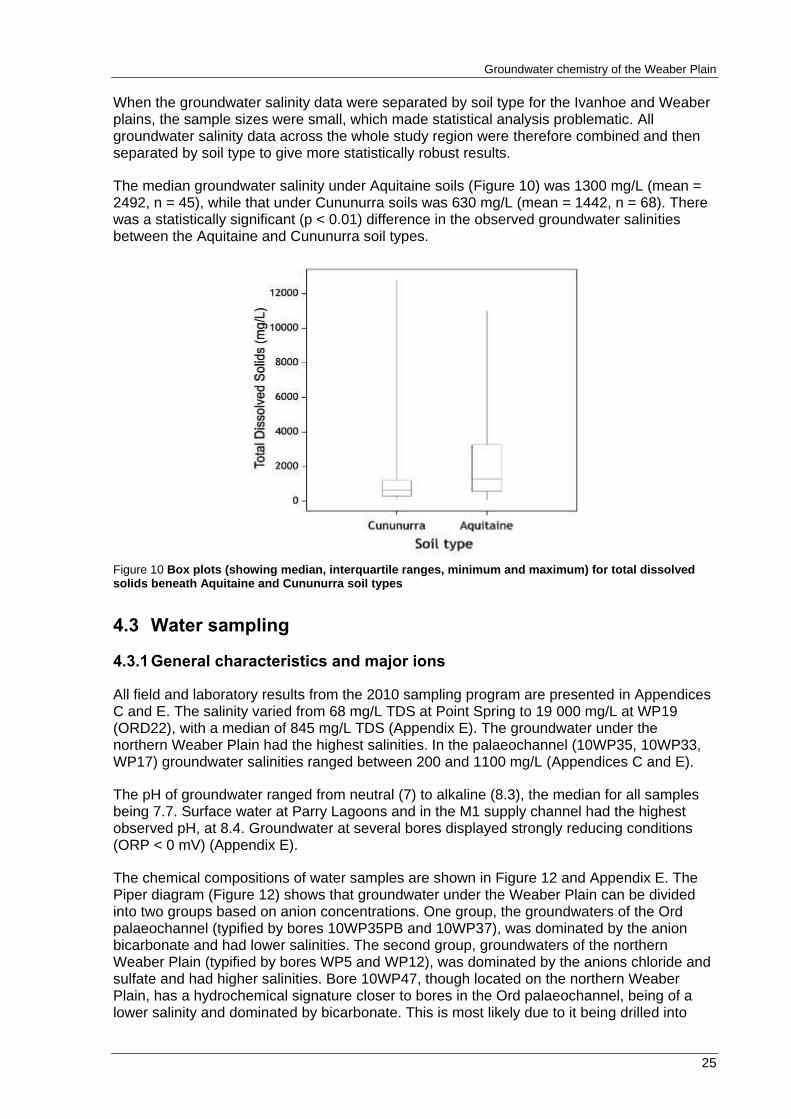
When the groundwater salinity data were separated by soil type for the Ivanhoe and Weaber plains, the sample sizes were small, which made statistical analysis problematic. All groundwater salinity data across the whole study region were therefore combined and then separated by soil type to give more statistically robust results.
The median groundwater salinity under Aquitaine soils (Figure 10) was 1300 mg/L (mean = 2492, n = 45), while that under Cununurra soils was 630 mg/L (mean = 1442, n = 68). There was a statistically significant (p < 0.01) difference in the observed groundwater salinities between the Aquitaine and Cununurra soil types.
Figure 10 Box plots (showing median, interquartile ranges, minimum and maximum) for total dissolved solids beneath Aquitaine and Cununurra soil types
4.3 Water sampling
4.3.1 General characteristics and major ions
All field and laboratory results from the 2010 sampling program are presented in Appendices C and E. The salinity varied from 68 mg/L TDS at Point Spring to 19 000 mg/L at WP19 (ORD22), with a median of 845 mg/L TDS (Appendix E). The groundwater under the northern Weaber Plain had the highest salinities. In the palaeochannel (10WP35, 10WP33, WP17) groundwater salinities ranged between 200 and 1100 mg/L (Appendices C and E).
The pH of groundwater ranged from neutral (7) to alkaline (8.3), the median for all samples being 7.7. Surface water at Parry Lagoons and in the M1 supply channel had the highest observed pH, at 8.4. Groundwater at several bores displayed strongly reducing conditions (ORP < 0 mV) (Appendix E).
The chemical compositions of water samples are shown in Figure 12 and Appendix E. The Piper diagram (Figure 12) shows that groundwater under the Weaber Plain can be divided into two groups based on anion concentrations. One group, the groundwaters of the Ord palaeochannel (typified by bores 10WP35PB and 10WP37), was dominated by the anion bicarbonate and had lower salinities. The second group, groundwaters of the northern Weaber Plain (typified by bores WP5 and WP12), was dominated by the anions chloride and sulfate and had higher salinities. Bore 10WP47, though located on the northern Weaber Plain, has a hydrochemical signature closer to bores in the Ord palaeochannel, being of a lower salinity and dominated by bicarbonate. This is most likely due to it being drilled into

Groundwater chemistry of the Weaber Plain
26
alluvial sediments. Bores 10WP42, 10WP46, 10WP39 and ORD20 (WP9) had chemical compositions between that of bores located in the palaeochannel and the saline northern Weaber Plain bores. With the exception of ORD20 (WP9), these bores are drilled into similar alluvial sediments to those found at 10WP47.
The dominant cation at most bores under the Weaber Plain and the ORIA is sodium. The main exceptions were chemistries reflective of the basement geology: for example, groundwater at bore WP5 was dominated by magnesium and calcium and also had the highest iron concentration (Drever 2002). This is reflective of the basalt basement underlying this location (Appendix C, also see the geology map presented by George et al. 2011, p. 6). Ferromagnesian minerals and calcic plagioclase within the basalt are the likely source of the high proportion of iron, magnesium and calcium in the groundwater. Bores 10WP47, 10WP39 and WP16 are dominated by calcium, which is likely due to the groundwater interacting with calcarenite or limestone (CaCO3) in the formation (Appendix C).
The hydrochemistry of surface waters is also variable. Bicarbonate is the dominant anion in the M1 supply channel. However, waters in the irrigation drainage network had altered slightly in composition, having higher proportions of chloride (relative to the M1) in the D4 and D8 disposal drains (Figure 12, Appendix C and Appendix E).
4.3.2 Minor ions and nutrients
Much of the groundwater exceeded the Australian and New Zealand Environment and Conservation Council / Agriculture and Resource Management Council of Australia and New Zealand (ANZECC/ARMCANZ 2000) irrigation guideline values for minor ions (see Appendix D). Nine bores exceeded the long-term trigger value for boron, which is toxic to some plants. However, most of the bores with high boron concentrations are also highly saline, and are located in the buffer areas that will not be irrigated or pumped under the proposed management plans.
The nutrient values in groundwater across Weaber Plain are generally low. The average total nitrogen of groundwater was 0.48 mg/L and the average total phosphorus was 0.11 mg/L.
4.3.3 Chlorofluorocarbons
The results of the CFC analyses are shown in Table 7. The youngest groundwaters, occurring in bores PB4M3D and 10WP33, are dated to a median origin of 1982.
The bores 10WP36PB and 10WP39 also had CFCs present at values similar to the background value, which indicates that they are relatively young waters that have received modern recharge (Fred Leaney, CSIRO, pers. comm.).
Table 7 CFC concentrations and apparent age of groundwaters thus determined
Sample Measured CFC Equivalent atmos. Apparent age
Concentration in water concentration
CFC11 CFC12 CFC11 CFC12 CFC11 CFC12
(pg/kg) (pg/kg) (pptv)* (pptv) (years) (years)
10WP36PB 30 45 25 151 1965 1972
10WP39 63 31 53 103 1970 1969
10WP33 129 92 109 312 1975 1982
PB4M3D 122 92 104 316 1975 1982
*pptv – parts per trillion by volume

Groundwater chemistry of the Weaber Plain
27
4.3.4 Pesticides
No pesticides (Appendix E, Table E2) were detected in groundwaters on the Weaber Plain. Low concentrations of atrazine (0.16 µg/L) found in groundwater at PB4M3D in the central Ivanhoe Plain (Figure 4) were below the ANZECC/ARMCANZ 2000 water-quality guideline trigger values.

Groundwater chemistry of the Weaber Plain
28
Fig
ure
11 S
uit
ab
ilit
y o
f g
rou
nd
wate
r fo
r ir
rig
ati
on
in
th
e W
eab
er
Pla
in f
arm
lan
ds b
as
ed
on
US
DA
(195
4)
sa
lin
ity
cla
ss
ific
ati
on
s (
Ma
p G
rid
of
Au
str
ali
a,
Zo
ne
52).
Cir
cle
s d
en
ote
rec
en
t o
bserv
ati
on
s (
2009
or
late
r);
sq
uare
s d
en
ote
1984 o
bserv
ati
on
s.
So
ils a
s m
ap
ped
by
Sm
oli
ns
ki
et
al.
(20
12
).

Groundwater chemistry of the Weaber Plain
29
Ca
2+
CA
TIO
NS
Mg2+
Na+ + K
+
CO3
2- + H
CO3
-
SO4
2-
Cl-
AN
ION
S
SO4
2- + C
l-
Ca2+ + M
g2+
EX
PL
AN
AT
ION
Su
pp
ly d
rain
Ex
it d
rain
Du
ma
s L
oo
ko
ut
(PB
4M
3D
)
10
WP
47
No
rth
ern
We
ab
er
Pla
in
Pa
lae
oc
ha
nn
el
Inte
rme
dia
te g
rou
nd
wa
ters
Po
int
Sp
rin
g
Ke
ep
Riv
er
Pa
rry
s L
ag
oo
n
Se
aw
ate
r
Fig
ure
12 P
iper
dia
gra
m s
ho
win
g t
he m
ajo
r io
n c
om
po
sit
ion
of
sam
ple
s c
oll
ecte
d

Groundwater chemistry of the Weaber Plain
30
4.4 Suitability of groundwater for direct and indirect irrigation
4.4.1 Suitability of groundwater for direct irrigation
The suitability of a range of water samples for irrigation, with respect to salinity and sodicity, are shown in Figure 13. The electrical conductivities of groundwater across the Weaber Plain were mostly in the high salinity range (75 to 225 mS/m) (Figure 11), only groundwater from Point Spring being in the lowest hazard category. All surface water and drain samples are in the moderate salinity range (C2) and in the lowest sodium hazard class (S1). The lower salinity groundwaters were located in the palaeochannels, of which only 10WP31 and 10WP47 are suitable for direct irrigation (Figures 11 and 13). These bores were in the C2 moderate category.
Most groundwater in the palaeochannel was in the high salinity (C3) category (USDA1954) and unsuitable for direct use for irrigation. The groundwater must therefore be mixed with lower salinity water, such as that from the M2 supply channel, before being suitable for irrigation. The groundwaters in the northern part of the Weaber Plain have much higher salinities and would need to be diluted at even greater rates.
Figure 13 The suitability of water samples for irrigation. Note: any site with an electrical conductivity above 500 mS/m exceeds the upper limit of the graph.
To gain an understanding of the dilution rates required, groundwaters from representative bores on the Weaber Plain were mixed with M1 supply channel water in the AquaChem™ hydrochemical model. The waters were mixed at various ratios until an electrical conductivity

Groundwater chemistry of the Weaber Plain
31
below 75 mS/m (C3, high salinity) was reached (See Figure 11 and Figure 14). The groundwater from the palaeochannel needed to be diluted 1:1 with supply channel water before it became suitable for irrigation. Saline groundwater from the northern Weaber Plain needed be diluted by 50:1 with supply channel water before it became suitable for irrigation (Table 8).
Table 8 The maximum rate groundwater can be mixed with the M1 supply without exceeding 75 mS/m (C3 high salinity hazard) and resulting water quality
Bore Mixing ratio *
Na (mg/L)
K (mg/L)
Ca (mg/L)
Mg (mg/L)
Cl (mg/L)
HCO3 (mg/L)
SO4 (mg/L)
pH EC (mS/m)
10WP33 53:47 84.5 2.8 31.4 27.3 91.3 260.5 31.0 8.3 74.5
10WP36PB 53:47 99.9 2.1 21.9 16.3 43.0 357.5 30.3 8.1 74.5
10WP39 53:47 55.5 12.1 51.9 17.6 66.3 215.5 96.3 8.1 75.0
ORD8 (CG4)
51:49 98.9 3.2 28.4 28.0 89.4 266.7 44.5 8.3 74.7
WP5 10:90 44.3 2.6 40.5 49.5 120.4 182.3 82.6 8.3 74.2
WP12M 7:93 93.2 5.3 28.9 21.9 115.0 155.4 74.7 8.2 72.4
WP15 2:98 97.1 2.4 16.3 13.0 101.7 161.4 55.0 8.4 62.2
WP17 79:21 113.9 2.9 21.6 19.6 52.3 340.5 26.5 7.7 74.8
*volume fractions (i.e. 53:47 is 53% M1 supply water: 43% groundwater by volume)
Figure 14 The suitability for irrigation of groundwater mixed with the M1 supply-channel water at different mixing rates. Water from the supply channel is added in 1% increments to groundwater from each bore.

Groundwater chemistry of the Weaber Plain
32
4.4.2 Modelled water quality from mixing scenarios
The modelled water qualities from different groundwater pumping scenarios are shown in Table 9. Under the expected case, where groundwater is pumped into the main supply channel, at its average flow rate, over 200 days, the modelled water quality was 178 mg/L TDS. With the supply channel at peak flow, the water quality improved slightly, to 167 mg/L.
Under the worst-case scenario when groundwater is pumped at maximum rate into the supply channel under average flow conditions, the modelled water quality is 193 mg/L TDS. With maximum flow in the supply channel, it improves to 179 mg/L TDS.
The suitability of modelled water qualities was assessed against USDA (1954) irrigation classifications as shown in Figure 15.
Table 9 Water quality resulting from hypothetically mixing different water sources in AquaChem™
Water source
pH TDS
(mg/L) EC
(mS/m) Na
(mg/L) K
(mg/L) Ca
(mg/L) Mg
(mg/L) Cl
(mg/L) SO4
(mg/L) HCO3 (mg/L)
Source waters
Average groundwater
7.8 1162 180 288.0 9.0 67.0 53.0 276.0 183.0 522.0
M1 8.4 196 25 19.7 2.3 15.3 8.2 16.0 6.5 128.0
Modelled mixing scenarios
Groundwater (4.4 GL) average channel flow
8.4 178 32 30.2 2.6 17.3 10.0 26.2 13.4 143.4
Groundwater (6.15 GL) average channel flow
8.3 193 34 34.2 2.7 18.1 10.6 30.0 16.0 149.2
Groundwater (4.4 GL) peak channel flow
8.4 167 30 27.4 2.5 16.8 9.5 23.4 11.6 139.3
Groundwater (6.15 GL) peak channel flow
8.4 179 32 30.4 2.6 17.4 10.0 26.4 13.6 143.8

Groundwater chemistry of the Weaber Plain
33
Figure 15 The suitability of mixed water sources for irrigation

Groundwater chemistry of the Weaber Plain
34
5. Discussion
5.1 Groundwater salinity
One of the main aims of this study was to provide insight into the potential for groundwater salinity change on the Weaber Plain after development for irrigated agriculture. To meet this aim, an analysis of groundwater salinity trends within the nearby Ivanhoe Plain was undertaken. During the analysis of the time-series data, some data-quality issues became evident; some of the more important are discussed below.
Correlations between groundwater salinity and hydrogeology and between groundwater salinity and soil type were also performed. These analyses revealed that groundwater salinities under both the Ivanhoe and Weaber plains are highly variable. The implications of this high variability on determining average groundwater salinities are also discussed.
5.1.1 Data quality
Groundwater salinity trends were determined for 58 bores on the Ivanhoe Plain and 21 on the Weaber Plain, which constitute 90 per cent of the bores for which time-series data are available. Five trend patterns were recognised, but no discernible trend could be recognised for six bores on the Weaber Plain. Although the data from these bores did not contribute to the determination of temporal trends, it was included in determining mean groundwater salinities within and outside the Ord River palaeochannel, and for Cununurra versus Aquitaine soils.
For most of the bores for which no trend could be determined, the available data was highly variable and/or the sampling frequency was inadequate to allow trends to be identified as shown in Figure 16. At several bores, groundwater salinity profiles were measured on some occasions, but insufficient data was recorded to allow determination of the most representative value; see for example Figure 17.
Another issue that made determining temporal groundwater salinity trends difficult to discern occurred at five bore sites on the Ivanhoe for which an increasing variability in groundwater salinity was observed (see for example Figure 18). The potential exists that this high variability is a result of confusion between EC units (e.g. μS/m confused with mS/m), as is more obvious in the salinity plots for some other bores. While there is some doubt about the magnitude of the variability displayed, the general rising trends appear to be real.

Groundwater chemistry of the Weaber Plain
35
11C
0
1000
2000
3000
19
64
19
68
19
72
19
76
19
80
19
84
19
88
19
92
19
96
20
00
20
04
20
08
TD
S (
mg
/L)
-12
-8
-4
0
Wate
r Level (m
BG
L)
TDS Water level
Figure 16 Groundwater salinity and water-level trends for bore 11C on the Ivanhoe Plain, showing no discernible trend in groundwater salinity due to outliers and inadequate sampling frequency
PB3
0
1000
2000
3000
4000
19
64
19
68
19
72
19
76
19
80
19
84
19
88
19
92
19
96
20
00
20
04
20
08
TD
S (
mg
/L)
-16
-12
-8
-4
0
Wate
r Level (m
BG
L)
TDS Water level
Figure 17 Groundwater salinity and water-level trends for bore PB3 on the Ivanhoe Plain, showing no discernible trend in groundwater salinity due to profile sampling and inconsistent sampling frequency

Groundwater chemistry of the Weaber Plain
36
PN8D
0
500
1000
1500
19
64
19
68
19
72
19
76
19
80
19
84
19
88
19
92
19
96
20
00
20
04
20
08
TD
S (
mg
/L)
-15
-10
-5
0
Wate
r Level (m
BG
L)
TDS Water level
Figure 18 Groundwater salinity and water-level trends for bore PN8D on the Ivanhoe Plain, showing increasing variability in groundwater salinity but no overall trend
5.1.2 Ivanhoe Plain groundwater salinity
Forecasting the salinity change on the Weaber Plain under irrigation can be achieved either by using the historic record from an analogous environment (Ivanhoe Plain) or modelling (see KBR 2011). Results above show that the average salinity within the palaeochannel under the Ivanhoe Plain increased three per cent, from 729 to 750 mg/L (1984 and 2009), while the average salinity for bores outside the palaeochannel increased from 1918 to 1958 mg/L between 1984 and 2009 (a 2 per cent increase).
While considering the average is the appropriate method for forecasting future salinity change, it conceals the behaviour of individual bores or groups of bores. For example, while the Ivanhoe’s salinity levels remained largely unchanged, the average of the changes at individual bores over that period varied from 16 per cent to 24 per cent (Table 4). The largest proportional increases in salinity occurred at bores where the groundwater salinity was relatively low (< 1500 mg/L) in 1984 (Figure 19). Furthermore, bores with high TDS values in 1984 displayed either no trend or a decreasing trend between 1984 and 2009.
-200%
-100%
0%
100%
200%
300%
0 1000 2000 3000 4000 5000 6000
TDS 1984 (mg/L)
Pro
po
rtio
nal
TD
S c
han
ge
Figure 19 Proportional groundwater salinity (as TDS) change as a function of 1984 salinity level for Ivanhoe Plain bores

Groundwater chemistry of the Weaber Plain
37
The maximum salinities observed within the palaeochannel were 3800 and 3500 mg/L in 1984 and 2009 respectively. The corresponding figures for Ivanhoe Plain bores outside the palaeochannel were 8000 and 10 000 mg/L, respectively.
This analysis highlights the fact that the averages of salinity values, either by hydrogeological setting or by time, are dominated by outliers. This is consistent with the non-normality of the distributions of TDS values and the lack of a statistically significant difference between the observed TDS values within the palaeochannel as compared to those outside it. This is despite the visual impression conveyed in Figure 9 that the groundwater in the palaeochannel was fresher than the groundwater elsewhere on the Ivanhoe Plain.
5.1.3 Groundwater interaction with supply and drainage channels
Smith et al. (2007) noted that the watertable beneath the northern Ivanhoe Plain has now intercepted the deeper, main irrigation drains, and that the drains appeared to discharge groundwater, helping to stabilise further watertable rise. There are two lines of evidence from the analyses presented here that are consistent with the groundwater being in hydraulic connection with the deeper drainage channels, and possibly the supply channels, on the Ivanhoe Plain.
Firstly, there are five bores that displayed decreasing salinity trends since about 2000, all of them being within 300 m of a main supply channel or drain (Figure 8). In most cases there had been an increasing salinity trend after irrigation commenced, followed by a distinct downward trend commencing around 2000 or 2001 (see Figure 20). The year 2000 was the wettest on record at the Kimberley Research Station rain gauge and it was when groundwater under the Ivanhoe Plain intercepted the drains and reached a new dynamic equilibrium.
Secondly, there are several nested bore sites at which the groundwater salinities observed in the deep and shallow bores have converged, as shown in Figure 21 for site PN2. Furthermore, the vertical gradient at this site reversed from being permanently downward to permanently upward at the end of the 1997 dry season, indicating that the relatively fresh water responsible for the sustained reduction in TDS at bore PN2D was not a result of vertical recharge at the site.
The most plausible explanation for this salinity response is that, once the watertable and drains were permanently hydraulically connected, the aquifer received fresh recharge from the drains and the salinity dropped. These salinity responses are consistent with the earlier conclusions of Smith et al. (2007).

Groundwater chemistry of the Weaber Plain
38
PN12D
0
1,000
2,000
3,000
19
64
19
68
19
72
19
76
19
80
19
84
19
88
19
92
19
96
20
00
20
04
20
08
TD
S (
mg
/L)
-12
-8
-4
0
Wate
r Level (m
BG
L)
TDS Water level
Figure 20 Groundwater salinity and water-level trends for bore PN12D on the Ivanhoe Plain, showing spike groundwater salinity response
PN2
0
2000
4000
6000
8000
10000
19
64
19
68
19
72
19
76
19
80
19
84
19
88
19
92
19
96
20
00
20
04
20
08
TD
S (
mg
/L)
-10
-8
-6
-4
-2
0
Wate
r Level (m
BG
L)
TDS: PN2D TDS: PN2S Water level: PN12D
Figure 21 Groundwater salinity and water-level trends for bores PN2D and PN2S on the Ivanhoe Plain
5.1.4 Weaber Plain groundwater salinity
The majority of bores (62 per cent) on the Weaber Plain exhibited no trend, a decreasing trend or a spike response in groundwater salinity. Weaber Plain bores for which increasing groundwater salinity trends were observed were clustered in the western area of the plain north of Cave Spring Gap (Figure 8). Groundwater levels in this area have increased since the development of irrigated agriculture on the Ivanhoe Plain. However, there are also some bores in this area that exhibit no salinity trend despite groundwater-level increases. Most increases in groundwater salinity were of the order of 500 mg/L over the period of record, and the maximum increase was 4000 mg/L at bore W5S2R.
The mean 2009 groundwater salinity within the Ord palaeochannel under the Weaber Plain was 3708 mg/L (Table 4). This result was heavily influenced by the high observed salinities at bores WP15 and WP19, in the north-east of the plain (Figure 9), where groundwater levels are deep and there is no apparent trend in salinity. The mean of the groundwater salinities at all other bores within the palaeochannel under the Weaber Plain was 624 mg/L in 2009. The

Groundwater chemistry of the Weaber Plain
39
2010 figure for a representative selection of bores on the Weaber Plain, including bores drilled in 2010, was 1162 mg/L (Table 9).
5.1.5 Summary
Despite some data-quality issues, groundwater salinity trends could be determined for 90 per cent of the bores on the Ivanhoe Plain for which time-series data were available, and the majority of them (65 per cent of the total) displayed non-increasing salinity trends (Table 5). Furthermore, only a small increase in the mean groundwater salinity under the Ivanhoe Plain between 1984 and 2009 was identified; the largest proportional increases occurred at bores with very fresh groundwater and this contributed little to the average salinity increase (Figure 19).
There is evidence to support the earlier conclusion (Smith et al. 2007) that there is now interaction between the aquifer and the deeper irrigation drains, and perhaps the supply channels. This interaction has stabilised groundwater levels and possibly acted to reduce groundwater salinity at some sites.
Groundwater salinities under the Ivanhoe and Weaber plains are much more strongly correlated to soil type than to hydrogeology, groundwater salinities under Cununurra soils being significantly lower than under Aquitaine soils. The mean groundwater salinity in the Ord palaeochannel under the Weaber Plain, from which groundwater will be pumped if watertable control is required was 1162 mg/L in 2010.
5.2 Groundwater age
Chlorofluorocarbon (CFC) analyses (Table 7) indicated that the median origin age of groundwaters sampled from bores PB4M3D and 10WP33 is about 1982. Bore PB4M3D, on the Ivanhoe Plain, would have received recharge from irrigation water. The young age of waters in 10WP33 (Weaber Plain) is likely due to the high relative vertical hydraulic conductivities of soils in the area (0.4 m/day) compared to other soils (0.04 m/day), allowing for more rapid rainfall recharge (Smolinski et al. 2011).
Tickell et al. (2007) also measured CFCs in groundwater bores located 10 to 20 kilometres east of the Weaber Plain on similar soils. They found significant concentrations in only two groundwater bores. They used these results to suggest that there has been no recent recharge to groundwater. However, some of the bores in question (for example RN029519) show seasonal changes in water level which indicate that they do receive recharge. Further evidence of recent groundwater recharge on the Weber Plain is presented by George et al. (2011).
5.3 Suitability of Weaber Plain groundwater for irrigation
Under USDA (1954) irrigation guidelines, most of the groundwater on the Weaber Plain is unsuitable for direct irrigation due to its high salinity. Only bores 10WP31 and 10WP47 were suitable for direct irrigation, though they had medium salinity (C2). Under the guidelines, medium-salinity water can be used to irrigate plants with a moderate salt tolerance, without special practices for salinity control, if a moderate amount of leaching occurs (Figure 11 and Figure 13).
Due to the high salinity of the groundwater, it needs to be diluted with lower salinity water such as that supplied to the Ord River Irrigation Area via the M1 channel. The groundwater from the Weaber Ord River palaeochannel on average becomes suitable for irrigation when diluted by half with water from the supply channel. The groundwater under the Aquitaine soils
Groundwater chemistry of the Weaber Plain
40
has the highest salinities on the Weaber Plain and would need to be diluted by as much as 100 times with supply-channel water before it became suitable for irrigation.
Groundwater modelling by KBR (2011) indicated that under the expected case, 4.4 GL of groundwater would need to be pumped into the main supply channel over 200 days. The resultant modelled water quality of the mixed water supplies ranged from 167 to 178 mg/L TDS depending on the flow in the supply channel. Likewise, under the worst-case scenario, where 6.15 GL of groundwater was pumped into the supply channel over 200 days, the resultant modelled quality of the mixed waters was between 179 and 193 mg/L TDS.
Under these modelled conditions, the mixed groundwater and supply channel water is suitable for irrigation according to the USDA (1954) guidelines.
5.4 Future water-quality monitoring
An ongoing water-quality monitoring program has been developed for the life of the development. Details of the recommended program, outlined below, are reflected in the groundwater and discharge management plans (Strategen 2012a, b).
A network of 58 groundwater monitoring bores at 44 sites is recommended. These bores will be monitored by the Environmental Management Entity to be established under the Ministerial Approvals process stipulated by the Environmental Protection and Biodiversity Conservation Act 1999 (Commonwealth of Australia).
Recommendations for bore sites are based on the following criteria:
use in risk assessment: to ensure watertable and salinity risk areas defined in the soil mapping (Smolinski et al. 2011), the groundwater modelling (KBR 2011) and Geoscience Australia salinity risk assessment (Lawrie et al. 2010) are covered
data continuity and quality for future monitoring and modelling: existing bores were assessed and if suitable were retained, replacement bores were re-drilled as close as feasible, at a location safe from the impact of construction and clearing if required
proximity to potential impacts on areas of Matters of National Environmental Significance (NES) (e.g. buffers, finch habitat, Keep River)
distribution for use in enacting groundwater-management triggers and measuring the subsequent response
site location-longevity: selected bores had to be in areas where they would not be destroyed or disturbed by clearing and would remain useful given potential longer term development in the area (e.g. mining)
aquifer units: selected to enable the detection of impacts, including vertical variability, on the major aquifers
bore construction: ensuring adequate records to clarify location geology, aquifer screened, regolith material and headwork/bore integrity,
redundancy: ensuring that sufficient bores exist in key areas in case there emerges a requirement for more precise (scale) information and as a tactic to manage damage to important bores.
The network includes bores defined as high intensity, low intensity, high intensity reference and low intensity reference (Table 10, Figure 22). The high-intensity bores are distributed by aquifer type across the development area, though the majority are located in the main groundwater flow paths (e.g. palaeochannel), as these will be the focus of future

Groundwater chemistry of the Weaber Plain
41
groundwater management. Additional high-intensity bores (outside the Weaber development, called reference bores) will be used to assess the relative impacts of clearing and irrigation. Groundwater levels at high-intensity bores will be monitored using data loggers (Figure 22). The high-intensity bores will also be used to provide representative samples of groundwater composition for their locations and any major changes in groundwater chemistry will be first detected in these bores.
The high-intensity bores will be augmented by a well-distributed network of others that will be monitored less frequently and known as low-intensity bores. Some low-intensity bores will be nested with high-intensity bores to enable vertical hydraulic gradients and water-quality differences to be assessed. In addition, each farm will be required to have a groundwater monitoring bore.
The high-intensity bores should be monitored seasonally to collect baseline data before the commencement of irrigation and then used for future ongoing monitoring. To ensure sufficient data is collected for comparison to the ANZECC/ARMCANZ (2000) water quality guidelines, it is recommended that parameters outlined in Appendix H be analysed.
Once the baseline data is collected, the comprehensive analysis should be reviewed. Based on the initial analysis in this report, and assuming there are no significant deviations in baseline chemistry, ongoing sampling could be reduced in frequency to once every three years, with seasonal monitoring remaining for field parameters and key analytes as outlined below. Any major changes in the composition of the groundwater will be detected by changes in EC, pH or ORP. A shift in these parameters exceeding a trigger value should result in a return to comprehensive chemical analysis. A recommended trigger value would be a 20 per cent deviation from the median baseline values for ORP and EC. For pH, a trigger value of 50 per cent variation in hydrogen ion concentrations is recommended. On exceedence of the trigger values, the comprehensive analysis should resume until the variation has been explained or managed.
Sampling at the high-intensity bores should also be used as means of regional assessment for pesticides. Atrazine is suggested as the key analytical element for regular testing. This is based on the fact that atrazine is the only pesticide detected in groundwater within the existing irrigation areas by this study or by Smith et al. (2007). Atrazine is also highly mobile and is therefore an ideal indicator species. It should be tested for on a seasonal basis and, if it is detected in high-intensity bores, the monitoring should be escalated to include low-intensity bores. Other pesticides (see Smith et al. 2007) can then be tested for on the basis of their use within the irrigation area.
Comprehensive analyses for nutrient species, as outlined in Appendix H, should be performed seasonally to establish baseline conditions, and then repeated every three years. In the intervening periods, analyses for total nitrogen and total phosphorus should be performed on a seasonal basis. Any major increases in nutrients in groundwater will be detected through the analysis of total values. If there is a significant increase in totals (greater than 20 per cent) then comprehensive nutrient analysis should be undertaken.
The low-intensity bores should have comprehensive analyses undertaken during the baseline period to gain a broad picture of groundwater quality. These should then be analysed over two years on a seasonal basis for the field parameters (water levels, EC, pH, ORP), nutrients (total nitrogen, total phosphorus) and pesticides (atrazine). After the baseline assessment, it is recommended that the bores be monitored seasonally for field parameters and annually for the above nutrients and pesticides. Any deviation from baseline conditions or exceedence of trigger values will then require comprehensive analysis as per Appendix H.

Groundwater chemistry of the Weaber Plain
42
The farms bores should be monitored annually at the end of each dry season for water levels, EC and pH.
Table 10 Recommended network of groundwater-monitoring bores
Bore Site ID Comment
High intensity (logger)
10WP33 10WP33 West palaeochannel
10WP37 10WP37 West palaeochannel
10WP39 10WP39 Aquitaine, low salinity, permeable aquifer
11CS10RD 11CS10R Re-drilled to enable continuity with records from 1960s
11CS10RS 11CS10R Re-drilled to enable continuity with records from 1960s, shallow bore to detect recharge response
11WP11RD 11WP11R Re-drilled 1996 bore on palaeochannel in low risk, deep watertable area
11WP11RS 11WP11R As above, shallow bore to detect recharge response
11WP15R 11WP15R Re-drilled 1996 bore on palaeochannel in low risk, deep watertable area
11WP43D 10WP43 Aquitaine, deep watertable, saline groundwater, longer term risk
11WP51D 11WP51 Aquitaine, Buffer, deep watertable, long-term risk
11WP51S 11WP51 As above, loggers in upper and lower aquifer to assess recharge hydraulics
11WP52D 11WP52 Eastern palaeochannel, deep watertable, low salinity risk
11WP56D 11WP56 Bore adjacent to Keep River to detect changes due to development and climate
11WP57 11WP57 Palaeochannel down-gradient from development
11WP9RS 11WP9R Re-drilled 1996 bore on palaeochannel in low risk, deep watertable area
CG4 CG4 Palaeochannel, likely to be the first bore to respond to works and clearing
LIMESTONE LIMESTONE Existing shallow watertable
RN029660 RN029660 Midway between development and Keep River to measure impact
WP13 WP13 Aquitaine, medium risk, assess impact on buffer
WP5 WP5 Long term, high risk, west of area of delayed clearing
Low intensity (manual)
10WP31 10WP31 Mid palaeochannel, in Buffer, area defined medium-term risk
10WP32 10WP32 As above
10WP32PB 10WP32 As above, 150 mm bore drilled to test aquifer
10WP35N 10WP35 West palaeochannel, short-term risk from shallow watertable, planned first pumping site
10WP35PB 10WP35 As above, this bore is a pumping bore tested at 25 L/s, < 1000 mg/L
10WP35S 10WP35 West palaeochannel, short-term risk from shallow watertable, planned first pumping site
10WP36N 10WP36 As above
10WP36PB 10WP36 As above, this bore is a pumping bore tested at 25 L/s, < 1000 mg/L
10WP36S 10WP36 West palaeochannel, short-term risk from shallow watertable, planned first pumping site
(continued)
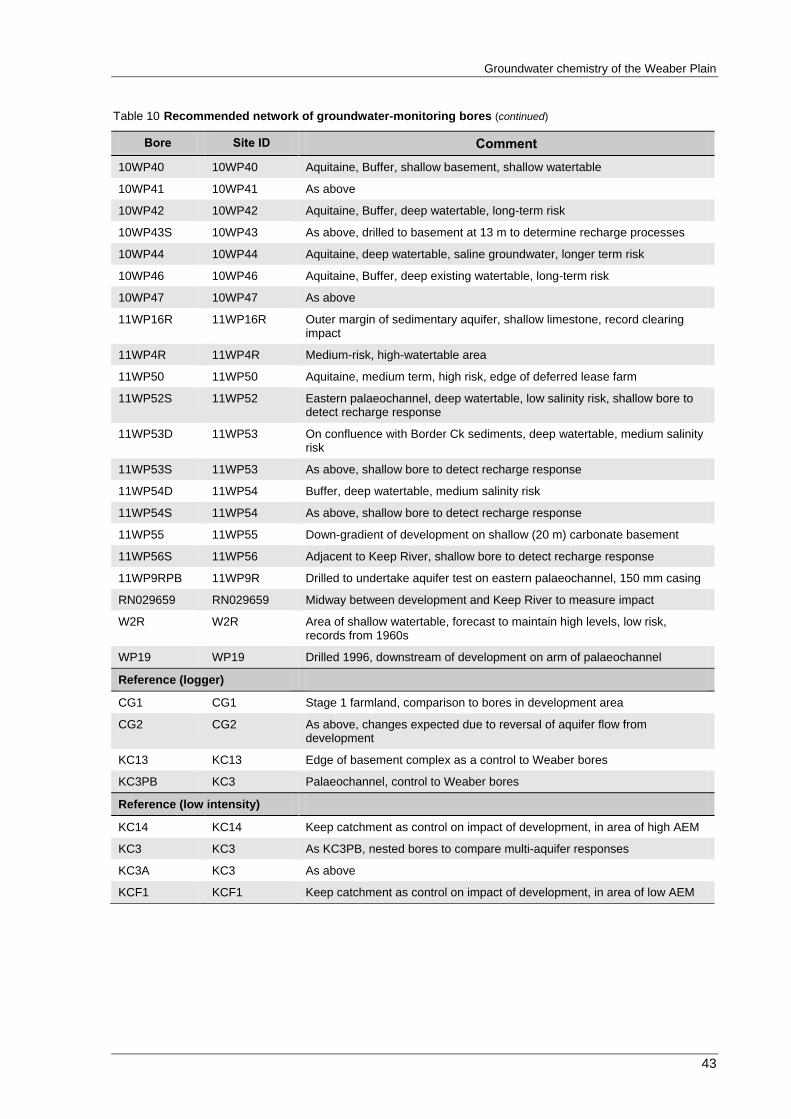
Groundwater chemistry of the Weaber Plain
43
Table 10 Recommended network of groundwater-monitoring bores (continued)
Bore Site ID Comment
10WP40 10WP40 Aquitaine, Buffer, shallow basement, shallow watertable
10WP41 10WP41 As above
10WP42 10WP42 Aquitaine, Buffer, deep watertable, long-term risk
10WP43S 10WP43 As above, drilled to basement at 13 m to determine recharge processes
10WP44 10WP44 Aquitaine, deep watertable, saline groundwater, longer term risk
10WP46 10WP46 Aquitaine, Buffer, deep existing watertable, long-term risk
10WP47 10WP47 As above
11WP16R 11WP16R Outer margin of sedimentary aquifer, shallow limestone, record clearing impact
11WP4R 11WP4R Medium-risk, high-watertable area
11WP50 11WP50 Aquitaine, medium term, high risk, edge of deferred lease farm
11WP52S 11WP52 Eastern palaeochannel, deep watertable, low salinity risk, shallow bore to detect recharge response
11WP53D 11WP53 On confluence with Border Ck sediments, deep watertable, medium salinity risk
11WP53S 11WP53 As above, shallow bore to detect recharge response
11WP54D 11WP54 Buffer, deep watertable, medium salinity risk
11WP54S 11WP54 As above, shallow bore to detect recharge response
11WP55 11WP55 Down-gradient of development on shallow (20 m) carbonate basement
11WP56S 11WP56 Adjacent to Keep River, shallow bore to detect recharge response
11WP9RPB 11WP9R Drilled to undertake aquifer test on eastern palaeochannel, 150 mm casing
RN029659 RN029659 Midway between development and Keep River to measure impact
W2R W2R Area of shallow watertable, forecast to maintain high levels, low risk, records from 1960s
WP19 WP19 Drilled 1996, downstream of development on arm of palaeochannel
Reference (logger)
CG1 CG1 Stage 1 farmland, comparison to bores in development area
CG2 CG2 As above, changes expected due to reversal of aquifer flow from development
KC13 KC13 Edge of basement complex as a control to Weaber bores
KC3PB KC3 Palaeochannel, control to Weaber bores
Reference (low intensity)
KC14 KC14 Keep catchment as control on impact of development, in area of high AEM
KC3 KC3 As KC3PB, nested bores to compare multi-aquifer responses
KC3A KC3 As above
KCF1 KCF1 Keep catchment as control on impact of development, in area of low AEM

Groundwater chemistry of the Weaber Plain
44
Fig
ure
22 L
ocati
on
s o
f re
co
mm
en
ded
Wea
ber
Pla
in m
on
ito
rin
g a
nd
refe
ren
ce b
ore
s (
Map
Gri
d o
f A
ustr
ali
a,
Zo
ne
52).
So
me s
ites
ha
ve
tw
o o
r th
ree
bo
res, see T
ab
le 1
0 f
or
deta
ils.

Groundwater chemistry of the Weaber Plain
45
6. Conclusions
The groundwater salinity trends determined for bores on the Ivanhoe Plain, developed for irrigation in 1964, indicate that irrigation has not led to a significant change in groundwater salinity levels.
Groundwater salinities were significantly lower under Cununurra soils than under Aquitaine soils when all data from both the Ivanhoe and Weaber plains was considered. By contrast, there was no statistical difference between groundwater salinities observed in the palaeochannel as compared to elsewhere under the Ivanhoe Plain.
Groundwater levels have also increased under the Weaber Plain since the 1990s. However, groundwater salinities have increased at only 40 per cent of the bores, and most of them are in the area immediately north of Cave Spring Gap, where groundwater levels have increased due to irrigation development on the Ivanhoe Plain.
The Ivanhoe Plain groundwater salinity trends between 1984 and 2009 indicate that the development of the Weaber Plain for irrigated agriculture is unlikely to result in any significant change in groundwater salinity within the Ord palaeochannel. Furthermore, where groundwater salinities in the palaeochannel are very high, as in the north-eastern portion of the Weaber Plain, they are likely to decrease due to dilution with fresh irrigation-supply water. Groundwater salinities are highest under Aquitaine soils on the Weaber Plain and, as proposed farm lots on Aquitaine soils will be leasehold, with some subject to deferred clearing, the potential for increases in groundwater salinity following development will be further limited.
An analysis was performed to assess the option of pumping groundwater from the Ord River palaeochannel and discharging it to the irrigation supply channel should watertable control be required following development. The analysis showed that most of the groundwater was unsuitable for direct irrigation; however, if groundwater were to be mixed with irrigation water provided from the Ord River Irrigation Scheme at calculated ratios, the mixed waters would be suitable for irrigation under USDA (1954) guidelines. The analysis indicated that the mean TDS of groundwater in the palaeochannel would be about 1162 mg/L (Table 9), which agrees well with the 1200 mg/L predicted by the solute transport model produced by KBR (2011). At the modelled pumping rates of 540 to 769 ML/day, groundwater from the palaeochannel mixed with the supply channel water at average and peak flow rates would result in a salinity range of 170 to 200 mg/L TDS.
These results demonstrate that blending pumped groundwater into the main supply channel will provide a viable option for managing salinity risks on the Weaber Plain area when irrigation commences.
A network of 58 groundwater-monitoring bores at 44 sites is recommended as the basis of an ongoing water-quality monitoring program for the life of the development. The recommended network consists of bores to be monitored at a high intensity with dataloggers, low-intensity bores and eight reference bores. This report includes a list of required analytes for comparison to the ANZECC/ARMCANZ (2000) water-quality guidelines and a strategy to develop a baseline water-quality data set to ensure that the environmental impacts of the development are within required limits. Trigger mechanisms and guidelines for the escalation of groundwater quality monitoring are also recommended should any analyte exceed baseline levels by a set amount.

Groundwater chemistry of the Weaber Plain
46
7. References
Ali, R, Salama, R, Pollock, D & Bates, L 2002, Geochemical interactions between groundwater and soil, groundwater recycling and evaporation in the ORIA, Land and Water Technical Report 21/02, CSIRO, Perth.
ANZECC & ARMCANZ 2000, Australian and New Zealand guidelines for fresh and marine water quality, Paper No. 4, Australian and New Zealand Environment and Conservation Council, Agriculture and Resource Management Council of Australia and New Zealand, Canberra.
Bennett, D & George, R 2011, Surface water characteristics of the Weaber Plain and Lower Keep River Catchments: data review and preliminary results, Resource Management Technical Report 370, Department of Agriculture and Food, Perth.
Busenberg, E & Plummer, LN 1992, ‘Use of chlorofluorocarbons (CCl3F and CCl
2F
2) as
hydrologic tracers and age dating tools: the alluvium and terrace system of central Oklahoma’, Water Resources Research, vol. 28, no. 9, pp. 2257–2283.
CSIRO 2009, Water in the Ord–Bonaparte region of the Timor Sea Drainage Division, A report to the Australian Government from the CSIRO Northern Australia Sustainable Yields (NASY) project.
Drever, JI 2002, The geochemistry of natural waters: surface and groundwater environments, 3rd edn, Prentice Hall, New Jersey.
Environmental Protection and Biodiversity Conservation Act 1999, Canberra, Commonwealth of Australia.
George, R, Simons, J, Raper, GP, Paul, R, Bennett, D & Smith, R 2011, Weaber Plain hydrogeology: preliminary results, Resource Management Technical Report 366, Department of Agriculture and Food, Perth.
KBR (Kellogg Brown & Root Pty Ltd) 2010, Weaber Plain groundwater modelling report, Stage 1 results, report prepared for LandCorp, Perth.
KBR (Kellogg Brown & Root Pty Ltd) 2011, Weaber Plain groundwater modelling report, Final (including Stage 4 results), report prepared for LandCorp, Perth.
Kinhill Pty Ltd, 2000, Ord River Irrigation Area Stage 2 proposed development of the M2 Area – Environmental review and management program. Prepared for Wesfarmers Limited, Marunbeni Corporation and the Water Corporation of Western Australia, Perth.
Laws, AT 1983, Groundwater conditions in the Ord Irrigation Project Area, Kununurra, WA (Weaber Plain), Hydrogeology Report 2491, Western Australian Geological Survey, Perth.
Lawrie, KC, Tan, KP, Clarke, JC, Munday, TJ, Fitzpatrick, A, Brodie, RS, Apps, H, Halas, L, Cullen, K, Pain, CF, Kuske, TJ, Cahill, K & Davis, A 2010, Using the SkyTEM time domain airborne electromagnetics (AEM) system to map aquifer systems and salinity hazard in the Ord Valley, Western Australia, Professional Opinion 2010/01, Geoscience Australia, Canberra.

Groundwater chemistry of the Weaber Plain
47
Leaney, F 2007, Chlorofluorcarbon (CFC) analysis of groundwater, unpublished methods, CSIRO Land and Water, Urrbrae.
Munk, G 2011, Discussion on channel design specifications, GHD Pty Ltd, pers. comm., September 2011.
Nixon, RD 1997a, Ord River Irrigation Area drilling project, bore completion report on the Weaber Plain Western Australian, Hydrogeological Report No. 66/1997, Water and Rivers Commission, Perth.
Nixon, RD 1997b, Ord River Irrigation Area miscellaneous data report for the Weaber and Knox Creek Plains, Western Australia, Hydrogeological Report No. 72/1997, Water and Rivers Commission, Perth.
O’Boy, CA, Tickell, SJ, Yesertener, C, Commander, DP, Jolly, P & Laws, AT 2001, Hydrogeology of the Ord River Irrigation Area, Western Australia and Northern Territory, Hydrogeological Record Series Report HG7, Water and Rivers Commission, Perth.
Puls, RW & Barcelona, MJ 1996, Low-flow (minimal drawdown) ground-water sampling procedures, EPA/540/S-95/50, United States Environmental Protection Agency.
Smith, A, Pollock, D, Palmer, D & Price, A 2007, Ord River Irrigation Area (ORIA)
groundwater drainage and discharge evaluation: survey of groundwater quality 2006, CSIRO Land & Water Science Report 44/07, CSIRO.
Smolinski, H, Laycock, J & Dixon, J 2011, Soil assessment of the Weaber Plain (Goomig) farmlands, Resource Management Technical Report 369, Department of Agriculture and Food, Perth.
Strategen 2012a, Ord River Irrigation Area—Weaber Plain development project: groundwater management plan, unpublished report prepared for LandCorp, Perth.
Strategen 2012b, Ord River Irrigation Area—Weaber Plain development project: stormwater and groundwater discharge management plan, unpublished report prepared for LandCorp, Perth.
Tickell, SJ, Cook, P, Sumner, J, Knapton, A & Jolly, P 2007, Evaluating the potential for irrigation induced salinisation of the Keep River Plains, Technical Report WRD30/2006D, Northern Territory Department of Natural Resources, Environment and the Arts, Darwin.
United States Department of Agriculture 1954, Diagnosis and improvement of saline and alkali soils, Agriculture Handbook No. 60, United States Department of Agriculture, issued February 1954.

Groundwater chemistry of the Weaber Plain
48
Gro
undw
ate
r chem
istry
of th
e W
eaber P
lain
Appendix A: Ivanhoe Plain water-quality plots
11C
0
1000
2000
3000
19
64
19
68
19
72
19
76
19
80
19
84
19
88
19
92
19
96
20
00
20
04
20
08
TD
S (
mg
/L)
-12
-8
-4
0
Wate
r Level (m
BG
L)
TDS Water level
Figure A.1 Groundwater salinity and level data for bore 11C showing no discernible trend
4C
0
500
1000
1500
2000
19
64
19
68
19
72
19
76
19
80
19
84
19
88
19
92
19
96
20
00
20
04
20
08
TD
S (
mg
/L)
-24
-18
-12
-6
0
Wate
r Level (m
BG
L)
TDS Water level
Figure A.2 Groundwater salinity and level data for bore 4C showing increasing trend
6D
0
5000
10000
15000
19
64
19
68
19
72
19
76
19
80
19
84
19
88
19
92
19
96
20
00
20
04
20
08
TD
S (
mg
/L)
-15
-10
-5
0
Wate
r Level (m
BG
L)
TDS Water level
Figure A.3 Groundwater salinity and level data for bore 6D showing no discernable trend
91-02
0
1000
2000
3000
4000
5000
1964
1968
1972
1976
1980
1984
1988
1992
1996
2000
2004
2008
TD
S (
mg
/L)
-10
-8
-6
-4
-2
0
Wate
r Level (m
BG
L)
TDS Water level
Figure A.4 Groundwater salinity and level data for bore 91-02 showing spike response
94-01
0
400
800
1200
1600
1964
1968
1972
1976
1980
1984
1988
1992
1996
2000
2004
2008
TD
S (
mg
/L)
-8
-6
-4
-2
0
Wate
r Level (m
BG
L)
TDS Water level
Figure A.5 Groundwater salinity and level data for bore 94-01 showing spike response
94-02
0
100
200
300
400
1964
1968
1972
1976
1980
1984
1988
1992
1996
2000
2004
2008
TD
S (
mg
/L)
-8
-6
-4
-2
0
Wate
r Level (m
BG
L)
TDS Water level
Figure A.6 Groundwater salinity and level data for bore 94-02 showing decreasing trend
94-13
0
2000
4000
6000
8000
1964
1968
1972
1976
1980
1984
1988
1992
1996
2000
2004
2008
TD
S (
mg
/L)
-8
-6
-4
-2
0
Wate
r Level (m
BG
L)
TDS Water level
Figure A.7 Groundwater salinity and level data for bore 94-13 showing spike response
94-14
0
1000
2000
3000
1964
1968
1972
1976
1980
1984
1988
1992
1996
2000
2004
2008
TD
S (
mg
/L)
-12
-8
-4
0
Wate
r Level (m
BG
L)
TDS Water level
Figure A.8 Groundwater salinity and level data for bore 94-14 showing no trend

Groundwater chemistry of the Weaber Plain
49
94-22
0
200
400
600
1964
1968
1972
1976
1980
1984
1988
1992
1996
2000
2004
2008
TD
S (
mg
/L)
-6
-4
-2
0
Wate
r Level (m
BG
L)
TDS Water level
Figure A.9 Groundwater salinity and level data for bore 94-22 showing spike response
94-24
0
1000
2000
3000
4000
1964
1968
1972
1976
1980
1984
1988
1992
1996
2000
2004
2008
TD
S (
mg
/L)
-4
-3
-2
-1
0
Wate
r Level (m
BG
L)
TDS Water level
Figure A.10 Groundwater salinity and level data for bore 94-24 showing no discernable trend
94-25
0
50
100
150
200
250
1964
1968
1972
1976
1980
1984
1988
1992
1996
2000
2004
2008
TD
S (
mg
/L)
-5
-4
-3
-2
-1
0
Wate
r Level (m
BG
L)
TDS Water level
Figure A.11 Groundwater salinity and level data for bore 94-25 showing increasing trend
94-32
0
200
400
600
800
1000
1964
1968
1972
1976
1980
1984
1988
1992
1996
2000
2004
2008
TD
S (
mg
/L)
-5
-4
-3
-2
-1
0
Wate
r Level (m
BG
L)
TDS Water level
Figure A.12 Groundwater salinity and level data for bore 94-32 showing no trend
94-41
0
200
400
600
800
1964
1968
1972
1976
1980
1984
1988
1992
1996
2000
2004
2008
TD
S (
mg
/L)
-8
-6
-4
-2
0
Wate
r Level (m
BG
L)
TDS Water level
Figure A.13 Groundwater salinity and level data for bore 94-41 showing spike response
96-05
0
4000
8000
12000
1964
1968
1972
1976
1980
1984
1988
1992
1996
2000
2004
2008
TD
S (
mg
/L)
-12
-8
-4
0
Wate
r Level (m
BG
L)
TDS Water level
Figure A.14 Groundwater salinity and level data for bore 96-05 showing no trend
96-06
0
2000
4000
6000
8000
1964
1968
1972
1976
1980
1984
1988
1992
1996
2000
2004
2008
TD
S (
mg
/L)
-8
-6
-4
-2
0
Wate
r Level (m
BG
L)
TDS Water level
Figure A.15 Groundwater salinity and level data for bore 96-06 showing no discernable trend
HI1-78
0
500
1000
1500
2000
19
64
19
68
19
72
19
76
19
80
19
84
19
88
19
92
19
96
20
00
20
04
20
08
TD
S (
mg
/L)
-20
-15
-10
-5
0
Wate
r Level (m
BG
L)
TDS Water level
Figure A.16 Groundwater salinity and level data for bore HI1-78 showing no trend

Groundwater chemistry of the Weaber Plain
50
HI3-78
0
1000
2000
3000
4000
5000
6000
19
64
19
68
19
72
19
76
19
80
19
84
19
88
19
92
19
96
20
00
20
04
20
08
TD
S (
mg
/L)
-18
-15
-12
-9
-6
-3
0
Wate
r Level (m
BG
L)
TDS Water level
Figure A.17 Groundwater salinity and level data for bore HI3-78 showing increasing trend
ORD1 (CG3)
0
200
400
600
800
1000
19
64
19
68
19
72
19
76
19
80
19
84
19
88
19
92
19
96
20
00
20
04
20
08
TD
S (
mg
/L)
-10
-8
-6
-4
-2
0
Wate
r Level (m
BG
L)
TDS Water level
Figure A.18 Groundwater salinity and level data for bore ORD1 (CG3) showing increasing trend
ORD3 (CG5)
0
1000
2000
3000
4000
19
64
19
68
19
72
19
76
19
80
19
84
19
88
19
92
19
96
20
00
20
04
20
08
TD
S (
mg
/L)
-8
-6
-4
-2
0
Wate
r Level (m
BG
L)
TDS Water level
Figure A.19 Groundwater salinity and level data for bore ORD3 (CG5) showing increasing trend
ORD4 (ML1)
0
2000
4000
6000
19
64
19
68
19
72
19
76
19
80
19
84
19
88
19
92
19
96
20
00
20
04
20
08
TD
S (
mg
/L)
-4
-2
0
2
Wate
r Level (m
BG
L)
TDS Water level
Figure A.20 Groundwater salinity and level data for bore ORD4 (ML1) showing spike response
ORD5 (CG1)
0
1000
2000
3000
19
64
19
68
19
72
19
76
19
80
19
84
19
88
19
92
19
96
20
00
20
04
20
08
TD
S (
mg
/L)
-6
-4
-2
0
Wate
r Level (m
BG
L)
TDS Water level
Figure A.21 Groundwater salinity and level data for bore ORD5 (CG1) showing spike response
ORD6 (CG2)
0
200
400
600
800
19
64
19
68
19
72
19
76
19
80
19
84
19
88
19
92
19
96
20
00
20
04
20
08
TD
S (
mg
/L)
-8
-6
-4
-2
0
Wate
r Level (m
BG
L)
TDS Water level
Figure A.22 Groundwater salinity and level data for bore ORD6 (CG2) showing no trend
ORD9 (GS2)
0
2000
4000
6000
8000
10000
19
64
19
68
19
72
19
76
19
80
19
84
19
88
19
92
19
96
20
00
20
04
20
08
TD
S (
mg
/L)
-10
-8
-6
-4
-2
0
Wate
r Level (m
BG
L)
TDS Water level
Figure A.23 Groundwater salinity and level data for bore ORD9 (GS2) showing spike response
ORD10 (GS4)
0
5000
10000
15000
20000
19
64
19
68
19
72
19
76
19
80
19
84
19
88
19
92
19
96
20
00
20
04
20
08
TD
S (
mg
/L)
-20
-15
-10
-5
0
Wate
r Level (m
BG
L)
TDS Water level
Figure A.24 Groundwater salinity and level data for bore ORD10 (GS4) showing increasing trend

Groundwater chemistry of the Weaber Plain
51
ORD12 (ML3)
0
500
1000
1500
19
64
19
68
19
72
19
76
19
80
19
84
19
88
19
92
19
96
20
00
20
04
20
08
TD
S (
mg
/L)
-9
-6
-3
0
Wate
r Level (m
BG
L)
TDS Water level
Figure A.25 Groundwater salinity and level data for bore ORD12 (ML3) showing no trend
ORD41 (ML6)
0
2000
4000
6000
1964
1968
1972
1976
1980
1984
1988
1992
1996
2000
2004
2008
TD
S (
mg
/L)
-18
-12
-6
0
Wate
r Level (m
BG
L)
TDS Water level
Figure A.26 Groundwater salinity and level data for bore ORD41 (ML6) showing spike response
PB1
0
200
400
600
800
1000
19
64
19
68
19
72
19
76
19
80
19
84
19
88
19
92
19
96
20
00
20
04
20
08
TD
S (
mg
/L)
-10
-8
-6
-4
-2
0
Wate
r Level (m
BG
L)
TDS Water level
Figure A.27 Groundwater salinity and level data for bore PB1 showing no trend
PB1M1
0
200
400
600
800
1000
19
64
19
68
19
72
19
76
19
80
19
84
19
88
19
92
19
96
20
00
20
04
20
08
TD
S (
mg
/L)
-10
-8
-6
-4
-2
0
Wate
r Level (m
BG
L)
TDS Water level
Figure A.28 Groundwater salinity and level data for bore PB1M1 showing no trend
PB1M4
0
200
400
600
800
1000
1964
1968
1972
1976
1980
1984
1988
1992
1996
2000
2004
2008
TD
S (
mg
/L)
-10
-8
-6
-4
-2
0
Wate
r Level (m
BG
L)
TDS Water level
Figure A.29 Groundwater salinity and level data for bore PB1M4 showing increasing trend
PB2
0
1000
2000
3000
19
64
19
68
19
72
19
76
19
80
19
84
19
88
19
92
19
96
20
00
20
04
20
08
TD
S (
mg
/L)
-15
-10
-5
0
Wate
r Level (m
BG
L)
TDS Water level
Figure A.30 Groundwater salinity and level data for bore PB2 showing increasing trend
PB2M1
0
500
1000
1500
19
64
19
68
19
72
19
76
19
80
19
84
19
88
19
92
19
96
20
00
20
04
20
08
TD
S (
mg
/L)
-15
-10
-5
0
Wate
r Level (m
BG
L)
TDS Water level
Figure A.31 Groundwater salinity and level data for bore PB2M1 showing increased variability
PB2M2
0
500
1000
1500
19
64
19
68
19
72
19
76
19
80
19
84
19
88
19
92
19
96
20
00
20
04
20
08
TD
S (
mg
/L)
-15
-10
-5
0
Wate
r Level (m
BG
L)
TDS Water level
Figure A.32 Groundwater salinity and level data for bore PB2M2 showing increasing trend

Groundwater chemistry of the Weaber Plain
52
PB2M4
0
500
1000
1500
19
64
19
68
19
72
19
76
19
80
19
84
19
88
19
92
19
96
20
00
20
04
20
08
TD
S (
mg
/L)
-15
-10
-5
0
Wate
r Level (m
BG
L)
TDS Water level
Figure A.33 Groundwater salinity and level data for bore PB2M4 showing no trend
PB3
0
1000
2000
3000
4000
19
64
19
68
19
72
19
76
19
80
19
84
19
88
19
92
19
96
20
00
20
04
20
08
TD
S (
mg
/L)
-16
-12
-8
-4
0
Wate
r Level (m
BG
L)
TDS Water level
Figure A.34 Groundwater salinity and level data for bore PB3 showing no discernable trend
PB3M1
0
1000
2000
3000
19
64
19
68
19
72
19
76
19
80
19
84
19
88
19
92
19
96
20
00
20
04
20
08
TD
S (
mg
/L)
-12
-8
-4
0
Wate
r Level (m
BG
L)
TDS Water level
Figure A.35 Groundwater salinity and level data for bore PB3M1 showing increasing trend
PB3M2
0
1000
2000
3000
4000
5000
19
64
19
68
19
72
19
76
19
80
19
84
19
88
19
92
19
96
20
00
20
04
20
08
TD
S (
mg
/L)
-16
-12
-8
-4
0
Wate
r Level (m
BG
L)
TDS Water level
Figure A.36 Groundwater salinity and level data for bore PB3M2 showing increasing trend
PB3M3S
0
1000
2000
3000
4000
19
64
19
68
19
72
19
76
19
80
19
84
19
88
19
92
19
96
20
00
20
04
20
08
TD
S (
mg
/L)
-16
-12
-8
-4
0
Wate
r Level (m
BG
L)
TDS Water level
Figure A.37 Groundwater salinity and level data for bore PB3M3S showing no discernable trend
PB4M3D
0
400
800
1200
1600
2000
1964
1968
1972
1976
1980
1984
1988
1992
1996
2000
2004
2008
TD
S (
mg
/L)
-10
-8
-6
-4
-2
0
Wate
r Level (m
BG
L)
TDS Water level
Figure A.38 Groundwater salinity and level data for bore PB4M3D showing decreasing trend
PN1S
0
4000
8000
12000
16000
19
64
19
68
19
72
19
76
19
80
19
84
19
88
19
92
19
96
20
00
20
04
20
08
TD
S (
mg
/L)
-16
-12
-8
-4
0
Wate
r Level (m
BG
L)
TDS Water level
Figure A.39 Groundwater salinity and level data for bore PN1S showing spike response
PN2D
0
2000
4000
6000
8000
10000
19
64
19
68
19
72
19
76
19
80
19
84
19
88
19
92
19
96
20
00
20
04
20
08
TD
S (
mg
/L)
-10
-8
-6
-4
-2
0
Wate
r Level (m
BG
L)
TDS Water level
Figure A.40 Groundwater salinity and level data for bore PN2D showing decreasing trend

Groundwater chemistry of the Weaber Plain
53
PN2S
0
1000
2000
3000
4000
19
64
19
68
19
72
19
76
19
80
19
84
19
88
19
92
19
96
20
00
20
04
20
08
TD
S (
mg
/L)
-12
-9
-6
-3
0
Wate
r Level (m
BG
L)
TDS Water level
Figure A.41 Groundwater salinity and level data for bore PN2S showing increasing trend
PN3D
0
1000
2000
3000
4000
5000
19
64
19
68
19
72
19
76
19
80
19
84
19
88
19
92
19
96
20
00
20
04
20
08
TD
S (
mg
/L)
-10
-8
-6
-4
-2
0
Wate
r Level (m
BG
L)
TDS Water level
Figure A.42 Groundwater salinity and level data for bore PN3D showing spike response
PN3S
0
400
800
1200
19
64
19
68
19
72
19
76
19
80
19
84
19
88
19
92
19
96
20
00
20
04
20
08
TD
S (
mg
/L)
-6
-4
-2
0
Wate
r Level (m
BG
L)
TDS Water level
Figure A.43 Groundwater salinity and level data for bore PN3S showing no trend
PN5D
0
1000
2000
3000
19
64
19
68
19
72
19
76
19
80
19
84
19
88
19
92
19
96
20
00
20
04
20
08
TD
S (
mg
/L)
-15
-10
-5
0
Wate
r Level (m
BG
L)
TDS Water level
Figure A.44 Groundwater salinity and level data for bore PN5D showing spike response
PN5S
0
200
400
600
800
1000
19
64
19
68
19
72
19
76
19
80
19
84
19
88
19
92
19
96
20
00
20
04
20
08
TD
S (
mg
/L)
-20
-16
-12
-8
-4
0
Wate
r Level (m
BG
L)
TDS Water level
Figure A.45 Groundwater salinity and level data for bore PN5S showing increased variability
PN6D
0
1000
2000
3000
19
64
19
68
19
72
19
76
19
80
19
84
19
88
19
92
19
96
20
00
20
04
20
08
TD
S (
mg
/L)
-12
-8
-4
0
Wate
r Level (m
BG
L)
TDS Water level
,
Figure A.46 Groundwater salinity and level data for bore PN6D showing no trend
PN6S
0
2000
4000
6000
19
64
19
68
19
72
19
76
19
80
19
84
19
88
19
92
19
96
20
00
20
04
20
08
TD
S (
mg
/L)
-12
-8
-4
0
Wate
r Level (m
BG
L)
TDS Water level
Figure A.47 Groundwater salinity and level data for bore PN6S showing decreasing trend
PN7S
0
2000
4000
6000
8000
19
64
19
68
19
72
19
76
19
80
19
84
19
88
19
92
19
96
20
00
20
04
20
08
TD
S (
mg
/L)
-6
-4
-2
0
Wate
r Level (m
BG
L)
TDS Water level
Figure A.48 Groundwater salinity and level data for bore PN7S showing no trend

Groundwater chemistry of the Weaber Plain
54
PN8D
0
500
1000
1500
19
64
19
68
19
72
19
76
19
80
19
84
19
88
19
92
19
96
20
00
20
04
20
08
TD
S (
mg
/L)
-15
-10
-5
0
Wate
r Level (m
BG
L)
TDS Water level
Figure A.49 Groundwater salinity and level data for bore PN8D showing increased variability
PN8S
0
200
400
600
800
19
64
19
68
19
72
19
76
19
80
19
84
19
88
19
92
19
96
20
00
20
04
20
08
TD
S (
mg
/L)
-16
-12
-8
-4
0
Wate
r Level (m
BG
L)
TDS Water level
Figure A.50 Groundwater salinity and level data for bore PN8S showing no trend
PN9D
0
500
1000
1500
2000
19
64
19
68
19
72
19
76
19
80
19
84
19
88
19
92
19
96
20
00
20
04
20
08
TD
S (
mg
/L)
-16
-12
-8
-4
0
Wate
r Level (m
BG
L)
TDS Water level
Figure A.51 Groundwater salinity and level data for bore PN9D showing increased variability
PN9S
0
500
1000
1500
19
64
19
68
19
72
19
76
19
80
19
84
19
88
19
92
19
96
20
00
20
04
20
08
TD
S (
mg
/L)
-15
-10
-5
0
Wate
r Level (m
BG
L)
TDS Water level
Figure A.52 Groundwater salinity and level data for bore PN9S showing increasing trend
PN11S
0
200
400
600
800
19
64
19
68
19
72
19
76
19
80
19
84
19
88
19
92
19
96
20
00
20
04
20
08
TD
S (
mg
/L)
-8
-6
-4
-2
0
Wate
r Level (m
BG
L)
TDS Water level
Figure A.53 Groundwater salinity and level data for bore PN11S showing increased variability
PN12D
0
1,000
2,000
3,000
19
64
19
68
19
72
19
76
19
80
19
84
19
88
19
92
19
96
20
00
20
04
20
08
TD
S (
mg
/L)
-12
-8
-4
0
Wate
r Level (m
BG
L)
TDS Water level
Figure A.54 Groundwater salinity and level data for bore PN12D showing spike response
PN12S
0
1000
2000
3000
19
64
19
68
19
72
19
76
19
80
19
84
19
88
19
92
19
96
20
00
20
04
20
08
TD
S (
mg
/L)
-12
-8
-4
0
Wate
r Level (m
BG
L)
TDS Water level
Figure A.55 Groundwater salinity and level data for bore PN12S showing increasing trend
PN14S
0
100
200
300
400
19
64
19
68
19
72
19
76
19
80
19
84
19
88
19
92
19
96
20
00
20
04
20
08
TD
S (
mg
/L)
-6
-4
-2
0
Wate
r Level (m
BG
L)
TDS Water level
Figure A.56 Groundwater salinity and level data for bore PN14S showing no trend

Groundwater chemistry of the Weaber Plain
55
PN15S
0
4000
8000
12000
19
64
19
68
19
72
19
76
19
80
19
84
19
88
19
92
19
96
20
00
20
04
20
08
TD
S (
mg
/L)
-12
-8
-4
0
Wate
r Level (m
BG
L)
TDS Water level
Figure A.57 Groundwater salinity and level data for bore PN15S showing decreasing trend
V1506
0
200
400
600
800
19
64
19
68
19
72
19
76
19
80
19
84
19
88
19
92
19
96
20
00
20
04
20
08
TD
S (
mg
/L)
-16
-12
-8
-4
0
TDS Water level
Figure A.58 Groundwater salinity and level data for bore V1506 showing no trend

Groundwater chemistry of the Weaber Plain
56
Gro
undw
ate
r chem
istry
of th
e W
eaber P
lain
Appendix B: Weaber Plain water quality plots
CS2
0
100
200
300
400
500
1964
1968
1972
1976
1980
1984
1988
1992
1996
2000
2004
2008
TD
S (
mg
/L)
-15
-12
-9
-6
-3
0
Wate
r Level (m
BG
L)
TDS Water level
Figure B.1 Groundwater salinity and level data for bore CS2 showing spike response
CS10
0
200
400
600
800
1000
1964
1968
1972
1976
1980
1984
1988
1992
1996
2000
2004
2008
TD
S (
mg
/L)
-20
-16
-12
-8
-4
0
Wate
r Level (m
BG
L)
TDS Water level
Figure B.2 Groundwater salinity and level data for bore CS10 showing increasing trend
CS12E1R
0
500
1000
1500
2000
2500
1964
1968
1972
1976
1980
1984
1988
1992
1996
2000
2004
2008
TD
S (
mg
/L)
-15
-12
-9
-6
-3
0
Wate
r Level (m
BG
L)
TDS Water level
Figure B.3 Groundwater salinity and level data for bore CS12E1R showing increasing trend
CS12E2.5
0
1000
2000
3000
4000
5000
1964
1968
1972
1976
1980
1984
1988
1992
1996
2000
2004
2008
TD
S (
mg
/L)
-25
-20
-15
-10
-5
0
Wate
r Level (m
BG
L)
TDS Water level
Figure B.4 Groundwater salinity and level data for bore CS12E2.5 showing decreasing trend
CS13
0
200
400
600
800
1000
1964
1968
1972
1976
1980
1984
1988
1992
1996
2000
2004
2008
TD
S (
mg
/L)
-20
-16
-12
-8
-4
0
Wate
r Level (m
BG
L)
TDS Water level
Figure B.5 Groundwater salinity and level data for bore CS13 showing no trend
ORD8 (CG4)
0
500
1000
1500
2000
1964
1968
1972
1976
1980
1984
1988
1992
1996
2000
2004
2008
TD
S (
mg
/L)
-12
-9
-6
-3
0
Wate
r Level (m
BG
L)
TDS Water level
Figure B.6 Groundwater salinity and level data for bore ORD8 (CG4) showing increasing trend
W2R
0
200
400
600
800
1000
1964
1968
1972
1976
1980
1984
1988
1992
1996
2000
2004
2008
TD
S (
mg
/L)
-10
-8
-6
-4
-2
0
Wate
r Level (m
BG
L)
TDS Water level
Figure B.7 Groundwater salinity and level data for bore W2R showing decreasing trend
W5S1
0
1000
2000
3000
4000
5000
1964
1968
1972
1976
1980
1984
1988
1992
1996
2000
2004
2008
TD
S (
mg
/L)
-25
-20
-15
-10
-5
0
Wate
r Level (m
BG
L)
TDS Water level
Figure B.8 Groundwater salinity and level data for bore W5S1 showing decreasing trend

Groundwater chemistry of the Weaber Plain
57
W5S1.5
0
5000
10000
15000
20000
25000
1964
1968
1972
1976
1980
1984
1988
1992
1996
2000
2004
2008
TD
S (
mg
/L)
-25
-20
-15
-10
-5
0
Wate
r Level (m
BG
L)
TDS Water level
Figure B.9 Groundwater salinity and level data for bore W5S1.5 showing no trend
W5S2R
0
3000
6000
9000
12000
1964
1968
1972
1976
1980
1984
1988
1992
1996
2000
2004
2008
TD
S (
mg
/L)
-24
-18
-12
-6
0
Wate
r Level (m
BG
L)
TDS Water level
Figure B.10 Groundwater salinity and level data for bore W5S2R showing increasing trend
WBS1112
0
300
600
900
1200
1964
1968
1972
1976
1980
1984
1988
1992
1996
2000
2004
2008
TD
S (
mg
/L)
-24
-18
-12
-6
0
Wate
r Level (m
BG
L)
TDS Water level
Figure B.11 Groundwater salinity and level data for bore WBS1112 showing no trend
WP2
0
200
400
600
800
1000
1964
1968
1972
1976
1980
1984
1988
1992
1996
2000
2004
2008
TD
S (
mg
/L)
-15
-12
-9
-6
-3
0
Wate
r Level (m
BG
L)
TDS Water level
Figure B.12 Groundwater salinity and level data for bore WP2 showing increasing trend
WP3
0
50
100
150
200
250
1964
1968
1972
1976
1980
1984
1988
1992
1996
2000
2004
2008
TD
S (
mg
/L)
-15
-12
-9
-6
-3
0
Wate
r Level (m
BG
L)
TDS Water level
Figure B.13 Groundwater salinity and level data for bore WP3 showing increasing trend
WP4
0
200
400
600
800
1000
1964
1968
1972
1976
1980
1984
1988
1992
1996
2000
2004
2008
TD
S (
mg
/L)
-15
-12
-9
-6
-3
0
Wate
r Level (m
BG
L)
TDS Water level
Figure B.14 Groundwater salinity and level data for bore WP4 showing increasing trend
WP6
0
500
1000
1500
2000
1964
1968
1972
1976
1980
1984
1988
1992
1996
2000
2004
2008
TD
S (
mg
/L)
-20
-15
-10
-5
0
Wate
r Level (m
BG
L)
TDS Water level
Figure B.15 Groundwater salinity and level data for bore WP6 showing increasing trend
WP7
0
50
100
150
200
250
1964
1968
1972
1976
1980
1984
1988
1992
1996
2000
2004
2008
TD
S (
mg
/L)
-25
-20
-15
-10
-5
0
Wate
r Level (m
BG
L)
TDS Water level
Figure B.16 Groundwater salinity and level data for bore WP7 showing no trend

Groundwater chemistry of the Weaber Plain
58
WP10
0
500
1000
1500
1964
1968
1972
1976
1980
1984
1988
1992
1996
2000
2004
2008
TD
S (
mg
/L)
-18
-12
-6
0
Wate
r Level (m
BG
L)
TDS Water level
Figure B.17 Groundwater salinity and level data for bore WP10 showing no trend
WP11D
0
400
800
1200
1964
1968
1972
1976
1980
1984
1988
1992
1996
2000
2004
2008
TD
S (
mg
/L)
-24
-16
-8
0
Wate
r Level (m
BG
L)
TDS Water level
Figure B.18 Groundwater salinity and level data for bore WP11D showing no trend
WP12D
0
1000
2000
3000
1964
1968
1972
1976
1980
1984
1988
1992
1996
2000
2004
2008
TD
S (
mg
/L)
-24
-16
-8
0
Wate
r Level (m
BG
L)
TDS Water level
Figure B.19 Groundwater salinity data for bore WP12D showing decreasing trend
WP15
0
5000
10000
15000
20000
1964
1968
1972
1976
1980
1984
1988
1992
1996
2000
2004
2008
TD
S (
mg
/L)
-20
-15
-10
-5
0
Wate
r Level (m
BG
L)
TDS Water level
Figure B.20 Groundwater salinity and level data for bore WP15 showing no trend
WP19
0
5000
10000
15000
20000
25000
1964
1968
1972
1976
1980
1984
1988
1992
1996
2000
2004
2008
TD
S (
mg
/L)
-25
-20
-15
-10
-5
0
Wate
r Level (m
BG
L)
TDS Water level
Figure B.21 Groundwater salinity and level data for bore WP19 showing no trend

Gro
un
dw
ate
r chem
istry
of th
e W
eaber P
lain
59
Appendix C: Groundwater and surface-water sites sampled
Table C.1 Groundwater and surface-water sites sampled
Sampling site Easting Northing Group description RWL (m BGL)
Aquifer screened Geology screened Water type
10WP39I 486101 8295717 Intermediate 6.17 Clay sandy gravels & calcarenite
Gravels above Milligan’s Shale Ca-Na-HCO3-SO4-Cl
PB4M3D 473226 8271086 Dumas Lookout 5.55 Sandy gravel Basalt Na-Cl-HCO3
D4 drain 469874 8278380 Exit drain N/A N/A Na-Ca-Mg-HCO3-Cl
D8 drain 482269 8285621 Exit drain N/A N/A Na-Ca-Mg-HCO3-Cl
Keep River 506999 8297153 Keep River N/A N/A Na-Mg-Ca-Cl-HCO3
10WP38D 486102 8294961 Northern Weaber Plain
9.48 Shale/siltstone Milligan’s Shale Na-Mg-Cl-SO4
10WP40D 481575 8295996 Northern Weaber Plain
2.68 Clay/quartzite Quartzite Na-SO4-Cl
10WP41D 483696 8295563 Northern Weaber Plain
3.17 Clay silt and fine sand Quartzite Na-Cl-SO4
10WP42 487500 8295383 Intermediate 10.57 Sandy clays, sands & gravels Alluvial sediments Na-Ca-Mg-Cl-SO4-HCO3
10WP46 486609 8295879 Intermediate 7.94 Sandy clays & sands Alluvial sediments Na-Ca-Cl-SO4-HCO3
10WP47 488298 8295577 10WP47 13.32 Sandy clay & sands Alluvial sediments Ca-Na-HCO3-Cl
ORD21 (WP15)
493199 8295790 Northern Weaber Plain
14.74 Sand and gravel above sandstone
Sandstone (Langfield Group) Na-Cl-SO4
ORD22 (WP19)
494916 8298221 Northern Weaber Plain
13.79 Sand & gravel to mudstone Mudstone/shale (Milligan’s) Na-Mg-Cl-SO4
WP12M 489629 8294638 Northern Weaber Plain
15.66 Clayey silt Weathered Burvill Beds above mudstone/Milligan’s Shale
Na-Mg-Cl-SO4
(continued)

Gro
undw
ate
r chem
istry
of th
e W
eaber P
lain
60
Table C.1 Groundwater and surface-water sites sampled (continued)
Sampling site Easting Northing Group description RWL (m BGL)
Aquifer screened Geology screened Water type
WP16 483251 8291605 Northern Weaber Plain
5.05 Limestone Cecil sandstone Ca-Na-Mg-Cl-SO4
WP5 478568 8291625 Northern Weaber Plain
10.96 Basalt Basalt (Antrim Plateau Volcanics)
Mg-Ca-Cl-SO4
ORD20 (WP9) 491485 8293257 Intermediate 14.77 Calcreted clay, silt, some sand
Micaceous siltstone (Pincombe Formation)
Na-HCO3-Cl
10WP31 486515 8289743 Palaeochannel 8.66 Sands/clay & sands/ gravels Sands and gravel Mg-Na-Ca-HCO3-Cl
10WP32 486515 8290518 Palaeochannel 9.18 Sand/silt and sand/gravel Sands and gravel Na-Mg-HCO3-Cl
10WP32PB 486513 8290520 Palaeochannel 5.85 Sandy clay/sands & gravels Alluvial sediments Na-Mg-HCO3-Cl
10WP33 486516 8290136 Palaeochannel
8.39 Coarse sand & medium gravel
Gravels above sandstone Na-Mg-HCO3-Cl
10WP35N 481887 8288653 Palaeochannel 4.57 Coarse sands & sub-rounded gravels
Coarse sands and sub-rounded gravels
Na-HCO3
10WP35PB 481889 8288568 Palaeochannel 4.58 Coarse sands& sub-rounded gravels above siltstone
Siltstone Na-Mg-HCO3-Cl
10WP35Sth 481890 8288527 Palaeochannel 4.5 Coarse & fine sands with some medium gravels
Sandstone Na-Mg-HCO3
10WP36N 481885 8289637 Palaeochannel 4.29 Coarse sand & gravels Black shale (basement) Na-Mg-HCO3
10WP36PB 481886 8289596 Palaeochannel 4.31 Coarse sand & gravels Gravels Na-HCO3
10WP36Sth 481888 8289517 Palaeochannel 4.23 Coarse sand & gravels Coarse sand and gravels Na-HCO3
10WP37 481885 8289028 Palaeochannel 4.32 Coarse sand & gravels Coarse sand and gravels Na-HCO3-Cl
WP17 490959 8291076 Palaeochannel 14.24 Clayey sand & some gravel Basalt (Antrim Plateau Volcanics)
Na-Mg-HCO3
Parry Lagoons 420609 8280774 Parry Lagoons N/A N/A Na-Cl
Point Spring 487517 8296786 Point Spring N/A N/A Na-Ca-Mg-HCO3-SO4-Cl
M1 supply channel
469821 8254745 Supply channel N/A N/A Na-Ca-Mg-HCO3

Groundwater chemistry of the Weaber Plain
61
Appendix D: Analytical methods and detection limits
Table D.1 Analytical methods and detection limits
Analyte Method code Description Limit of
reporting Analysis
type* Units
Al iMET1WCICP Aluminium 0.005 B/C mg/L
Alkalin iALK1WATI Alkalinity, total expressed as CaCO3 mg/L
1 B/C
mg/L
As iMET1WCMS Arsenic 0.001 B/C mg/L
B iMET1WCICP Boron 0.02 B/C mg/L
Ba iMET1WCICP Barium 0.002 B/C mg/L
Be iMET1WCMS Beryllium 0.0001 B/C mg/L
Bi iMET1WCMS Bismuth 0.0001 B/C mg/L
Ca iMET1WCICP Calcium 0.1 B/C mg/L
Cd iMET1WCMS Cadmium 0.0001 B/C mg/L
Cl iCO1WCDA Chloride 1 B/C mg/L
Co iMET1WCICP Cobalt 0.005 B/C mg/L
CO3 iALK1WATI Carbonate 1 B/C mg/L
Cr iMET1WCICP Chromium 0.001 B/C mg/L
Cu iMET1WCICP Copper 0.002 B/C mg/L
DOC iCTO1WDCO Dissolved organic carbon as NPOC 1 C mg/L
ECond iEC1WZSE Electrical Conductivity, 25° C 0.2 B/C mS/m
F iF1WASE Fluoride 0.05 C mg/L
Fe iMET1WCICP Iron 0.005 B/C mg/L
Hardness iHTOT2WACA Hardness, total expressed as CaCO3
mg/L 1
B/C mg/L
HCO3 iALK1WATI Bicarbonate 1 B/C mg/L
Hg iHG1WCVG Mercury C
Hg iMET1WCMS Mercury 0.0001 C mg/L
K iMET1WCICP Potassium 0.1 B/C mg/L
La iMET1WCICP Lanthanum 0.005 B/C mg/L
Li iMET1WCICP Lithium 0.005 B/ mg/L
Mg iMET1WCICP Magnesium 0.1 B/C mg/L
Mn iMET1WCICP Manganese 0.001 B/C mg/L
Mo iMET1WCMS Molybdenum 0.001 B/C mg/L
Na iMET1WCICP Sodium 0.1 B/C mg/L
Ni iMET1WCMS Nickel 0.001 B/C mg/L
N_NH3 iAMMN1WFIA Nitrogen, ammonia fraction by FIA 0.01 B/C mg/L
N_NO3 iNTAN1WFIA Nitrogen, nitrate, nitrite fraction by FIA 0.01 B/C mg/L
N_total iNP1WTFIA Nitrogen, persulfate total by FIA 0.02 C mg/L
(continued)

Groundwater chemistry of the Weaber Plain
62
Table D.1 Analytical methods and detection limits (continued)
Analyte Method code Description Limit of
reporting Analysis
type* Units
Pb iMET1WCMS Lead 0.0001 B/C mg/L
pH iPH1WASE pH 0.1 B/C
P_SR iP1WTFIA Phosphorus, soluble reactive by FIA 0.01 B/C mg/L
P_total iPP1WTFIA Phosphorus, persulfate total by FIA 0.01 C mg/L
Sb iMET1WCMS Antimony 0.0001 B/C mg/L
Se iMET1WCMS Selenium 0.001 B/C mg/L
Si iMET1WCICP Silicon by ICPAES 0.05 B/C mg/L
Sn iMET1WCICP Tin 0.02 B/C mg/L
SO4_S iMET1WCICP Sulfate, sulphur expressed as sulfate 0.1 B/C mg/L
TDS sum ixTDS_Sum TDS by summation 1 B/C mg/L
U iMET1WCMS Uranium 0.0001 B/C mg/L
Zn iMET1WCICP Zinc 0.005 B/C mg/L
a-Endo RCS-OM-05 alpha-Endosulfan 0.01 µg/L
Aldrin RCS-OM-05 Aldrin 0.01 µg/L
Atrazine RCS-OM-31 Atrazine 0.1 µg/L
b-Endo RCS-OM-05 beta-Endosulfan 0.01 µg/L
Dieldrin RCS-OM-05 Dieldrin 0.01 µg/L
DIURON RCS-OM-35 Diuron 0.5 µg/L
Endrin RCS-OM-05 Endrin 0.01 µg/L
EndSulf RCS-OM-05 Endosulfan sulfate 0.01 µg/L
Hexazino RCS-OM-31 Hexazinone 2 µg/L
Lindan RCS-OM-05 Lindane 0.01 µg/L
METCL RCS-OM-54 Metolachlor 2 µg/L
Methoxyc RCS-OM-05 Methoxychlor 0.01 µg/L
Simazine RCS-OM-31 Simazine 0.5 µg/L
Tot-End RCS-OM-05 Total endosulfan 0.03 µg/L
* C = Comprehensive analysis, B = Basic analysis

Gro
un
dw
ate
r chem
istry
of th
e W
eaber P
lain
63
Appendix E: Water-quality analysis results
Table E.1 Water-quality analysis results
Irrigation water quality
(ANZECC and ARMCANZ Guidelines 2000)
Sampling sites
Long-term
Short-term
Cum. loading
D4 Drain PB4M3D 10WP39 10WP36
PB 10WP33 WP17
ORD22 (WP19)
D8 Drain ORD21 (WP15)
ORD20 (WP9)
WP12M 10WP35
PB WP5
Site ID D4 PB4 10WP39 WP36 WP33 WP17 WP19 D8 WP15 WP9 WP12 WP35PB WP5
Date 27/08/10 28/08/10 28/08/10 28/08/10 29/08/10 29/08/10 29/08/10 29/08/10 30/08/10 30/08/10 30/08/10 30/08/10 31/08/10
Time 15:40 7:45 11:30 15:00 7:15 10:30 13:45 15:45 7:15 9:30 11:30 13:45 7:00
Field EC (mS/m) 40.8 232 121.8 116.9 114.8 87 2640 38.2 1727 232 650 179 486
Field pH 7.84 7.1 7.44 6.93 7.35 6.65 8.69 7.08 7.23 6.79 7.04 7.08
ORP (mV) 153 145 84 153 133 141 30 160 -302 51 210 84 116
Dissolved Oxygen (mg/L)
5.9 2.7 0.72 0.82 2.58 1.9 1 8.86 0.82 1.43 3.5 1.29 7.56
Dissolved Oxygen (%)
78.4 36.8 10.4 9.2 33.9 25.4 13.7 110 11 18.6 46 17.6
Temperature (° C) 27.8 32 31.7 31.2 30.1 32.2 30.7 29.2 29.1 30.1 29.5 29.9 28.9
Total acidity (mg/L CaCO3)
20 60 40 60 180 20 260 60 100 120
Total alkalinity (mg/L CaCO3)
144 402 255 462 300 144 1590 492 462 630 600
Sample number CD4 CPB4 C10WP39 CWP36 CWP33 CWP17 CWP19 CD8 BWP15 CWP9 CWP12 CWP35PB BWP5
Lab Number 10E0540/
001 10E0540/
002 10E0540/
003 10E0540/
004 10E0540/
005 10E0540/
006 10E0540/
007 10E0540/
008 10E0540/
009 10E0540/
010 10E0540/
011 10E0540/
012 10E0540/
013
Aluminium (mg/L) 5 20 N/D 0.023 0.012 0.018 <0.005 <0.005 0.009 <0.005 0.17 <0.005 <0.005 <0.005 <0.005 <0.005
Alkalinity, total expressed as CaCO3 mg/L. (mg/L)
130 400 240 460 310
325
450 130 1480 500 425 590 550
(continued)

Gro
undw
ate
r chem
istry
of th
e W
eaber P
lain
64
* Exceeds guideline values
Table E.1 Water-quality analysis results (continued)
Irrigation water quality
(ANZECC and ARMCANZ Guidelines 2000)
Sampling sites
Long-term
Short-term
Cum. loading
D4 Drain PB4M3D 10WP39 10WP36
PB 10WP33 WP17
ORD22 (WP19)
D8 Drain ORD21 (WP15)
ORD20 (WP9)
WP12M 10WP35
PB WP5
Arsenic (mg/L) 0.1 2 20 kg/ha 0.001 0.002 0.006 0.004 <0.001 0.001 <0.010 <0.001 <0.005 0.002 <0.002 <0.001 0.003
Boron (mg/L) 0.5 Depends crop type
N/D 0.08 0.23 0.18 0.52* 0.11 0.12 0.94* 0.09 1.2* 0.2 0.5* 0.29 0.31
Barium (mg/L) 0.037 0.13 0.034 0.029 0.049 0.08 0.028 0.038 0.024 0.12 0.047 0.17 0.061
Beryllium (mg/L) 0.1 0.5 N/D <0.0001 <0.0001 <0.0001 <0.0001 <0.0001 <0.0001 <0.0010 <0.0001 <0.0005 <0.0001 <0.0002 <0.0001 <0.0001
Bismuth (mg/L) <0.0001 <0.0001 <0.0001 <0.0001 <0.0001 <0.0001 <0.0010 <0.0001 <0.0005 <0.0001 <0.0002 <0.0001 <0.0001
Calcium (mg/L) 20 66.1 84.4 27.8 45.6 23.3 810 19.1 67.1 34.5 209 76.9 267
Cadmium (mg/L) 0.01 0.05 2 kg/ha <0.0001 <0.0001 <0.0001 <0.0001 <0.0001 <0.0001 <0.0010 <0.0001 <0.0005 <0.0001 <0.0002 <0.0001 0.0002
Chloride (mg/L) 30 488 111 67 158 62 7960 35 4300 345 1430 205 1060
Cobalt (mg/L) 0.05 0.1 N/D <0.005 <0.005 <0.005 <0.005 <0.005 <0.005 <0.005 <0.005 <0.005 <0.005 0.01 <0.005 <0.005
Carbonate (mg/L) <1 <1 <1 <1 <1 <1 <1 <1 <1 <1 <1 <1 <1
Chromium (mg/L) 0.1 1 N/D <0.001 0.003 <0.001 <0.001 <0.001 0.002 <0.001 <0.001 <0.001 <0.001 <0.001 <0.001 <0.001
Copper (mg/L) 0.2 5 140
kg/ha <0.002 <0.002 <0.002 <0.002 <0.002 <0.002 0.009 0.004 <0.002 <0.002 <0.002 <0.002 0.005
Dissolved organic carbon as NPOC (mg/L)
3.4 <1.0 <1.0 4.3 <1.0 <1.0 <1.0 3.1 <1.0 11 110
Electrical Conductivity, 25°C (mS/m)
36.9 224 117 116 116 87.3 2660 38.4 1760 224 668 180 494
Fluoride (mg/L) 1 2 N/D 0.27 0.68 0.35 1.4* 0.28 0.51 <0.05 0.27 0.51 0.47 0.28
(continued)

Gro
un
dw
ate
r chem
istry
of th
e W
eaber P
lain
65
Table E.1 Water-quality analysis results (continued)
Irrigation water quality
(ANZECC and ARMCANZ Guidelines 2000)
Sampling sites
Long-term
Short-term
Cum. loading
D4 Drain PB4M3D 10WP39 10WP36
PB 10WP33 WP17
ORD22 (WP19)
D8 Drain ORD21 (WP15)
ORD20 (WP9)
WP12M 10WP35
PB WP5
Iron (mg/L) 0.2 10 N/D 0.02 0.008 0.016 <0.005 <0.005 <0.005 <0.005 0.065 <0.005 0.015 0.13 0.02 <0.005
Hardness, total expressed as CaCO3 mg/L. (mg/L)
96 340 320 170 300 150 5900 92 1200 270 1400 500 2400
Bicarbonate (mg/L)
159 488 293 561 378 397 549 159 1800 610 519 720 671
Mercury (mg/L) 0.002 0.002 2 kg/ha <0.0001 <0.0001 <0.0001 <0.0001 <0.0001 <0.0001 <0.0001 <0.0001 <0.0001 <0.0001 <0.0001
Potassium (mg/L) 3.6 7.2 20.8 1.9 3.3 3.1 29.1 3 9.6 4.2 45.3 3.8 5.5
Lanthanum (mg/L) <0.005 <0.005 <0.005 <0.005 <0.005 <0.005 <0.005 <0.005 <0.005 <0.005 <0.005 <0.005 <0.005
Lithium (mg/L) 2.5
(0.075 citrus)
2.5 (0.075 citrus)
N/D <0.005 <0.005 0.041 <0.005 <0.005 <0.005 0.08* <0.005 0.023 <0.005 0.11* <0.005 0.028
Magnesium (mg/L) 11.2 42.2 26 23.4 44.2 22.6 932 10.9 246 44 204 75.2 421
Manganese (mg/L) 0.2 10 N/D 0.006 0.011 0.008 <0.001 0.01 0.046 0.009 0.009 0.095 0.22* 1.8* 0.047 0.41*
Molybdenum (mg/L)
0.01 0.05 N/D <0.001 0.002 <0.001 0.006 <0.001 0.001 <0.010 <0.001 <0.005 0.002 <0.002 <0.001 0.002
Nitrogen (ammonia fraction). (mg/L)
5
25–125 reqs. site-
specific assessment
<0.01 <0.01 <0.01 <0.01 <0.01 1.8 <0.01 <0.01 <0.01 <0.01 <0.01 <0.01 <0.01
Nitrogen (nitrate, nitrite) (mg/L)
<0.01 2.3 <0.01 <0.01 0.05 0.23 <0.01 0.71 <0.01 0.03 <0.01 0.06 <0.01
Nitrogen (total) (mg/L)
0.3 2.9 0.18 0.92 0.19 3.6 0.62 1.2 0.22 0.36 0.13
Sodium (mg/L) 39.6 346 87.3 171 142 139 4580 41 3890 414 1070 234 266
Nickel (mg/L) 0.2 2 85 kg/ha <0.001 0.001 0.002 <0.001 0.002 0.001 <0.010 <0.001 <0.005 0.001 0.005 0.002 0.004
* Exceeds guideline values
(continued)

Gro
undw
ate
r chem
istry
of th
e W
eaber P
lain
66 Table E.1 Water-quality analysis results (continued)
Irrigation water quality
(ANZECC and ARMCANZ Guidelines 2000)
Sampling sites
Long-term
Short-term
Cum. loading
D4 Drain PB4M3D 10WP39 10WP36PB
10WP33 WP17 ORD22 (WP19)
D8 Drain ORD21 (WP15)
ORD20 (WP9)
WP12M 10WP35PB
WP5
Phosphorus (soluble reactive) (mg/L)
0.05 for irrigation
equip only
0.8–12 reqs. site-
specific assessment
0.01 0.02 0.01 0.05* 0.03 0.32* 0.02 0.01 0.11* 0.05* 0.02 0.03 0.01
Phosphorus (total) (mg/L)
0.03 0.86* 0.48* 0.32* 0.06* 0.62* 0.16* 0.08* 0.16* 0.06* 0.1*
Lead (mg/L) 2 5 260
kg/ha <0.0001 <0.0001 0.0001 <0.0001 <0.0001 <0.0001 <0.0010 0.0004 <0.0005 <0.0001 <0.0002 <0.0001 <0.0001
Antimony (mg/L) 0.0001 <0.0001 <0.0001 <0.0001 <0.0001 <0.0001 <0.0010 <0.0001 <0.0005 <0.0001 <0.0002 <0.0001 0.0004
Selenium (mg/L) 0.02 0.05 10 kg/ha <0.001 0.002 <0.001 <0.001 0.002 <0.001 <0.010 <0.001 <0.005 0.002 <0.002 <0.001 <0.001
Silicon (mg/L) 6.1 32 31 36 31 30 25 6.4 27 28 16 29 21
Tin (mg/L) <0.02 <0.02 <0.02 <0.02 <0.02 <0.02 <0.02 <0.02 <0.02 <0.02 <0.02 <0.02 <0.02
Sulfate (mg/L) 9.5 50.6 176 51.5 52.7 31.8 4600 14.6 2430 178 981 83.4 768
TDS by summation (mg/L)
190 1200 650 620 630 480 19000 200 12000 1300 4200 1000 3100
Uranium (mg/L) 0.01 0.1 N/D 0.0005 0.0071 0.0008 0.0034 0.002 0.0012 0.048* 0.0014 0.13* 0.0024 0.02* 0.0097 0.0034
Zinc (mg/L) 2 5 300
kg/ha 0.006 0.013 0.037 0.02 0.015 0.025 0.034 0.006 0.009 0.012 0.012 0.013 0.033
pH 8 7.9 8 8 8.2 7.6 7.3 8.3 7.6 7.7 7.4 7.5 7.7
(continued) * Exceeds guideline values

Gro
un
dw
ate
r chem
istry
of th
e W
eaber P
lain
67
Table E.1 Water-quality analysis results (continued)
Irrigation water quality
(ANZECC and ARMCANZ Guidelines 2000)
Sampling sites
Long-term
Short-term
Cum. loading
10WP38 10WP41 10WP40 10WP35S 10WP35N 10WP37 10WP36S 10WP36N 10WP32 10WP31 Point
Spring Keep River
Site ID WP38 WP41 WP40 WP35S WP35N WP37 WP36S WP36N WP32 WP31 PS1 KR1
Date 31/08/10 31/08/10 31/08/10 31/08/10 31/08/10 1/09/10 1/09/10 1/09/10 1/09/10 1/09/10 1/09/10 1/09/10
Time 12:30 13:30 15:00 16:00 16:30 6:20 7:00 7:45 8:50 9:30 12:00 13:30
Field EC (mS/m) 730 1496 943 129 110.3 179.6 149.3 138.9 122.1 37.7 13.9 59
Field pH 7.2 7.12 7.2 7.29 7.55 7.74 7.93 7.5 7.51 6.78 7.55 7.44
ORP (mV) 80 114 148 184 -197 -5 -82 133 173 173 199 212
Dissolved Oxygen (mg/L)
1.74 4 4.3 1.7 1.89 2.52 1.8 2.01 4.41 6.9 5.05 5.24
Dissolved Oxygen (%)
22.8 51.7 56.9 21.7 24 31 22.4 25.3 56.3 90.7 71.2 69.3
Temperature (° C) 29.1 28.6 28.9 28.3 27.2 26.9 26.3 26.7 28.1 29.5 33.2 30.5
Total acidity (mg/L CaCO3)
80 140 60 40 40 40 40 60 40 40 20 20
Total alkalinity (mg/L CaCO3)
90.3 684 744 465 516 576 600 537 420 147 72 120
Sample number BWP38 BWP41 BWP40 BWP35S BWP35N BWP37 BWP36S BWP36N BWP32 BWP31 CPS1 CKR1
Lab Number 10E0540/
015 10E0540/
016 10E0540/
017 10E0540/
018 10E0540/
019 10E0540/
020 10E0540/
021 10E0540/
022 10E0540/
023 10E0540/
024 10E0540/
025 10E0540/
026
Aluminium (mg/L) 5 20 N/D 0.013 <0.005 0.026 0.012 0.021 0.01 0.017 0.005 0.006 0.01 0.007 0.033
Alkalinity, total expressed as CaCO3 mg/L. (mg/L)
335 575 780 505 490 590 630 535 390 150 35 120
(continued)

Gro
undw
ate
r chem
istry
of th
e W
eaber P
lain
68 Table E.1 Water-quality analysis results (continued)
Irrigation water quality
(ANZECC and ARMCANZ Guidelines 2000)
Sampling sites
Long-term
Short-term
Cum. loading
10WP38 10WP41 10WP40 10WP35S 10WP35N 10WP37 10WP36S 10WP36N 10WP32 10WP31 Point Spring
Keep River
Arsenic (mg/L) 0.1 2 20 kg/ha <0.002 <0.005 0.003 0.002 0.002 0.002 0.015 0.004 0.001 <0.001 <0.001 <0.001
Boron (mg/L) 0.5 Depend.
Crop type N/D 1.3* 1.5* 1.5* 0.34 0.39 0.54* 1.1* 0.44 0.16 0.05 0.07 0.1
Barium (mg/L) 0.1 0.14 0.079 0.037 0.031 0.043 0.024 0.036 0.053 0.032 0.036 0.091
Beryllium (mg/L) 0.1 0.5 N/D <0.0002 <0.0005 <0.0002 <0.0001 <0.0001 <0.0001 <0.0001 <0.0001 <0.0001 <0.0001 <0.0001 <0.0001
Bismuth (mg/L) <0.0002 <0.0005 <0.0002 <0.0001 <0.0001 <0.0001 <0.0001 <0.0001 <0.0001 <0.0001 <0.0001 <0.0001
Calcium (mg/L) 267 353 297 39.7 18.8 38.4 15.5 57.1 42.2 24.5 5.8 22.5
Cadmium (mg/L) 0.01 0.05 2 kg/ha 0.0002 <0.0005 0.0002 <0.0001 <0.0001 <0.0001 <0.0001 <0.0001 <0.0001 <0.0001 <0.0001 <0.0001
Chloride (mg/L) 1350 4330 1310 88 49 226 82 107 143 35 9 86
Cobalt (mg/L) 0.05 0.1 N/D <0.005 <0.005 0.006 <0.005 <0.005 <0.005 <0.005 <0.005 <0.005 <0.005 <0.005 <0.005
Carbonate (mg/L) <1 <1 <1 <1 <1 <1 <1 <1 <1 <1 <1 <1
Chromium (mg/L) 0.1 1 N/D 0.007 0.015 0.022 0.018 0.023 0.009 0.011 0.008 0.009 0.007 0.003 <0.001
Copper (mg/L) 0.2 5 140 kg/ha 0.005 0.011 0.004 <0.002 <0.002 <0.002 <0.002 <0.002 <0.002 0.005 <0.002 <0.002
Dissolved organic carbon as NPOC (mg/L)
<1.0 <1.0
Electrical Conductivity, 25° C (mS/m)
722 1530 955 126 110 192 150 141 127 39.2 15 59.9
Fluoride (mg/L) 1 2 N/D 0.12 0.12
* Exceeds guideline values
(continued)
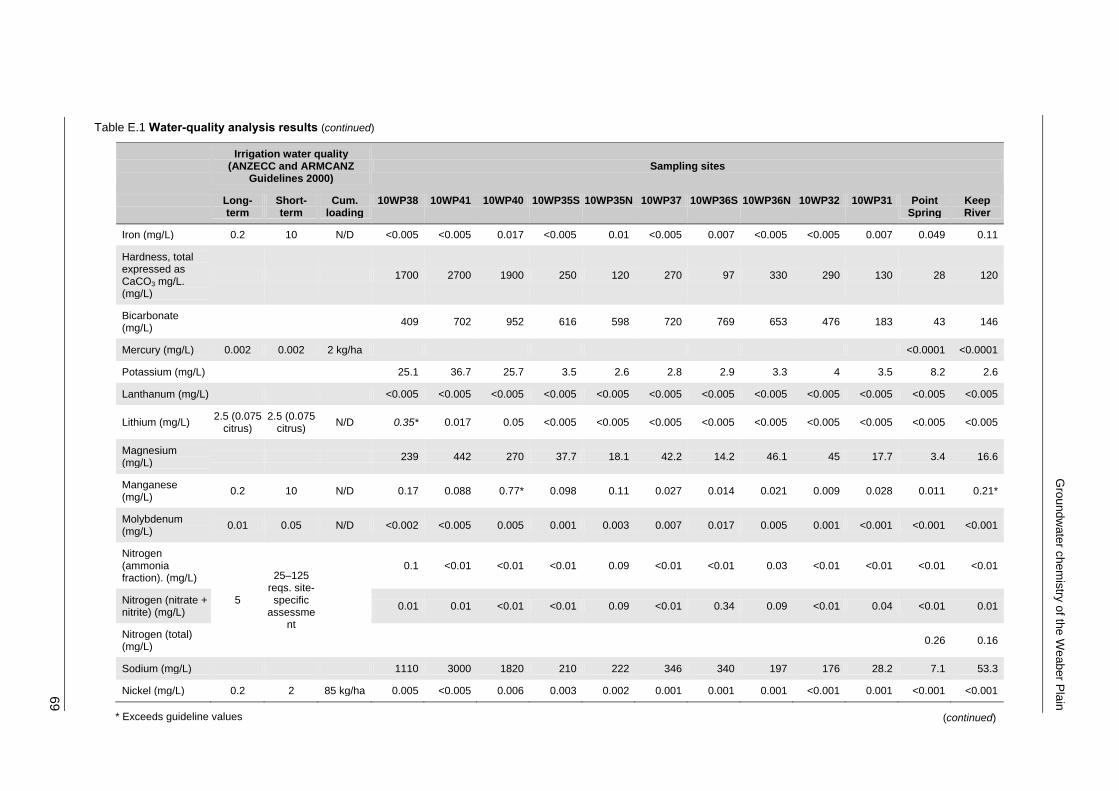
Gro
un
dw
ate
r chem
istry
of th
e W
eaber P
lain
69
Table E.1 Water-quality analysis results (continued)
Irrigation water quality
(ANZECC and ARMCANZ Guidelines 2000)
Sampling sites
Long-term
Short-term
Cum. loading
10WP38 10WP41 10WP40 10WP35S 10WP35N 10WP37 10WP36S 10WP36N 10WP32 10WP31 Point Spring
Keep River
Iron (mg/L) 0.2 10 N/D <0.005 <0.005 0.017 <0.005 0.01 <0.005 0.007 <0.005 <0.005 0.007 0.049 0.11
Hardness, total expressed as CaCO3 mg/L. (mg/L)
1700 2700 1900 250 120 270 97 330 290 130 28 120
Bicarbonate (mg/L)
409 702 952 616 598 720 769 653 476 183 43 146
Mercury (mg/L) 0.002 0.002 2 kg/ha <0.0001 <0.0001
Potassium (mg/L) 25.1 36.7 25.7 3.5 2.6 2.8 2.9 3.3 4 3.5 8.2 2.6
Lanthanum (mg/L) <0.005 <0.005 <0.005 <0.005 <0.005 <0.005 <0.005 <0.005 <0.005 <0.005 <0.005 <0.005
Lithium (mg/L) 2.5 (0.075
citrus) 2.5 (0.075
citrus) N/D 0.35* 0.017 0.05 <0.005 <0.005 <0.005 <0.005 <0.005 <0.005 <0.005 <0.005 <0.005
Magnesium (mg/L)
239 442 270 37.7 18.1 42.2 14.2 46.1 45 17.7 3.4 16.6
Manganese (mg/L)
0.2 10 N/D 0.17 0.088 0.77* 0.098 0.11 0.027 0.014 0.021 0.009 0.028 0.011 0.21*
Molybdenum (mg/L)
0.01 0.05 N/D <0.002 <0.005 0.005 0.001 0.003 0.007 0.017 0.005 0.001 <0.001 <0.001 <0.001
Nitrogen (ammonia fraction). (mg/L)
5
25–125 reqs. site-specific
assessment
0.1 <0.01 <0.01 <0.01 0.09 <0.01 <0.01 0.03 <0.01 <0.01 <0.01 <0.01
Nitrogen (nitrate + nitrite) (mg/L)
0.01 0.01 <0.01 <0.01 0.09 <0.01 0.34 0.09 <0.01 0.04 <0.01 0.01
Nitrogen (total) (mg/L)
0.26 0.16
Sodium (mg/L) 1110 3000 1820 210 222 346 340 197 176 28.2 7.1 53.3
Nickel (mg/L) 0.2 2 85 kg/ha 0.005 <0.005 0.006 0.003 0.002 0.001 0.001 0.001 <0.001 0.001 <0.001 <0.001
* Exceeds guideline values
(continued)

Gro
undw
ate
r chem
istry
of th
e W
eaber P
lain
70 Table E.1 Water-quality analysis results (continued)
Irrigation water quality
(ANZECC and ARMCANZ Guidelines 2000)
Sampling sites
Long-term
Short-term
Cum. loading
10WP38 10WP41 10WP40 10WP35S 10WP35N 10WP37 10WP36S 10WP36N 10WP32 10WP31 Point Spring
Keep River
Phosphorus (soluble reactive) (mg/L)
0.05 for irrigation equp only
0.8–12 reqs. site-specific
assessment
<0.01 0.01 0.01 0.04 0.15* 0.09* 0.12* 0.31* 0.03 0.04 0.01 0.01
Phosphorus (total) (mg/L)
0.04 0.02
Lead (mg/L) 2 5 260 kg/ha 0.0003 <0.0005 <0.0002 <0.0001 <0.0001 <0.0001 <0.0001 <0.0001 <0.0001 <0.0001 0.0042 <0.0001
Antimony (mg/L) 0.0006 <0.0005 <0.0002 <0.0001 <0.0001 <0.0001 0.0002 <0.0001 <0.0001 <0.0001 <0.0001 <0.0001
Selenium (mg/L) 0.02 0.05 10 kg/ha <0.002 <0.005 <0.002 <0.001 <0.001 0.007 <0.001 <0.001 0.002 <0.001 <0.001 <0.001
Silicon (mg/L) 10 20 29 27 28 30 34 36 39 33 9.7 15
Tin (mg/L) <0.02 <0.02 <0.02 <0.02 <0.02 <0.02 <0.02 <0.02 <0.02 <0.02 <0.02 <0.02
Sulfate (mg/L) 1660 2240 2820 50.5 29.8 102 50.1 75.3 56 3.3 13.9 46.4
TDS by summation (mg/L)
4900 11000 7000 730 630 1100 880 810 700 200 68 300
Uranium (mg/L) 0.01 0.1 N/D 0.0075 0.055* 0.038* 0.0056 0.0043 0.0043 0.0014 0.004 0.0016 0.0001 0.0001 0.0002
Zinc (mg/L) 2 5 300 kg/ha 0.083 0.083 0.017 0.022 0.01 0.01 0.013 0.012 0.012 0.014 0.064 0.007
pH 7.4 7.7 7.7 7.7 8.2 7.9 8.3 7.7 8 8.2 7.7 7.7
* Exceeds guideline values
(continued)

Gro
und
wate
r ch
em
istry
of th
e W
eaber P
lain
71
Table E.1 Water-quality analysis results (continued)
Irrigation water quality
(ANZECC and ARMCANZ Guidelines 2000)
Sampling Site
Long-term
Short-term
Cum. loading
10WP32PB 10WP35PB 0730
10WP35PB 1255
10WP36PB 1530
10WP36PB 10WP36PB 0800
10WP42 10WP46 10WP47 WP16 M1 supply
channel
Parry Lagoons
Site ID WP32PB WP35PB WP35PB WP36PB WP36PB WP36PB WP42 WP46 6WP47 WP16 M1 PL1
Date 2/10/2010 31/07/2010 31/07/2010 27/07/2010 29/07/2010 29/07/2010 28/09/2010 29/09/2010 1/10/2010 31/08/10 1/09/10 1/09/10
Time 7:30 12:55 15:30 8:00 9:15 15:30 16:30
Field EC (mS/m) 216 203 69.7 879 26.2 185.8
Field pH 8.26 8.3 8.5 6.53 8.43 9.4
ORP (mV) 187 176 76
Dissolved Oxygen (mg/L)
2.73 5.89 9.26
Dissolved Oxygen (%)
36.4 80 119.6
Temperature (° C) 28.7 29.6 28.3 29 30.8 28.6
Total acidity (mg/L CaCO3)
120 20 0
Total alkalinity (mg/L CaCO3)
501 114 96
Sample number 10WP32P 10WP35PB
0730 10WP35PB
1255 10WP36PB
1530 10WP36PB 10WP36PB
0800 10WP42 10WP46 10WP47 BWP16 CM1 CPL1
Lab number 10E0707/
001 10E0707/
002 10E0707/
003 10E0707/
004 10E0707/
005 10E0707/
006 10E0707/
007 10E0707/
008 10E0707/
009 10E0540/
014 10E0540/
027 10E0540/
028
Aluminium (mg/L) 5 20 N/D 0.12 <0.005 <0.005 <0.005 <0.005 <0.005 0.19 0.16 0.11 <0.005 0.011 0.008
Alkalinity, total expressed as CaCO3 mg/L
(mg/L)
375 530 530 460 510
505
285 285 235 375 105 70
(continued)

Gro
undw
ate
r chem
istry
of th
e W
eaber P
lain
72
Table E.1 Water-quality analysis results (continued)
Irrigation water quality
(ANZECC and ARMCANZ Guidelines 2000)
Sampling Site
Long-term
Short-term
Cum. loading
10WP32PB 10WP35PB 0730
10WP35PB 1255
10WP36PB 1530
10WP36PB 10WP36PB 0800
10WP42 10WP46 10WP47 WP16 M1 supply
channel
Parry Lagoons
Arsenic (mg/L) 0.1 2 20 kg/ha 0.001 <0.001 <0.001 0.006 0.005 0.006 0.002 0.002 0.001 <0.002 <0.001 0.002
Boron (mg/L) 0.5 Depend. crop type
N/D 0.06 0.25 0.24 0.56* 0.68* 0.72* 0.21 0.14 <0.02 0.17 0.07 0.14
Barium (mg/L) 0.053 0.065 0.065 0.028 0.027 0.027 0.032 0.018 0.11 0.055 0.032 0.099
Beryllium (mg/L) 0.1 0.5 N/D <0.001 <0.001 <0.001 <0.001 <0.001 <0.001 <0.001 <0.001 <0.001 <0.0002 <0.0001 <0.0001
Bismuth (mg/L) <0.0001 <0.0001 <0.0001 <0.0001 <0.0001 <0.0001 <0.0001 <0.0001 <0.0001 <0.0002 <0.0001 <0.0001
Calcium (mg/L) 35 38.5 38.5 24.7 25.1 25.1 104 96.4 67.3 726 15.3 12.7
Cadmium (mg/L)
0.01 0.05 2 kg/ha <0.0001 <0.0001 <0.0001 <0.0001 <0.0001 <0.0001 <0.0001 <0.0001 <0.0001 <0.0002 <0.0001 <0.0001
Chloride (mg/L) 222 97 97 53 60 61 331 303 51 2400 16 582
Cobalt (mg/L) 0.05 0.1 N/D <0.005 <0.005 <0.005 <0.005 <0.005 <0.005 <0.005 <0.005 <0.005 <0.005 <0.005 <0.005
Carbonate (mg/L)
24 <1 <1 <1 <1 <1 <1 <1 <1 <1 <1 <1
Chromium (mg/L)
0.1 1 N/D 0.002 <0.001 0.001 <0.001 <0.001 <0.001 <0.001 <0.001 0.002 <0.001 0.003 <0.001
Copper (mg/L) 0.2 5 140
kg/ha 0.004 <0.002 <0.002 <0.002 <0.002 <0.002 0.004 <0.002 <0.002 <0.002 <0.002 <0.002
Dissolved organic carbon as NPOC (mg/L)
1.1 1.1
Electrical conductivity, 25° C (mS/m)
157 133 134 111 118 118 222 207 64.9 895 27.6 187
Fluoride (mg/L) 1 2 N/D 0.19 0.19
* Exceeds guideline values
(continued)

Gro
un
dw
ate
r chem
istry
of th
e W
eaber P
lain
73
Table E.1 Water-quality analysis results (continued)
Irrigation water quality
(ANZECC and ARMCANZ Guidelines 2000)
Sampling Site
Long-term
Short-term Cum. loading
10WP32PB 10WP35PB 0730
10WP35PB 1255
10WP36PB 1530
10WP36PB 10WP36PB 0800
10WP42 10WP46 10WP47 WP16 M1 supply
channel
Parry Lagoons
Iron (mg/L) 0.2 10 N/D 0.44 0.006 0.007 <0.005 <0.005 <0.005 0.11 0.099 0.048 <0.005 0.018 0.11
Hardness, total expressed as CaCO3 mg/L. (mg/L)
240 250 250 150 150 150 500 450 230 3400 72 150
Bicarbonate (mg/L) 409 647 647 561 622 616 348 348 287 458 128 85
Mercury (mg/L) 0.002 0.002 2 kg/ha <0.0001 <0.0001
Potassium (mg/L) 4.1 2.2 2.2 1.7 1.7 1.7 23.3 24.5 11 6.1 2.3 12
Lanthanum (mg/L) <0.005 <0.005 <0.005 <0.005 <0.005 <0.005 <0.005 <0.005 <0.005 <0.005 <0.005 <0.005
Lithium (mg/L) 2.5
(0.075 citrus)
2.5 (0.075 citrus)
N/D <0.005 <0.005 <0.005 <0.005 <0.005 <0.005 0.05 0.037 0.008 0.009 <0.005 <0.005
Magnesium (mg/L) 37.1 37.4 38.1 20.7 21.5 20.3 57.5 49.8 14.5 389 8.2 29.5
Manganese (mg/L) 0.2 10 N/D 0.12 <0.001 <0.001 <0.001 <0.001 <0.001 <0.001 <0.001 <0.001 0.13 0.006 0.007
Molybdenum (mg/L) 0.01 0.05 N/D 0.002 <0.001 <0.001 0.009 0.009 0.009 0.001 <0.001 <0.001 <0.002 <0.001 <0.001
Nitrogen (ammonia fraction). (mg/L)
5
25–125 reqs. site-specific
assessment
0.04 <0.01 <0.01 <0.01 <0.01 <0.01 0.01 <0.01 0.01 <0.01 <0.01 <0.01
Nitrogen (nitrate + nitrite) (mg/L)
0.14 0.11 0.09 0.57 0.6 0.44 0.06 0.05 0.01 <0.01 <0.01 <0.01
Nitrogen (total) (mg/L)
0.38 0.18 0.09 0.64 0.59 0.44 0.15 0.14 0.12 0.19 2.3
Sodium (mg/L) 204 180 183 184 203 193 301 266 45.7 796 19.7 267
Nickel (mg/L) 0.2 2 85 kg/ha 0.002 <0.001 <0.001 <0.001 <0.001 <0.001 <0.001 <0.001 <0.001 0.005 <0.001 0.001
(continued)

Gro
undw
ate
r chem
istry
of th
e W
eaber P
lain
74 Table E.1 Water-quality analysis results (continued)
Irrigation water quality
(ANZECC and ARMCANZ Guidelines 2000)
Sampling Site
Long-term
Short-term Cum. loading
10WP32PB 10WP35PB 0730
10WP35PB 1255
10WP36PB 1530
10WP36PB 10WP36PB 0800
10WP42 10WP46 10WP47 WP16 M1 supply
channel
Parry Lagoons
Phosphorus ( soluble
reactive) (mg/L)
0.05 for irrigation
equip only
0.8–12 reqs. site-specific
assessment
0.07* 0.08* 0.08* 0.25* 0.26* 0.24* 0.03 0.03 0.05 0.01 <0.01 0.01
Phosphorus (total) (mg/L)
0.08* 0.06* 0.08* 0.24* 0.23* 0.22* 0.05* 0.04 0.05* 0.01 0.09*
Lead (mg/L) 2 5 260
kg/ha 0.0009 <0.0001 <0.0001 <0.0001 <0.0001 <0.0001 0.0015 0.0007 0.0005 <0.0002 0.0002 0.0003
Antimony (mg/L)
<0.0001 <0.0001 <0.0001 <0.0001 <0.0001 <0.0001 <0.0001 <0.0001 <0.0001 <0.0002 <0.0001 0.0001
Selenium (mg/L)
0.02 0.05 10 kg/ha 0.003 <0.001 <0.001 <0.001 <0.001 <0.001 <0.001 <0.001 <0.001 <0.002 <0.001 <0.001
Silicon (mg/L) 17 31 31 37 37 37 21 15 23 14 5.5 0.35
Tin (mg/L) <0.02 <0.02 <0.02 <0.02 <0.02 <0.02 <0.02 <0.02 <0.02 <0.02 <0.02 <0.02
Sulfate (mg/L) 110 46 45 36 40 42 360 340 25 1340 6.5 2.4
TDS by summation
(mg/L) 820 720 730 600 660 650 1400 1300 360 5900 130 950
Uranium (mg/L)
0.01 0.1 N/D 0.0035 0.015 0.016 0.0044 0.0048 0.0045 0.0075 0.0056 0.001 0.0048 0.0003 0.0003
Zinc (mg/L) 2 5 300
kg/ha 0.011 0.016 0.007 0.007 <0.005 0.014 0.011 0.009 <0.005 0.039 0.013 0.007
pH 8.4 7.7 8.1 8.3 7.9 8.3 8.2 8.2 8.3 7 8.4 8.4
* Exceeds guideline values

Gro
un
dw
ate
r chem
istry
of th
e W
eaber P
lain
75
Table E.2 Water-quality analysis (pesticides)
Parameter Sampling sites
PB4M3D 10WP39 10WP36PB 10WP33 WP17 D8 Drain
Lab number 10K0019/001 10K0019/002 10K0019/003 10K0019/004 10K0019/005 10K0019/006
Sample number CPB4 C10WP39 CWP36 CWP33 CWP17 CD8
Dated 28/08/2010 28/08/2010 28/08/2010 29/08/2010 29/08/2010 29/08/2010
alpha-Endosulfan (µg/L) <0.010 <0.010 <0.010 <0.010 <0.010 <0.010
Aldrin (µg/L) <0.010 <0.010 <0.010 <0.010 <0.010 <0.010
Atrazine (µg/L) 0.16 <0.10 <0.10 <0.10 <0.10 0.19
beta-Endosulfan (µg/L) <0.010 <0.010 <0.010 <0.010 <0.010 <0.010
Dieldrin (µg/L) <0.010 <0.010 <0.010 <0.010 <0.010 <0.010
Diuron (µg/L) <0.50 <0.50 <0.50 <0.50 <0.50 <0.50
Endrin (µg/L) <0.010 <0.010 <0.010 <0.010 <0.010 <0.010
Endosulfan sulfate (µg/L) <0.010 <0.010 <0.010 <0.010 <0.010 0.015
Hexazinone (µg/L) <2.0 <2.0 <2.0 <2.0 <2.0 <2.0
Lindane (µg/L) <0.010 <0.010 <0.010 <0.010 <0.010 <0.010
Metolachlor (µg/L) <2.0 <2.0 <2.0 <2.0 <2.0 <2.0
Methoxychlor (µg/L) <0.010 <0.010 <0.010 <0.010 <0.010 <0.010
Simazine (µg/L) <0.50 <0.50 <0.50 <0.50 <0.50 <0.50
Total endosulfan (µg/L) <0.030 <0.030 <0.030 <0.030 <0.030 <0.030
Bold values are above detection limits

Gro
undw
ate
r chem
istry
of th
e W
eaber P
lain
76
Appendix F: Piper diagram
80
60
40
20
20
40
60
80
20
40
60
80
20
40
60
80
20
40
60
80
20
40
60
80
Ca Na+K HCO3 Cl
Mg SO4
<=C
a +
Mg
Cl +
SO
4=>
M
M
M
N
N
N
M
M
M
L
L
L
K
K
K
J
J
J
A
A
A
H
H
H
P
P
P
F F
F
E
E
E
D
D
D
C
C
C
B
B
B
W
W
W
G
G
G
I
I
I
c
c
c
b
b
b
a
a
a
\
\
\
[
[
[
Z Z
Z
Q
Q
Q
XX
X
d
d
d
V
V
V
UU
U
T
T
T
z
z
z
SS
S
R
R
R
Y
Y
Y
X O RD22 ( W P19)
c 10W P47
b D4 DRAI N
a D8 DRAI N
\ KEEP RI VER
[ M 1 SUPPLY CHANNEL
Y W P5
Q O RD21 ( W P15)
W 10W P41D
d PARRYS LAG O O N
V PB4 M 3
U PO I NT SPRI NG
T Seawat er
z W P12M
S W P16
Z O RD20 ( W P9)
P 10W P36PB
N 10W P32
M 10W P32PB
L 10W P33
K 10W P35N
J 10W P35PB
I 10W P46
H 10W P36N
G 10W P42
F 10W P36St h
E 10W P37
D 10W P38D
C 10W P39I
B 10W P40D
A 10W P35St h
R W P17
Figure F.1 Piper diagram showing the major ion composition of samples collected

Groundwater chemistry of the Weaber Plain
77
Appendix G: Groundwater-modelling scenarios
Table G.1 Anticipated groundwater management from KBR (2011) modelling
Expected Worst case
Total required annual abstraction (GL/a) 6.3 8.8
Wet season
Days 110 110
Destination To Keep River To Keep River
Total abstraction (GL) 1.9 2.7
average per day (ML/d) 17.3 24.1
average per second (L/s) 200 280
Outcome Discharge to Keep River when flowing sufficiently
Discharge to Keep River when flowing sufficiently
Shoulder period
Days 55 55
Outcome No abstraction No abstraction
Dry season
Days 200 200
Destination To M2 Channel To M2 Channel
Total abstraction (GL) 3.6 4.8
Loading from not pumping in shoulder period 0.9 1.3
Total abstraction including loading (GL) 4.4 6.1
average per day (ML/d) 22.0 30.1
average per second (L/s) 255 356
Outcome Water to be added to irrigation water in the M2 Channel
Water to be added to irrigation water in the M2 Channel

Groundwater chemistry of the Weaber Plain
78
Appendix H: Modelled water quality of groundwater to be discharged to the supply channel
Table H1 Modelled water quality of source groundwater with potential to be pumped into the M1 supply channel compared with water-quality guidelines
Analyte
Water-Quality Guidelines (ANZECC and ARMCANZ 2000) Modelled
concentration of source
groundwater
Irrigation Aquatic ecosystems§
Long-term Short- term
Cum. loading Freshwater Marine
Aluminium (mg/L) 5 20 N/D 0.027 0.08
Alkalinity, total expressed as CaCO3 (mg/L)
438
Arsenic (mg/L) 0.1 2 20 kg/ha 0.001 (III)
0.0008 (V) 0.001
Boron (mg/L) 0.5 Depends on crop
type N/D 0.09 0.2
Barium (mg/L) 0.09
Beryllium (mg/L) 0.1 0.5 N/D 0.0003
Bismuth (mg/L) 0.0001
Calcium (mg/L) 63
Cadmium (mg/L) 0.01 0.05 2 kg/ha 0.00006 0.0007 0.0001
Chloride (mg/L) 276
Cobalt (mg/L) 0.05 0.1 N/D 0.00
Carbonate (mg/L) 1
Chromium (mg/L) 0.1 1 N/D 0.00001(VI) 0.0077 (III)
0.00014 (VI) 0.0009
Copper (mg/L) 0.2 5 140 kg/ha 0.001 0.00003 0.003
Dissolved organic carbon as NPOC (mg/L)
55
Electrical Conductivity, 25°C (mS/m)
2-25 180
Fluoride (mg/L) 1 2 N/D 0.4
Iron (mg/L) 0.2 10 N/D 0.15
(continued)

Groundwater chemistry of the Weaber Plain
79
Table H.1 Modelled water quality of source groundwater with potential to be pumped into the M1 supply channel compared with water-quality guidelines (continued)
Analyte
Water-Quality Guidelines (ANZECC and ARMCANZ 2000) Modelled
concentration of source
groundwater
Irrigation Aquatic ecosystems§
Long-term Short- term
Cum. loading Freshwater Marine
Hardness, total expressed as CaCO3 (mg/L)
378
Bicarbonate (mg/L) 522
Mercury (mg/L) 0.002 0.002 2 kg/ha 0.0001
Potassium (mg/L) 9
Lanthanum (mg/L) 0.003
Lithium (mg/L) 2.5 (0.075
citrus) 2.5 (0.075
citrus) N/D
0.01
Magnesium (mg/L) 53
Manganese (mg/L) 0.2 10 N/D 0.10
Molybdenum (mg/L) 0.01 0.05 N/D 0.001
Nitrogen (ammonia fraction). (mg/L)
5
25–125 requires.
site-specific assessmen
t
0.01 0.015 0.02
Nitrogen (nitrate + nitrite) (mg/L)
0.01 0.03 0.07
Nitrogen (total) (mg/L) 0.3 0.25 0.2
Sodium (mg/L) 288
Nickel (mg/L) 0.2 2 85 kg/ha 0.001
Phosphorus (soluble reactive) (mg/L) 0.05 for
irrigation equip only
0.8–12 requires
site-specific assessmen
t
0.004 0.005 0.05
Phosphorus (total) (mg/L)
0.01 0.02 0.10
Lead (mg/L) 2 5 260 kg/ha 0.001 0.0022 0.0006
Antimony (mg/L) 0.0001
Selenium (mg/L) 0.02 0.05 10 kg/ha 0.002
Silicon (mg/L) 24
Tin (mg/L) 0.01
Sulfate (mg/L) 183
TDS by summation (mg/L)
1156
(continued)

Groundwater chemistry of the Weaber Plain
80
Table H.1 Modelled water quality of source groundwater with potential to be pumped into the M1 supply channel compared with water-quality guidelines (continued)
Analyte
Water-Quality Guidelines (ANZECC and ARMCANZ 2000) Modelled
concentration of source
groundwater
Irrigation Aquatic ecosystems§
Long-term Short- term
Cum. loading Freshwater Marine
Uranium (mg/L) 0.01 0.1 N/D 0.006
Zinc (mg/L) 2 5 300 kg/ha 0.0024 0.007 0.01
pH 6-8 7-8.5 7.8
§Toxicants are based on 99% level of protection. Other values are based on the default values for tropical
lowland rivers and estuaries
Modelled concentrations in bold red exceed ANZECC/ARMCANZ (2000) guidelines for freshwater ecosystems

Groundwater chemistry of the Weaber Plain
81
Appendix I: Proposed groundwater monitoring
Table I.1 Proposed field and laboratory groundwater monitoring parameters
Description Analyte Method
code
High- intensity
bore i
Low- intensity
bore ii
Farm bores
iii
Field
Electrical conductivity, 25° C Y Y Y
pH Y Y Y
Oxidation–reduction potential (ORP) as standard hydrogen electrode
Y Y
Alkalinity (as CaCO3) Y Y
Acidity, as CaCO3 Y Y
Laboratory
Acidity, as CaCO3 Acid 1 Y
Silver Ag 6 Y
Aluminium Al 6 Y
Alkalinity, total expressed as CaCO3 mg/L. Alkalin 2 Y
Arsenic As 7 Y
Boron B 6 Y
Barium Ba 6 Y
Beryllium Be 7 Y
Bismuth Bi 7 Y
Calcium Ca 6 Y
Cadmium Cd 7 Y
Chloride Cl 3 Y
Cobalt Co 6 Y
Carbonate CO3 2 Y
Chromium Cr 6 Y
Copper Cu 6 Y
Dissolved organic carbon as NPOC DOC iCTO1WDC Y
Electrical conductivity, 25°C ECond 4 Y Y
Fluoride F iF1WASE Y
Iron Fe 6 Y
Gallium Ga Y
Hardness, total expressed as CaCO3 mg/L. Hardness 5 Y
Bicarbonate HCO3 2 Y
Mercury Hg iHG1WCVG Y
Mercury Hg 7 Y
Potassium K 6 Y
Lanthanum La 6 Y
(continued)

Groundwater chemistry of the Weaber Plain
82
Table I.1 Proposed field and laboratory groundwater monitoring parameters (continued)
Description Analyte Method
code
High- intensity
bore i
Low- intensity
bore ii
Farm bores
iii
Lithium Li 6 Y
Magnesium Mg 6 Y
Manganese Mn 6 Y
Molybdenum Mo 7 Y
Sodium Na 6 Y
Nickel Ni 7 Y
Nitrogen, ammonia fraction by FIA N_NH3 iAMMN1WFI Y
Nitrogen, nitrate, nitrite fraction by FIA. N_NO3 9 Y
Nitrogen, persulfate total by FIA N_total 8 Y Y
Lead Pb 7 Y
pH pH 11 Y
Phosphorus, soluble reactive by FIA P_SR 10 Y
Phosphorus, persulfate total by FIA. P_total 12 Y Y
Antimony Sb 7 Y
Selenium Se 7 Y
Silicon by ICPAES Si 6 Y
Tin Sn 6 Y
Sulfate, sulphur expressed as sulfate SO4_S 6 Y
Total dissolved solids TDS sum 13 Y
Uranium U 7 Y
Zinc Zn 6 y
Atrazine Atrazine RCS-OM-31 Y Y
Method Codes
1 Acidity or acids by titration APHA 2310B
2 Alkalinity (as CaCO3) and constituents by acid titration (APHA 2320B).
3 Colorimetric analysis by DA (discrete autoanalyser), APHA and in-house methods
4 Electrical conductivity in water compensated to 25C (APHA 2510B)
5 Total hardness as mg/L CaCO3 by calculation from calcium and magnesium (APHA 2340 B)
6 Total dissolved metals by ICPAES (APHA 3120)
7 Total dissolved metals by ICPMS (APHA 3125)
8 Total nitrogen by persulphate digestion FIA (APHA 4500N-C, I)
9 Nitrate + nitrite expressed as nitrogen by FIA (APHA 4500NO3-I
10 Phosphorus soluble reactive as P in water by FIA (APHA 4500P-G)
11 pH in water by pH meter (APHA 4500H+)
12 Total phosphorus by persulphate digestion and FIA (APHAP-J, G)
13 Total dissolved solids (TDS) by summation or calculated from electrical conductivity
N_NH3 iAMMN1WFI nitrogen, ammonia fraction by FI
Frequency
i) The high-intensity bores should have full analysis seasonally for initial period to establish baseline conditions. Then seasonal monitoring for basic parameters (electrical conductivity, pH, ORP, total nutrients and atrazine) with comprehensive analysis every three years unless field parameters deviate from baseline conditions by 20 per cent.
ii) Analysis to establish baseline conditions should be seasonal, then annually, except field parameters, which should remain seasonal.
iii) Analysis should be undertaken annually.