planned utilization of groundwater basins - coastal plain ... · herbert w. gre!daiios engineer the...
TRANSCRIPT

SDMS DOCID# 1144638


/
STATE OF CALIFORNIA
The Resources Agency
Department of Water Resources
BULLETIN No. 104
PLANNED UTILIZATION OF
GROUND WATER BASINS:
COASTAL PLAIN OF
LOS ANGELES COUNTY
SEPTEMBER 1968
NORMAN B. LIVERMORE, JR. RONALD REAGAN WILLIAM R. GIANELLI Administrator
· The Resources Agency Governor
State of California
LIBRARY UNIVERSITY OF CALIFOR.N lA
DAVIS
Director Department of Water Resources

FOREWORD. • , ,
ACKNOWLEDGMENTS •
ORGAN! ZA TION , •
ABSTRACT •••
CONCEPT UNDERLYING WATER PLANNING ,
I. INTRODUCTION, , , , , , • , , , ,
II.
Objective of the Investigation, •
Area of Investigation • •
Conduct of ~vestigation, ,
INVENTORY OF WATER DEMAND AND SUPPLY, ,
Water J:emand,
Water Supply. •
Imported Water Supply, ,
Local Water Supply , • ,
• • • 0 •
Detailed Discussion of Ground Water Supply, •
Currently Available Water in storage
Replenishment of Ground Water.
Reduction of Water from Ground Water Basins • • ,
III. INVENTORY OF FACILITIES , • , , •• •
iii
iv
v
v
vi
4
5
5
5
7
8
8
8
9
12
13
Ground Water Basins as Delivery Facilities, , 13
Imported Water Delivery Facilities •••
Common Delivery Facilities •• . . . . . IV. ECONOMIC EVALUATION •
Variables ~ , , • •
Evaluation of Variables by Application to Alternative Plans ••
Cost of Water Service
Present Worth ••
Economic Evaluation.
Concluding Remarks •••••
15
16
17
17
17
19
23
23
25
II
FIGURES
Financial Management Planning, •
2 Water Management Planning ••••
3 Location Map of the Coastal Plain of Los Angeles County ••
4 Seasonal Precipitation
5 Water Supply, Use, and Disposal, ••
6 Comparative Magnitude of Supply in 1957 ••
7 Water Demand • , , • • • • • • ••
8 Location of Ground Water Basins and Semipermeable and Permeable Areas,
9 Lines of Equal Elevation on the Base of Fresh Water-Bearing Sediments •••
1 0 Pattern of Ground Water Extractions in 1 956 ·
.vi
.vi
2
2
3
4
6
9
10
and Location of Artificial Recharge Projects • 14
11 Existing and Assumed Future Distribution Facilities of The Metropolitan Water District of Southern California. • 15
12 Water De~~ds and Supplies ••••••• • • 18
13 Nomograph to Determine Present Worth of Total Cost of Water Service in the Coastal Plain Under Variable Conditions Affecting the Price of Imported Water - 1963 Through 1990 ••••• 24
TABLES
Operational Plan "A"
2 Operational Plan "B" . . /
19
• 20
3 Operational Plan 11 C11 20
4 Operational Plan 11D11 • , 21
5 Total Amounts of Components of Water Demand and Supply in the Coastal Plain of Los Angeles County for the Study Period 1963 'l'hrough 1990 for Selected Plans of Operation • 22
6 Present Worth of Future Total Costs of Water Service in the Coastal Plain of Los Angeles County ••• , •••••••• , 23

/
FOREWORD
At present, more than half the water supply of Southern California's south coastal area comes from its ground water basins. In general, extractions from this source exceed replenishments, resulting in a decline of ground water level elevations. The Central and West Basin Water Replenishment District and other water entities have contributed significant~ in managing the basins effectively.
However, there is a need for information related to the optimum conjunctive use of ground water resources with other local and imported water supplies.
The Department of Water Resources, recogn~zLng this need, has undertaken a comprehensive study of the planned use of Southern California 1 s major ground water basins. The Coastal Plain of Los Angeles County was selected as the first area to be investigated.
Statutory authority for the Department to conduct investigations of surface and subsurface water conditions is contained in Section 226 of the California Water Code. Statutory authority for investigation of ground water conditions is conferred under the Porter-Dolwig Ground Water Basin Protection Law, Water Code Section 12920 and those that follow, and Water Code Section 231.
In this investigation, comprehensive studies were made of the geology, hydrology, and operations-economics of the ground water basins in the Coastal Plain of Los Angeles County. Detailed information issuing from these studies was presented earlier in Appendixes A, B, and C to Bulletin No. ld!. This bulletin is intended to serve as a brief, but comprehensive summary of the findings of these studies.
iii
"; - · · f... (._·/ I -__ t. ._ J~ L,~ •• .._ , <__., ~. a.<- L l .:_
William R. Gianelli, Director Department of Water Resources The Resources Agency State of California August 26, 1968

ACKNOWLEOOMENTS
The Department of Water Resources acknowledges the information and advice provided by various state and local agencies during the preparation of this report and its appendixes.
Especially helpful was the assistance of the following:
Federal Agencies
U. S. Geological Survey, Long Beach
State Agencies
Department of Conservation, Division of Mines and Geology and Division of Oil and Gas
Department of Public Works, Division of Highways ' ,
Public Utilities Commission Water Resources Control Board
~os Angeles County Agencies
Assessor Regional Planning Commission Sanitation Districts of Los Angeles County Waterworks Districts 10, 13, and 16 Museum of Natural History.
Special Districts
Central Basin Municipal Water District Central and West Basin Water Replenishment
District Downey County Water District Los Angeles County Flood Control District The Metropolitan Water District of
Southern California Orange County Water District Orchard Dale County Water District South Montebello Irrigation District
City Water Departments
Bellflower Beverly Hills Compton El Segundo Hawthorne Huntington Park Inglewood Lakewood Long Beach
Los Angeles Lynwood Manhattan Beach Santa Monica Signal Hill South Gate Torrance Vernon Whittier
iv
Private Water Companies
California Water Service Company Conservative Water Company Dominguez Water Corporation Laguna-Maywood Mutual Water Company La Habra Heights Mutual Water Company No. 3 La Mirada Water Company Maywood Mutual Water Company No. 3 Montebello Land and Water Company Pacific Water Company Park Water Company Peerless Land and Water Company San Gabriel Valley Water Company Somerset Mutual Water Company Southern California Water Company Southwest Water Company Suburban Water Systems Tract 180 Mutual Water Company Walnut Park Mutual Water Company No. 3
Other Companies
Continental Can Company, Inc. McD9nnell-Douglas Corporation Electronic Associates , Fibreboard Paper Products Corporation The Flintkote Company International Business Machines Corporation Mobil Oil Company Oil Operators, Inc, Atlantic Richfield Corporation Shell Oil Company Signal Oil and Gas Company Standard Oil Company of California Texaco, Inc, Union Oil Company of California Western Gulf Oil Company
Universities and Colleges
The Associated Colleges of Claremont The California Institute of Technology California State College at Long Beach The University of California at Los Angeles The University of California at Riverside The University of Southern California
Southwest Museum San Gabriel Valley Protective Association

State o! call!omia 'lho JleiiOlU'CeO .lgenc;r
llEP.lRn!ENT 01' WATER RESOURCES
HD!IAID RE.Ill.lll, Go.,.rnor
/
HORM.lll B. LIVmllRE, JR., l.dm1n1atrator, The Reaoureea ~01107 WILLIAM R. OIAN!LLI, Director, Depart..ent ot Water Reaourcaa
Jcml R. T!!ER:INX, Deput;r Director, Dep&rbn.ent o! Water Re8ourc88
OOtnm:RN DISDUCT
J...,a J. llooclT• • • • • •••••••••••••• Dl.atri<lt Enginear Jaclc J. Coo •••••••••••••••••••• Olio!, P1.ann1ng Branch Erneat II. Weber •••••••••• Olie!, Plarm1ng Inv•urt.i&atioM Section
~obi w. l!l.dolt ••
IIU!ord M. Scbrecongoat • • Dennia Do.olalr • • Charlea R. White ••••••
.auer, Jl1drolos;r and Water Ut1llzat1on Ull1 t, and Program Manager
J.aaiated b7
• • • • .J.aacciate Engineering Geologiot •• • Alleociate En,gineer, Water Re:80'Ul"cee • • • Alleociate Eng:lneer, Water Reeourcea
*llObiirt f. b. Chun wu 0880Ciated with th1a prcgrOill aa Progr.,. Manager and Sec"'.ion Olie! !rem June 19>9 tc J.ugwrt 1967.
Abstract
IRI. J. CHRISIWI, Cllaiman, Viaalh
WILLll!! H. JE!lNIIDS, Vica Olaiman, La He ..
liDIIll KOSTER, Srnartvil.l.a
R.U' W. lEIDUOON, Ontario
CLAIR A. HILL, Redding
WILLll!! P. MJSES, Sen Pablo
lllRRIS POuu;oN, La Jolla
IIARJDN R. WALXER, Ventura
-----0-----WILLll!! M. ClRAII
Ex!Jcu ti ve Secretary'
HERBERT W. GRE!DAIIOS Engineer
The water demand of the Coastal Plain of Los Angeles County is approximately 86o,OOO acre-feet a year at present and is expected to grow to 1,200,000 acre-feet by 1990. Water supply from various sources which include the Loa Angeles Aqueduct, the Colorado River Aqueduct and soon the State Water Project will be adequate at least until 1990. One of these sources of supply is the ground water basin in the Coastal Plain. Approximately 35 million acre-feet of fresh water is believed to be in storage at present. In the report, four alternative plana of conjunctive use of ground and surface water resources to meet future water requirements in the service area were analyzed. From this analysis understanding evolved regarding the economic impact of pumping schedule and pattern, spreading schedule of imported water, and methods of preventing sea-water intrusion. It was found that the most significant economic factors are the price of imported water and the proportionate use of imported water and ground water in storage.
v

CONCEPT UNDERLYING WATER PLANNING
Water is a commodity that meets basic human needs; without it, life cannot continue. This faat has made us somewhat emotional about water and we have come to treat water differently from other commodities.
However, water is a most abundant commodity. It cannot be destroyed; it is used and then it returns to be used again. Water is around us in many forms. By means of treatment and timely delivery, which may be either expensive or inexpensive, this water can be put to a II uses to meet our needs any place on earth. ,It is, then, not difficult to conclude that all the water needs of any area, now and in the future, can be met with proper planning.
ELEMENTS OF PLANNING. An analogy between financia I planning and water resources planning wi II help to identify the elements to be considered.
Figure 1 represents the components that are considered in family financial planning. To ensure
ANNUAL INCOME
PAY OFF COMPARISON ALL r- OF
DEBTS Fl NANCIAL
ASSETS r--. v BUYOR ~ STATUS IN
FUTURE
MANAGEMENT ~START A:; J ALTERNATIVE~ 1\ BUSINESS BORROWING f--
CAPABILITIES f':ONTINUE DECISION
AS BEFORE
OBLIGATIONS
Fig. 1
Fl NANCIAL MANAGEMENT PLANNING
vi
sound financial planning, a complete inventory must be taken of supply of money in terms of annual income, assets, and borrowing capabilities, as well as an inventory of financial obligations. For financially advantageous decision-making, various alternative ways of meeting financial obligations and of increasing income must be considered very carefully. Only after a full evaluation of the advantages and limitations of various alternatives should a plan be select
ed and implemented.
Figure 2 represents the ana I ogous components of water resources planning. This process involves;
1. Inventory of needs, supplies and associated facilities.
2. Formulation of alternative schemes of meeting needs.
3. Evaluation of advantages and limitations of alternatives.
4. Selection of a plan.
5. Implementation of the selected plan.
.!:!YDROLOGY
LOCAL WATER SUPPLY
GEOLOG' ~ STORAGE
ALTERNATIVE CAPABILITIES COMPARISON TRANSMISSIVE f-1 OF
CAPACITIES Fl LL UP ECONOMIC
WATER IN BASIN IMPACT OF STORAGE v I/ fA.LTERNATIVES
ALTERNA-ALTERNATIVE
OPERATION &
f- USE ~:RT OF/ J ECONOMICS TIVES IMPORTED ...... WATER IN
WATER 1\ STORAGE AVAILABILITY ' ALTERNATIVE DECISION . O'"ATION & v CAUSE NO ECONOMICS CHANGE IN
ANNUAL STORAGE WATER
REQUIREMENT EMERGENCY
REQUIREMENT
Fig. 2 WATER MANAGEMENT PLANNING

/
INTRODUCTION
llie management o.f its water resources has been o.f vital concern to Southern Cali.fornia .from the time it was first settled. This has been especially true in the Coastal Plain o.f Los .Angeles Count,y. The increasing demand for water in this area and the economic realities of obtaining that water have made it clear that local water managers must have available to them in.formation related to comprehensive alternative water supply plans in order to make an informed selection of the most suitable plan. A necessary prerequisite to the formulation of such plans is the collection and analysis of data pertinent to the problems o.f water need and supply, especially concerning the ground water resources.
A study has been completed to .furnish information on alternative plans. Its findings, in detail and in depth, were published previously in Appendixes A, B, and C, to Bulletin No. 104, covering the areas o.f geology, hydrology, and operations and economicso These findings are summarized in this bulletin.
OBJECTIVE OF THE INVESTIGATION
llie objective o.f the investigation is to provide information on a wide range of alternative plans to be used as a guide by local agencies .for selecting a plan for managing the ground water supplies in the Coastal Plain in coordination with surface water supplies and .facilities.
-1-
AREA OF INVESTIGATION
The region selected for this study lies in the heart of the Los Angeles urban complex. It covers approximately 600 square miles and contains all or part o.f 42 incorporated cities, including a large part o.f the metropolitan section o.f the City o.f Los Angeles.
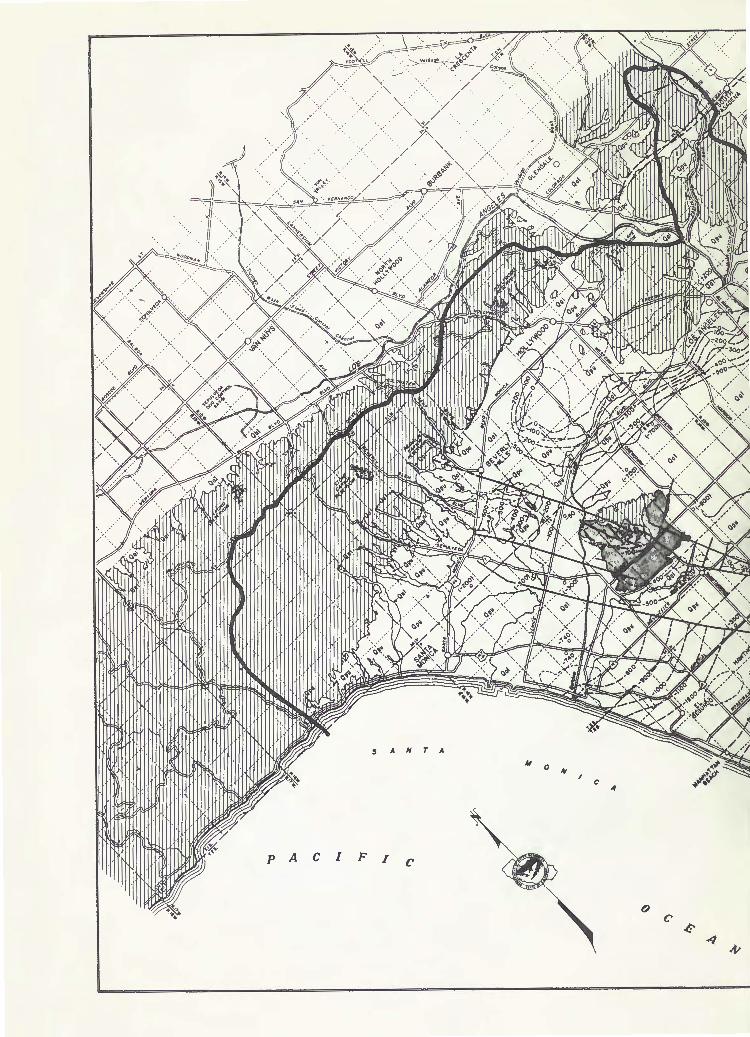
Physically, the Coastal Plain of Los Angeles County is an almost featureless, semiarid .flatland that slopes gently toward the sea (Figure 3). On the north, it is bounded by the Santa Monica Mountains, extending inland .from Malibu. On the northeast, the plain is hemmed in by another mountainous ridge, though not as steep, .formed by the Elysian, Repetto, Merced, and Puente Hills. Through them slice the channels of the Los Angeles and the San Gabriel Rivers and the Rio Hondo on their journey to the ocean. Tb the south, the massive hump of the Palos Verdes Hills .forms a solid barrier between Santa Monica Bay and San Pedro Bay. 'lhe Coastal Plain is bounded on the west by the Paci.fic, while its eastern boundary is not a physical, but rather a political, one-the line that separates Los Angeles County from Orange County.
Annual precipitation for the study area averages about 15 inches and varies widely from year to year as shown on Figure 4.
At present, more than 4,ooo,ooo persons live within the Los Angeles County
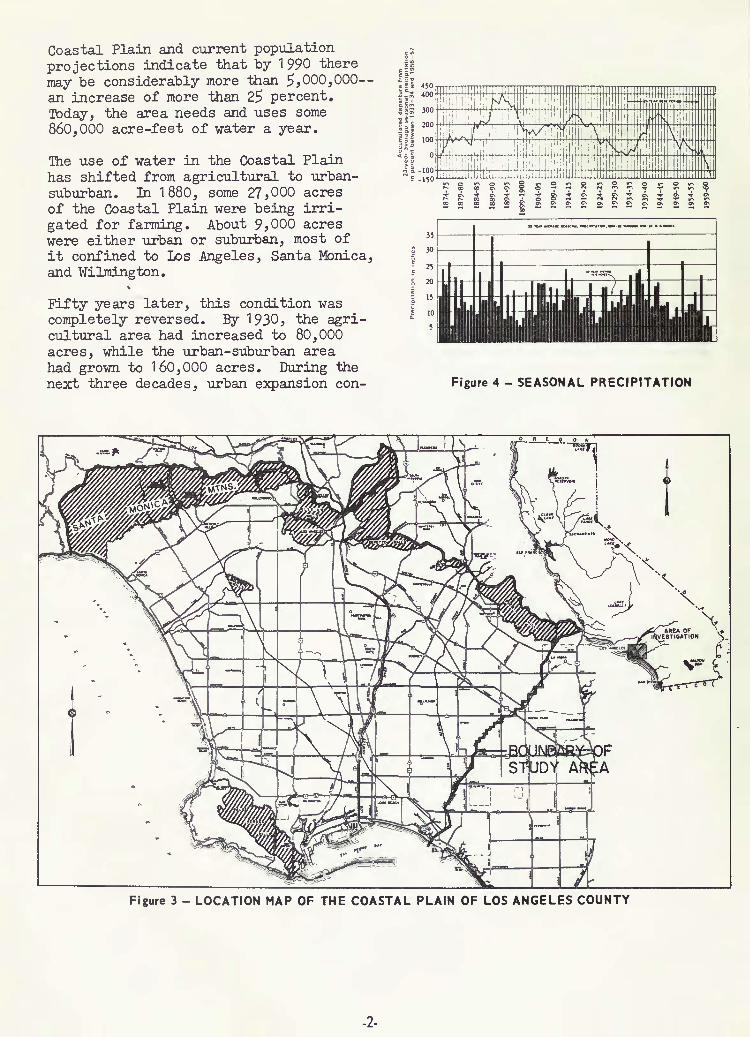
Coastal Plain and current population projections indicate that by 1990 there may be considerably more than 5,000,000-an increase of more than 25 percent. Today, the area needs and uses some 860,000 acre-feet of water a year.
The use of water in the Coastal Plain has shifted from agricultural to urbansuburban. In 1880, some 27,000 acres of the Coastal Plain were being irrigated for farming. About 9,000 acres were either urban or suburban, most of it confined to Los Angeles, Santa Monica, and Wilmington.
Fifty years later, this condition was complete]y reversed. By 1930, the agricultural area had increased to 80,000 acres, while the urban-suburban area had grown to 1 60, 000 acres. During the next three decades, urban expansion con-
"' 0 "' "' ~ :± .., ... "' ~ :: ... ~ "' !': !': !': 2) 2)
35 ~--~----------------------------~
~ ~--~~------------------+-------~ 25 f------1---,J--_.__.---- -------------1--~f----1
20 f-H-h---+1--.HI----.r.;::;--1H-----=-....:.::..::t-l-l:-f---:----l-+~
15
10
Figure 4- SEASONAL PRECIPITATION
t
Figure 3- LOCATION MAP OF THE COASTAL PLAIN OF LOS ANGELES COUNTY
-2-

HISTORICAL AND PROJECTED WATER DEMAND
1935 1940 1950 1960 1970 1980 1990
WATER OEMA:IIO lA CRE-E EETl
370,000 450,000 610,000 800,000
1 ,001,000 1 '163,000 1,218,000
0 z ~ ~-UJ ..... 0~ a:'+;" UJ<I) 1-'-~() :s:(tl -oo UJC/l - c ...Jo a,,_ a..-~= ...JE ~c ::J::. z z ~
13t 1.2
1 .1
1.0
.9
.8
.7
.6
.5
.4
.3 HISTORICAL I PROJECTED
I o~~~--~~~~~~~~~~~~
1930 1940 1950 1960 1970 1980 1990 YEAR
PAST AND PROJECTED APPLIED WATER DEMANDS FOR THE COASTAL PLAIN OF LOS ANGELES COUNTY
~ :I: ~ 140 .-------.------r----.....----~ 0 ::11
w
" ~ a: w ~ u.O oz ~
>--::~; zw t!O a: a: "-'W a. ..
!!;~ 0 z ~ ::11 w 0
a: w >--
~ ~ :I: >-
iS ::E
120
80
oL---~----~-----~--~ JAN AP'I JULY OCT JAN.
MONTH
AVERAGE MONTHLY WATER DEMAND
FLOW FROM DISTRIBUTION SYSTEMS
OI~ZM.,----~6~----=IZ:-N _._ __ ~6 ------7,1ZM
HOUR
TYPICAL HOLRLY WATERD::M.I\NI) 0\J A MAXIfv1UM WATER DEMAND
DAY
Figure 7- WATER DEMAND
-6-

/
conversion plant on Eolsa Island in Orange County has been considered for many years by The Metropolitan Water District of Southern California (MWD). However, present indication is that thE plant will not be built.
Imported Water Supply
Present supplies of imported water include Colorado River water, Owens RiverMono Basin water, ground water from the San Fernando Valley, and ground water and reclaimed waste water from the San Gabriel Valley. In the future, these supplies will be augmented by water from the State Water Project.
Colorado River water, which is distributed by MWD, is a major source of imported water to the Coastal Plain. Softened, filtered, and untreated waters are now available for use from MWD. Softened and filtered waters are used for applied
Department of Water and Power, which utilizes two primary sources to supply the City's needs in the coastal Plain: imported water from the Owens RiverMono Basin and ground water from San Fernando Valley.
In view of the anticipated rate of development in the San Fernando Valley, more water imported from Owens RiverMono Basin will be used in the valley by the City of Los Angeles. However, exports of ground water from the valley to the Coastal Plain will continue. Because additional water from the Owens River-Mono Basin will be required, the City of Los Angeles, in 1964, initiated construction of the Second Los Angeles Aqueduct. The estimated importation schedules of ground water from San Fernando Valley and the Owens River-Mono Basin by the Los Angeles Department of Water and Power to the Coastal Plain are:
water, filtered water for applied water and injection, and untreated waters for spreading. Year
Quantity in Acre-Feet
Before 1972, the delivery of imported water to the Coastal Plain by MWD would be limited either by the capacity of the delivery system to provide water at specified pressures or by the available supply from the Colorado River. In the event of a water shortage, which cannot be anticipated before 1990, this water would be allocated among member agencies of MWD by each agency's preferential rights and would be limited to the combined supp~ from the Colorado River and the State Water Project after 1972. 'Ihe preferential rights of the member agencies are based on all p~ents made by each agency to MWD, exclusive of payments for purchased water.
The state Water Project will begin delivering water to Southern California in 1971 • At that time, MWD will begin importing a portion of this supply to the Coastal Plain through a planned increase in the delivery capacity of its distribution system.
Water imported by MWD is a supplemental source of supp~ to the Los Angeles
1969 1970 1975 1980 1985 1990
309,000 300,000 260,000 221,000 181 ,ooo 141 ,ooo
The Los .Angeles Department of Water and Power has reported that the foregoing values should be reduced by 30,000 acrefeet per year if the 1968 trial court decision is upheld in the case of City of Los .Angeles vs. City of San Fernando, et al.
In addition to the water imported into the Coastal Plain by MWD and the Los .Angeles Department of Water and Power, approximately 23,000 acre-feet annually has been pumped from the ground water basin or diverted from streams in the San Gabriel Valley and delivered to the Coastal Plain during the hydrologic study period of this investigation. It was assumed for the purpose of this investigation that approximately the same amount would be delivered fro~ the San Gabriel Valley to the Coastal Plain in the future.
-7-

Approximately 16,000 acre-feet of reclaimed waste water is imported from the San Gabriel Valley and is spread in the Montebello Forebay below Whittier Narrows.
Los Angeles County Sanitation Districts now plan to double the capaci~ of this plant to increase the amount of water available for spreading.
Local Water Supply
Among the local supplies--surface water, ground water, and reclaimed water--ground water i s the most important resource. Be cause of the intermittent nature of runoff in streams, the direct use of surface water is negligible. The Los Angeles County Sanitation Districts are contempl ating the construction of reclamation plants in the Coastal Plain. These plants may in time play a vi tal role in meeting t he Coas tal Plain's spreading and inject ion ~~·ater demands.
DETAILED DISCUSSION OF GROUND WATER SUPPLY
To estimate the supply potential of ground water to meet the area's needs, it is essential to determine the amount of fr esh vrater currently in s torage and t he long-term average replenishment by deep percolation and subsurface inflow in t he ground vrat er basins.
Currently Availab le Water in Storage
The Coastal Plain of Lo s Angeles County consists mainly of unconsol i dat ed sediments or all uvium underlain by and bounded on the north and east by bedrock . On the He s t and south , it is bounded by the Pacific Ocean . Ground T,,a t er i s s tored Hithin the interstices of these unconsolidated secJ.ir",ents a.rJ.d, to a l:i..ri ted w.ount, in fractures of nom1ater-bearL'1g ro cks that bound the area .
The Coastal Plain has been divi ded into four ground 1-ra ter basLrJ.S by geological and surface features, as sho-,.m on Figure 8. T-wo of these fo·u.r ground Hater basins are southvrest and two are northeast of
-8-
the series of lovr hills formed by the uplifts along the Newport-Inglewood fault.
The Santa Monica Basin extends south from the Santa Monica 11ounta:i ns to the Ballona escarpment between the fault and the Pacific Ocean. The West Coast Basin extends southeast to the Palos Verdes Hills, San Pedro Bay, and Orange Coun~. 'Ihe Hollywood Basin extends eastward to the Elysian Hills and south to the La Brea high, formed by the NewportInglewood fault. The Central Basin borders the Hollywood Basin on the south and occupies the rest of the Coastal Plain of Los Angeles County east of the Newport-Inglewood fault.
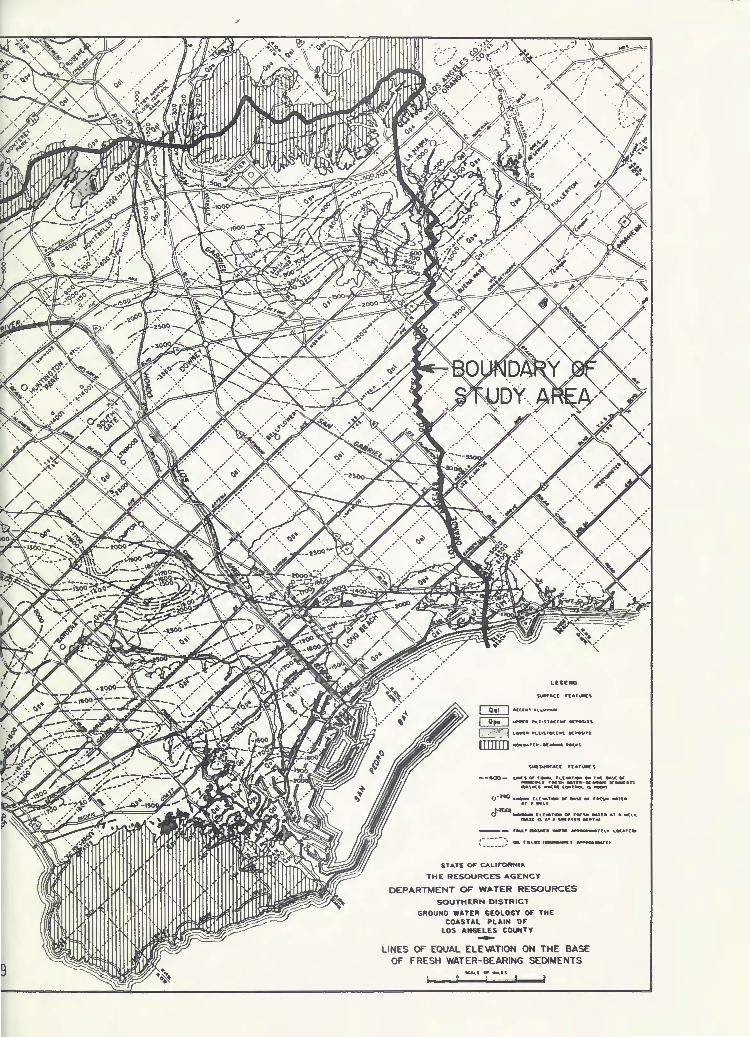
Both granitic and consolidated sedimentary rocks are considered nonwater bearing because their specific yield is negligible. They form a base of the Coastal Plain's ground water basins when impermeable sediments, such as clay and silty clay, are not found above them. Where thick layers of these impermeable sediments are found above the bedrock without significant quantities of water-bearing materials between them and the bedrock, their surface is considered a base of the subsurface reservoir.
A contour map (Figure 9) was drawn connecting the points of equal elevation of the base of the water-bearing material. The elevation of the base ranges from sea level at the Santa I-ronic a Hills and Palos Verdes Hills to more than 3,000 feet below sea level in the south-centr al part of the Coas tal Plain.
Not al l the vrater in the Coastal Plain aquifers can be extracted. Even vrhen an aquifer i s supposedly pu."':"!ped "dry", a small amoun t of Hater rer.:a.ins as a thin fi ln co a ti.ng the particles of sand and gravel. The percentage of vrater tha t is s till r etained by the sedir,ent is technically t emed nspecific retention" . On the other hand, t he rat io of the volllil'.e of via t er in saturated soil that can be r enoved by gravity drainage to the total vol"t.lrle of s aturated sedi-

I ~ )
LEGE-ND
LOCATION OF GROUND WATER BASINS AND
SEMIPERMEABLE AND PERMEABLE AREAS
- BOUNDARY OF INVESTIGATIONAL AREA
BOUNDARY OF WATER-BEARING MATERIAL
~ HILL AND MOUNTAIN AREAS
BASIN BOUNDARY -Fi arure 8
ment is technically termed "specific yield". Hence, as employed by hydrologists, the word 11 storage 11 refers only to the actual net amount of water that can be removed from sediments.
In the Coastal Plain, the specific yield of the water-bearing materials was estimated at from 3 percent for the finer materials to 26 percent for the coarser. To calculate the total storage capacity, the specific yield of the area was multiplied by the thickness of the aquifers and the area.
Although the volume of fresh water stored in the ground water basins in the Coastal
BOUNDARY OF SEMIPERMEABLE AREA
BOUNDARY OF PERMEABLE AREA
Plair1 was estimated to be 20 million acrefeet in an earlier study, a recent evaluation indicated that about 35 million acre-feet is stored at present. Of this amount, about 29 million acre-feet is stored in the top 1,200 feet of sediments. However, the amount of ground water that can be extracted is limited by physical and economic considerations.
Replenishment of Ground Water
'lhe ground water basins are replenished by subsurface inflow, injection of water for sea-water intrusion barriers, and deep percolation of water from various sources. These sources are precipita-
-9-
5 A N T A
c "'
p A C I F I
/
9
~IICCt"•'•"'""-~ _.... "''''~'M:IWf' ... ~u.
L · ·.:_ i "•"• "-••sroc.••• ~~~:..son nmm ..... _lla-K.-.~S
--400- l.IIIII:S Oil ,......_ f~o.t•'- • tooC M.W W ...-:.._, ..... -tt•·•~ •--•n cwu ......... c.ot...._ a....,.. o-,..,...., ru._, ... w .,... .. •-.c:,. -u:•
at •Mu.
ot-lOCI-.. ........ , ... ., •~~~:,. -n• •• • ..... tMS.l" tS. .1' ....... ,, .•. , ...
--- ,...._, ......_ • ....:• ~u:u .. eca,,•
::===~) -. ••""' ,........,., __._n
STAT£ 01 CALIFORNIA
THE RESOURCES AGENCY
DEPARTMENT Of" W"TER RESOURCES SOUTHERN DISTRICT
GROUND WATER 6EOL06Y OF THE COASTAL PLAIN OF
LOS ANGELES COUNTY
LINES OF EQUAL ELEVATION ON THE BASE OF FRESH WATER-BEARING SEDIMENTS

tion and resulting runoff, applied water, and imported and reclaimed water in streambeds and spreading grounds.
Deep percolation due to precipitation occurs both inside and outside of streambeds. Within the streambeci and spreading grounds, under mean precipitation conditions, about 48,000 acre-feet is estimated to percolate annually. Of this amount, 10,000 acre-feet is derived from storm runoff, originating within the stuqy area and as flow from the San Gabriel Valley, and 38,000 acre-feet from water seeping into the streambed in the San Gabriel Valle.y because of high water tables. The 48,000 acre-feet of percolation occurs in aportion of the San Gabriel River streambed located in the forebay portion of the Central Basin, in the existing spreading grounds adjacent to the Rio Hondo and the San Gabriel River in the Montebello Forebay and in the existing spreading grounds adjacent to the Los Angeles River in the Dominguez Gap. Outside the streambed, the deep percolation from precipitation averages approximately 29,000 acre-feet per year.
Deep percolation from applied water results from irrigation of gardens and ather areas and also from water discharged into cesspools. Because of the diminishing size of irrigated areas and the decreasing number of cesspools, the deep percolation from applied water is expected to decline in the future.
Significant amounts of imported water have deep percolated in the past in a portion of the San Gabriel River streambed in the Central Basin and in spreading grounds. The amount of deep percolation from this source depends upon the delivery capacity of the pipeline and the availability of replenishment water from MWD.
.Also, ground water basins will be incidentally replenished by the injection of fresh water to maintain barrier projects to prevent sea-water intrusion along the coast. The amount injected
-12-
depends upon the water level elevations that develop along the coast as a result of ground water basin operation.
In addition to the runoff from storms and water seeping out from streambeds in San Gabriel Valley because of high water tables, water reclaimed from waste water originating in the San Gabriel Valley is available for conservation by spreading in the Coastal Plain. The annual amount currently available for spreading is 16,200 acre-feet, which is about equal to the existing capacity of the Whittier Narrows Reclamation Plant.
Subsurface inflow also adds to the ground water supply of the area. Subsurface inflow of fresh water has occurred in the past and may be assumed to occur in the future at the Los Angeles Narrows and Whittier Narrows. The average annual subsurface inflow was estimated to be 200 acre-feet for the Los Angeles Narrows and 28,000 acrefeet for Whittier Narrows. With respect to flow across the Los AngelesOrange County boundary line, both subsurface inflow and outflow have occurred, depending upon levels in adjoining basins. The amounts of inflow in the future at each location would vary with each plan of basin operation both within and outside the Coastal Plain.
Reduction of Water from Ground Water Basins
The amount of ground water in storage is reduced by subsurface outflow and pumping of ground water. Prior to initiation of the investigation, the average subsurface outflow was small.
In 1 963, about 40 percent, or about 300,000 acre-feet, of the demand of the Coastal Plain for applied water was met by water pumped from ground water basins. In the future, the amount to be taken out of the basins by pumping will depend upon the plan of basin operation to be implemented.

/
Ill INVENTORY OF FACILITIES
Supply facilities within the Coastal Plain are those required for transmission and storage of surface and ground water to meet the fluctua t:ing demand for applied water, spreading water, and fresh water barrier projects.
A highly dev~loped network of both surface and ground water facilities for storage, transmission, and extraction exists within the Coastal Plain to meet the applied water demand of residential, industrial, and commercial entities, and the very small water requirement of agriculture.
GROUND WATER BASINS AS DELIVERY FACILITIES
'llle ground water basins can be considere·d as a part of this network of facilities as is illustrated by the analogy between the physical characteristics of the ground water basins and surface distribution systems.
The rate of deep percolation and subsurface inflow into a ground water reservoir is comparable to the rate of inflow into a surface reservoir. The storage capacity of a ground water basin is comparable to the storage capacity of a surface reservoir. The transmissive characteristics of the aquifers of a ground water basin may be compared to the deli very characteristics of a distribution system. Finally, the piezometric pressure and ground water table in a basin are analogous to the hydraulic grade line elevations in a surface distribution system.
Using equations that numerically describe the flow characteristics of ground water basins and surface distribution networks, it is possible to calculate the capabilities of these water delivery media and to determine the additional facilities required. This determination makes it possible to estimate the cost of water service under various plans of basin operation.
To integrate the ground water basins into the delivery facility, a mathematical model of a basin was developed. First, however, surveys were made of the areal extent, boundaries, thickness, structures, storage capacities, and transmissibilities of aquifers. This information was then consolidated to represent an "equivalent aquifer", a composite combining the essential physical features of 11 major Coastal Plain aquifers. Those features furnished the coefficients for a set of equations simulating storage and flow in the equivalent aquifer. This set of equations, with proper values for the coefficients, is the ground water basin rna thema tical model. The 82 equations required for this study were solved by a general purpose analog computer because the manual simultaneous solution of these equations would have been impossible.
The ground water basin mathematical model was used to estimate future ground water level elevations at various parts of the Coastal Plain under various alternative plans of basin operation.
When the ground water basins are regarded as a transmission facility, streambeds
-13-

and man-made spreading grounds may be considered as the initial point of the delivery facility and wells may be considered as the terminal point. In addition to the San Gabriel River bed, which is a natural spreading facility with an approximate capacity of 120 cubic feet per second, four man-made spreading facilities exist in the area adjacent to the Rio Hondo and San Gabriel River in the Montebello Forebay, and adjacent to the Los Angeles River in the Dominguez area.
The total infiltration capacity of the spreading grounds in the forebay is about
l ~ )
BOUNDARY OF INVESTIGATIONAL AREA
BOUNDARY OF WATER-BEARING MATERIAL
BASIN BOUNDARY
~ HILL AND MOUNTAIN AREAS
·~ EXISTING SPREADING GROUNDS
LEGEND
Figure 10
-14-
570 cubic feet per second, which is equivalent to about 400,000 acre-feet per year, provided the infiltration rate is not reduced by a ground water mound that could develop beneath the spreading site. Usable capacity, however, is limited because of the need to rotate the use of percolation hasins within the spreading grounds.
A large number of wells, the terminal points of a ground water delivery facility, are scattered throughout the Coastal Plain. The distribution of these wells and the approximate magnitude of ground water pumpage in various areas are shown on Figure 1 0.
PATTERN OF GROUND WATER EXTRACTIONS IN 1956
AND LOCATION OF ARTIFICIAL RECHARGE PROJECTS
EXISTING BARRIER FACILITIES OPERATED BY LOS ANGELES COUNTY FLOOD CONTROL DISTRICT
PROPOSED BARRIER FACILITIES BY LOS ANGELES COUNTY FLOOD CONTROL DISTRICT
EACH DOT REPRESENTS ANNUAL GROUND WATER EXTRACTIONS OF 500 ACRE-FEET

/
Because the water injected in fresh water IMPORTED WATER DELIVERY FACILITIES barriers to prevent sea-water intrusion along the coast contributes to the supply The distribution systems owned and of water in ground water basins, these operated by the City of Los .Angeles to barriers can be also considered as initiatingbring water from outside the Coastal points of water delivery facilities. At Plain are adequate for the delivery of present, there are two barrier projects the scheduled amounts of water to the located in West Coast Basin along Santa area. The existing and proposed facili-Monica Bay and at Alamitos Gap. A barrier ties of MWD and the State Water Project project will be constructed at Dominguez are also adequate to meet the demand for Gap soon. Th.e lengths of these existing imported water in the Coastal Plain at and planned projects are about 9 miles·, least to 1990 under any economical plan 2 miles, and 4 miles, respectively. of basin operation. The primary pipeline
UL.ItOA Tlt!ATM(WT JI'LUT
...... r' I ~ I
/ c
SAN GABRIEL MOUNTAINS
0 C E A N
LEGEND - BOUNDARY OF INVESTIGATIONAL AREA
EXISTING FACILITIES
PROPOSED FACILITIES
Figure II
-1 s..
I I
J
EXISTNG Al.fJ ASSl1.£0 FUTLflE OISTR8JTlON FllClJT OF THE METROPOLITAN WATER DISTRICT OF
SOUTHERN CALIFORNIA

network of MWD in the Coastal Plain is shown on figure 11 •
COMMON DELIVERY FACILITIES
Many of the water delivery facilities would be required no matter what plan is adopted for meeting the water
-16-
requirement in the Coastal Plain. 'lhis group of facilities would include small pipelines beyond the connection to the MWD 1 s pipelines. The distribution systems owned and opera ted by both private and nrunicipal agencies, such as the pipeline networks of the City of Los Angeles and the City of Long Beach, would also be in this category.

/
.. IV ECONOMIC EVALUATION
The Coastal Plain ground water managers can best understand- the changes in their water service requirements and the political, legal, social, and organizational forces that influence management decisions. These forces may play a dominant role in the selection of a management plan and often override cost and benefit considerations. For these reasons, basin management must remain in local hands.
This investigation was restricted to the physical and economic aspects of basin operation. In considering the costs and benefits of alternative plans of operation, the measure of the benefits is satisfying the applied water demands for the study area. As these water demands (benefits) are common to all plans, one merely needs to estimate the costs of the plans to determine their economic advantages.
There are two extremes in providing water service. One is to rely exclusively on ground water basins as a source of water and the other is to use imported water facilities exclusively. Between these two extremes lie a great range of possible alternatives, as may be surmised by referring to Figure 1 2.
Operational possibilities for utilizing the ground water in storage are also numerous. The amount of ground water in storage could be increased to halt saline intrusion, or it could be left unchanged or even decreased from the present level by maintaining freshwater barrier projects along the coast.
VARIABLES
The variables in the operation of the ground water basins are the timing, amounts, and locations of both extraction and artificial replenishment. In addition, the method of preventing saline water intrusion also could be considered as an operational variable. These factors can be expressed in terms of:
1. Spreading schedule of imported water at the Montebello Forebay;
2. Methods of preventing saline intrusion;
3. Pattern of ground water extraction;
4. Schedules of ground water extraction.
EVALUAnON OF VARIABLES BY APPLICATION TO ALTERNATIVE PLANS
In all, more than 50 plans of operation were evaluated during this investigation, and comprehensive operational-economic information was developed.
It was found that it is impracticable to form a seaward freshwater gradient by filling the Coastal Plain aquifers as rapidly as required to forestall further sea-water intrusion along the coast. Furthermore, economic evaluation of many plans indicated that it is much more expensive to fill the basins than maintain freshwater barriers to stop sea-water intrusion. Consequently, analysis can be confined to those plans that involve freshwater barriers.
-17-

It has been generally believed that location of pumping is a significant factor in the management of ground water basins. However, it was found that location of pumping caused a comparatively negligible economic impact in the Central Basin of the Coastal Plain.
Even though the pumping pattern was varied substantially in the Central Basin, cost difference was found to be minor. However, a shift in pumping pattern from the coastal area to the inland portion of the West Coast Basin was found to have a beneficial effect on the cost of maintaining the freshwater barriers.
Five plans that cover the range of significant variables were selected for detailed
-18-
Figure 12- WATER DEMANDS AND SUPPLIES
analyses. An extensive volume of information relating to them was published in Appendix C to this bulletin. Of those five, four were chosen to be offered here for consideration.
Plan A (Plan 117-11 in Appendix C) - provides for the use by 1990 of h,ooo,ooo of the 35,ooo,ooo acrefeet of ground water in storage. (Ground water levels would be stabilized after 1990, at which time a safe-yield operation would be initiated. The basin would not be filled to its initial--1963-· level.)
Pla...l'l B (Plan 117-5 in Appendix C) - provides for a median use of stored ground water, 1,000,000 acre-feet.
/
(Ground water revels would be stabilized after 1990, at which time a safe-yield operation would be initiated. The basin would not be filled to its initial--1963-level.)
Plan C (Plan 117-4 in Appendix C) - provides for the maintenance of ground water storage under average precipitation at present levels (immediate safe-yield operation).
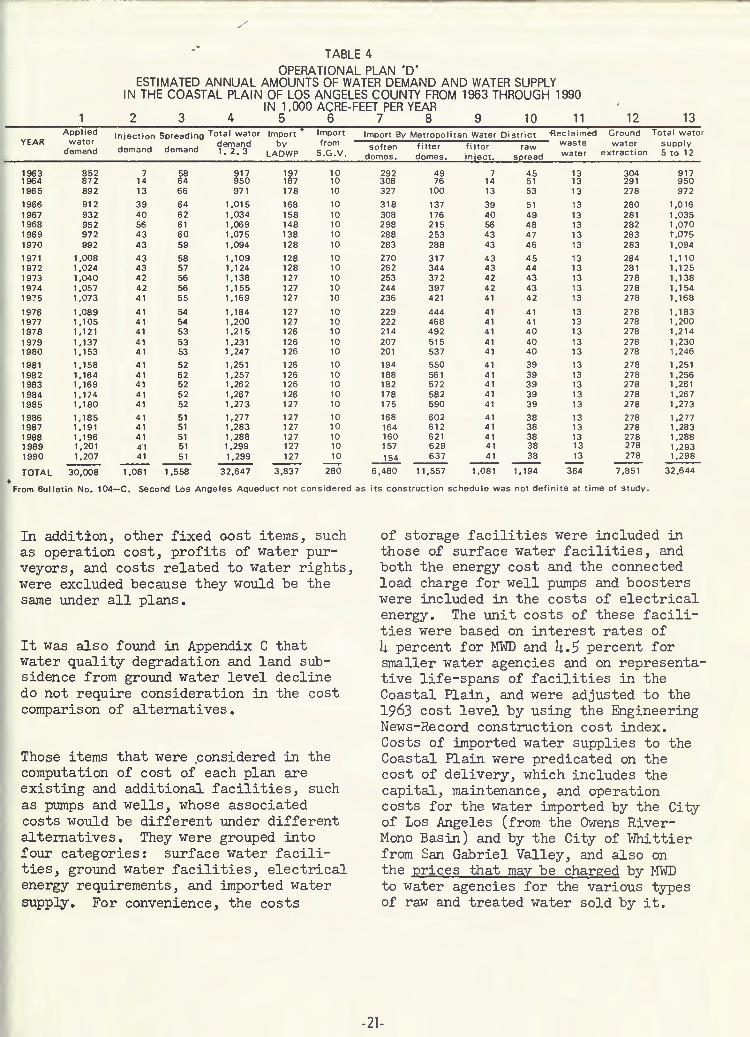
Plan D (Plan 318-5 in Appendix C) - same as Plan C except it includes spreading a large amount of imported water.
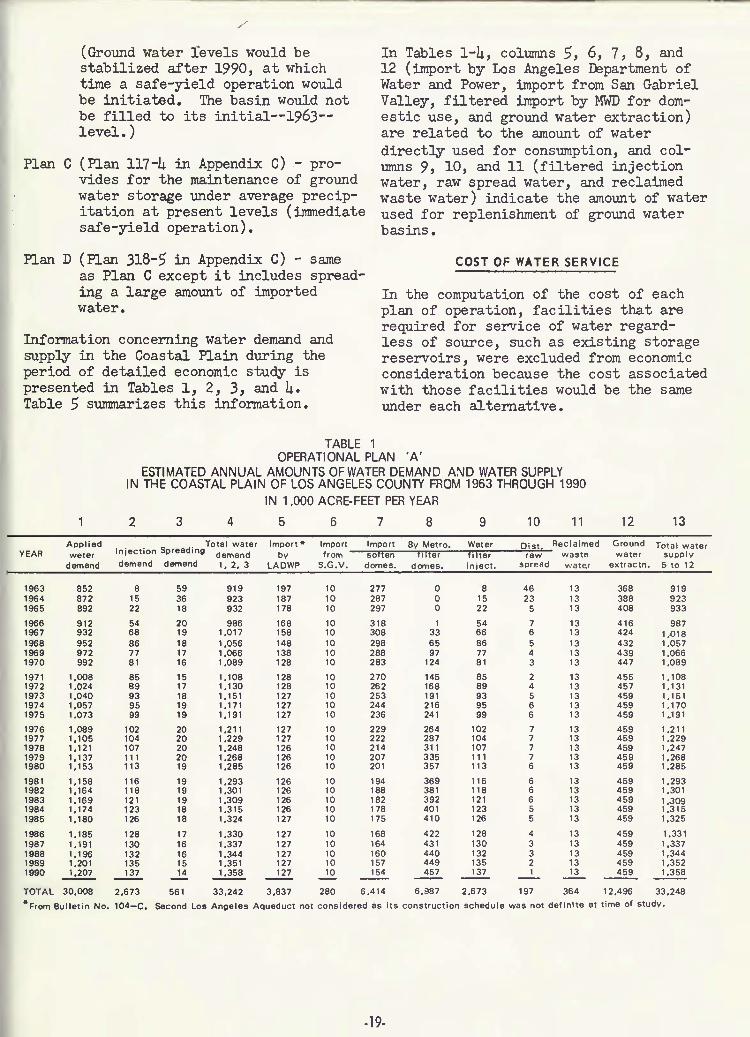
Information concerning water demand and supply in the Coastal Plain during the period of detailed economic study is presented in Tables 1, 2, 3, and 4. Table 5 summarizes this information.
TABLE 1
In Tables 1-4, columns 5, 6, 7, 8, and 12 (import by Los Angeles Department of Water and Power, import from San Gabriel Valley, filtered import by MWD for domestic use, and ground water extraction) are related to the amount of water directly used for consumption, and columns 9, 10, and 11 (filtered injection water, raw spread water, and reclaimed waste water) indicate the amount of water used for replenishment of ground water basins.
COST OF WATER SERVICE
In the computation of the cost of each plan of operation, facilities that are required for service of water regardless of source, such as existing storage reservoirs, were excluded from economic consideration because the cost associated with those facilities would be the same under each alternative.
OPERATIONAL PLAN 'A' ESTIMATED ANNUAL AMOUNTS OF WATER DEMAND AND WATER SUPPLY
IN THE COASTAL PLAIN OF LOS ANGELES COUNTY FROM 1963 THROUGH 1990 IN 1,000 ACRE-FEET PER YEAR
2 3 4 5 6 7 8 9 10 11 12 13
Applied Total water Import* Import Import By Metro. Water Dist. Reclaimed Ground Total water YEAR weter Injection Spreading demand by from soften filter foiter raw waste water supply
demand demand demand 1, 2, 3 LADWP S.G.V. domes. domes. inject. spread wate~r extractn. 5 to 12
1963 852 8 59 919 197 10 277 0 8 46 13 368 919 1964 872 15 36 923 187 10 287 0 15 23 13 388 923 1965 892 22 18 932 178 10 297 0 22 5 13 408 933
1966 912 54 20 986 168 10 318 1 54 7 13 416 987 1967 932 68 19 1,017 158 10 308 33 66 6 13 424 1,.018 1968 952 86 18 1,056 148 10 298 65 86 5 13 432 1,057 1969 972 77 17 1,066 138 10 288 97 77 4 13 439 1,066 1970 992 81 16 1,089 128 10 283 124 81 3 13 447 1,089
1971 1,008 85 15 1,108 128 10 270 145 85 2 13 455 1,108 1972 1,024 89 17 1,130 128 10 262 168 89 4 13 457 1,131 1973 1,040 93 18 1,151 127 10 253 191 93 5 13 459 1,151 1974 1,057 95 19 1,171 127 10 244 216 95 6 13 459 1,170 1975 1.073 99 19 1,191 127 10 236 241 99 6 13 459 1 .. 191
1976 1,089 102 20 1,211 127 10 229 264 102 7 13 459 1,211 1977 1,105 104 20 1,229 127 10 222 287 104 7 13 459 1,229 1978 1,121 107 20 1,248 126 10 214 311 107 7 13 459 1,247 1979 1,137 111 20 1,268 126 10 207 335 111 7 13 459 1,268 1980 1,153 113 19 1,285 126 10 201 357 113 6 13 459 1,285
1981 1,158 116 19 1,293 126 10 194 369 116 6 13 459 1,293 1982 1,164 118 19 1,301 126 10 188 381 118 6 13 459 1,301 1983 1,169 121 19 1,309 126 10 182 392 121 6 13 459 1,309 1984 1,174 123 18 1,315 126 10 178 401 123 5 13 459 1,315 1985 1,180 126 18 1,324 127 10 175 410 126 5 13 459 1,325
1986 1,185 128 17 1,330 127 10 168 422 128 4 13 459 1,331 1987 1,191 130 16 1,337 127 10 164 431 130 3 13 459 1,337 1988 1,196 132 16 1,344 127 10 160 440 132 3 13 459 1,344 1989 1,201 135 15 1,351 127 10 157 449 135 2 13 459 1,352 1990 ~ 137 14 ~ 127 10 154 457 137 1 13 459 1,358
TOTAL 30,008 2,673 561 33,242 3,837 280 6,414 6,987 2,673 197 364 12,496 33,248
*From Bulletin No. 104-C. Second Los Angeles Aqueduct not considered as its construction schedule was not definite at time of study.
-19-

TABLE 2 OPERATIONAL PLAN 'B'
ESTIMATED ANNUAL AMOUNTS OF WATER DEMAND AND WATER SUPPLY IN THE COASTAL PLAIN OF LOS ANGELES COUNTY FROM 1963 THROUGH 1990
IN 1,000 ACRE-FEET PER YEAR 2 3 4 5 6 7 8 9 10 11 12 13
Applied Injection Spreading Total water Import* Import Import B:i Metro. Water Dist. Reclaimed Ground Total water YEAR water demand by from soften fi Iter fi Iter raw waste water supply
demand demand demand 1, 2, 3 LADWP S.G.V. domes. domes. inject. spread water extraction 5 to 12
1963 852 7 58 917 197 10 292 36 7 45 13 317 917 1964 872 14 37 923 187 10 308 66 14 24 13 301 923 1965 892 17 18 927 178 10 327 94 17 5 13 284 928
1966 912 42 22 976 168 10 318 131 42 9 13 286 977 1967 932 45 21 998 158 10 308 170 45 8 13 287 999 1968 952 62 20 1,.034 148 10 298 208 62 7 13 288 1,034 1969 972 50 19 1,041 138 10 288 247 50 6 13 290 1,042 1970 992 50 18 1,060 128 10 283 280 50 5 13 291 1,060 1971 1,008 50 17 1,075 128 10 270 308 50 4 13 292 1,075 1972 1,024 52 17 1,093 128 10 262 338 52 4 13 287 1,094 1973 1,040 51 17 1,108 127 10 253 368 51 4 13 282 1,108 1974 1,057 50 17 1,124 127 10 244 393 50 4 13 282 1.123 1975 1,073 50 17 1,140 127 10 236 417 50 4 13 282 1,139
1976 1,089 51 17 1,157 127 10 229 440 51 4 13 282 1,156 1977 1,105 51 17 1,173 127 10 .222 464 51 4 13 282 1,173 1978 1,121 52 17 1,190 126 10 214 488 52 4 13 282 1,189 1978 1,137 52 16 1,205 126 10 207 511 52 3 13 282 1,204 1980 1,153 53 16 1,222 126 10 201 533 53 3 13 282 1,221 1981 1,158 53 16 1,227 126 10 194 546 53 3 13 282 1,227 1982 1,164 53 16 1,233 126 10 188 557 53 3 13 282 1,232 1983 1,169 54 16 1,239 126 10 182 568 54 3 •13 282 1,238 1984 1,174 54 16 1,244 126 10 178 578 54 3 13 282 1,244 1985 1,180 54 15 1,249 127 10 175 586 54 2 13 282 1,249 1986 1,185 54 15 1,254 127 10 168 598 54 2 13 282 1,254 1987 1,191 55 15 1,261 127 10 164 608 55 2 13 282 1,261 1988 1,196 55 15 1,266 127 10 160 617 55 2 13 282 1,266 1989 1,201 55 15 1,271 127 10 157 625 55 2 13 282 1,271 1990 1,207 57 17 1,281 127 10 154 633 57 4 13 282 1,280
TOTAL 30,008 1,343 537 31,888 3,837 280 6,480 11,408 1,343 173 364 7,999 31,884
*From Bulletin No. 1~-C. Second Los Angeles Aqueduct not considered as its construction schedule was not definite at time of study.
TABLE 3 OPERATIONAL PLAN 'C'
ESTIMATED ANNUAL AMOUNTS OF WATER DEMAND.At-ID WATER SUPPLY IN THE COASTAL PLAIN OF LOS ANGELES COUNTY FROM 1963 THROUGH 1990
IN 1,000 ACRE-FEET PER YEAR
2 3 4 5 6 7 8 9 10 11 12 13
Applied Injection Spreading Total water Import * Import lm12ort By Metro. Water Dist. Reclaimed Ground Total watet YEAR water demand demand
demand by from soften fi Iter fi Iter raw waste water supply demand 1, 2. 3 LADWP S.G.V. domes. domes. inject. spread water extraction 5 to 12
1963 852 7 57 916 197 10 292 60 7 44 13 293 916 1964 872 14 41 927 187 10 308 102 14 28 13 264 926 1965 892 13 25 930 178 10 327 142 13 12 13 236 931 1966 912 38 26 976 168 10 318 179 38 13 13 237 976 1967 932 39 23 994 158 10 308 218 39 10 13 239 995 1968 952 55 24 1,031 148 10 298 251 55 11 13 245 1,031 1969 972 42 24 1,038 138 10 288 285 42 11 13 252 1,039 1970 992 42 23 1,057 128 10 283 317 42 10 13 255 1,058 1971 1,008 42 23 1,073 128 10 270 343 42 10 13 258 1,074 1972 1,024 43 23 1,090 128 10 262 377 43 10 13 247 1,090 1973 1,040 ~2 23 1,105 127 10 253 413 42 10 13 237 1,105 1974 1,057 11 22 1,120 127 10 244 443 41 9 13 232 1,119 1975 1,073 40 22 1,135 127 10 236 472 40 9 13 228 1,135
1976 1,089 39 21 1,149 127 10 229 495 39 8 13 228 1,149 1977 1,105 39 20 1,164 127 10 222 518 39 7 13 228 1,164 1978 1,121 38 '0 1,179 126 10 214 543 38 7 13 228 1,179 1979 1,137 38 ·il 1,194 126 10 207 566 38 6 13 228 1,194 1980 1,153 38 .3 1,210 126 10 201 588 38 6 13 228 1,210
1981 1,158 38 19 1,215 126 10 194 600 38 6 13 228 1,215 1982 1,164 37 18 1.219 126 10 188 612 37 5 13 228 1,219 1983 1,169 37 18 1,224 126 10 182 623 37 5 13 228 1,224 1984 1,174 37 18 1,229 126 10 178 632 37 5 13 228 1,229 1985 1,180 37 17 1,234 127 10 175 641 37 4 13 228 1,235
1986 1,185 37 17 1,239 127 10 168 653 37 4 13 228 1,240 19B7 1,191 37 17 1,245 127 10 164 662 37 4 13 228 1,245 1988 1,196 37 17 1,250 127 10 160 672 37 4 ·13 228 1,251 1989 1,201 37 17 1,255 127 10 157 680 37 4 13 228 1,256 1990 ..... !.2.2? 37 16 ~ 127 10 154 ~ _E.. _3 13 ~ ......!...:.3.2
TOTAL 30,008 1,021 629 31,658 3,837 280 6,480 12,775 1,021 265 364 6,643 31,665
From Bulletin No. 104-C. Second Los Angeles Aqueduct not considered as lts construction schedule was not definite at time of study.
-20-
*
/ ,
. . TABLE 4 OPERATIONAL PLAN 'D'
ESTIMATED ANNUAL AMOUNTS OF WATER DEMAND AND WATER SUPPLY IN THE COASTAL PLAIN OF LOS ANGELES COUNTY FROM 1963 THROUGH 1990
IN 1,000 ACRE-FEET PER YEAR 2 3 4 5 6 7 8 9 10 11 12 13
Applied Injection Spreading Total water Import Import Import By Metropolitan Water District -Reclaimed Ground Total water YEAR water demand by from soften fi Iter fi Iter raw waste water supply
demand demand demand 1. 2. 3 LADWP S.G.V. water extraction 5 to 12 domes. domes. iniect. sere ad
1963 852 7 5B 917 197 10 292 49 7 45 13 304 917 1964 872 14 64 950 187 10 308 76 14 51 13 291 950 1965 892 13 66 971 178 10 327 100 13 53 13 278 972
1966 912 39 64 1,015 168 10 318 137 39 51 13 280 1,016 1967 932 40 62 1,034 158 10 308 176 40 49 13 281 1,035 1968 952 56 61 1,069 148 10 298 215 56 48 13 282 1,070 1969 972 43 60 1.075 138 10 288 253 43 47 13 283 T .1175 1970 992 43 59 1,094 128 10 283 288 43 46 13 283 1,094
1971 1,008 43 58 1,109 128 10 270 317 43 45 13 284 1,110 1972 1,024 43 57 1,124 128 10 262 344 43 44 13 281 1,125 1973 1,040 42 56 1,138 127 10 253 372 42 43 13 278 1,138 1974 1,057 42 56 1,155 127 10 244 397 42 43 13 278 1.154 1975 1,073 41 55 1,169 127 10 236 421 41 42 13 278 1,168
1976 1,089 41 54 1,184 127 10 229 444 41 41 13 278 1,183 1977 1,105 41 54 1,200 127 10 222 468 41 41 13 278 1,200 1978 1,121 41 53 1,215 126 10 214 492 41 40 13 278 1,214 1979 1,137 41 53 1,231 126 10 207 515 41 40 13 278 1,230 1980 1,153 41 53 1,247 126 10 201 537 41 40 13 278 1,246
1981 1,158 41 52 1,251 126 10 194 550 41 39 13 278 1,251 1982 1,164 41 52 1.257 126 10 188 561 41 39 13 278 1,256 1983 1,169 41 52 1,262 126 10 182 572 41 39 13 278 1,261 1984 1.174 41 52 1,267 126 10 178 582 41 39 13 278 1,267 1985 1,180 41 52 1.273 127 10 175 590 41 39 13 278 1,273
1986 1,185 41 51 1,277 127 10 168 602 41 38 13 278 1,277 1987 1,191 41 51 1,283 127 10 164 612 41 38 13 278 1,283 1988 1,196 41 51 1.288 127 10 160 621 41 38 13 278 1.288 1989 1,201 4"1 51 1,299 127 10 157 629 41 38 13 278 1,293 1990 1,207 41 51 1,299 127 10 ~ 637 41 38 13 278 1,298 -- ~
TOTAL 30,008 1,081 1,558 32,647 3,837 280 6,480 11,557 1,081 1,194 364 7,851 32,644
From Bulletin No. 1 04-C. Second Los Angeles AQueduct not considered as its construction schedule was not definite at time of study.
In addition, other fixed oost items, such as operation cost, profits of water purveyors, and costs related to water rights, were excluded because they would be the same under all plans.
It was also found in Appendix C that water quality degradation and land subsidence from ground water level decline do not require consideration in the cost comparison of alternatives.
Those items that were ~onsidered in the computation of cost of each plan are existing and additional facilities, such as pumps and wells, whose associated costs would be different under different alternatives. They were grouped into four categories: surface water facilities, ground water facilities, electrical energy requirements, and imported water supp~. For convenience, the costs
of storage facilities were included in those of surface water facilities, and both the energy cost and the connected load charge for well pumps and boosters were included in the costs of electrical energy. The unit costs of these facilities were based on interest rates of 4 percent for MWD and 4.5 percent for smaller water agencies and on representative life-spans of facilities in the Coastal Plain, and were adjusted to the 1963 cost level by using the Engineering News-Record construction cost index. Costs of imported water supplies to the Coastal Plain were predicated on the cost of delivery, which includes the capital, maintenance, and operation costs for the water imported by the Ci~ of Los Angeles (from the Owens RiverMono Basin) and by the City of Whittier from San Gabriel Valley, and also on the prices that may be charged by MWD to water agencies for the various types of raw and treated water sold by it.
-21-

TABLE 5 TOTAL AMOUNTS OF COMPONENTS OF WATER DEMAND AND SUPPLY IN THE
COASTAL PLAIN OF LOS ANGELES COUNTY FOR THE STUDY PERIOD 1963 THROUGH 1990 FOR SELECTED PLANS OF OPERATION
IN THOUSANDS OF ACRE-FEET*
Plan number COMPONENT
Plan 'A' Plan 'B' Plan 'C' Plan 'D'
WATER DEMAND
Applied water demand 30,010 30,010 30,010 30,010
Injection demand 2,670 1,340 1,020 1,080
Spreading demand 560 540 630 1,560
TOTAL WATER DEMAND 33,240 31,890 31,660 32,650
WATER SUPPLY
Import by Los Angeles Department of Water & Power 3,840 3,840 3,840 3,840
Import from San Gabriel Valley 280 280 280 280
Import by Metropolitan Water District
Softened industrial and domestic 6.410 6.480 6,480 6.480
Filtered industrial and domestic 6,990 11.420 12,770 11,560
Filtered injection water 2,670 1,340 1,020 1,090
Raw spread water 200 170 270 1,190
Reclaimed waste water 360 360 360 360
Ground water extraction 12,490 8,000 6,640 7,850
TOTAL WATER SUPPLY 33,240 31,890 31,660 32,650
• From Bulletin No. 104-C. Second Los Angeles Aqueduct not considered as its construction schedule was not definite at time of study.
-22-

/
The cost of each faciiity was summed to obtain the total cost of water service, which includes the cost of ground water, imported water, replenishment of ground water basins, and prevention of sea-water intrusion. The cost of imported water includes ad valorem taxes paid by property owners in the Coastal Plain.
The total of these costs constitutes the cost of water service for the Coastal Plain. These costs would be incurred at different times under different plans of operation. The economic effect of incurring the same total amount of expenditure at different times would vary with the plan. To establish a viable economic comparison of all alternatives, it is necessary to convert all costs--regardless of the difference in time of ex:pendi ture--to the common denominator of present worth.
Present Worth
Present worth of the total cost of water service under each plan of operation may be considered as the amount of money that is needed today to meet future financial obligations associated with the water service. Thus, a comparison of present worth of the four plans would provide a comparative measure of the extent of financial obligations that would be
imposed on the decision-makers and the water users they serve.
Economic Evaluation
The cost of imported water was shown to be the biggest cost item in each of the four alternative plans. The cost depends chiefly on the future pricing policies of MWD from which the Coastal Plain purchases imported water.
To understand the importance of the MWD pricing policy on the Coastal Plain water economics, an ro1alysis of the policy is necessary.
Conceptually, various means can be employed top~ for water service: Users of imported water can pay the complete cost for carrying it from source to point of delivery; property owners can pay the complete cost through taxes (ad val::>rem taxes); and users and taxpayers can divide the cost. This last means is the one MWD has employed to date--some 50 percent of its capital cost of constructing facilities is now borne by an ad valorem tax.
In addition, the present pricing policy provides different prices for water used for agricultural and ground water replenishment purposes and for water used for domestic and industrial purposes.
TABLE 6
Category
Present worth of costs from 1963 to 1990
Present worth of costs
PRESENT WORTH OF FUTURE TOTAL COSTS OF WATER SERVICE IN THE COASTAL PLAIN OF
LOS ANGELES COUNTY
Plan A Plan B Plan C
$ 902,000,000 $ 958,000,000 $ 972,000,000
412,000,000 400,000,000 405,000' 000 from 1991 to perpetuity
TOTAL $1,314,000,000 $1,358,000,000 $1,377,000,000
-23-
Plan D
$ 956,000,000
397,000,000
$1 ,353,000, 000

* c .!! it ::J ;; > .., :: .. : .. -0
0 0
"' Oi Q.
"' .=
X < 1-
0.134
0 067
*
10Cl'<o
DIFFERENTIAL In S per acre-foot
I
USE OF THE NOMOGRAPH
1. Select plan of operation.
2. Connect appropriate points on tax scale and differential scale. Mark intersection of this line with turning line.
3. Connect point of turning line with energy cost point. Where this line intersects present worth line, read the present worth of total cost of water service for the selected plan.
u z c .... a.
0
5
15
20
25
111 z J C) z z 0::
~
111 z J C) z z 0::
~
-----------EXAMPLE
Plane
------~-
u z c .... a.
930 935 940 945 950 955 960
~~------o 1170 ~ 975 ~ 980 ~ 985 ~
990 "'
Tax -50% Differential - $10 Energy cost - $12 Present Worth - $967
995 1000 1005 1010 1015 1020 1025 1030 1035 1040
.... "' 0 u )-
" u: w z w million
PRESENT WORTH In Millions of S
DEFINITIONS
Tax. '- of financial obligation for Metropolitan Water District facilities borne by property tax.
Differential. Difference in price between domestic-industrial and agricultural-replenishment water imported to the Coastal Plain
Enercr Cost. Energy charge (including operation, maintenance, replacement, and power costs) for State Water Project water delivered to Southern California.
Present Worth . Present worth of total cost of water service, 1963 through 1990.
Based on the assumption that the indicated ad valorem taK rate will be continued to the vear 2039.
Figure 13-IIIOMOGRAPH TO DETERMINE PRESENT WORTH OF TOTAL COST OF WATER SERVICE IN THE COASTAL PLAIN UNDER VARIABLE CONDITIONS AFFECTING
THE PRICE OF IMPORTED WATER- 1!1&3 THROUGH 1!190
-24-

owever, MWD has not announced a long-ange policy; therefore, to get /a longange economic evaluation.of alternatives, ssumptions were made regarding MWD pricing ifferentials and ad valorem taxes.
other significant factor affecting the it price of MWD water is the energy
ost of pumping water from the State ter Project over the Tehachapi
ountains. In recent years, the estimated ost of energy for pumping imported water
s decreased. To facilitate the evalua· an of the economics of the alternative ans under changing conditions With respect
o pricing policies and energy costs, nomoaphs were developed and presented in pendix C. One of them is given here as
example. (See Figure 13.)
ing the nomograph, the present worth of st of water service for Plans A, B, C, d D was determined under the assumption at the present MWD pricing policy would
followed in the future. Table 6 shows e result of this determination. The ad
tax has been included in this
evaluating this table, it nru.st be rembered that the table is for the entire
oastal Plain of Los Angeles County. To tain the economic information for indi-
• dual water agencies such as Central d West Basin Water Replenishment
· strict, supplemental ana~ses will be quire d.
r Plan D, if surplus water from the State ter Project could be purchased from MWD
a smaller price than indicated in the 's pricing schedule, proper adjustment
auld be made to the present worth of the st of water service under the plan.
evaluating these curves, a question may ise as to the differences in the values
ground water remaining in storage in 90 under Plans A, B, c, and D.
to perpet uity , although f rom different depths . Therefore, the comparative values of ground water in storage for the alternative plans would be the differences between the present worth of total future costs for these plans from 1991 to perpetuity. These differences have already been included in t he costs to perpetuity in Table 6.
In making a long-range water management plan in the Coastal Plain, the timing of the construction of the next water project is also of vital concern to local agencies.
The economically desirable timing would be the time when the total cost of the next imported water project equals the total cost of the least expensive alternative supply -- ground water, converted salt water, and reclaimed waste water. In setting this timing, consideration should be given to ascertaining that an adequate local emergency supply is available. For exact timing, however, a more detailed study should be made by evaluating the present worth of total cost of water service With alternative times of construction.
CONCLUDING REMARKS
An important finding that has evolved from this investigation is that the most economically significant factors in the Coastal Plain's water service cost are the price of imported water and the proportionate use of imported water and ground water in storage. It was also found that changes in assumed conditions substantial~ affect the comparison of the water service costs under alternative plans.
Because the investigation was based on numerous unavoidable assumptions and these assumed conditions continually change, the water agencies in the Coastal Plain must consider the impact of these changes on the cost of water service before a management decision is made. Appendixes A,
der all plans, ovide the same
the ground water basin Will B, and C to this bulletin provide data and quantity of water from 1991 procedures for such considerations.
-25-

5 0 9 ~ OS
.. N~ 822655
California. Department of Water Resources.
Bulletin.
PHYSICAL SCIENCES LIBRARY
LIDRARY UNIVERSITY OF CALIFORNIA
DAVIS
TC824 C2 A2 no.l04 ...