chapter 4 inventorying and monitoring grazing land resources and monitoring grazing national range...
TRANSCRIPT

National Range and Pasture Handbook
Chapter 4 Inventorying and Monitoring Grazing Land Resources
United StatesDepartment ofAgriculture
Natural ResourcesConservationService

National Range and Pasture HandbookInventorying and Monitoring Grazing Land Resources
Chapter 4
(190–VI–NRPH, October 2006)
Issued October 2006
The U.S. Department of Agriculture (USDA) prohibits discrimination in all its programs and activities on the basis of race, color, national origin, age, disability, and where applicable, sex, marital status, familial status, parental status, religion, sexual orientation, genetic information, political beliefs, re-prisal, or because all or a part of an individual’s income is derived from any public assistance program. (Not all prohibited bases apply to all programs.) Persons with disabilities who require alternative means for communication of program information (Braille, large print, audiotape, etc.) should con-tact USDA’s TARGET Center at (202) 720–2600 (voice and TDD). To file a complaint of discrimination write to USDA, Director, Office of Civil Rights, 1400 Independence Avenue, S.W., Washington, D.C. 20250–9410 or call (800) 795–3272 (voice) or (202) 720–6382 (TDD). USDA is an equal opportunity provider and employer.

(190–VI–NRPH, October 2006) 4–i
Contents
Chapter 4 Inventorying and Monitoring Grazing Land Resources
600.0400 General 4–1
600.0401 Inventory 4–2
(a) Total annual production .................................................................................4–3
(b) Definition of production for various kinds of plants ..................................4–3
(c) Methods of determining production and composition ...............................4–3
(d) Methods for determining production and composition for specific .........4–7
situations
(e) Methods for determining utilization of key species ....................................4–9
600.0402 Evaluating and rating ecological sites 4–14
(a) Trend ...............................................................................................................4–14
(b) Similarity index ..............................................................................................4–17
(c) Rangeland health ...........................................................................................4–23
(d) Communicating ratings of ecological sites ................................................4–47
(e) Evaluating rangelands occupied by naturalized plant communities ......4–47
600.0403 Evaluating grazed forest lands 4–49
(a) Planned trend .................................................................................................4–49
(b) Forage value rating .......................................................................................4–49
600.0404 Vegetation sampling techniques 4–50
(a) Selecting techniques .....................................................................................4–50
(b) Studies of treatment effects .........................................................................4–50
Tables Table 4–1 The three attributes of rangeland health and the rating 4–24 categories for each attribute
Table 4–2 Grouping of the indicators of rangeland health into 4–48 ecological attributes

National Range and Pasture HandbookInventorying and Monitoring Grazing Land Resources
Chapter 4
4–ii (190–VI–NRPH, October 2006)
Examples Example 4–1 Completed Browse Resource Evaluation worksheet 4–11showing trend and utilization 1
Example 4–2 Completed Browse Resource Evaluation worksheet 4–12showing change in trend at same site as used in example
Example 4–3 Determination of similarity index of historic climax 4–18
Example 4–4 Determination of similarity index to the mesquite 4–20 short grass vegetation state
Example 4–5 Determination of similarity index to native short-grass 4–21 vegetation state
Example 4–6 Determination of similarity index to dense mesquite 4–22 vegetation state
Example 4–7 Revised descriptor for the bare ground indicator 4–27
Example 4–8 Functional/structural groups for a prairie ecological 4–40site
Example 4–9 Functional/structural groups from a Great Basin desert 4–40 site
Exhibits Exhibit 4–1 Examples of weight units 4ex–1
Exhibit 4–2 Percentage of air-dry matter in harvested plant 4ex–2material at various stages of growth
Exhibit 4–3 NRCS RANGE 414, Proper grazing use 4ex–4
Exhibit 4–4 Foliage denseness classes 4ex–6
Exhibit 4–5 Browse resource evaluation wooksheet 4ex–9
Exhibit 4–6 Trend determinations worksheet 4ex–11
Exhibit 4–7 Determining similarity index worksheet 4ex–12
Exhibit 4–8 Ecological site reference sheet 4ex–14
Exhibit 4–9 Rangeland health evaluation sheet 4ex–17
Exhibit 4–10 Rangeland health evaluation matrix 4ex–21

(190–VI–NRPH, October 2006) 4–1
Chapter 4 Inventorying and Monitoring Grazing Land Resources
Chapter 4 includes:
• procedures for vegetation inventory and moni-toring on native grazing lands
• procedures for evaluating and rating ecological sites
• information on vegetation sampling techniques
The inventory and monitoring section describes meth-ods of determining production, composition, and uti-lization. The evaluating and rating of ecological sites section gives procedures for determining trend and similarity index and evaluating rangeland health attri-butes on rangelands and forage value ratings on grazed forest lands. The Sampling Vegetation Attributes, Interagency Technical Reference, 1996, and Utiliza-tion Studies and Residual Measurements, Interagency Technical Reference, 1996, should be used for specific monitoring methods.
600.0400 General
Vegetation sampling is an important activity con-ducted by Natural Resources Conservation Service (NRCS) range management specialists and pasture management specialists. The data are used to develop inventories for planning, monitor ecological change, provide data to make management decisions for the development of rangeland ecological site descriptions, to obtain data for hydrologic models, for studies of treatment effects, and for many other purposes.
An inventory is defined as the collection, assemblage, interpretation, and analysis of natural resource data for planning or other purposes. Inventories are regu-larly completed to determine the present status of vari-ables important to NRCS and decisionmakers. These inventories include physical structures, hydrologic features, rangeland ecological sites, animal resources, and other variables pertinent to the planning process. Biomass data collection, production, and composition by species are the standard techniques used by NRCS in characterizing rangeland ecological sites during the inventory process.
Several variables important to rangeland health and trend cannot be quantified using biomass data alone, so other techniques must be used to quantify charac-teristics of rangeland ecological sites. For instance, cover measurements can be used to quantify ground cover of litter, seedlings, microphytes (algae, lichen, and moss), and the condition of the soil surface. Cover is also important from a hydrologic perspective where the variables of interest might include basal cover of perennial and annual species, litter, coarse fragments, rills, and foliar and canopy cover above the soil sur-face.
Monitoring is used to quantify effects of management or environmental variation at a location, through time. Monitoring can be short term, for example, to quantify the amount of biomass used during a grazing event. It can also be long term such as to quantify trend in simi-larity index on a particular rangeland ecological site. Monitoring techniques are different from those used in inventory because monitoring uses the same location on a repetitive basis. Continued clipping at the same location may eventually impact the productivity of the location, and biomass data collection is labor intensive

National Range and Pasture HandbookInventorying and Monitoring Grazing Land Resources
Chapter 4
4–2 (190–VI–NRPH, October 2006)
and time consuming. Therefore, monitoring environ-mental change using another technique, such as cover, or a combination of techniques, such as cover and density, is often more efficient. Data collections for ecological site descriptions are more involved than planning inventories. These data collections require collection of biomass and cover data, as well as a review of local history related to the historic climax plant community. Data are also collected for use in hydrology assessments. Development of hydrologic models is an important activity in NRCS that requires data collection from a unique set of variables.
Studies of treatment effects are limited in NRCS. These studies involve intensive use of statistical meth-ods and should be done in cooperation with USDA Agricultural Research Service (ARS) or universities familiar with the particular type of study. Data collec-tions for other purposes might include data for:
• coordinating grazing history, stocking rate, and animal performance records in determining guides to initial stocking rates
• preparing soil survey manuscripts and other publications
• analyzing wildlife habitat values
• planning watershed and river basin projects
• assisting and training landowners and opera-tors in monitoring vegetation trends and the impact of applied conservation practices and programs
• exchanging information with research institu-tions and agencies
• preparing guides and specifications for rec-reation developments, beautification, natural landscaping, roadside planting, and other devel-opments or practices
600.0401 Inventory
All production and composition data collected by NRCS are based on weight measurements. Weight is the most meaningful expression of the productivity of a plant community or an individual species. It has a direct relationship to feed units for grazing animals that other measurements do not have.
Production is determined by measuring the annual aboveground growth of vegetation. Some aboveground growth is used by insects and rodents, or it disappears because of weathering before production measure-ments are made. Therefore, these determinations represent a productivity index. They are valuable for comparing the production of different rangeland eco-logical sites, plant species composition, and similarity index. Production data must be obtained at a time of year when measurements are valid for comparison with similar data from other years, other sites, and various conditions being evaluated.
Comprehensive interpretation of plant production and composition determinations requires that data be rep-resentative of all species having measurable produc-tion. Rangeland and other grazing lands may be used or have potential for use by livestock and wildlife, as recreation areas, as a source of certain wood prod-ucts, for scenic viewing, and for other soil and water conservation purposes. The value of plant species for domestic livestock often is not the same as that for wildlife, recreation, beautification, and watershed protection. Furthermore, the principles and concepts of rangeland ecological site, similarity index, and other interpretations are based on the total plant commu-nity. Therefore, interpretations of a plant community are not limited solely to species that have value for domestic livestock.
The procedures and techniques discussed in this section relate primarily to rangeland. Most of them, however, also apply to grazeable forest and native or naturalized pasture. Changes or modifications in procedures required for land other than rangeland are described.
4–3(190–VI–NRPH, October 2006)
National Range and Pasture HandbookInventorying and Monitoring Grazing Land Resources
Chapter 4
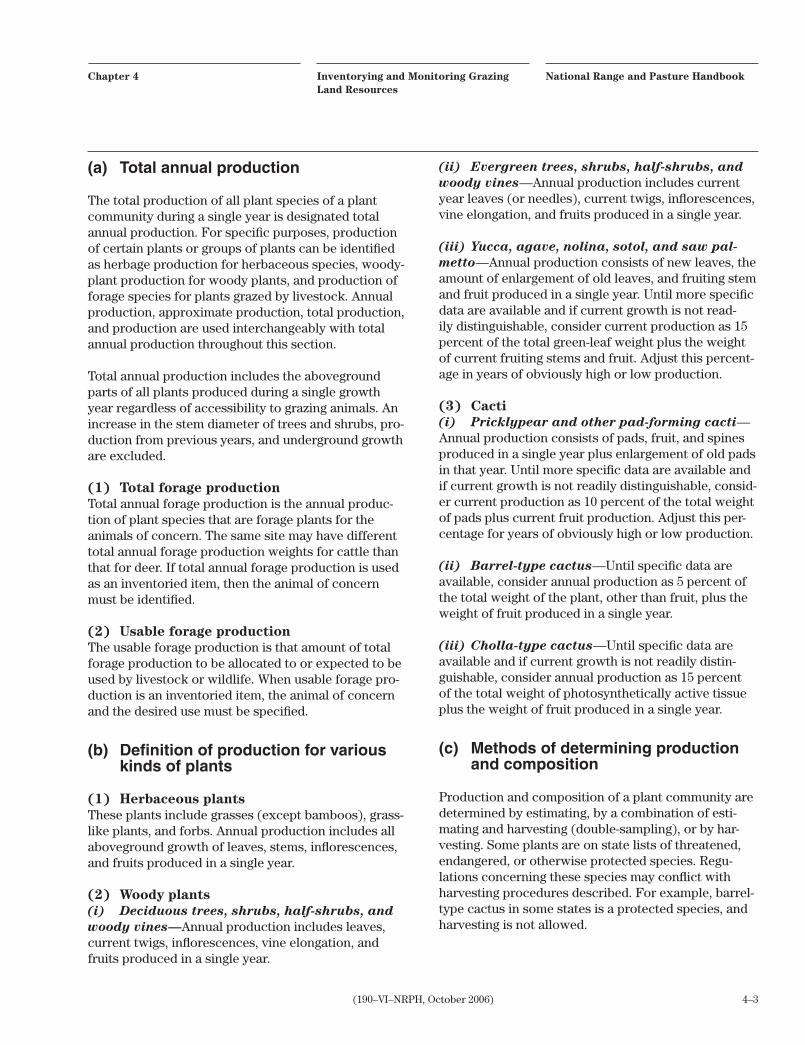
(a) Total annual production
The total production of all plant species of a plant community during a single year is designated total annual production. For specific purposes, production of certain plants or groups of plants can be identified as herbage production for herbaceous species, woody-plant production for woody plants, and production of forage species for plants grazed by livestock. Annual production, approximate production, total production, and production are used interchangeably with total annual production throughout this section.
Total annual production includes the aboveground parts of all plants produced during a single growth year regardless of accessibility to grazing animals. An increase in the stem diameter of trees and shrubs, pro-duction from previous years, and underground growth are excluded.
(1) Total forage productionTotal annual forage production is the annual produc-tion of plant species that are forage plants for the animals of concern. The same site may have different total annual forage production weights for cattle than that for deer. If total annual forage production is used as an inventoried item, then the animal of concern must be identified.
(2) Usable forage productionThe usable forage production is that amount of total forage production to be allocated to or expected to be used by livestock or wildlife. When usable forage pro-duction is an inventoried item, the animal of concern and the desired use must be specified.
(b) Definition of production for various kinds of plants
(1) Herbaceous plantsThese plants include grasses (except bamboos), grass-like plants, and forbs. Annual production includes all aboveground growth of leaves, stems, inflorescences, and fruits produced in a single year.
(2) Woody plants(i) Deciduoustrees,shrubs,half-shrubs,andwoodyvines—Annual production includes leaves, current twigs, inflorescences, vine elongation, and fruits produced in a single year.
(ii) Evergreentrees,shrubs,half-shrubs,andwoodyvines—Annual production includes current year leaves (or needles), current twigs, inflorescences, vine elongation, and fruits produced in a single year.
(iii)Yucca,agave,nolina,sotol,andsawpal-metto—Annual production consists of new leaves, the amount of enlargement of old leaves, and fruiting stem and fruit produced in a single year. Until more specific data are available and if current growth is not read-ily distinguishable, consider current production as 15 percent of the total green-leaf weight plus the weight of current fruiting stems and fruit. Adjust this percent-age in years of obviously high or low production.
(3) Cacti(i) Pricklypearandotherpad-formingcacti—Annual production consists of pads, fruit, and spines produced in a single year plus enlargement of old pads in that year. Until more specific data are available and if current growth is not readily distinguishable, consid-er current production as 10 percent of the total weight of pads plus current fruit production. Adjust this per-centage for years of obviously high or low production.
(ii) Barrel-typecactus—Until specific data are available, consider annual production as 5 percent of the total weight of the plant, other than fruit, plus the weight of fruit produced in a single year.
(iii)Cholla-typecactus—Until specific data are available and if current growth is not readily distin-guishable, consider annual production as 15 percent of the total weight of photosynthetically active tissue plus the weight of fruit produced in a single year.
(c) Methods of determining production and composition
Production and composition of a plant community are determined by estimating, by a combination of esti-mating and harvesting (double-sampling), or by har-vesting. Some plants are on state lists of threatened, endangered, or otherwise protected species. Regu-lations concerning these species may conflict with harvesting procedures described. For example, barrel-type cactus in some states is a protected species, and harvesting is not allowed.

National Range and Pasture HandbookInventorying and Monitoring Grazing Land Resources
Chapter 4
4–4 (190–VI–NRPH, October 2006)
The weight of such plants is to be estimated unless special permission for harvesting can be obtained. Conservationists determining production should be aware of such plant lists and regulations. Environment Memorandum-1 (rev.) states NRCS policy on activities involving Federal- and state-designated threatened and endangered species.
(1) Estimating (by weight units)The relationship of weight to volume is not constant; therefore, production and composition determinations are based on weight estimates, not on comparison of relative volumes. The weight unit method is an effi-cient means of estimating production and lends itself readily to self-training. This method is based on the following:
• A weight unit is established for each plant spe-cies occurring on the area being examined.
• A weight unit can consist of part of a plant, an entire plant, or a group of plants (see exhibit 4–1).
• The size and weight of a unit vary according to the kind of plant. For example, a unit of 5 to 10 grams is suitable for small grass or forb species. Weight units for large plants may be several
• pounds or kilograms
• other considerations:
— length, width, thickness, and number of stems, and leaves
— ratio of leaves to stems
— growth form and relative compactness of species
The following procedure can be used to establish a weight unit for a species.
Step 1. Decide on a weight unit (in pounds or grams) that is appropriate for the species.
Step 2. Visually select part of a plant, an entire plant, or a group of plants that will most likely equal this weight.
Step 3. Harvest and weigh the plant material to determine actual weight.
Step 4. Repeat this process until the desired weight unit can be estimated with reasonable ac-curacy.
Step 5. Maintain proficiency in estimating by periodically harvesting and weighing to check estimates of production.
The procedure for estimating production and composi-tion of a single plot is:
Step 1. Estimate production by counting the weight units of each species in the plot.
Step 2. Convert weight units for each species to grams or pounds.
Step 3. Harvest and weigh each species to check estimates of production.
Step 4. Compute composition on the basis of actual weights to check composition estimates.
Step 5. Repeat the process until proficiency in estimating is attained.
Step 6. Periodically repeat the process to main-tain proficiency in estimating.
Step 7. Keep the harvested materials, when nec-essary, for air-drying and weighing to convert from field (green) weight to air-dry weight.
(2) Estimating and harvesting (double sam-pling)
The double-sampling method is to be used in making most production and composition determinations. The procedure is:
Step 1. Select a study area consisting of one soil taxonomic unit. This should be a benchmark soil or taxonomic unit that is an important component of a rangeland ecological site or forest land eco-logical site.
Step 2. Select plots to be examined at random.
Step 3. The number of plots selected depends on the purpose for which the estimates are to be used, uniformity of the vegetation, and other fac-tors. A minimum of 10 plots should be selected for all data to be used in determining rangeland eco-logical sites or other interpretive groupings and for data for use in the Ecological Site Information System. If vegetation distribution is very irregular and 10 plots will not give an adequate sampling, 20

4–5(190–VI–NRPH, October 2006)
National Range and Pasture HandbookInventorying and Monitoring Grazing Land Resources
Chapter 4
plots can be selected. Fewer than 10 plots can be used if data are to be used for planning or applica-tion work with landowners, but the data should not be entered in the Ecological Site Information System.
Step 4. Adapt size and shape of plots to the kind of plant cover to be sampled. Plots can be circular, square, or rectangular. The area of a plot can be expressed in square feet, acres, or square meters.
If vegetation is relatively short and plot markers can be easily placed, 1.92-, 2.40-, 4.80-, and 9.60-square foot plots are well suited to use in determining pro-duction in pounds per acre. The 9.6-square foot plot is generally used in areas where vegetation density and production are relatively light. The smaller plots, especially the 1.92-square foot plot, are satisfactory in areas of homogeneous, relatively dense vegetation like that occurring in meadows and throughout the plains and prairie regions. Plots larger than 9.6 square feet should be used where vegetation is very sparse and heterogeneous.
If the vegetation consists of trees or large shrubs, larger plots must be used. If the tree or shrub cover is uniform, a 66- by 66-foot plot of 0.1 acre is suitable. If vegetation is unevenly spaced, a more accurate sample can be obtained by using a 0.1-acre plot, 4.356 feet wide and 1,000 feet long. For statistical analyses, 10 plots of 0.01 acre are superior to a single 0.1 acre plot. If vegetation is mixed, two sizes of plots generally are needed. A series of 10 square or rectangular plots of 0.01 acre and a smaller plot, such as the 9.6-square foot plot nested in a designated corner of each larger plot, is suitable. The 0.01-acre plot is used for trees or large shrubs, and the smaller plot for lower growing plants. Weights of the vegetation from both plots are then converted to pounds per acre.
Plots with area expressed in square meters are used if production is to be determined in kilograms per hectare. If the plots are nested, production from both plots must be recorded in the same units of measure. For example, a plot 20 meters by 20 meters (or other dimensions that equal 400 meters) can be used for measuring the tree and shrub vegetation and a 1-me-ter plot nested in a designated corner can be used for measuring the low-growing plants. Determine the production from both in grams and convert the grams
to kilograms per hectare. Plots of 0.25, 1, 10, 100, and 400 square meters are commonly used.
After plots are selected, estimate and record the weight of each species in each plot using the weight-unit method. When estimating or harvesting plants, include all parts of plants whose stems originate in the plot, including all aboveground parts that extend be-yond a plot boundary. Exclude all parts of herbaceous plants and shrubs whose stems originate outside a plot, even though their foliage may overlap into the plot.
After weights have been estimated on all plots, select the plots to be harvested. The plots selected should in-clude all or most of the species in the estimated plots. If an important species occurs on some of the esti-mated plots, but not on the harvested plots, it can be clipped individually on one or more plots. The number of plots harvested depends on the number estimated. To adequately correct the estimates, research indi-cates at least one plot should be harvested for each seven estimated. At least 2 plots are to be harvested if 10 are estimated, and 3 are to be harvested if 20 are estimated.
Harvest, weigh, and record the weight of each species in the plots selected for harvesting. Harvest all her-baceous plants originating in the plot at ground level. Harvest all current leaf, twig, and fruit production of woody plants originating in the plots. If harvesting for-age production only, then harvest to a height of 4.5 feet above the ground on forest land sites.
Correct estimated weights by dividing the harvested weight of each species by the estimated weight for the corresponding species on the harvested plots. This fac-tor is used to correct the estimates for that species in each plot. A factor of more than 1.0 indicates that the estimate is too low. A factor lower than 1.0 indicates that the estimate is too high.
After plots are estimated and harvested and correction factors for estimates computed, air-dry percentages are determined by air-drying the harvested materials or by selecting the appropriate factor from an air-dry percentage table (see exhibit 4–2). Values for each spe-cies are then corrected to air-dry pounds per acre or kilograms per hectare for all plots. Average weight and percentage composition can then be computed for the sample area.
National Range and Pasture HandbookInventorying and Monitoring Grazing Land Resources
Chapter 4
4–6 (190–VI–NRPH, October 2006)
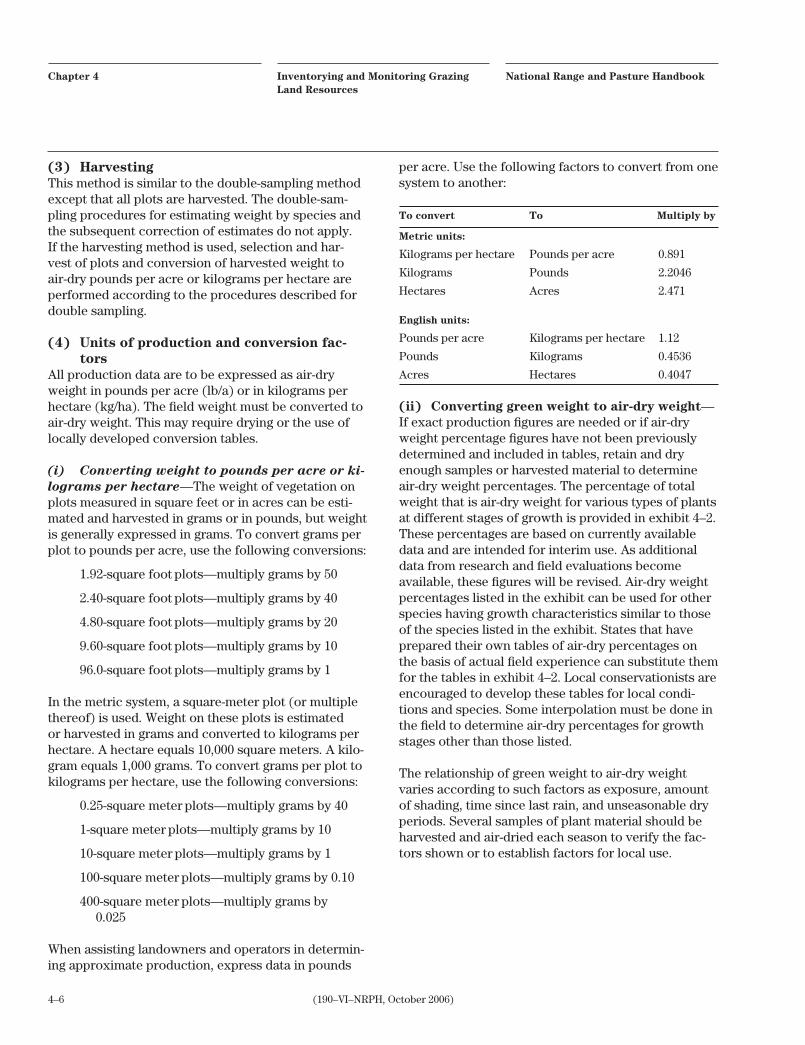
(3) HarvestingThis method is similar to the double-sampling method except that all plots are harvested. The double-sam-pling procedures for estimating weight by species and the subsequent correction of estimates do not apply. If the harvesting method is used, selection and har-vest of plots and conversion of harvested weight to air-dry pounds per acre or kilograms per hectare are performed according to the procedures described for double sampling.
(4) Units of production and conversion fac-tors
All production data are to be expressed as air-dry weight in pounds per acre (lb/a) or in kilograms per hectare (kg/ha). The field weight must be converted to air-dry weight. This may require drying or the use of locally developed conversion tables.
(i) Convertingweighttopoundsperacreorki-logramsperhectare—The weight of vegetation on plots measured in square feet or in acres can be esti-mated and harvested in grams or in pounds, but weight is generally expressed in grams. To convert grams per plot to pounds per acre, use the following conversions:
1.92-square foot plots—multiply grams by 50
2.40-square foot plots—multiply grams by 40
4.80-square foot plots—multiply grams by 20
9.60-square foot plots—multiply grams by 10
96.0-square foot plots—multiply grams by 1
In the metric system, a square-meter plot (or multiple thereof) is used. Weight on these plots is estimated or harvested in grams and converted to kilograms per hectare. A hectare equals 10,000 square meters. A kilo-gram equals 1,000 grams. To convert grams per plot to kilograms per hectare, use the following conversions:
0.25-square meter plots—multiply grams by 40
1-square meter plots—multiply grams by 10
10-square meter plots—multiply grams by 1
100-square meter plots—multiply grams by 0.10
400-square meter plots—multiply grams by 0.025
When assisting landowners and operators in determin-ing approximate production, express data in pounds
per acre. Use the following factors to convert from one system to another:
To convert To Multiply by
Metric units:
Kilograms per hectare Pounds per acre 0.891
Kilograms Pounds 2.2046
Hectares Acres 2.471
English units:
Pounds per acre Kilograms per hectare 1.12
Pounds Kilograms 0.4536
Acres Hectares 0.4047
(ii) Converting green weight to air-dry weight—If exact production figures are needed or if air-dry weight percentage figures have not been previously determined and included in tables, retain and dry enough samples or harvested material to determine air-dry weight percentages. The percentage of total weight that is air-dry weight for various types of plants at different stages of growth is provided in exhibit 4–2. These percentages are based on currently available data and are intended for interim use. As additional data from research and field evaluations become available, these figures will be revised. Air-dry weight percentages listed in the exhibit can be used for other species having growth characteristics similar to those of the species listed in the exhibit. States that have prepared their own tables of air-dry percentages on the basis of actual field experience can substitute them for the tables in exhibit 4–2. Local conservationists are encouraged to develop these tables for local condi-tions and species. Some interpolation must be done in the field to determine air-dry percentages for growth stages other than those listed.
The relationship of green weight to air-dry weight varies according to such factors as exposure, amount of shading, time since last rain, and unseasonable dry periods. Several samples of plant material should be harvested and air-dried each season to verify the fac-tors shown or to establish factors for local use.

4–7(190–VI–NRPH, October 2006)
National Range and Pasture HandbookInventorying and Monitoring Grazing Land Resources
Chapter 4
(d) Methods for determining production and composition for specific situations
The intended use of the data being collected deter-mines the method, or variation thereof, that is select-ed. Unless specifically stated otherwise, composition is always determined by computing the percent from the weight, either estimated or weighed. Several activi-ties require knowledge of production, but in varying degrees of detail. The methods or variations that apply to several of these situations are described in this sec-tion.
(1) Collecting production and composition data for documentation
Data to be used for preparing rangeland ecological site descriptions grouping soils into rangeland ecological sites, and other guides, and processing in the Ecologi-cal Site Information System are to be obtained by the double-sampling procedure. All documentary produc-tion and composition data are to be recorded on form NRCS–RANGE–417. Production determinations are made as follows:
• Tabulate production data by estimating and harvesting plots of the potential plant com-munity for one or more soil taxonomic units associated with the site or group.
• Obtain production data from vegetation that has not been grazed since the beginning of the current growing season.
• Make determinations near or shortly after the end of the growing season of the major species. Give due consideration to species that mature early in the growing season. If plant communi-ties consist of a mixture of warm- and cool-sea-son species, at least two determinations may be needed during a single production year. The following procedure should then be used:
— Select two periods that will yield the best estimate of the growth of most of the impor-tant species.
— At the first determination, estimate and harvest only the species that are mature or nearly mature.
— At the second determination, select a new set of plots for estimating and harvesting
all other species, but record the data on the same form NRCS–RANGE–417 used for the first determination.
— At the second determination, harvest the plots having numbers corresponding to those harvested at the first determination. For example, if plots number two and four were harvested the first time, plots number two and four are harvested the second time. Correction of sampling errors, as well as moisture data can then be made. Any species not included in these plots can be harvested individually.
— If two determinations are made, record the date of the second determination in the Remarks space of form NRCS–RANGE–417.
• Repeat production determinations in different years to reflect year-to-year variations.
• Analyze production data from soil taxonomic units to determine the soils that should be tentatively grouped into specific rangeland eco-logical sites or other interpretive groupings and also to obtain data for inclusion in published soil surveys. Soils are not grouped based on production alone. The species composition by weight is also used.
The procedures discussed above are also to be used in obtaining data for the various status ratings for range-land ecological sites and for different forage value ratings on those sites. To accomplish this, collect data from areas that represent specific similarity index or forage value ratings for the rangeland ecological site in a single production year. This procedure will be used for all kinds and uses of grazing lands.
(2) Estimating production and composition of an area
Use the following procedure to estimate similarity index of a rangeland ecological site, areas of different similarity indices within a rangeland ecological site, and forage value rating of a forestland ecological site or a native pasture group:
• Estimate production, in pounds per acre or kilograms per hectare, of individual species in the area.

National Range and Pasture HandbookInventorying and Monitoring Grazing Land Resources
Chapter 4
4–8 (190–VI–NRPH, October 2006)
• Compute composition, by weight, of the area from estimated production data. Sample the production on a series of random plots.
• Compute average production of the plots in terms of pounds per acre or kilograms per hectare, to further check these estimates for the area as a whole, harvest or double sample.
• Using these average figures, compute average composition. Although by using this procedure some species of minor importance may be missed, the procedure provides a useful check on estimates.
• Repeat this procedure until proficiency is attained. To gain proficiency, double sample within a range of similarity indices in several rangeland ecological sites each year.
(3) Inventorying composition for conserva-tion planning
During conservation planning, it is often necessary to determine plant composition when plant growth is not ideal for making such determinations. Some grazing units are grazed at the time of planning. In places, esti-mates must be made at different stages of plant growth or when plant vigor varies from grazing unit to graz-ing unit. In some years production is obviously much higher or much lower than normal because of weather extremes. In making production estimates, therefore, it is often necessary to mentally reconstruct plant growth as it would most likely appear if undisturbed at the end of an average growing season. Adjustments or reconstruction must be made for percent of growth made during the year, percent of growth grazed or otherwise lost, and for air dry percentages.
(4) Determining production of tree or large shrub vegetation on rangeland
Rangeland ecological site descriptions are to include composition, by weight, of trees that are part of the climax plant community. Determining production of trees and large shrubs by harvesting portions of stands is time consuming and impractical for regular field conservation planning procedures. Research scientists are devising methods for calculating current produc-tion of some species on the basis of measurements of such factors as crown width or height and basal area.
These data are to be used in estimating the annual production of trees and large shrubs. Range manage-
ment specialists, pasture specialists, and foresters work together to prepare production guides for vari-ous kinds of understory and tree stands for use by field office personnel. Range management specialists are to use the following procedures in preparing guides for rangeland:
• Select a few sample trees for each species. Samples should reflect variations in tree size, form, and spacing.
• Determine current production of sample trees.
• Determine production through a combination of estimating and harvesting. For estimates, establish appropriate weight units. These units can be an entire small tree or a branch or cluster of branches from large trees (see exhibit 4–1). Determinations from sample trees should include all components of current production except bark and wood of other than current twigs. Current leaf and twig produc-tion can be easily identified for some species. For these species, current leaf growth can be collected. Field determinations of production can be based on current leaf production only if data are available to indicate the percentage that various components contribute to total production. For example, Utah research shows that current production of balsam fir and Utah juniper is about 30 percent of the total foliage. Current production of these two species can be calculated by determining the total foliage present, then multiplying by 0.30 and adding to this figure the current fruit (cone) production. For species requiring 2 years for fruit maturity, half the weight of mature fruit represents the current production of fruit.
• Expand estimates to plots 0.1 acre or larger. Record production for each tree or large shrub. If the 0.1- or 0.01-acre or the 400-square meter plots are used in stands of trees, the likelihood of the plot boundary hitting the bole of a tree is high. If this happens exclude the first hit tree and include the second hit and so on or vice versa. Also describe the appearance and aspect of the plot. List component species, tree size, growth forms, number of trees, and density of the canopy.
• Repeat this process for stands of various kinds of trees or large shrubs. On the basis of data

4–9(190–VI–NRPH, October 2006)
National Range and Pasture HandbookInventorying and Monitoring Grazing Land Resources
Chapter 4
thus collected, prepare guides that list the ap-proximate annual production of stands of vari-ous kinds of trees or large shrubs (see exhibit 4–4).
(e) Methods for determining utilization of key species
The main purpose for determining utilization is to consider whether adjustments are needed in grazing management or stocking rate. Determining the actual use of key grazing areas is only one of the factors con-sidered in assessing the status of plant communities. Other factors, such as trend, similarity index, and the status of rangeland health attributes, must be consid-ered. The degree of use of one or more plant species in a key grazing area does not measure the total amount of forage that grazing animals can consume. If the key species and key grazing areas are correctly selected, it is an index of the degree of grazing use for the total plant community. Use the following methods to deter-mine forage utilization.
(1) Weight comparisons of grazed versus un-grazed plants
Ungrazed plants of the key species occurring within movable enclosures, located in key grazing areas at the beginning of the grazing season, are cut and weighed. The weight of these plants is then compared with that of grazed plants of the key species clipped near the enclosures. As an alternative, the clipped weight of grazed plants can be compared with that of ungrazed plants of the key species selected at random in the key grazing area. If ungrazed plants of the species are not available, ungrazed plants from the nearest compa-rable location can be used.
(2) Determining percentage of grazed versus ungrazed plants
This method applies where evaluations relating the percentage of grazed versus ungrazed plants of a spe-cies to the percentage removal by weight have been determined locally. After the percentage of grazed versus ungrazed plants of the key species in the key grazing area is determined, the percentage removal is determined using charts and graphs prepared during previous evaluations.
(3) Use of grazed-class photo guidesIn some locations, series of photographs illustrating various degrees of grazing use, expressed in percent-age by weight, are available for some plant species. Guides based on actual clipping and weighing of plants of the key species provide a relatively simple and rapid means of determining approximate grazing use. Such guides should be used only in the locality where they are prepared and only for the plant species specifi-cally appraised. The procedure is to visually compare a series of plants of the key species with photographs illustrating various degrees of plant use and to tally the number of plants occurring in each grazed class. Ex-tremes in growing condition must be considered when using photo guides.
(4) Ocular estimates of percentage grazedQualified conservationists who are trained and experi-enced in making actual weight comparisons of grazed versus ungrazed plants can make ocular estimates of the percentage removal of key species in a key grazing area. If this method is used, it is important to demon-strate the actual weight procedure to the cooperator on one or more grazing units.
(5) Determining utilization of browse plantsEven though the degree of utilization of current growth of browse plants is an important factor, it does not provide all the information needed for properly planning and managing rangeland for use by wildlife or livestock. Moreover, it is impractical to make cur-rent utilization estimates at such times as during the early part of the growing season or before current use has taken place on seasonal range. In addition to the degree of utilization of current growth, several other indicators are of value in appraising the general trend in production of a stand of browse plants. These indicators often reveal more about the stand than current utilization alone. Also, they can be observed and interpreted at any time of the year. These indica-tors include:
• Age classes of key plant species—Age class is probably the most important single factor in judging trend in a stand of browse plants. If all plants are mature, the stand is not maintaining itself and will thin out as older plants die. The presence of adequate numbers of seedlings and young plants of the key species is indicative of a healthy, self-perpetuating stand. Browse plants generally do not reproduce every year,

National Range and Pasture HandbookInventorying and Monitoring Grazing Land Resources
Chapter 4
4–10 (190–VI–NRPH, October 2006)
but at least several age classes should be represented in a healthy stand. Animals usu-ally prefer seedlings and young plants; conse-quently, a degree of use that may be proper for mature plants often results in overutilization of younger plants.
• Evidence of hedging of the key plant spe-cies—The degree of hedging reflects past use and also the productive ability of browse plants. Moderate hedging may be desirable for some species because it stimulates growth and keeps plants from growing out of reach of animals. Severe hedging results in the death of many branches and if continued for a long time may cause death of entire plants. If only a single year’s growth extends beyond old hedged contours, recent use has been heavy. Parts of two or more years’ growth beyond old hedged contours suggest that browsing pres-sure has recently been reduced and that trend is upward.
• Use of plant growth more than 1 year old—Generally, when overall utilization is heavy, browsing animals often consume parts of plants that are older than the current growth. Continued use of older growth results in rapid decline and death of plants.
• Evidence of browse lines—If a browse line is readily apparent, plant growth within reach of animals has declined. Very distinct browse lines indicate that plants have already grown beyond the reach of animals. Such plants may be vigor-ous and productive because of unused growth above reach of animals, but they produce little or no available forage.
• Presence of dead twigs and branches—Some mortality of plant parts is normal, but excessive amounts of dead or weak limbs, branches, twigs, or even entire plants indicate that past use was too heavy and that the stand is deteriorating.
• Relative size of plant parts—Light pruning or browsing often stimulates growth of leaves and sprouts to more than normal size. Contin-ued heavy use, however, results in small and weak leaves, twigs, and fruiting stems. Repeat-ed heavy use of sprouts gradually reduces their size. If properly used, species of root-sprouting
ability produce sprouts following fire or other disturbances; however, weakened plants do not. Overutilization reduces or eliminates fruit and seed production.
• Significant use of low-preference species—Plants of low preference are ordinarily lightly used unless species of higher preference are not available or have been too heavily used. If significant use is made of a species that animals ordinarily use sparingly or not at all, the key species is being abused.
• Amount of reproduction of low-preference species—Excessive reproduction of a low preference species generally indicates that the key species has declined to the extent that it is unable to compete with other plants.
• Condition of animals—The physical condi-tion and reproductive ability of game animals or livestock reflect the amount and quality of plants available for forage. This indicator is not infallible because animals may remain in good condition for a while, even on seriously abused ranges, as long as succulent growth is available. Also, supplemental feeding of livestock often masks the effect of inadequate natural forage supplies.
None of the indicators, by itself, is a completely reli-able indicator of the overall utilization of the plant community. All evidence must be carefully evaluated as a basis for determining needed adjustments in management or stocking and for determining needed harvest of game animals using the range.
The Browse Resource Evaluation worksheet (see ex-hibit 4–5) can be used for judging composition, trend, and utilization of the browse plant resource. Examples 4–1 and 4–2 illustrate how to use the worksheet. Ex-ample 4–1 records the determination of trend in June 1994 and records utilization during the next three fall and winter seasons. Example 4–2 illustrates the same location in July 1997 following a prescribed burn. The change in trend is recorded, and utilization will be recorded at the appropriate time.

4–11(190–VI–NRPH, October 2006)
National Range and Pasture HandbookInventorying and Monitoring Grazing Land Resources
Chapter 4
Mt. mahoganyHackberryShin oakEG sumac
Juniper XPersimmon X
X X X X
Mt. mahogany XSpanish oak XHackberry XRedbud X
B.J. SmithLower Canyon Goats, deer Recovery of preferred species; Reduction in juniper
6 12 94
Low Stony Hill 3/4 mile N of spring L. Jones
XXXX
X X XX
Shin oak XEvergreen sumac X
XX
XX
X
X
Sp-fallSp-fallSp-fallYearlong
Goats removed Dec. 94; Deer only in 95; Presburn Feb. 96; Goats in summer 96.
50505050
9480+80+6550
12-4
9570602020
10-9
966060353511-6
Note: ___________________________________________________________________________________________________________________________________________________________________________________
Judge compositionand trend based onmajority of evidence
Date of
initial evaluation:
____/____/____
Cooperator: __________________________________ Ecological site: __________________________________Pasture: ____________________________________ Location in pasture: _______________________________Kinds of browsing animals: ______________________________ Examiner: _______________________________Goals for browse resource: ______________________________________________________________________
Preferred species
Non-preferred species
Desirable species
Browse compositionOccurrence
CommonAbundant Scarce Moderate Severe Abundant AdequateNot
evidentNot
adequate
Browse trendHedging or browse line Reproduction
Good
Fair
Poor
Example - Browse Resource Evaluation
Upward
Stable or not apparent
Downward
Utilization of current year's growth
Browse composition Browse trend
Key species
Seasonof
use
Planneduse
percent
Actual use percent
Years
Date observed
Example 4–1 Completed Browse Resource Evaluation worksheet showing trend and utilization

National Range and Pasture HandbookInventorying and Monitoring Grazing Land Resources
Chapter 4
4–12 (190–VI–NRPH, October 2006)
Example 4–2 Completed Browse Resource Evaluation worksheet showing change in trend at same site as used in example 4–1
Mt. mahoganyHackberryShin oakEG sumac
Juniper XPersimmon X
X XX X
Mt. mahogany XSpanish oak XHackberry XRedbud X
B.J. SmithLower Canyon Goats, deer Continue recovery of preferred species
7 30 97
Low Stony Hill 3/4 mile N of spring L. Jones
XXXX
X X XX
Shin oak XEvergreen sumac XFlameleaf sumac X
XX
X
XXX
XX
Sp-fallSp-fallSp-fallYearlong
Fire killed much mahogany; Fire killed all juniper; Sumacs invigorated by fire.
50505050
Note: ___________________________________________________________________________________________________________________________________________________________________________________
Judge compositionand trend based onmajority of evidence
Date of
initial evaluation:
____/____/____
Cooperator: __________________________________ Ecological site: __________________________________Pasture: ____________________________________ Location in pasture: _______________________________Kinds of browsing animals: ______________________________ Examiner: _______________________________Goals for browse resource: ______________________________________________________________________
Preferred species
Non-preferred species
Desirable species
Browse compositionOccurrence
CommonAbundant Scarce Moderate Severe Abundant AdequateNot
evidentNot
adequate
Browse trendHedging or browse line Reproduction
Good
Fair
Poor
Example - Browse Resource Evaluation
Upward
Stable or not apparent
Downward
Utilization of current year's growth
Browse composition Browse trend
Key species
Seasonof
use
Planneduse
percent
Actual use percent
Years
Date observed

4–13(190–VI–NRPH, October 2006)
National Range and Pasture HandbookInventorying and Monitoring Grazing Land Resources
Chapter 4
Many other factors should be considered in determin-ing utilization of rangeland. Following are some that should be considered when working with the land-owner:
• Although the degree of use or the lack of use of each plant species in a grazing unit is of inter-est and affects the nature of plant communities in the grazing unit, determining the use of each species is neither practical nor essential.
— Averaging the degree of use of many species having widely different degrees of use and grazing preference values does not provide a meaningful answer to utilization or to the impact of such utilization on the plant community.
— Nonuse or light use of a species of negligi-ble grazing preference does not compensate for heavy use of a species having high graz-ing preference.
— To determine the use status of a grazing unit, the acreage that is properly used and overused must be determined. The intent of grazing management is to prevent excessive use of grazing areas, or at least to reduce the excessively used acreage to a reason-able minimum. Most grazing units have small areas of natural livestock concentra-tion, such as those immediately adjacent to water. These areas often are excessively used even when the entire grazing unit is properly grazed. If areas of excessive use do not exceed 3 to 5 percent of the grazing unit, the grazing unit may be considered properly used.
• To determine the degree of grazing use of key species, make the determination at or near the end of the planned grazing period.
— For grazing units grazed on a continuous yearlong basis, make the final determination shortly before the beginning of a new grow-ing season.
— For grazing units grazed early every spring, rested in summer, and grazed again in fall, determine the degree of use at or near the end of each grazing period.
— For grazing units in some type of planned grazing rotation, determine use near or at the end of the planned grazing period of each grazing unit. If grazing units are grazed more than once during the year, make the determination near the end of the last graz-ing period preceding the beginning of a new growth season.
• A determination of degree of use at or near the end of the grazing period serves to indicate the final utilization of grazing units. This is too late, however, to permit needed adjustments in graz-ing during the current season and is, in effect, a postmortem determination.
Conservationists should help cooperators make forage production and utilization determinations and trend observations well before the end of the scheduled grazing period, preferably before two-thirds of the pe-riod has passed. If determinations are made this early, enough time remains to adjust animal numbers or the length of the grazing period to avoid overuse of plants during years of poor production or to take advantage of extra forage in more favorable years.

National Range and Pasture HandbookInventorying and Monitoring Grazing Land Resources
Chapter 4
4–14 (190–VI–NRPH, October 2006)
600.0402 Evaluating and rating ecological sites
Ecological sites are evaluated with the landowner during the inventory phase of the planning process so that a greater level of understanding of the rangeland resource can be achieved by both the NRCS employee and the landowner. The inventory process and evalu-ations of ecological sites provide the opportunity to work with the landowner to identify resource prob-lems and concerns, as well as opportunities to main-tain or improve the resource, and increase the knowl-edge level of the landowner.
An ecological site may be evaluated in at least three distinct, but associated ways. Although these three methods are associated, they are not interchangeable. These evaluations and ratings cannot be extrapolated from one to the other.
The first method of rating is trend. Trend determines the direction of change occurring on a site. It pro-vides information necessary for an operational level of management to ensure the direction of change will enhance the site and meet the manager’s objectives.
Similarity index is another method to evaluate an ecological site. This method compares the present plant community to the historic climax plant com-munity for that site or to a desired plant community that is one of the site’s potential vegetation states. The similarity index to the historic climax plant com-munity is the percentage, by weight, of historic climax vegetation present on the site. Likewise, a similarity index to a desired plant community is the percentage, by weight, of the desired plant community present on the site. As the name implies, this method assesses the similarity of the plant community to the historic climax or desired plant community. This can provide an indication of past disturbances, as well as future management or treatment, or both, needed to achieve the client’s objectives.
Rangeland health provides a third way to assess ecological sites. Qualitative assessments of rangeland health provide land managers and technical specialist with a good communication tool for evaluating ecolog-ical processes and can assist to identify potential areas at risk of degradation.
Conservation planning assistance to rangeland owners and managers includes the following:
• Trend assessments (rangeland trend or planned trend) will be made, provided the appropriate plant communities are known and described in the ecological site descriptions, on the predom-inant rangeland ecological sites and key areas within their operating unit.
• Similarity index to the historic climax plant community or desired plant community will be determined.
• If appropriate, rangeland health ecological at-tributes evaluations will also be made.
• Professional judgment, based on experience and knowledge of the rangeland ecosystems, will be required to decide which rating tech-niques should be used on an individual range-land unit.
(a) Trend
Trend is a rating of the direction of change that may be occurring on a site. The plant community and the as-sociated components of the ecosystem may be either moving toward or away from the historic climax plant community or some other desired plant community or vegetation state (rangeland trend or planned trend). At times, it can be difficult to determine the direction of change.
The kind of trend (rangeland trend or planned trend) being evaluated must be determined. This rating indi-cates the direction of change in the plant community on a site. It provides information necessary for the operational level of management to ensure that the direction of change will enhance the site and meet the objectives of the manager. The present plant com-munity is a result of a sustained trend over a period of time.
Trend is an important and required part of a rangeland resource inventory in the NRCS planning process. It is significant when planning the use, management, and treatment needed to maintain or improve the resource. The trend should be considered when making adjust-ments in grazing management.

4–15(190–VI–NRPH, October 2006)
National Range and Pasture HandbookInventorying and Monitoring Grazing Land Resources
Chapter 4
(1) Rangeland trendRangeland trend is defined as the direction of change in an existing plant community relative to the historic climax plant community. It is only applicable on rangelands that have ecological site descriptions identifying the historic climax plant community. It can be determined as apparent trend or measured trend. Apparent trend is a point in time determination of the direction of change. Measured trend requires measurements of the trend indicators over a period of time. Rangeland trend is monitored on all rangeland ecological sites. It is described as:
Toward—moving towards the historic climax plant community
Not apparent—no change detectable
Away from—moving away from the historic climax plant community
(2) Planned trendPlanned trend is defined as the change in plant compo-sition within an ecological site from one plant commu-nity type to another relative to management objectives and to protecting the soil, water, air, plant, and animal resources (SWAPA). It is described as:
Positive—moving towards the desired plant com-munity or objective.
Not apparent—change not detectable.
Negative—moving away from the desired plant community or objective.
Planned trend provides feedback to the manager and grazing land specialist about how well the manage-ment plan and prescribed grazing are working on a site-by-site basis. It can provide an early opportunity to make adjustments to the grazing duration and stock-ing levels in the conservation plan. Planned trend is monitored on all native and naturalized grazing land plant communities. It may be determined on any ecological site where a plant community other than the historic climax plant community is the desired objective.
(3) Attributes for determining trendExhibit 4–6 is a worksheet for determining range and planned trend. The relative importance of the trend factors described vary in accordance with differences in vegetation, soils, and climate. Evaluating any one of these factors on an ecological site may indicate
whether the plant community is improving or declin-ing. A more accurate evaluation of trend, however, can be ascertained if all or several of the factors are con-sidered in their proper relation to each other.
(i) Compositionchanges—Native plant com-munities evolve within their environment and slowly change over time as environmental factors change. Major short-term changes in the plant composition, however, do not normally occur unless induced by significant disturbances. Disturbances, such as con-tinued close grazing by livestock, severe or prolonged drought, abnormally high precipitation, exotic species invasion, or unnatural burning frequencies, can cause major changes in plant communities.
If the plant community is changing as a result of pro-longed grazing, the perennial species most sensitive to damage by grazing decrease. This may lead to a rela-tive increase in species of lower forage value or suc-cessional stages, or both. When improved management has occurred in areas where the plant cover has been severely depleted, increases in low-quality plants may indicate improvement since these plants may be the first to respond.
When disturbances that caused a decline in plant com-munity are removed, the present plant community may react in one of several ways. It may appear to remain in a steady or static state while it moves along one of several transition pathways leading to one of several identifiable plant communities including the historic climax plant community.
Original species that have declined in amount because of past misuse will often increase over time. For this to occur, seed or vegetative parts must still be avail-able, growing conditions be similar (soil profile, hy-drologic characteristics, microclimate), and space for re-establishment must be available and must not have been displaced by other species, for example, exotic annual and perennial grasses, forbs, shrubs, or trees.
Once established, certain woody and some other long-lived perennial plants may persist and may require high energy expenditures, such as prescribed burning, herbicide application, mechanical treatment, or other applications of supporting practices if the decision-maker desires to remove them.

National Range and Pasture HandbookInventorying and Monitoring Grazing Land Resources
Chapter 4
4–16 (190–VI–NRPH, October 2006)
The invasion of plants on the site indicates a major change in the present plant community. Some invad-ers, particularly annuals, may flourish temporarily in favorable years, even when existing plant community is moving towards management objectives. A signifi-cant, though temporary, increase in annuals and short-lived perennials may also occur during a series of wet years even though general trend is toward objectives.
Changes in plant composition from one plant commu-nity type to another generally follow a pattern. Al-though all changes in amounts of species on a site are not always predictable, general successional patterns for specific sites, plant species, climates, and range-land uses often can be predicted. These successional changes in plant composition are generally not linear and vary because of localized climatic history and past use patterns.
(ii) Abundanceofseedlingsandyoungplants—Changes in a plant community depend mainly on successful reproduction of the individual species within the community. This reproduction is evidenced by young seedlings, plants of various ages, and til-lers, rhizomes, and stolons. The extent to which any of these types of reproduction occurs varies accord-ing to the growth habits of the individual species, site characteristics, current growing conditions, and use to which the plant is subjected. In some plant communi-ties, reproduction is often largely vegetative so the mere absence of seedlings does not always indicate a change in plant community. A significant number of seedlings and young plants of species indigenous to the site, however, usually indicates a positive trend. Variations in seedling recruitment resulting from ab-normal weather patterns should be recognized.
(iii)Plantresidue—The extent to which plant residue accumulates depends primarily on the produc-tion level of the plant community; the amount of plant growth removed by grazing, haying, fire, insects, wind, or water; and the decomposition rate of the plant bio-mass on the site. In hot and humid climates, the rate of decomposition of plant residue may be so great that little or no net accumulation occurs. Conversely, in cold climates decomposition is generally slow. When using plant residue to judge trend in plant community, careful consideration should be given to the level of accumulation that can be expected for the specific ecological site, plant species, and climate.
Excessive grazing, below-normal production, recent fires, and abnormal losses caused by wind or water erosion may result in an accumulation of plant residue below that considered reasonable for the site. In the absence of these factors, progressive accumulation of plant residue generally indicates positive changes in the plant community. Residue may accumulate rapidly for some kinds of plants, especially woody species or annuals. When the amount characteristic for the historic climax plant community is exceeded, such accumulations of residue are not necessarily an indica-tion of an improving plant community.
(iv) Plantvigor—Plant vigor is reflected primar-ily by the size of a plant and its parts in relation to its age and the environment in which it is growing. Many plants that form bunches or tufts when vigorous may assume a sod form if their vigor is reduced. Length of rhizomes or stolons is also a good indication of the vigor of a parent plant; these parts are usually fewer and shorter if a plant is in a weakened status. Periodic drought is common in many rangeland environments and will lower the apparent vigor and annual produc-tivity of ecological sites while often retaining their current plant community.
Cryptogams develop new growth during growing peri-ods that adds to the total structure and biomass of the plant. When considerable amounts of live cryptogamic material are destroyed, several years may be required for these plants to fully replace lost tissue.
(v) Conditionofthesoilsurface—Unfavorable conditions of the soil surface may significantly affect trend. Compaction, splash erosion, and crusting may occur if plants or plant residue are lacking on the soil surface.
Compaction and crusting impede water intake, inhibit seedling establishment and vegetation propagation, and induce higher soil surface temperature. These conditions often increase rates of water runoff and soil loss, reduce effective soil moisture, and generally result in unfavorable plant, soil, and water relation-ships. Improvement in the plant cover following good management is delayed if such soil conditions exist. Bare ground, soil crusting, stone cover, compaction from trampling, plant hummocking, or soil movement may indicate a negative trend in a plant community.

4–17(190–VI–NRPH, October 2006)
National Range and Pasture HandbookInventorying and Monitoring Grazing Land Resources
Chapter 4
These soil indicators, however, are sometimes mis-leading. They can occur naturally under certain cir-cumstances. For example, plant hummocking is natu-ral—on silty soil sites that are subject to frost heaving.
Other sites do not support a complete plant cover. Bare ground crusting, stones on the soil surface, and localized soil movement may be completely natural. Even when induced by misuse, the soil surface trend indicators are not nearly as sensitive as those changes in the plant cover.
(b) Similarity index
The present plant community on an ecological site can be compared to the various common vegetation states that can exist on the site. To make the com-parison, these vegetation states or plant communities must be described in sufficient detail in the ecological site description. This comparison can be expressed through a similarity index, which is the present state of vegetation on an ecological site in relation to the kinds, proportions, and amounts of plants in another vegetation state possible on the site. A similarity index is expressed as the percentage of a vegetation state plant community that is presently on the site. When determining a similarity index, the vegetation state or plant community that the present plant community is being compared to must be identified as the reference plant community.
Similarity index to historic climax plant community is defined as the present state of vegetation on an ecological site in relation to the historic climax plant community for the site. It is expressed as the percent-age, by weight, of the historic climax plant community present on the site. The similarity index to historic cli-max provides a measurement of change that has taken place on a site. The similarity index to historic climax is the result of how climate and management activities have affected the plant community on a site.
(1) Purpose for determining similarity indexThe purpose for determining similarity index to his-toric climax is to provide a basis for describing the extent and direction of changes that have taken place and predicting those that can take place in the plant community because of a specific treatment or man-agement. The ecological site description indicates the historic climax plant community for the site; similarity
index to historic climax represents the percent of the historic climax plant community present on the site. These evaluations provide the manager with the start-ing point for establishing objectives and developing management goals. These goals can result in a change in the present plant community toward a community desired by the decisionmaker that meets the needs of the soil, water, air, plant, and animal resources, as well as those of the manager.
As ecological site descriptions are revised and further developed, they are to include descriptions of other common vegetation states that can exist on the site. A similarity index to each of these or any of these will also indicate the present state of the site.
(2) Determining similarity index to historic climax plant community
The similarity index to historic climax plant commu-nity for areas within an ecological site is determined by comparing the present plant community with that of the historic climax plant community, as indicated by the ecological site description.
The existing plant community must be inventoried by recording the actual weight, in pounds, of each spe-cies present. The production of each species must be reconstructed to reflect total annual production. See exhibit 4–7 for reconstruction procedure. The recon-structed total production by species of the existing plant community is compared to the production of individual species in the historic climax plant com-munity. For the similarity index determination, the allowable production of a species in the existing plant community cannot exceed the production of the spe-cies in the historic climax plant community. If plant groups are used, the present reconstructed production of a group cannot exceed the production of the group in the historic climax plant community. All allowable production is then added together. This total weight represents the amount of the historic climax plant community present on the site.
The relative similarity index to the historic climax plant community is calculated by dividing this total weight of allowable production by the total annual production in historic climax shown in the site de-scription for the normal year. This evaluation express-es the percentage of the historic climax plant commu-nity present on the site.
National Range and Pasture HandbookInventorying and Monitoring Grazing Land Resources
Chapter 4
4–18 (190–VI–NRPH, October 2006)
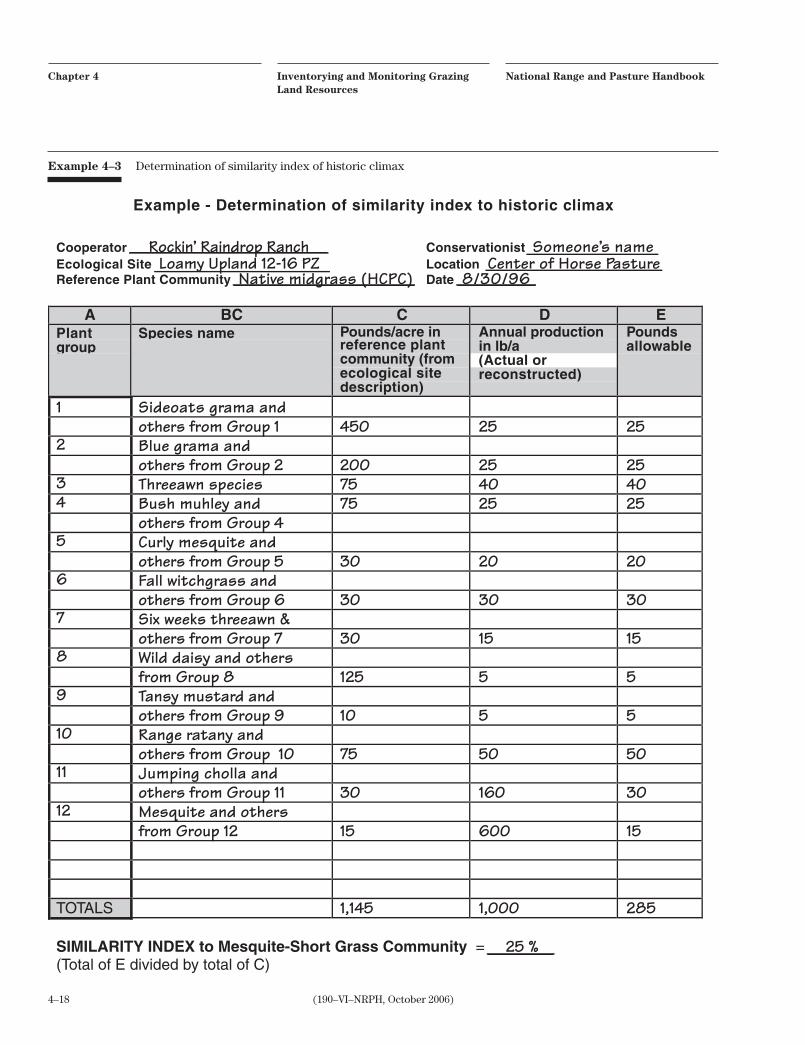
Example 4–3 Determination of similarity index of historic climax
Example - Determination of similarity index to historic climax
Cooperator Conservationist Ecological Site Location Reference Plant Community Date
A BC C D EPlantgroup
Species name Pounds/acre inreference plantcommunity (fromecological sitedescription)
Annual productionin lb/a(Actual orreconstructed)
Poundsallowable
TOTALS
SIMILARITY INDEX to Mesquite-Short Grass Community = (Total of E divided by total of C)
Rockin’ Raindrop Ranch Someone’s nameLoamy Upland 12-16 PZ Center of Horse Pasture
Native midgrass (HCPC) 8/30/96
1
2
34
5
6
7
8
9
10
11
12
450
2007575
30
30
30
125
10
75
30
15
1,145
25
254025
20
30
15
5
5
50
160
600
1,000
25
254025
20
30
15
5
5
50
30
15
285
25 %
Sideoats grama andothers from Group 1Blue grama andothers from Group 2Threeawn speciesBush muhley andothers from Group 4Curly mesquite andothers from Group 5Fall witchgrass andothers from Group 6Six weeks threeawn &others from Group 7Wild daisy and othersfrom Group 8Tansy mustard andothers from Group 9Range ratany andothers from Group 10Jumping cholla andothers from Group 11Mesquite and othersfrom Group 12

4–19(190–VI–NRPH, October 2006)
National Range and Pasture HandbookInventorying and Monitoring Grazing Land Resources
Chapter 4
Example 4–3 illustrates how the similarity index to his-toric climax is determined on a loamy upland 12–16 PZ ecological site. (Refer to chapter 3, exhibit 3–3 for the site description.) Note: This example shows only one plant from each group of plants described in the eco-logical site description. This is for illustrative purposes to show the calculation of the similarity index. In ac-tual practice, it is desirable to list each plant found in the sample transect. This example assumes the current plant community has been reconstructed to actual an-nual production. (See exhibit 4–7 for this procedure.) Some areas of the United States have plant communi-ties where, because of landscape position and climatic factors, vegetative composition is greatly influenced by episodic events. For example, in desert areas of the Southwest, many watersheds are composed of very shallow soils or very little soil and considerable ex-posed bedrock. Intense summer thunderstorm events create high volume catastrophic runoff that flows in confined drainage ways through low-lying landscapes. Although these rainfall events may occur relatively infrequently, these high intensity, concentrated flows can and do totally remove all vegetation occurring within drainage ways and cause severe disruption of the normal plant community dynamics. In these situ-ations, ratings of similarity index to historic climax generally are not appropriate. Secondary succession is constantly in progress with a stable plant community seldom being obtained because of the episodic nature of catastrophic events.
Similarity index to historic climax is not appropriate on sites that have been planted to single species forage plants.
(3) Determining similarity index to other veg-etation states or desired plant community
In the inventory phase, determining the similarity index to one or more of the possible vegetation states in the site description may be desirable. After the landowner has identified goals, a particular vegetation state may be identified as the desired plant community.
Once a desired plant community has been identified, it is appropriate to determine the similarity index to the desired plant community during follow-up monitoring.
To determine the present plant community’s similarity index to a specific plant community, the specific plant community must be adequately described as a com-mon vegetation state in the ecological site description.
It must be described by species and the expected pro-duction by weight of species or by groups of species, as well as the expected normal total annual produc-tion.
The similarity index to other vegetation states for ar-eas within an ecological site is determined by compar-ing the present plant community with that of the other vegetation state plant community, as indicated in the ecological site description.
The existing plant community must be inventoried by recording the actual weight, in pounds, of each spe-cies present. The production of each species must be reconstructed to reflect total annual production. The reconstructed annual production by species of the existing plant community is compared to the produc-tion of individual species in the specific vegetation state plant community. For the similarity index deter-mination, the allowable production of a species in the existing plant community cannot exceed the produc-tion of the species in the specific vegetation state plant community. If plant groups are used, the existing production of a group cannot exceed the production of the group in the specific vegetation state plant commu-nity. All allowable production is then added together. This total weight represents the amount of the specific vegetation state plant community present on the site.
The relative similarity index to the specific vegetation state plant community is calculated by dividing this total weight of allowable production by the total an-nual production in vegetation state shown in the site description for the type year (above average, average, below average). This evaluation expresses the percent-age of the vegetation state plant community present on the site.
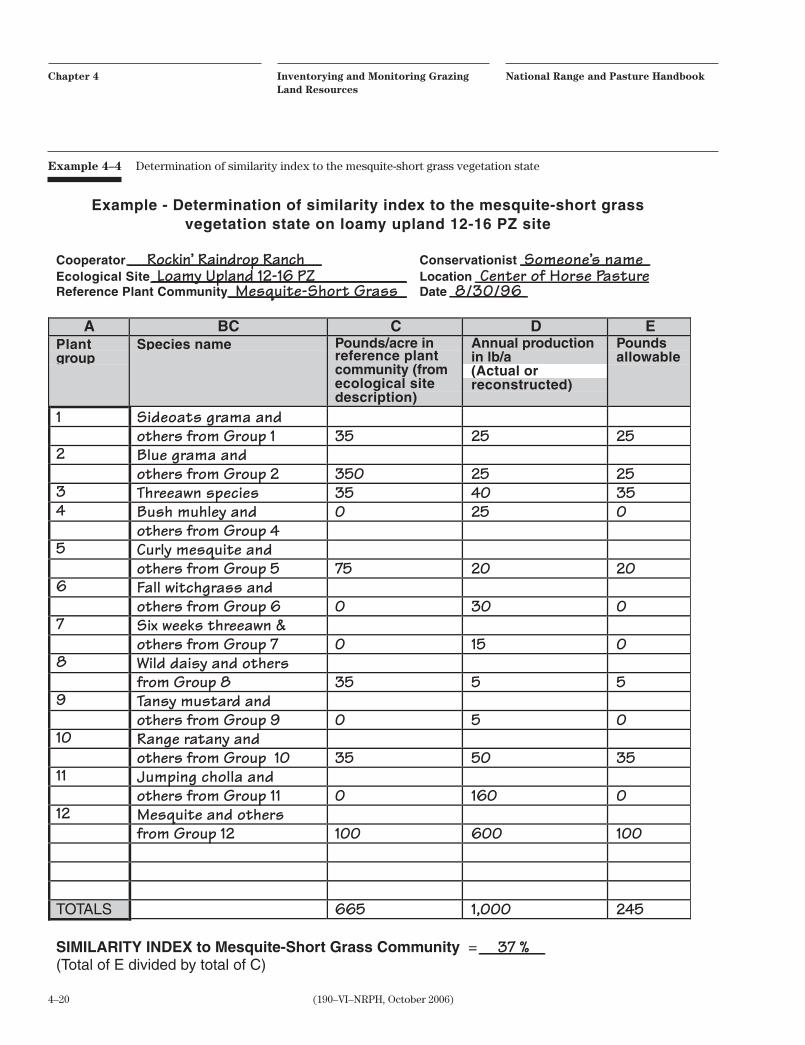
Examples 4–4, 4–5, and 4–6 show similarity index determinations to some of the other vegetation states described in the loamy upland 12 –16 PZ. These deter-minations use the same transect data used in example 4–3. (Refer to chapter 3, exhibit 3–3, for the site de-scription.) Note: This example shows only one plant from each group of plants described in the ecological site description. This is for illustrative purposes to show the calculation of the similarity index. In actual practice, it is desirable to list each plant found in the sample transect. This example assumes the current plant community has been reconstructed to actual an-nual production. (See exhibit 4–7 for this procedure.)
National Range and Pasture HandbookInventorying and Monitoring Grazing Land Resources
Chapter 4
4–20 (190–VI–NRPH, October 2006)
Example 4–4 Determination of similarity index to the mesquite-short grass vegetation state
Example - Determination of similarity index to the mesquite-short grassvegetation state on loamy upland 12-16 PZ site
Cooperator ConservationistEcological Site LocationReference Plant Community Date
A BC C D EPlantgroup
Species name Pounds/acre inreference plantcommunity (fromecological sitedescription)
Annual productionin lb/a(Actual orreconstructed)
Poundsallowable
TOTALS
SIMILARITY INDEX to Mesquite-Short Grass Community = (Total of E divided by total of C)
Rockin’ Raindrop Ranch Someone’s nameLoamy Upland 12-16 PZ Center of Horse Pasture
Mesquite-Short Grass 8/30/96
1
2
34
5
6
7
8
9
10
11
12
35
350350
75
0
0
35
0
35
0
100
665
25
254025
20
30
15
5
5
50
160
600
1,000
25
25350
20
0
0
5
0
35
0
100
245
37 %
Sideoats grama andothers from Group 1Blue grama andothers from Group 2Threeawn speciesBush muhley andothers from Group 4Curly mesquite andothers from Group 5Fall witchgrass andothers from Group 6Six weeks threeawn &others from Group 7Wild daisy and othersfrom Group 8Tansy mustard andothers from Group 9Range ratany andothers from Group 10Jumping cholla andothers from Group 11Mesquite and othersfrom Group 12

4–21(190–VI–NRPH, October 2006)
National Range and Pasture HandbookInventorying and Monitoring Grazing Land Resources
Chapter 4
Example 4–5 Determination of similarity index to native-short grass vegetation state
Example - Determination of similarity index to the native-short grassvegetation state on loamy upland 12-16 PZ site
Cooperator Rockin’ Raindrop Ranch Conservationist Someone’s nameEcological Site Loamy Upland 12-16 PZ Location Center of Horse PastureReference Plant Community Native-Short Grass Date 8/30/96
A BC C D EPlantgroup
Species name Pounds/acre inreference plantcommunity (fromecological sitedescription)
Annual productionin lb/a(Actual orreconstructed)
Poundsallowable
1 Sideoats grama andothers from Group 1 35 25 25
2 Blue grama andothers from Group 2 350 25 25
3 Threeawn species 35 40 354 Bush muhley and 0 25 0
others from Group 45 Curly mesquite and
others from Group 5 100 20 206 Fall witchgrass and
others from Group 6 0 30 07 Six weeks threeawn &
others from Group 7 0 15 08 Wild daisy and others
from Group 8 35 5 59 Tansy mustard and
others from Group 9 0 5 010 Range ratany and
others from Group 10 75 50 5011 Jumping cholla and
others from Group 11 trace 160 012 Mesquite and others
from Group 12 trace 600 0
TOTALS 630 1,000 160
SIMILARITY INDEX to Native-Short Grass Community = 25 %(Total of E divided by total of C)
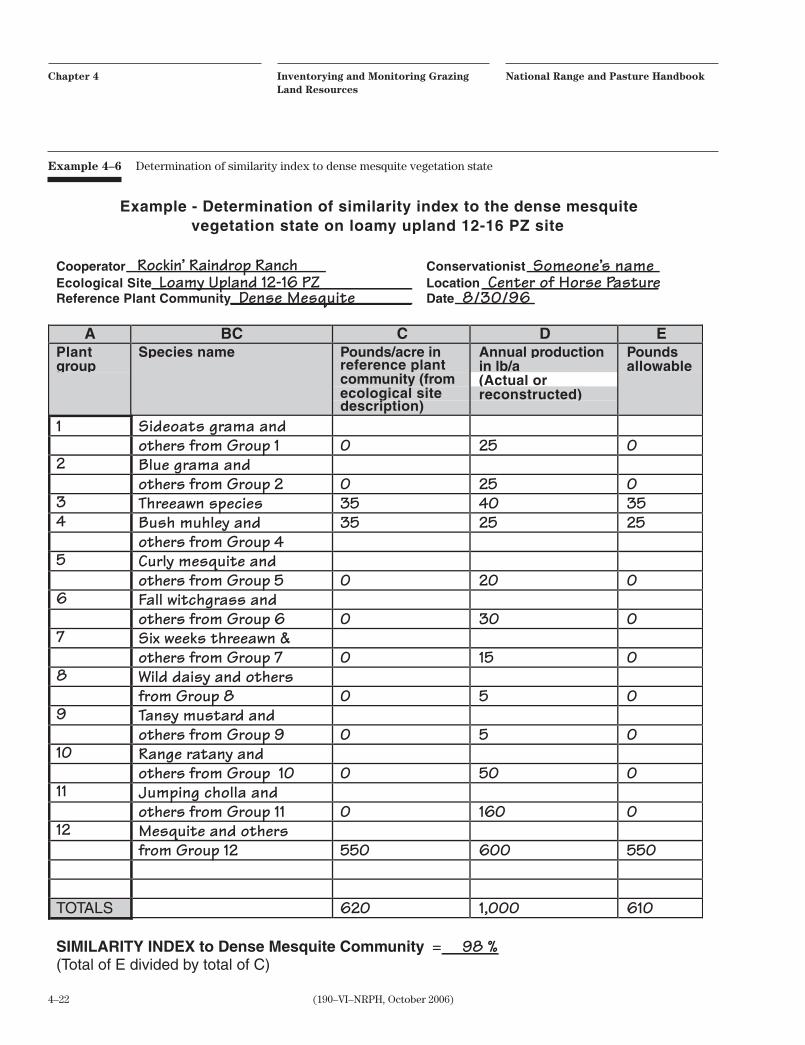
National Range and Pasture HandbookInventorying and Monitoring Grazing Land Resources
Chapter 4
4–22 (190–VI–NRPH, October 2006)
Example 4–6 Determination of similarity index to dense mesquite vegetation state
Example - Determination of similarity index to the dense mesquitevegetation state on loamy upland 12-16 PZ site
Cooperator Rockin’ Raindrop Ranch Conservationist Someone’s nameEcological Site Loamy Upland 12-16 PZ Location Center of Horse PastureReference Plant Community Dense Mesquite Date 8/30/96
A BC C D EPlantgroup
Species name Pounds/acre inreference plantcommunity (fromecological sitedescription)
Annual productionin lb/a(Actual orreconstructed)
Poundsallowable
1 Sideoats grama andothers from Group 1 0 25 0
2 Blue grama andothers from Group 2 0 25 0
3 Threeawn species 35 40 354 Bush muhley and 35 25 25
others from Group 45 Curly mesquite and
others from Group 5 0 20 06 Fall witchgrass and
others from Group 6 0 30 07 Six weeks threeawn &
others from Group 7 0 15 08 Wild daisy and others
from Group 8 0 5 09 Tansy mustard and
others from Group 9 0 5 010 Range ratany and
others from Group 10 0 50 011 Jumping cholla and
others from Group 11 0 160 012 Mesquite and others
from Group 12 550 600 550
TOTALS 620 1,000 610
SIMILARITY INDEX to Dense Mesquite Community = 98 % (Total of E divided by total of C)

4–23(190–VI–NRPH, October 2006)
National Range and Pasture HandbookInventorying and Monitoring Grazing Land Resources
Chapter 4
(4) Reconstructing the present plant commu-nity
The existing plant community at the time of evalua-tion must be reconstructed to the total normal annual air-dry production before it can be compared with the reference vegetation state plant community. The reconstruction must consider physical, physiological, and climatological factors that affect the amount of biomass measured (weighed or estimated) for a spe-cies at a specific point in time. The present plant com-munity is reconstructed by multiplying the measured weight of each species by a reconstruction factor. The reconstruction factor formula is :
Reconstruction factor = C
D( )E( )F( )where:C = percent of air-dry weightD = percent of plant biomass of each species that
has not been removedE = percent of growth of each species that has oc-
curred for the current growing seasonF = percent of growth of each species that has oc-
curred relative to normal growing conditions
Use the worksheet shown as exhibit 4–7 in the exhib-its section to determine this factor.
(5) Worksheet for use in determining similar-ity index
Exhibit 4–7 is an example of a similarity index work-sheet. Conservationists should determine similarity index of a site with the decisionmaker. If this is not possible, conservationists should review the similar-ity index inventory with the decisionmaker in enough detail to assure that it is fully understood. A worksheet for this purpose helps the decisionmaker to evaluate the plant communities and also serves as a record. Completed copies can be left with the decisionmaker or placed in his or her conservation plan folder. Com-pleted worksheets are of value in monitoring changes or evaluating the effectiveness of management prac-tices during subsequent evaluations of the same area.
(c) Rangeland health
Rangeland Health has been defined by an interagency committee as:
The degree to which the integrity of the soil, vegetation, water, and air, as well as the eco-logical processes of the rangeland ecosystem are balanced and sustained. They defined integrity to mean maintenance of the functional attri-butes characteristic of a locale, including nor-mal variability.
(1) PurposeRangeland health assessment is designed to:
• be used only by knowledgeable, experienced people
• provide a preliminary evaluation of soil/site stabil-ity, hydrologic function, and integrity of the biotic community (at the ecological site level)
• help landowners identify areas that are potentially at risk of degradation
• provide early warnings of potential problems and opportunities
• be used to communicate fundamental ecological concepts to a wide variety of audiences in the field
• improve communication among interested groups by focusing discussion on critical ecosystem prop-erties and processes
• select monitoring sites in the development of moni-toring programs
• help understand and communicate rangeland health issues
Rangeland health assessment is not to be used to:
• identify the cause(s) of resource problems
• make grazing and other management decisions
• monitor land or determine trend
• independently generate national or regional assess-ments of rangeland health
The rangeland health assessment procedure was developed for use by experienced, knowledgeable rangeland professionals. It is not intended that this assessment procedure be used by individuals that do not have experience or knowledge of the rangeland

National Range and Pasture HandbookInventorying and Monitoring Grazing Land Resources
Chapter 4
4–24 (190–VI–NRPH, October 2006)
ecological sites they are evaluating. This procedure requires a good understanding of ecological processes, vegetation, and soils for each of the sites to which it is applied. It relies on the use of a qualitative (nonmea-surement) procedure to assess the functional status of each indicator.
This current information incorporates concepts and materials from previous monitoring and inventory procedures, as well as from the National Research Council’s book on Rangeland Health, and the Soci-ety for Range Management's Task Group on Unity in Concepts and Terminology (1995). Earlier versions of this procedure were developed concurrently by an interagency technical team led by the Bureau of Land Management and the Natural Resources Conserva-tion Service as published in the National Range and Pasture Handbook (USDA 1997). An interagency team melded these concepts and protocols with the results from numerous field tests and numerous other com-ments to arrive at the process described herein. Along the way, this procedure has been termed rapid assess-ment, qualitative assessment of rangeland health, and visualization of rangeland health. The current version will be revised in the future as science and experience provides additional information on indicators of range-land health and their assessment.
Relationship to similarity index and trend—The similarity index and trend studies have long been used to assess the conditions of rangeland. The similarity index is an index of where the current plant communi-ty is in relation to the historic climax plant community, or to a desired plant community that is one of the site’s potential vegetation states. Trend is a determination of the direction of change in the current plant community and associated soils in relation to the historic climax plant community or some other desired plant commu-nity.
The rangeland health assessment is an attempt to look at how the ecological processes on a site are function-ing. These three assessment tools (similarity index, trend, and rangeland health assessment) evaluate the rangeland site from different perspectives and are not necessarily correlated.
(2) Evaluating rangeland health ecological at-tributes
Ecological processes include the water cycle (the capture, storage, and safe release of precipitation), en-
ergy flow (conversion of sunlight to plant then animal matter), and nutrient cycle (the cycle of nutrients, such as nitrogen and carbon through the physical and biotic components of the environment).
Ecological processes functioning within a normal range of variation will support specific plant and animal communities. Direct measures of site integ-rity and status of ecological processes are difficult or expensive to measure because of the complexity of the processes and their interrelationships. Therefore, bio-logical and physical attributes are often used as indica-tors of the functional status of ecological processes and site integrity.
The product of this qualitative assessment is not a single rating of rangeland health, but an assessment of three components, called attributes (table 4–1).
Definitions of the three interrelated attributes are:
Soil/Site Stability—The capacity of the site to limit redistribution and loss of soil resources (including nutrients and organic matter) by wind and water.
Hydrologic Function—The capacity of the site to capture, store, and safely release water from rainfall, run-on, and snowmelt (where relevant) to resist a reduction in this capacity and to recover this capacity when a reduction does occur.
Integrity of the Biotic Community—The capacity of the biotic community to support ecological process-es within the normal range of variability expected for the site, to resist a loss in the capacity to support these
Soil/SiteStability
HydrologicFunction
Integrity of theBiotic Community
Attribute ratings are based upon departure from ecological site description in these categories:
ExtremetoTotal
ModeratetoExtreme
ModerateSlighttoModerate
NonetoSlight
Table 4–1 The three attributes of rangeland health and the rating categories for each attribute

4–25(190–VI–NRPH, October 2006)
National Range and Pasture HandbookInventorying and Monitoring Grazing Land Resources
Chapter 4
processes, and to recover this capacity when losses do occur. The biotic community includes plants, animals, and microorganisms occurring both above and below the ground.
Based upon a preponderance of evidence approach for the applicable indicators, each of the three attributes of rangeland health are summarized at the end of the Rangeland Health Evaluation Sheet (exhibit 4–9). To reiterate, the process described here will produce three ratings, one for each attribute.
(3) IndicatorsUnfortunately, ecological processes are difficult to observe or measure in the field because most range-land ecosystems are complex. Indicators are compo-nents of a system whose characteristics (presence or absence, quantity, distribution) are used as an index of an attribute (rangeland health attribute) that is too difficult, inconvenient, or expensive to measure. Just as the Dow Jones Index is used to gauge the strength of the stock market, different combinations of the 17 indicators are used to gauge soil/site stability, hydro-logic function, and biotic integrity. For each indicator, five descriptors are developed which reflect the range of departure from what is expected for the site: None to Slight, Slight to Moderate, Moderate, Moderate to Extreme, and Extreme to Total.
Indicators have historically been used in rangeland resource inventories. These indicators focused on veg-etation (production, composition, density, and other such characteristics) or soil stability as indicators of rangeland condition or livestock carrying capac-ity. Such single indicator assessments are inadequate to determine rangeland health because they do not reflect nor assess the complexity of the ecological pro-cesses. There is no one indicator of ecosystem health; instead, a suite of key indicators should be used for an assessment.
Rangeland health evaluations provide information on the functioning of the ecological site. This evaluation provides information that is not available with other methods of evaluation. It gives an indication of the status of the three attributes chosen to represent the health of the area of interest (the area where the evalu-ation of the rangeland health attributes takes place). This interest may be due to concern about current condition, lack of information on condition, or public perceptions on the condition of the area of interest.
Evaluationarea—The rangeland health evalua-tion is site specific using the rangeland ecological site description as the standard for comparison. The evalu-ation area (area of interest) should be large enough to include the natural variability associated with each ecological site being assessed. Upon arrival at the lo-cation, the evaluator(s) should identify the boundaries of the area of interest and walk 1 to 2 acres of the eco-logical site. This enables the evaluator(s) to become familiar with the plant species, soil surface features, and the variability of the area of interest.
Surrounding features that may affect ecological processes within the area should also be noted. The topographic position, adjacent roads, trails, watering points, gullies, timber harvests, and other disturbances can all affect onsite processes. The topographic posi-tion should be carefully described with documentation of off-site influences. There is significant variability in the potential of different sites associated with relative-ly minor differences in landscape position and soils (differences in aspect or location at the top vs. bottom of a slope).
Developmentoftheecologicalsitereferencesheet—The reference sheet describes the status of each indicator for the reference state (exhibit 4 –8). It serves as the primary reference for the evaluation. The reference sheet describes a range for each indica-tor based on expected spatial and temporal variability within each ecological site. The reference sheet be-comes the standard for the evaluation of each of the indicators. The development of the reference sheet is an important process that must be accomplished prior to any rangeland health assessments. Reference sheet are being included in the ecological site description format and development. It is not possible to conduct a rangeland health assessment without a reference sheet. The development of the reference sheet requires at least as much expertise as the assessment process and is a five-step process:
Step 1. Assemble a diverse group of experts with extensive knowledge of the ecological site. Indi-viduals should include those who have long-term knowledge of the variability and dynamics of the site, in addition to rangeland professionals who understand soil-climate-vegetation relationships.
Step 2. Provide group with all available sources of information. Sources of information include relevant scientific literature and ecological site
National Range and Pasture HandbookInventorying and Monitoring Grazing Land Resources
Chapter 4
4–26 (190–VI–NRPH, October 2006)
descriptions. Data obtained in support of the de-velopment of site descriptions and monitoring and inventory data from the ecological site.
Step 3. Define functional and structural groups on the site. The discussion of the functional and structural groups on the site provides an opportu-nity to discuss the functioning of the site from an ecological process standpoint and gets all involved in the same mindset. Functional and structural groups are defined by such attributes (but not lim-ited to) as the photosynthetic pathways, lifeform, nitrogen fixation ability, rooting structure, above ground structure.
Step 4. Visit reference areas and other examples of the variability of the ecological site.
Step 5. Describe the status of each indicator in the reference state for the ecological site. This description should be quantitative where possible and include ranges based on the natural range of variability for the reference state of the ecological site.
Review/modifydescriptorsofindicatorsfortherangelandecologicalsite—Ideally, each ecologi-cal site will have a unique set of descriptors (narrative under the five categories) for each indicator. In lieu of this, a set of standard or generic descriptors (called default descriptors) has been developed for each indicator, and each descriptor is listed in the Range-land Health Evaluation Matrix (exhibit 4–10). These descriptors are used in the evaluation if they fit the observations on the indicators on the Rangeland Eco-logical Site Description. If the default descriptor does not fit an indicator, the evaluator(s) should modify the descriptor in the revised descriptor space that is below the default descriptor.
This Rangeland Health Evaluation Matrix with the revised descriptors should be used on subsequent evaluations on that same rangeland ecological site. Therefore, it is important to fill out the site documen-tation information at the top of this matrix if any of the descriptors are revised.
These modifications in the descriptors will aid in the ongoing development of rangeland ecological site specific indicators and descriptors. Copies of the Rangeland Health Evaluation Matrix with the modified descriptors should be forwarded to the person respon-
sible for maintaining rangeland ecological site descrip-tions in the state (usually the NRCS state rangeland management specialist) for approval Rangeland Health Evaluation Matrix will be developed for each range-land ecological site and any modification must be approved by the NRCS state rangeland management specialist or other designated individual.
Soil/site stability indicators are more likely to require these changes because of the inherently higher ero-sion potential on certain ecological sites. Example 4–7 shows changes in the descriptor narrative for the bare ground indicator.
Ratethe17indicators—The evaluator(s) selects the category descriptor (narrative) that most closely describes the site for each indicator on the Rangeland Health Evaluation Matrix and records it on the Range-land Health Evaluation Sheet. The rating for each indi-cator in the area of interest is based on that indicator’s degree of departure from the rangeland ecological site description.
Narrative descriptions in the Rangeland Health Evalu-ation Matrix are intended to aid in the determination of the degree of departure. The narrative descriptors for each indicator form a relative scale from Extreme to Total to None to Slight. Not all indicator descrip-tors will match what is observed requiring a “best fit” approach in making the ratings. The rating for each indicator should be supported by comments in the space provided under each indicator rating. In some instances there may be no evidence of the indicator in the area of interest, thus it will be rated None to Slight.
The revised descriptor for an indicator is used to rate indicators if the default description on the Rangeland Health Evaluation Matrix did not adequately represent the range and status of an indicator in the ecological site description.
When making an assessment, the effects of natural disturbances (drought, fire) should be considered. For example, if a fire occurred 5 years ago in the area be-ing assessed, reduced shrub (sagebrush) cover is not an indication of lack of biotic integrity if the natural processes alone are sufficient to allow recovery of the original plant community.

4–27(190–VI–NRPH, October 2006)
National Range and Pasture HandbookInventorying and Monitoring Grazing Land Resources
Chapter 4
Degree of departure from the reference state for the ecological site
IndicatorExtremetoTotal
ModeratetoExtreme
ModerateSlighttoModerate
NonetoSlight
4. (Revised descriptor)
4. Bare ground (default description)
Greater than 75% bare ground with entire area connected. Only occasional areas where ground cover is contiguous, mostly patchy and sparse
Much higher than expected for the site. Bare areas are large and generally connected
60–75% bare ground. Bare patches are large (>24-inch diameter) and connected. Surface disturbance areas becoming connected to one another. Connectivity of bare ground broken occasionally by continuous ground cover
Moderately higher than expected for the site. Bare areas are large and occasionally connected
40–60% bare ground with much connectivity especially associated with surface disturbance. Individual bare spaces are large and dominate the area
Moderately to slightly higherthan expected for the site. Bare areas are of moderate size and sporadically connected
30–45% bare ground; bare spaces greater than 12-inch diameter and rarely connected. Bare areas associated with surface dis- turbance are larger (>15 inch) and may be connected to other bare areas
Slightly higher than expected for the site. Bare areas are small and rarely connected
20–30% bare ground; bare patches should be less than 8 to 10-inches in diameter and not be connected; occasional 12 inches patches associated w/shrubs. Larger bare patches also associated with ant mounds and small mammal disturbances
Amount and size of bare areas matches that expected for the site
Example 4–7 Revised descriptor for the bare ground indicator

National Range and Pasture HandbookInventorying and Monitoring Grazing Land Resources
Chapter 4
4–28 (190–VI–NRPH, October 2006)
1. Rills—Rills are small, erosional rivulets that are generally linear and do not necessarily follow the microtopography as flow patterns do. They are formed through complex interactions between raindrops, overland flow, and the characteristics of the soil sur-face. The potential for rills increases as the degree of disturbance (loss of cover) and slope increases. Some soils have a greater potential for rill formation than
others do. Therefore, the degree of natural versus accelerated rill formation should be established by in-terpretations made from the soil survey, the rangeland ecological site description and the reference sheet for the area. Generally, concentrated flow erosional pro-cesses are accelerated when the distance between rills decreases and depth and width of rills increase.
Degree of departure from the reference state for the ecological site
IndicatorExtreme to Total
ModeratetoExtreme
ModerateSlighttoModerate
NonetoSlight
1. Rills Rill formation is severe and well defined throughout most of the area
Rill formation is moderately active and well defined throughout most of the area
Active rill formation is slight at infrequent intervals, mostly in exposed areas
No recent formation of rills; old rills have blunted or muted features
Current or past formation of rills as expected for the site
Degree of departure from the reference state for the ecological site
IndicatorExtremetoTotal
ModeratetoExtreme
ModerateSlighttoModerate
NonetoSlight
2. Water flowpatterns
Extensive and numerous; unstable with active erosion; usually connected
More numerous than expected; deposition and cut areas common; occasionally connected
Nearly matches what is expected for the site; erosion is minor with some instability and deposition
Matches what is expected for the site; some evidence of minor erosion. Flow patterns are stable and short
Matches what is expected for the site; minimal evidence of past or current soil deposition or erosion
2. Water flow patterns—Flow patterns are the path that water takes (accumulates) as it moves across the soil surface during overland flow. Overland flow oc-curs during rainstorms or snowmelt when a surface crust impedes water infiltration, or the infiltration capacity is exceeded. These patterns are generally evidenced by litter, soil or gravel redistribution, or pedestalling of vegetation or stones that break the flow of water. Interrill erosion caused by overland flow has been identified as the dominant sediment transport mechanism on rangelands. Water flow patterns are controlled in length and coverage by the number and
kinds of obstructions to water flow provided by basal intercepts of living or dead plants, biological crust, persistent litter, or rocks. They are rarely continuous, and appear and disappear as the slope and microto-pography of the slope changes. Shorter flow patterns facilitate infiltration by helping to pond water in de-pressional areas, thus increasing the time for water to soak into the soil. Generally, as slope increases and ground cover decreases, flow patterns increase. Soils with inherently low infiltration capacity may have a large number of natural flow patterns.

4–29(190–VI–NRPH, October 2006)
National Range and Pasture HandbookInventorying and Monitoring Grazing Land Resources
Chapter 4
3. Pedestals and/or terracettes—Pedestals and ter-racettes are important indicators of the movement of soil by water and by wind (pedestals only). Pedestals are rocks or plants that appear elevated because of soil loss by wind or water erosion.
Pedestals can also be caused by nonerosional pro-cesses, such as frost heaving or through soil or litter deposition on and around plants. Because of this, it is important to distinguish and not include this type of pedestalling as an indication of erosional processes.
Terracettes are benches of soil deposition behind obstacles caused by water movement (not wind). As
the degree of soil movement by water increases, ter-racettes become higher and more numerous and the area of soil deposition becomes larger. Terracettes caused by livestock or wildlife movements on hillsides are not considered erosional terracettes, thus they are not assessed in this protocol. However, these ter-racettes can increase erosion by concentrating water flow and/or reducing infiltration. These effects are recorded with the appropriate indicators (waterflow patterns, compaction layer, and soil surface loss and degradation).
Degree of departure from the reference state for the ecological site
IndicatorExtremetoTotal
ModeratetoExtreme
ModerateSlightto Moderate
NonetoSlight
3. Pedestals and/or terracettes (wind and water)
Abundant active- pedestalling and numerous terracettes. Many rocks and plants are pedestalled; exposed plant roots are common
Moderate active pedestalling; terracettes common. Some rocks and plants are pedestalled with occasional exposed roots
Slight active pedestalling; most pedestals are in flow paths and interspaces and/or on exposed slopes. Occasional terracettes present
Active pedestalling or terracette formation is rare; some evidence of past pedestal formation, especially in water flow patterns and on exposed slopes
Current or past evidence of pedestalled plants or rocks as expected for the site. Terracettes absent or uncommon

National Range and Pasture HandbookInventorying and Monitoring Grazing Land Resources
Chapter 4
4–30 (190–VI–NRPH, October 2006)
Degree of departure from the reference state for the ecological site
IndicatorExtremetoTotal
ModeratetoExtreme
ModerateSlighttoModerate
NonetoSlight
4. Bare ground
Much higher than expected for the site. Bare areas are large and generally connected
Moderate to much higher than expected for the site. Bare areas are large and occasionally connected
Moderately higher than expected for the site. Bare areas are of moderate size and sporadically connected
Slight to moderately higher than expected for the site. Bare areas are small and rarely connected
Amount and size of bare areas match that expected for the site
4. Bare ground—Bare ground is exposed mineral or organic soil that is available for raindrop splash ero-sion, the initial form of most water-related erosion. It is the remaining ground cover after accounting for ground surface covered by vegetation (basal and canopy (foliar)), litter, standing dead vegetation, grav-el/rock, and visible biological crust (lichen, mosses, algae). The amount and distribution of bare ground is one of the most important contributors to site stabil-ity relative to the site potential; therefore, it is a direct indication of site susceptibility to accelerated wind or water erosion. In general, a site with bare soil present in a few large patches is less stable than a site with
the same ground cover percentage in which the bare soil is distributed in many small patches, especially if these patches are unconnected. The determination of adequacy of ground cover is made by comparing the expected ground cover for a site as determined by the rangeland ecological site description. The amount of bare ground can vary seasonally depending on impacts on vegetation canopy cover (herbivore utilization) and litter amount (trampling loss), and annually relative to weather (drought, above average precipitation). Cur-rent and past climate must be considered in determin-ing the adequacy of current cover in protecting the site against the potential for accelerated erosion.

4–31(190–VI–NRPH, October 2006)
National Range and Pasture HandbookInventorying and Monitoring Grazing Land Resources
Chapter 4
5. Gullies —A gully is a channel that has been cut into the soil by moving water. Gullies generally follow the natural drainages and are caused by accelerated water flow and the resulting downcutting of soil. Gullies are a natural feature of some landscapes while on others management actions (excessive grazing, recreation vehicles, or road drainages) may cause gullies to form or expand. In gullies, water flow is concentrated but intermittent. Gullies can be caused by resource prob-lems offsite (document this on the Rangeland Health Evaluation Sheet), but still affect the site function on the evaluation area.
Degree of departure from the reference state for the ecological site
IndicatorExtremetoTotal
ModeratetoExtreme
ModerateSlighttoModerate
NonetoSlight
5. Gullies Common with indications of active erosion and downcutting; vegetation is infrequent on slopes and/or bed. Nickpoints and headcuts are numerous and active
Moderate to common with indications of active erosion; vegetation is intermittent on slopes and/or bed. Headcuts are active; downcutting is not apparent
Moderately in number with indications of active erosion; vegetation is intermittent on slopes and/or bed. Occasional headcuts may be present
Uncommon with vegetation stabilizing in bed and slopes; no signs of active headcuts, nickpoints, or bed erosion
Drainages are represented as natural stable channels, no signs of erosion with vegetation common
Gullies may be assessed by observing the numbers of gullies in an area and/or assessing the severity of erosion on individual gullies. Generally, signs of active erosion; that is, incised sides along a gully, are indica-tive of a current erosional problem while a healing gully is characterized by rounded banks, vegetation growing in the bottom and on the sides, and a reduc-tion in gully depth. Active headcuts may be a sign of accelerated erosion in a gully even if the rest of the gully is showing signs of healing.
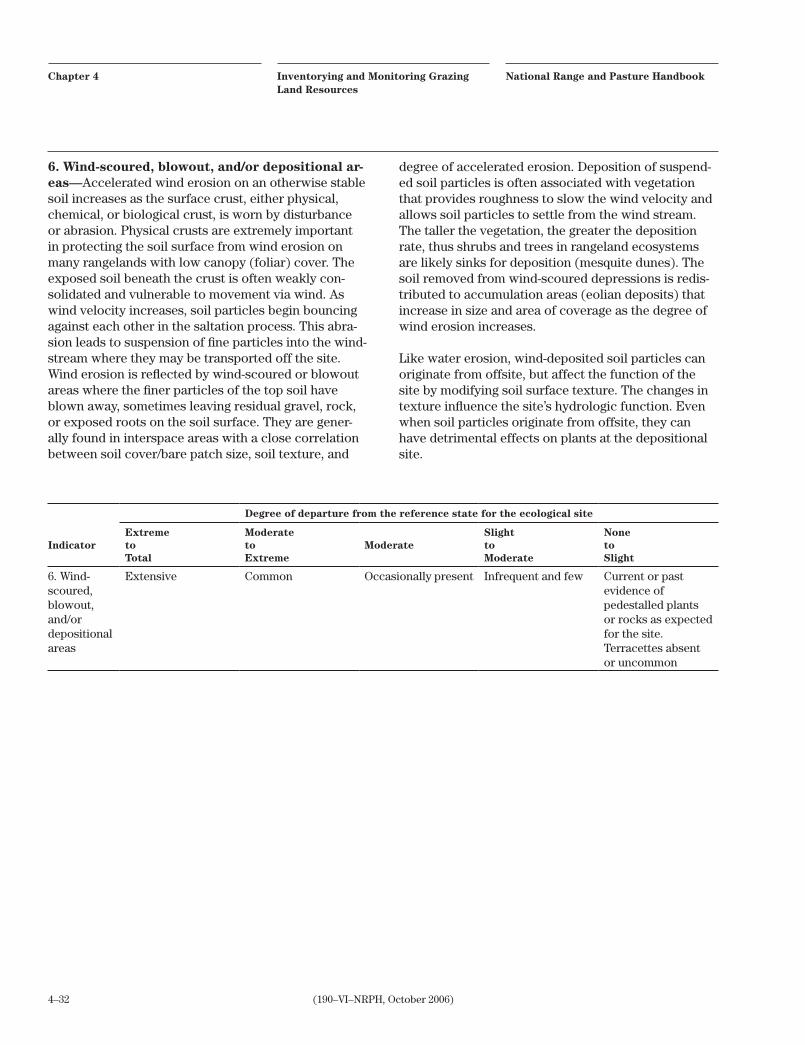
National Range and Pasture HandbookInventorying and Monitoring Grazing Land Resources
Chapter 4
4–32 (190–VI–NRPH, October 2006)
6. Wind-scoured, blowout, and/or depositional ar-eas—Accelerated wind erosion on an otherwise stable soil increases as the surface crust, either physical, chemical, or biological crust, is worn by disturbance or abrasion. Physical crusts are extremely important in protecting the soil surface from wind erosion on many rangelands with low canopy (foliar) cover. The exposed soil beneath the crust is often weakly con-solidated and vulnerable to movement via wind. As wind velocity increases, soil particles begin bouncing against each other in the saltation process. This abra-sion leads to suspension of fine particles into the wind-stream where they may be transported off the site. Wind erosion is reflected by wind-scoured or blowout areas where the finer particles of the top soil have blown away, sometimes leaving residual gravel, rock, or exposed roots on the soil surface. They are gener-ally found in interspace areas with a close correlation between soil cover/bare patch size, soil texture, and
degree of accelerated erosion. Deposition of suspend-ed soil particles is often associated with vegetation that provides roughness to slow the wind velocity and allows soil particles to settle from the wind stream. The taller the vegetation, the greater the deposition rate, thus shrubs and trees in rangeland ecosystems are likely sinks for deposition (mesquite dunes). The soil removed from wind-scoured depressions is redis-tributed to accumulation areas (eolian deposits) that increase in size and area of coverage as the degree of wind erosion increases.
Like water erosion, wind-deposited soil particles can originate from offsite, but affect the function of the site by modifying soil surface texture. The changes in texture influence the site’s hydrologic function. Even when soil particles originate from offsite, they can have detrimental effects on plants at the depositional site.
Degree of departure from the reference state for the ecological site
IndicatorExtremetoTotal
ModeratetoExtreme
ModerateSlighttoModerate
NonetoSlight
6. Wind-scoured, blowout, and/or depositional areas
Extensive Common Occasionally present Infrequent and few Current or past evidence of pedestalled plants or rocks as expected for the site. Terracettes absent or uncommon

4–33(190–VI–NRPH, October 2006)
National Range and Pasture HandbookInventorying and Monitoring Grazing Land Resources
Chapter 4
7. Litter movement—The degree and amount of lit-ter (dead plant material that is in contact with the soil surface) movement (redistribution) is an indicator of the degree of wind and/or water erosion. The redistri-bution of litter within a small area on a site is indica-tive of less erosion, whereas the movement of litter off-site by wind or water is indicative of more severe erosion. In a study in the Edwards Plateau in Texas, litter accumulation was shown to be the variable most closely correlated with interrill erosion. The same study showed that litter of bunchgrasses represented significant obstructions to runoff, thereby causing sediment transport capacity to be reduced and a por-tion of the sediment to be deposited.
The inherent capacity for litter movement on a soil is a function of its slope and geomorphic stability.
For example, alluvial fans and flood plains are active surfaces over which water and sediment are moved in response to major storm events. The amount of litter movement varies from large to small depending on the amount of bare space typical of the plant community and the intensity of the storm.
The size of litter moved by wind or water is also an indicator of degree of litter redistribution. In general, the greater distance that litter is moved from its point of origin and the larger the size and/or amount of litter moved, the more the site is being influenced by ero-sional processes.
Degree of departure from the reference state for the ecological site
IndicatorExtremetoTotal
ModeratetoExtreme
ModerateSlighttoModerate
NonetoSlight
7. Litter movement (wind or water)
Extreme; concentrated around obstructions. Most size classes of litter have been displaced
Moderate to extreme; loosely concentrated near obstructions. Moderate to small size classes of litter have been displaced
Moderate movement of smaller size classes in scattered concentrations around obstructions and in depressions
Slightly to moderately more than expected for the site with on small size classes of litter being displaced
Matches that expected for the size with a fairly uniform distribution of litter

National Range and Pasture HandbookInventorying and Monitoring Grazing Land Resources
Chapter 4
4–34 (190–VI–NRPH, October 2006)
8. Soil surface resistance to erosion—This indica-tor assesses the resistance of the surface of the soil to erosion. The stability of the soil surface is key to this indicator. The soil surface may be stabilized by soil organic matter that has been fully incorporated into aggregates at the soil surface, adhesion of decompos-ing organic matter to the soil surface, and biological crusts. The presence of one or more of these factors is a good indicator of soil surface resistance to erosion. Where soil surface resistance is high, soil erosion may be minimal even under rainfall intensities of over 5 inches per hour generating high runoff rates on plots from which all cover has been removed. Conversely, the presence of highly erodible materials at the soil surface can dramatically increase soil erosion by water even when there is high vegetative cover and by wind when vegetative cover is removed.
Another good indicator is the resistance of soil surface fragments to breakdown when placed in water. For a simple test, remove several small (1/4-in diameter by 1/8-in deep) fragments from the soil surface and place them in a bottle cap filled with water. Fragments with low stability appear to lose their structure or melt within 30 seconds. Fragments with extremely low stability melt immediately upon contact with the water and the water becomes cloudy as the soil particles disperse. Fragments with moderate stability appear to retain their integrity until the water in the bottle cap is agitated or gently swirled. Highly stable aggregates retain their shape, even when agitated indefinitely. This indicator is most highly correlated with water erosion. Susceptibility to wind erosion also declines with increases in soil organic matter.
Biological crusts consist of microorganisms (lichens, algae, cyanobacteria, microfungi) and nonvascular plants (mosses, lichens) that grow on or just below the soil surface. Soil physical and chemical charac-teristics, along with seasonal precipitation patterns, largely determine the dominant organisms comprising the crust. Biological crusts are primarily important as cover and in stabilizing the soil surface. In some areas, depending on soil characteristics, they may increase or reduce the infiltration of water through the soil surface or enhance the retention of soil water (acting as living mulch). In general, the relative importance of biologi-cal crusts increases as annual precipitation and poten-tial vascular plant cover decreases.
Physical crusts are thin surface layers induced by the impact of raindrops on bare soil causing the soil surface to seal and absorb less water. Physical and chemical crusts tend to have very low organic matter content or have only relatively inert organic matter that is associated with relatively little biological activ-ity. As this physical crust becomes more extensive, infiltration rates are reduced and overland water flow increases. Also, water can pond in flat crusted areas and is more likely to evaporate than infiltrate into the soil. Physical soil crusts are identified by lifting the soil surface with a pen or other sharp object and looking for cohesive layers at the soil surface which are not perforated by pores or fissures and in which there is no apparent binding by strands of organic material, such as cyanobacteria. Physical crusts are more com-mon on silty, clayey, and loamy soils and relatively thin if at all present in sandy soils.
Chemical crusts rarely form in rangelands except on soils formed from particular parent materials; that is, salt desert shrub communities and in abandoned irri-gated agricultural fields. Where they do occur, they can reduce infiltration and increase overland water flow similar to physical crusts. They are usually identified by a white color on the soil surface. Physical crusts also include vesicular crusts that have numerous small air pockets or spaces similar to a sponge, but resistant to infiltration.
Special cases: erosion pavement and open water. This indicator is not applicable to areas in which no soil is present at the surface because of the presence of an extensive erosion pavement (nearly 100% surface cover by stones) or where there is continuous open water (marshes in the Southeast). In this case the rat-ing should be None to Slight.

4–35(190–VI–NRPH, October 2006)
National Range and Pasture HandbookInventorying and Monitoring Grazing Land Resources
Chapter 4
Degree of departure from the reference state for the ecological site
IndicatorExtremetoTotal
ModeratetoExtreme
ModerateSlighttoModerate
NonetoSlight
8. Soil surface resistanceto erosion*
Resistance of soil surface to erosion extremely reduced throughout the site. Biological stabilization agents including organic matter and biological crusts virtually absent
Resistance of soil surface to erosion significantly reduced in most plant canopy interspaces and moderately reduced beneath plant canopies. Stabilizing agents present only in isolated patches
Resistance of soil surface to erosion significantly reduced in at least half of the plant canopy interspaces, or moderately reduced throughout the site
Some reduction in soil surface stability in plant interspaces or slight reduction throughout the site. Stabilizing agents reduced below expected
Resistance of soil surface to erosion matches that expected for the site. Surface soil is stabilized by organic matter decomposition products or a biological crust
* Stability can also be assessed by placing a small (0.24 in) soil surface fragment in water. Relatively stable fragments maintain their shape, and the water remains clear, while unstable soils appear to melt. Very stable fragments maintain their shape even after being agitated. Extremely unstable fragments disperse immediately upon insertion into the water, making it cloudy.
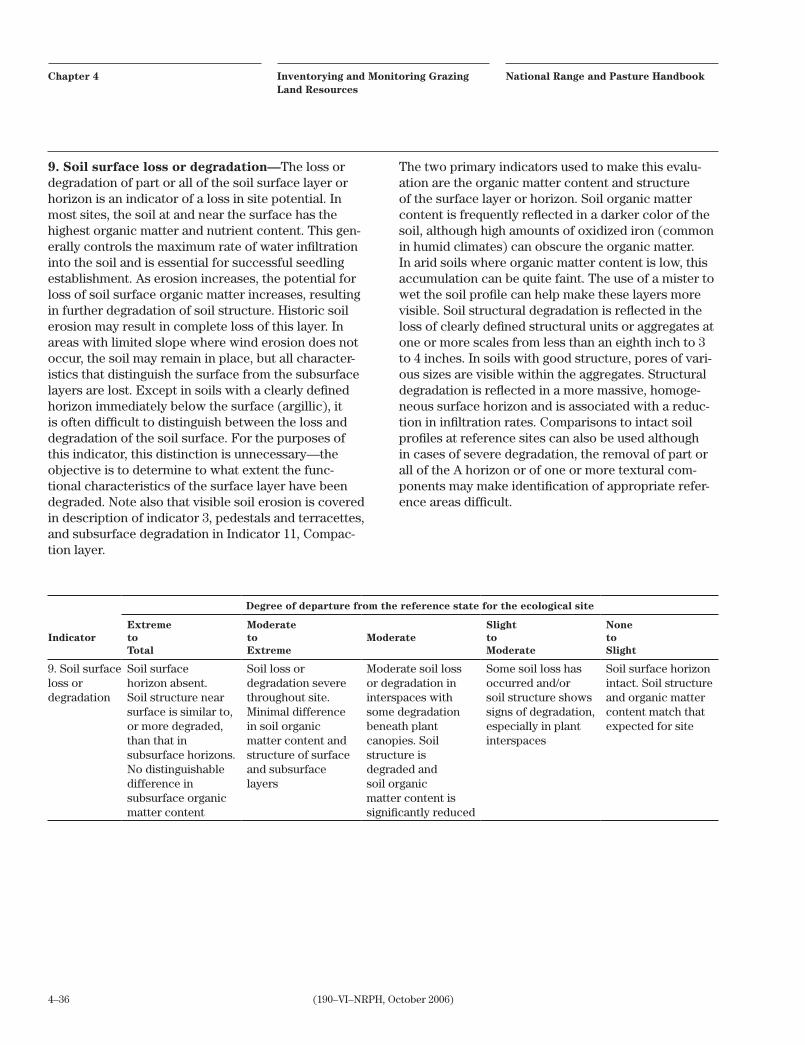
National Range and Pasture HandbookInventorying and Monitoring Grazing Land Resources
Chapter 4
4–36 (190–VI–NRPH, October 2006)
9. Soil surface loss or degradation—The loss or degradation of part or all of the soil surface layer or horizon is an indicator of a loss in site potential. In most sites, the soil at and near the surface has the highest organic matter and nutrient content. This gen-erally controls the maximum rate of water infiltration into the soil and is essential for successful seedling establishment. As erosion increases, the potential for loss of soil surface organic matter increases, resulting in further degradation of soil structure. Historic soil erosion may result in complete loss of this layer. In areas with limited slope where wind erosion does not occur, the soil may remain in place, but all character-istics that distinguish the surface from the subsurface layers are lost. Except in soils with a clearly defined horizon immediately below the surface (argillic), it is often difficult to distinguish between the loss and degradation of the soil surface. For the purposes of this indicator, this distinction is unnecessary—the objective is to determine to what extent the func-tional characteristics of the surface layer have been degraded. Note also that visible soil erosion is covered in description of indicator 3, pedestals and terracettes, and subsurface degradation in Indicator 11, Compac-tion layer.
The two primary indicators used to make this evalu-ation are the organic matter content and structure of the surface layer or horizon. Soil organic matter content is frequently reflected in a darker color of the soil, although high amounts of oxidized iron (common in humid climates) can obscure the organic matter. In arid soils where organic matter content is low, this accumulation can be quite faint. The use of a mister to wet the soil profile can help make these layers more visible. Soil structural degradation is reflected in the loss of clearly defined structural units or aggregates at one or more scales from less than an eighth inch to 3 to 4 inches. In soils with good structure, pores of vari-ous sizes are visible within the aggregates. Structural degradation is reflected in a more massive, homoge-neous surface horizon and is associated with a reduc-tion in infiltration rates. Comparisons to intact soil profiles at reference sites can also be used although in cases of severe degradation, the removal of part or all of the A horizon or of one or more textural com-ponents may make identification of appropriate refer-ence areas difficult.
Degree of departure from the reference state for the ecological site
IndicatorExtremetoTotal
ModeratetoExtreme
ModerateSlighttoModerate
NonetoSlight
9. Soil surface loss or degradation
Soil surface horizon absent. Soil structure near surface is similar to, or more degraded, than that in subsurface horizons. No distinguishable difference in subsurface organic matter content
Soil loss or degradation severe throughout site. Minimal difference in soil organic matter content and structure of surface and subsurface layers
Moderate soil loss or degradation in interspaces with some degradation beneath plant canopies. Soil structure is degraded and soil organic matter content is significantly reduced
Some soil loss has occurred and/or soil structure shows signs of degradation, especially in plant interspaces
Soil surface horizon intact. Soil structure and organic matter content match that expected for site

4–37(190–VI–NRPH, October 2006)
National Range and Pasture HandbookInventorying and Monitoring Grazing Land Resources
Chapter 4
Degree of departure from the reference state for the ecological site
IndicatorExtremetoTotal
ModeratetoExtreme
ModerateSlighttoModerate
NonetoSlight
10. Plant community composition and distribution relative to infiltration and runoff
Infiltration is severely decreased due to adverse changes in plant community composition and/or distribution. Adverse plant cover changes have occurred
Infiltration is greatly decreased due to adverse changes in plant community composition and/or distribution. Detrimental plant cover changes have occurred
Infiltration is moderately reduced due to adverse changes in plant community composition and/or distribution. Plant cover changes negatively affect infiltration
Infiltration is slightly to moderately affected by minor changes in plant community composition and/or distribution. Plant cover changes have only a minor effect on infiltration
Infiltration and runoff are equal to that expected for the site. Plant cover (distribution and amount) adequate for site protection
10. Plant community composition and distribu-tion relative to infiltration and runoff—Vegetation growth form is an important determinant of infiltration rate and interrill erosion.
Vegetation is the primary factor influencing the spa-tial and temporal variability of surface soil processes controlling infiltration and interrill erosion rates on semiarid rangelands. The distribution of the amount and type of vegetation is an important factor control-ling spatial and temporal variations in infiltration and interrill erosion rates on rangelands in Nevada, Idaho, and Texas.
Changes in plant community composition and the distribution of species can influence (positive or nega-tive) the ability of a site to capture and store precipi-tation. Plant rooting patterns, litter production and
associated decomposition processes, basal area, and spatial distribution can all affect infiltration, runoff, or both. In the Edwards Plateau in Texas, shifts in plant composition between bunchgrass and short grasses over time have the greatest potential to influence infil-tration and soil erosion. An example of a composition change that reduces infiltration and increases water runoff is the conversion of desert grasslands to shrub dominated communities. However, infiltration and runoff are also affected when sagebrush steppe range-land is converted to a monoculture of annual grasses. These annual grasses provide excellent watershed protection although they adversely affect the ecologi-cal processes in many other ways.
Care must be exercised in interpreting this indicator in different ecosystems, as the same species may have different effects.

National Range and Pasture HandbookInventorying and Monitoring Grazing Land Resources
Chapter 4
4–38 (190–VI–NRPH, October 2006)
Degree of departure from the reference state for the ecological site
IndicatorExtremetoTotal
ModeratetoExtreme
ModerateSlighttoModerate
NonetoSlight
11. Compac- tion layer (below soil surface
Extensive; severely restricts water movement and root penetration
Widespread; greatly restricts water movement and root penetration
Moderately widespread, moderately restricts water movement and root penetration
Rarely present or is thin and weakly restrictive to water movement and root penetration
None to minimal, not restrictive to water movement and root penetration
11. Compaction layer—A compaction layer is a near surface layer of dense soil caused by the repeated impact on or disturbance of the soil surface. Compac-tion becomes a problem when it begins to limit plant growth, water infiltration, or nutrient cycling process-es. Farm machinery, herbivore trampling, recreational and military vehicles, foot traffic, or any other activity that repeatedly causes an impact on the soil surface can cause a compaction layer. Moist soil is more easily compacted than dry or saturated soil. Recovery pro-cesses, such as earthworm activity and frost heaving, are generally sufficient to limit compaction by live-stock in many upland systems.
A compaction layer is a structural change, not a tex-tural change as described in a soil survey. Compacted layers in rangelands are generally less than 6 inches
below the soil surface. They are detected by digging a small hole (generally less than 1 foot deep) with the determination of a compaction layer (a soil structure change) done by a person with soils experience. These layers may be detected in some soils with the use of a penetrometer or by simply probing the soil with a sharp rod or shovel and “feeling” for the compaction layer. However, any potential compaction layer should be confirmed using multiple indicators, including direct observation of physical features. Those physical features include such things as platy or blocky, dense soil structure over less dense soil layers and horizon-tal root growth, and increased density (measured by weighing a known volume of oven-dry soil). Increased resistance to a probe can be simply due to lower soil moisture or higher clay content.

4–39(190–VI–NRPH, October 2006)
National Range and Pasture HandbookInventorying and Monitoring Grazing Land Resources
Chapter 4
12. Functional/structural groups—Functional/structural groups are a suite of species that are grouped together, on an ecological site basis, because of similar shoot (height and volume) or root (fiberous versus tap) structure, photosynthetic pathways, nitro-gen fixing ability, or life cycle. Functional composi-tion and functional diversity are the principal factors explaining plant productivity, plant percent nitrogen, plant total nitrogen, and light penetration. The study by Tilman, et al. (1997) showed that functional compo-sition has a large impact on ecosystem processes. This and related studies have demonstrated that factors that change ecosystem composition, such as invasion by novel organisms, nitrogen deposition, disturbance frequency, fragmentation, predator decimation, spe-cies removal, and alternative management practices, can have a strong affect on ecosystem processes.
Relative dominance is based upon the relative annual production, or biomass that each functional group collectively contributes to the total. The recommended protocol to use for grouping species is composition by annual production. If the evaluator(s) doesn’t have experience in estimating composition by annual pro-duction, then composition by cover may be used if appropriate reference data are available. The potential for Functional/Structural groups is derived by placing
species into the appropriate groups from information found in the Reference Sheet. The list and ranking of functional/structural groups should reflect all of the plant (including biological crust) communities in the reference state, under the natural disturbance regime, and in the context of normal climax variability. The comparison should be to communities in the reference state (in the state and transition model for the ecologi-cal site).
The number of species in each functional group is also considered when selecting the appropriate rating category on the Rangeland Health Evaluation Sheet. If the number of species in many of the functional/struc-tural plant groups has been greatly reduced, this may indicate loss of biotic integrity. Both the presence of functional groups and the number of species within the groups significantly affect on ecosystem processes. Example 4–8 shows functional/structural groups for a prairie ecological site, and example 4–9 shows them from a Great Basin desert site. Nonvascular plants (bi-ological crusts) are included in example 4–9 because they are an important component of this Great Basin ecological site. Biological crusts are components of many ecosystems and should be included in this evalu-ation when appropriate.
Degree of departure from the reference state for the ecological site
IndicatorExtremetoTotal
ModeratetoExtreme
ModerateSlighttoModerate
NonetoSlight
12. Functional/structuralgroups (F/S groups)
Number of F/S groups greatly reduced and/orRelative dominance of F/S groups has been dramatically altered and/orNumber of species within F/S groups significantly reduced
Number of F/S groups reduced and/orOne dominant group and/orOne or more subdominant group replaced by F/S groups not expected for the site and/orNumber of species within F/S groups significantly reduced
Number of F/S groups moderately reduced and/orOne or more subdominant F/S groups replaced by F/S groups not expected for the site and/orNumber of species with F/S groups moderately reduced
Number of F/S groups slightly reduced and/orRelative dominance of F/S groups has been modified from that expected for the site and/orNumber of species within F/S slightly reduced
F/S groups and number of species in each group closely match that expected for the site

National Range and Pasture HandbookInventorying and Monitoring Grazing Land Resources
Chapter 4
4–40 (190–VI–NRPH, October 2006)
Example 4–8 Functional/structural groups for a prairie ecological site
Warm-seasontall grasses
Warm-seasonmidgrasses
Cool-seasonmidgrasses
Warm-seasonshortgrass
Perennialforbs
Leguminousshrubs
Big bluestem Sideoats grama Westernwheatgrass
Buffalograss Dottedgayfeather
Leadplant
Indiangrass Little bluestem Greenneedlegrass
Blue grama Prairieconeflower
Example 4–9 Functional/structural groups from a Great Basin desert site
Tall shrubs(deep rooted)
Half shrubWarm-seasonbunchgrass
Cool-seasonshort bunch-grass
Cool-seasonmid bunch-grass
Perennial forbs,N fixers
Perennial forbs,not N fixers
Biologicalcrust
Wyoming big sagebrush
Broom snakeweed
Sand drop-seed
Sandbergbluegrass
Squirreltail Astragalus Phlox Moss
Bitterbrush Red three-awn
Thurbersneedlegrass
Lupine Arrowleafbalsamroot
Lichens
Indian Ricegrass
Biscuitroot

4–41(190–VI–NRPH, October 2006)
National Range and Pasture HandbookInventorying and Monitoring Grazing Land Resources
Chapter 4
13. Plant mortality/decadence—The proportion of dead or decadent (moribund, dying) to young or ma-ture plants in the community relative to that expected for the site, under normal disturbance regimes, is an indicator of the population dynamics of the stand. If recruitment is not occurring and existing plants are either dying or dead, the integrity of the stand would be expected to decline and other undesirable plants (weeds or invasives) may increase. A healthy range
has a mixture of many age classes of plants relative to site potential and climatic conditions.
Only plants native to the site (or seeded plants if in a seeding) are assessed for plant mortality. Plant mortal-ity may vary considerably on the landscape depending on disturbance events (fire, drought, insect infestation, and disease).
Degree of departure from the reference state for the ecological site
IndicatorExtremetoTotal
ModeratetoExtreme
ModerateSlighttoModerate
NonetoSlight
13. Plant mortality/decadence
Dead and/or decadent plants are common
Dead plants and/or decadent plants are somewhat common
Some dead and/or decadent plants are present
Slight plant mortality and/or decadence
Plant mortality and decadence match those expected for the site
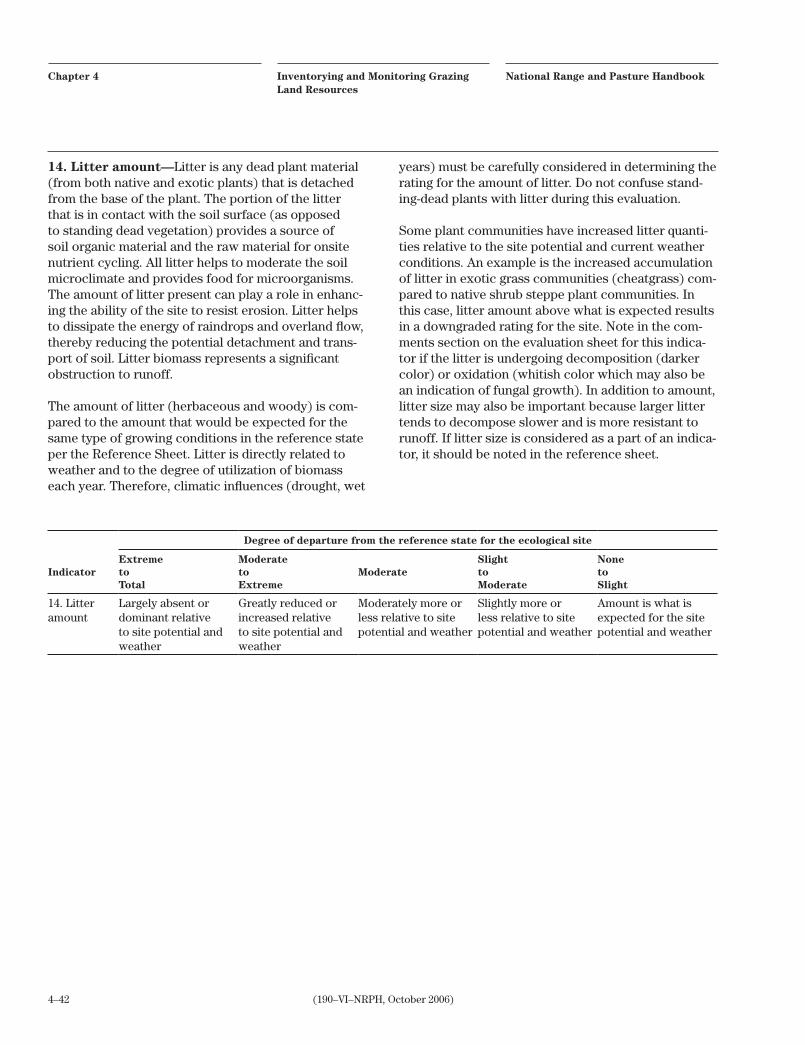
National Range and Pasture HandbookInventorying and Monitoring Grazing Land Resources
Chapter 4
4–42 (190–VI–NRPH, October 2006)
Degree of departure from the reference state for the ecological site
IndicatorExtremetoTotal
ModeratetoExtreme
ModerateSlighttoModerate
NonetoSlight
14. Litter amount
Largely absent or dominant relative to site potential and weather
Greatly reduced or increased relative to site potential and weather
Moderately more or less relative to site potential and weather
Slightly more or less relative to site potential and weather
Amount is what is expected for the site potential and weather
14. Litter amount—Litter is any dead plant material (from both native and exotic plants) that is detached from the base of the plant. The portion of the litter that is in contact with the soil surface (as opposed to standing dead vegetation) provides a source of soil organic material and the raw material for onsite nutrient cycling. All litter helps to moderate the soil microclimate and provides food for microorganisms. The amount of litter present can play a role in enhanc-ing the ability of the site to resist erosion. Litter helps to dissipate the energy of raindrops and overland flow, thereby reducing the potential detachment and trans-port of soil. Litter biomass represents a significant obstruction to runoff.
The amount of litter (herbaceous and woody) is com-pared to the amount that would be expected for the same type of growing conditions in the reference state per the Reference Sheet. Litter is directly related to weather and to the degree of utilization of biomass each year. Therefore, climatic influences (drought, wet
years) must be carefully considered in determining the rating for the amount of litter. Do not confuse stand-ing-dead plants with litter during this evaluation.
Some plant communities have increased litter quanti-ties relative to the site potential and current weather conditions. An example is the increased accumulation of litter in exotic grass communities (cheatgrass) com-pared to native shrub steppe plant communities. In this case, litter amount above what is expected results in a downgraded rating for the site. Note in the com-ments section on the evaluation sheet for this indica-tor if the litter is undergoing decomposition (darker color) or oxidation (whitish color which may also be an indication of fungal growth). In addition to amount, litter size may also be important because larger litter tends to decompose slower and is more resistant to runoff. If litter size is considered as a part of an indica-tor, it should be noted in the reference sheet.

4–43(190–VI–NRPH, October 2006)
National Range and Pasture HandbookInventorying and Monitoring Grazing Land Resources
Chapter 4
15. Annual production—Annual production, as used in this document, is the net quantity of aboveground vascular plant material produced within a year. It is an indicator of the energy captured by plants and its availability for secondary consumers in an ecosystem given current weather conditions. Production potential will change with communities or ecological sites, bio-logical diversity, and with latitude. Annual production of the evaluation area is compared to the site potential (total annual production) as described in the reference sheet.
Comparisons to the reference sheet are based on peak aboveground standing crop, no matter when the site is assessed. If utilization of vegetation has occurred or plants are in early stages of growth, the evaluator(s) is required to estimate the annual production removed or expected and include this amount when making the total site biomass estimate. Do not include stand-
ing dead vegetation or live tissue (woody stems) not produced in the current year as annual production.
All species (native, seeded, and weeds) alive (annual production only) are included in the determination of total aboveground site biomass. Therefore, the type of vegetation (native or introduced) is not the issue. For example, Rickard and Vaughan (1988) found that conversion of a sagebrush steppe plant community to an exotic annual grassland greatly affected vegetation structure and function, but not aboveground biomass production.
As with the other indicators, it is important to consider all other local and landscape level explanations for differences in production (runoff/run-on because of landscape position, weather, regional location, or dif-ferent soils within an ecological site) before attribut-ing production differences to differences in other site characteristics.
Degree of departure from the reference state for the ecological site
IndicatorExtremetoTotal
ModeratetoExtreme
ModerateSlighttoModerate
NonetoSlight
15. Annual production
Less than 20% of potential production
20–40% of potential production
40–60% of potential production
60–80% of potential production
Exceeds 80% of potential production

National Range and Pasture HandbookInventorying and Monitoring Grazing Land Resources
Chapter 4
4–44 (190–VI–NRPH, October 2006)
16. Invasive plants—Invasive plants are plants that are not part of (if exotic), or are a minor component of (if native), the original plant community or communi-ties that have the potential to become a dominant or co-dominant species on the site if their future estab-lishment and growth is not actively controlled by man-agement interventions. Species that become dominant for only one to several years (short-term response to drought or wildfire) are not invasive plants. This indi-cator deals with plants that are invasive to the evalua-tion area. These plants may or may not be noxious and may or may not be exotic.
Invasives can include noxious plants (plants listed by a state because of their unfavorable economic or ecological impacts), non-native plants, and native plants. Native invasive plants (pinyon pine or juniper into sagebrush steppe) must be assessed by comparing current status with potential status described in the Reference Sheet. Historical accounts and photographs also provide information on the historical distribution of invasive native plants.
Invasive plants may impact an ecosystem’s type and abundance of species, their interrelationship, and the processes which energy and nutrients move through the ecosystem. These impacts can influence both bio-logical organisms and physical properties of the site. The impacts may range from slight to catastrophic depending on the species involved and their degree of dominance. Invasive species may adversely affect a site by increased water usage (salt cedar (tamarish) in riparian areas) or rapid nutrient depletion (high nitro-gen use by cheatgrass).
Some invasive plants (knapweeds) are capable of in-vading undisturbed, climax bunchgrass communities, further emphasizing their use as an indicator of a new ecosystem stress. Even highly diverse, species rich plant communities are susceptible to exotic species invasion.
Degree of departure from the reference state for the ecological site
IndicatorExtremetoTotal
ModeratetoExtreme
ModerateSlighttoModerate
NonetoSlight
16. Invasive plants
Dominate the site Common through-out the site
Scattered through-out the site
Occasionally pres-ent on the site
Rarely present on the site
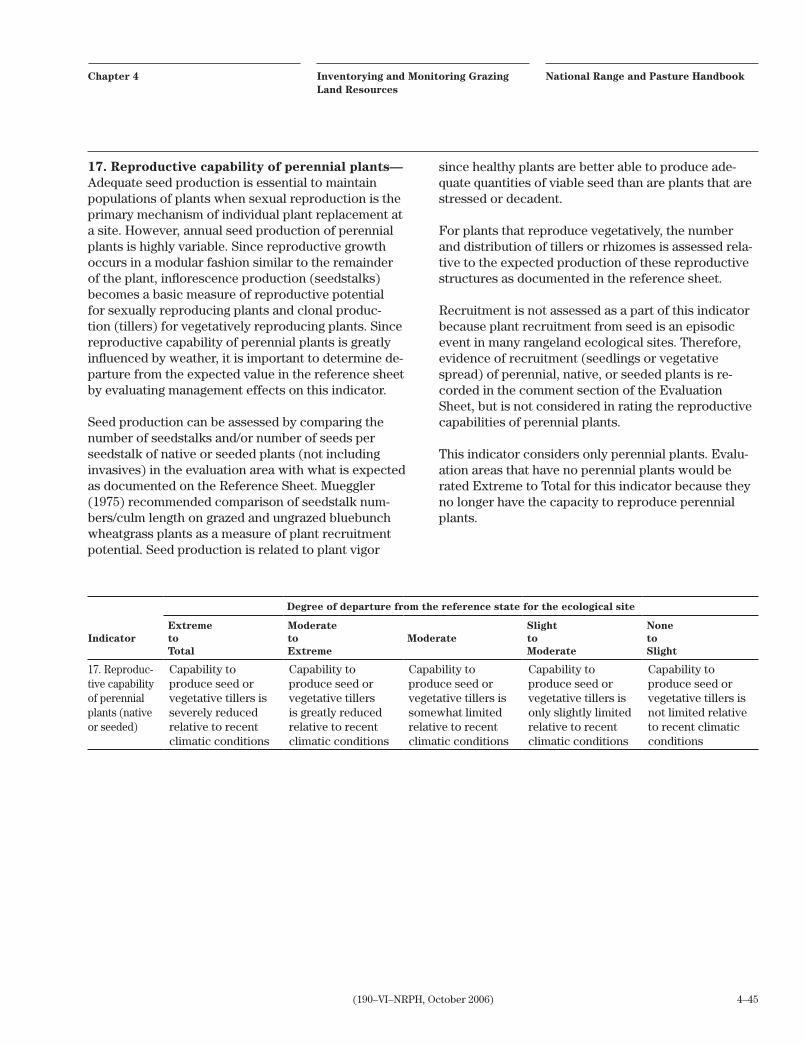
4–45(190–VI–NRPH, October 2006)
National Range and Pasture HandbookInventorying and Monitoring Grazing Land Resources
Chapter 4
17. Reproductive capability of perennial plants—Adequate seed production is essential to maintain populations of plants when sexual reproduction is the primary mechanism of individual plant replacement at a site. However, annual seed production of perennial plants is highly variable. Since reproductive growth occurs in a modular fashion similar to the remainder of the plant, inflorescence production (seedstalks) becomes a basic measure of reproductive potential for sexually reproducing plants and clonal produc-tion (tillers) for vegetatively reproducing plants. Since reproductive capability of perennial plants is greatly influenced by weather, it is important to determine de-parture from the expected value in the reference sheet by evaluating management effects on this indicator.
Seed production can be assessed by comparing the number of seedstalks and/or number of seeds per seedstalk of native or seeded plants (not including invasives) in the evaluation area with what is expected as documented on the Reference Sheet. Mueggler (1975) recommended comparison of seedstalk num-bers/culm length on grazed and ungrazed bluebunch wheatgrass plants as a measure of plant recruitment potential. Seed production is related to plant vigor
since healthy plants are better able to produce ade-quate quantities of viable seed than are plants that are stressed or decadent.
For plants that reproduce vegetatively, the number and distribution of tillers or rhizomes is assessed rela-tive to the expected production of these reproductive structures as documented in the reference sheet.
Recruitment is not assessed as a part of this indicator because plant recruitment from seed is an episodic event in many rangeland ecological sites. Therefore, evidence of recruitment (seedlings or vegetative spread) of perennial, native, or seeded plants is re-corded in the comment section of the Evaluation Sheet, but is not considered in rating the reproductive capabilities of perennial plants.
This indicator considers only perennial plants. Evalu-ation areas that have no perennial plants would be rated Extreme to Total for this indicator because they no longer have the capacity to reproduce perennial plants.
Degree of departure from the reference state for the ecological site
IndicatorExtremetoTotal
ModeratetoExtreme
ModerateSlighttoModerate
NonetoSlight
17. Reproduc-tive capability of perennialplants (native or seeded)
Capability to produce seed or vegetative tillers is severely reduced relative to recent climatic conditions
Capability to produce seed or vegetative tillers is greatly reduced relative to recent climatic conditions
Capability to produce seed or vegetative tillers is somewhat limited relative to recent climatic conditions
Capability to produce seed or vegetative tillers is only slightly limited relative to recent climatic conditions
Capability to produce seed or vegetative tillers is not limited relative to recent climatic conditions

National Range and Pasture HandbookInventorying and Monitoring Grazing Land Resources
Chapter 4
4–46 (190–VI–NRPH, October 2006)
18. Optional indicators—The 17 indicators described previously represent the baseline indicators that must be assessed on all sites. Other indicators and descrip-tors may be developed to meet local needs. The only restriction on the development of optional indicators and their use is that they must be ecologically, not management, related. They should also significantly increase the quality of the evaluation. For example, an indicator of suitability for livestock, wildlife, or special status species are not appropriate indicators to deter-mine the health of a land unit. They may be important in the allotment or ranch evaluation, but are not includ-ed in the determination of the status of soil/site stabil-ity, hydrologic function, or biotic integrity.
An example of optional indicators and descriptors for Biological Crusts and Vertical Vegetation follows:
Both are partially addressed by indicator 12 (function-al/structural groups); however, many users find that this indicator often becomes heavily focused on plant community composition. Both optional indicators are also partially reflected by indicator 4 (bare ground). Soil stabilized by visible biological crust (lichens, mosses, and algae) is not considered bare ground.
Because the bare ground indicator includes the special distribution of bare areas, it also provides some indica-tion of the horizontal vegetation distribution.
The biological crust indicator might be applied where these crust play particularly important biological or physical role (for nitrogen fixation or soil stabilization). The vegetation structure indicator is useful where variability in vertical vegetation structure within func-tional/structural groups affects wind erosion or the integrity of animal populations. This variability may be due to species differences within functional/structural groups, in the age class distribution, or to disturbances such as fire and grazing that affect growth form.
The indicators included in these sheets are not intend-ed to be all inclusive for all rangelands. Additional indi-cators may be added to the sheets to improve sensitiv-ity in detecting changes in soil/site stability, hydrologic function, and biotic integrity. As with the modification of the descriptor narratives, any additional indicators will be site specific and need approval from the state rangeland management specialist or another person responsible for maintaining the quality of the ecologi-cal site descriptions.
Degree of departure from the reference state for the ecological site
IndicatorExtremetoTotal
ModeratetoExtreme
ModerateSlighttoModerate
NonetoSlight
Biological crusts
Found only in protected areas, very limited suite of functional groups
Largely absent, occurring mostly in protected areas
In protected areas and with a minor component in inter-spaces
Evident throughout the site, but conti-nuity is broken
Largely intact and nearly matches site capability
Vertical vegetation structure
Number of height classes greatly reduced and/or most height classes lost and/or dramatic increase in number of height classes expected for site and/or dramatic reduction in the number or density of individu-als across several height classes
Number of height classes significantly reduced and/or more than one height class lost and/or addition of more than one height class not expected for site and/or significant reduction in the number or density of individu-als across several height classes
Number of height classes moderately reduced and/or one height class lost and/or addition of height class not expected for site and/or moderate reduction in the number or density of individu-als across several height classes
Number of height classes slightly reduced and/or slight reduction in the number or density of individu-als across several height classes
Number and type of height classes and the number and density of individu-als in each height class closely match that expected for the site

4–47(190–VI–NRPH, October 2006)
National Range and Pasture HandbookInventorying and Monitoring Grazing Land Resources
Chapter 4
(4) Determining the functional status of the three rangeland health attributes
The interpretation process is the critical link between observations of indicators and determining the degree of departure from the reference sheet for each health attribute in an evaluation area. The interpretation of the indicators and the selection of the degree of de-parture of the rangeland health attributes (soil/site stability, hydrologic function, and biotic integrity) are made at the bottom of page 2 of the evaluation sheet. (exhibit 4–9). Table 4–2 is the grouping of indicators into the three attributes of rangeland health.
The summary rating is made by reviewing the indica-tor ratings and comments to arrive at a single degree of departure from the Reference Sheet for each attri-bute.
A preponderance of evidence approach is used to select the appropriate departure category for each attribute. This decision is based, in part, on where the majority of the indicators for each attribute fall under the five categories. For example, if four of the soil/site stability indicators are in the Moderate and six are in the Slight to Moderate departure from the ecological site description, the Soil/Site Stability attribute depar-ture would be rated as Slight to Moderate assuming that the evaluator(s) interpretation of other informa-tion and local ecological knowledge supported this rat-ing. However, if one of the four indicators in the Moder-ate category is particularly important for the site (bare ground), a rating of Moderate can be supported.
Once an evaluation is made for each attribute, manag-ers may use the attribute evaluation to identify where more information (monitoring and/or inventory data) is required. This information should be reviewed if available, or if not available, the information should be collected. Therefore, these areas (moderate departure) are often ideal for the implementation of monitoring studies since they should be the most responsive to management activities. However, additional monitor-ing may be useful regardless of the departure rating, dependant upon future change in uses or management of the area.
This procedure relies upon the collective experience and knowledge of the evaluator(s) to classify each indicator and then to interpret the collective rating for the indicators into one summary rating of departure for each attribute. The rating of each indicator and the
interpretation into a collective rating for each attribute are not apprentice-level work. This procedure has been developed for use by experienced, knowledge-able evaluator(s). It is not intended that this assess-ment procedure be used by new and/or inexperienced employees, without training and assistance by more experienced and knowledgeable employees.
(d) Communicating ratings of ecological sites
Communicating ratings of ecological sites on range-land is important to decisionmakers, users, rangeland management professionals, other agency personnel, and the general public. Ratings on ecological sites can be reported in the three ways described in the preced-ing paragraphs: trend (rangeland trend or planned trend), similarity index, and rangeland health. Many times all three methods of evaluation may be useful and needed to fully inventory and describe the ratings of ecological sites on the land.
(e) Evaluating rangelands occupied by naturalized plant communities
As stated in chapter 3, ecological site descriptions are to be developed for all identified ecological sites on rangeland. These site descriptions are to identify and describe the historic climax plant community along with other vegetation states commonly found on the site. In some locations the historic climax plant community has been destroyed, and the plant community cannot be reconstructed with any degree of reliability. In these areas site descriptions will be developed using naturalized plant communities for the site instead of the historic climax plant community. The use of this option for ecological site descriptions is for areas where the historic climax plant community is unknown and cannot be reconstructed with any degree of reliability. An example of the areas within the United States where this may be used is the State of Hawaii, the Caribbean Area, and the annual grass-lands of California. Approval to describe ecological sites in this manner in other regions must be obtained from the national program leader for range and pas-ture. Evaluation of these sites may include rangeland health, planned trend, and similarity index to a desired plant community. It will not include similarity index to historic climax because there is no way to know the historic climax plant community for these sites.

National Range and Pasture HandbookInventorying and Monitoring Grazing Land Resources
Chapter 4
4–48 (190–VI–NRPH, October 2006)
Indicator/attributeSoil/sitestability
Hydrologicfunction
Bioticintegrity
1. Rills X X
2. Water flow patterns X X
3. Pedestals and/or terracettes X X
4. Bare ground X X
5. Gullies X X
6. Wind-scoured, blowout, and/or deposition areas X
7. Litter movement X
8. Soil surface resistance to erosion X X X
9. Soil surface loss or degradation X X X
10. Plant community composition and distribution relative to infiltration and runoff X
11. Compaction layer X X X
12. Plant functional/structural groups X
13. Plant mortality/decadence X
14. Litter amount X X
15. Annual production X
16. Invasive plants X
17. Reproductive capability of perennial plants X
Table 4–2 Grouping of the indicators of rangeland health into ecological attributes

4–49(190–VI–NRPH, October 2006)
National Range and Pasture HandbookInventorying and Monitoring Grazing Land Resources
Chapter 4
600.0403 Evaluating grazed forest lands
Grazed forest lands will be evaluated by utilizing planned trend and forage value ratings.
(a) Planned trend
Planned trend is defined as the change in plant compo-sition within an ecological site from one plant commu-nity type to another relative to management objectives and to protecting the soil, water, air, plant, and animal resources. Planned trend is described as:
Positive—Moving towards the desired plant community
Not apparent—Change not detectable
Negative—Moving away from the desired plant community
Planned trend provides feedback to the manager and grazing land specialist about how well the manage-ment plan and prescribed grazing are working on a grazing unit by grazing unit basis. It can provide an early opportunity to make adjustments to the grazing duration and stocking levels in the conservation plan. Planned trend is monitored on all native and natural-ized grazing land plant communities.
(b) Forage value rating
Forage value is a utilitarian classification indicating the grazing value of important plant species for spe-cific kinds of livestock or wildlife. The classification is based on palatability or preference of the animal for a species in relation to other species, the relative length of the period that the plant is available for grazing, and normal relative abundance of the plant. Five forage value categories are recognized.
Preferred plants—These plants are abundant and furnish useful forage for a reasonably long grazing pe-riod. They are preferred by grazing animals. Preferred plants are generally more sensitive to grazing misuse than other plants, and they decline under continued heavy grazing.
Desirable plants—These plants are useful forage plants, although not highly preferred by grazing ani-mals. They either provide forage for a relatively short period, or they are not generally abundant in the stand. Some of these plants increase, at least in percentage, if the more highly preferred plants decline.
Undesirable plants—These plants are relatively unpalatable to grazing animals, or they are available for only a very short period. They generally occur in insignificant amounts, but may become abundant if more highly preferred species are removed.
Nonconsumed plants—These plants are unpalatable to grazing animals, or they are unavailable for use be-cause of structural or chemical adaptations. They may become abundant if more highly preferred species are removed.
Toxic plants—These plants are poisonous to graz-ing animals. They have various palatability ratings and may or may not be consumed. Toxic plants may become abundant if unpalatable and the more highly preferred species are removed.
National Range and Pasture HandbookInventorying and Monitoring Grazing Land Resources
Chapter 4
4–50 (190–VI–NRPH, October 2006)
600.0404 Vegetation sampling techniques
Vegetation sampling techniques are used in inventory and trend monitoring transects to assess utilization, cover, density, and frequency. In all cases techniques specific to the type of data needed should be used. Biomass data should be generated by clipping plots, not by trying to convert density or frequency data to weight. Frequency data should be generated from frequency techniques, not from biomass data. Photo points should be included in all monitoring programs to provide a visual record.
(a) Selecting techniques
Sampling Vegetation Attributes, an interagency tech-nical reference released in 1996, is a good reference to use when evaluating sampling techniques. It includes examples of methods and data sheets, and can be used to plan, design, and layout for monitoring.
The technique or techniques used in monitoring de-pends on the vegetation attribute being monitored. For instance, a utilization technique should be used to monitor utilization to the needed level of precision within cost constraints. Because repeated clipping at a permanent monitoring location can reduce produc-tivity, biomass is not recommended as a monitoring technique.
Indicators of environmental change, such as frequency or cover of certain species, may be the best variables to measure. For long-term monitoring, cover may be the best variable to measure. Basal cover of perennial grasses and canopy cover of woody plants typically change slowly over time. These attributes are not strongly affected by co-variates, such as climatic varia-tion, yet they would be expected to change under dif-ferent types of management. Permanent line transects established at random locations with photo points down the line are an excellent technique for monitor-ing environmental change.
(1) Monitoring scheme exampleRange management specialists in Arizona, as well as other states, are monitoring trend using techniques similar to those described in this chapter. The follow-
ing example scheme, from southern Arizona, involves a pace frequency monitoring technique to sample plant frequency and cover for overall trend.
Monitoring sites are established in key areas. Key areas are within the predominant site in the grazing unit that has potential for improvement under manage-ment and that has an adequate representation of key species. Four transects are established within the key area and marked so they can be relocated. Along each transect, 50 quadrates, 40-centimeter by 40-centime-ter frequency, are read at one pace intervals. A single point on the quadrate is read for ground cover. Grasses and forbs rooted within the quadrate are recorded for presence (frequency), and trees or shrubs rooted within or overhanging the plot are recorded for pres-ence. The data are tabulated and summarized on a summary sheet for use in discussions of trend by the rancher and range management specialist. Ancillary data noted or collected include the direction of the transect (consistent yearly), similarity index rating to a specific plant community, number of animals, season of use, utilization, production, and precipitation.
(b) Studies of treatment effects
The literature related to methods used in research, inventory, and monitoring is extensive. In many cases the conservationist will be well advised to seek advice from other professionals who may have more experi-ence with a particular type of data need. The process of selecting an appropriate technique involves several simple questions:
Is this information really needed or is it already known? If the information has already been docu-mented then data collection is probably not needed. However, if the information is not documented or the results in the literature are contrary to what has been observed, then data collection is needed.
Is the information needed related to a specific vegetation attribute, such as biomass, cover, density, frequency, or utilization or some com-bination? This is often the most difficult question to answer. If the answer is not known, biomass and cover data are the best data to collect. For example, if a dif-ference in use has been noted between sites for a par-ticular grass species, then the first thought might be a utilization study. A utilization study would provide the

4–51(190–VI–NRPH, October 2006)
National Range and Pasture HandbookInventorying and Monitoring Grazing Land Resources
Chapter 4
data needed to show a difference in use, but would not indicate why there is a difference in use. A chemical analysis of randomly selected plants from both sites might indicate a difference in palatability. A frequency study would indicate the presence of a more palat-able plant on the site where the species is not used. A biomass study with selected materials from both sites put through a chemical analysis would also provide the needed information.
Which technique or combination of techniques will quantify the observed phenomenon? The best technique or combination of techniques will obtain the information within time and cost constraints and at the needed level of precision or will provide the best tradeoff of time and precision. An initial plot size and shape study provides this information.
Once these questions are answered, the study can be designed and completed with some likelihood of deter-mining differences.

(190–VI–NRPH, October 2006)

Exhibits
Chapter 4 Inventorying and Monitoring Grazing Land Resources


4ex–1(190–VI–NRPH, October 2006)
15 lb
8 lb
3 lb15 ft
30 ft
15 gm
15 gm
50 gm
5 gm
25 gm
1.
2.
3.
4.
6.
Entire tree as unit7.
5.
2,000 gm
Exhibit 4–1 Examples of weight units

4ex–2 (190–VI–NRPH, October 2006)
Exhibit 4–2 Percentage of air-dry matter in harvested plant material at various stages of growth
Grasses
Before heading;initial growth toboot stage(%)
Headed out;boot stageto flowering(%)
Seed ripe; leaf tips drying(%)
Leaves dry;stems partly dry(%)
Apparentdormancy(%)
Cool-seasonwheatgrassesperennial bromesbluegrassesprairie junegrass
35 45 60 85 95
Warm-seasontall grassesbluestemsindiangrassswitchgrass
30 45 60 85 95
Midgrassessideoats gramatobosagalleta
40 55 65 90 95
Short grassesblue gramabuffalograssshort three-awns
45 60 80 90 95
TreesNew leaf and twig growthuntil leaves
Older and full-size green leaves(%)
Green fruit(%)
Dry fruit(%)
Evergreen coniferousponderosa pine, slashpine-longleaf pineUtah juniperRocky Mountain juniperspruce
45 55 35 85
Live oak 40 55 40 80
Deciduousblackjack oakpost oakhickory
40 50 35 85

4ex–3(190–VI–NRPH, October 2006)
Exhibit 4–2 Percentage of air-dry matter in harvested plant material at various stages of growth—Continued
Shrubs
New leaf and twig growth untilleaves are full size (%)
Older andfull-size green leaves(%)
Green fruit(%)
Dry fruit(%)
Evergreenbig sagebrushbitterbrushephedraalgeritagallberry
55 65 35 85
Deciduous snowberryrabbitbrushsnakeweedGambel oakmesquite
35 50 30 85
Yucca and yucca-like plantsyuccasotolsaw-palmetto
55 65 35 85
Forbs Initial growthto flowering(%)
Flowering toseed maturity(%)
Seed ripe; leaftips dry(%)
Leaves dry; stems drying(%)
Dry(%)
Succulentvioletwaterleafbuttercupbluebellsonion, lilies
15 35 60 90 100
Leafylupinelespedezacompassplantbalsamroottickclover
20 40 60 90 100
Fibrous leaves or mat 30 50 75 90 100
phlox
mat eriogonum
pussytoes
Succulents
New growth padsand fruits
Older padsOld growth indry years
(%) (%) (%)
Pricklypear and barrel cactus
10 10 15+
Cholla cactus 20 25 30+

4ex–4 (190–VI–NRPH, October 2006)
Ex
hib
it 4
–3
NR
CS
RA
NG
E 4
14, P
rope
r gr
azin
g us
e
Pro
per
Gra
zin
g U
se
Co
op
erat
or_
____
____
____
____
____
____
____
____
_
Gra
zin
gu
nit
Acr
es
Spe
cies
of
gra
zin
gan
imal
Sea
son
of
Use
Lo
catio
n o
f Key
Gra
zing
Are
aU
se
Act
ual
per
cen
t or
po
un
ds
rem
ain
ing
Spe
cies
at E
nd o
f Gra
zing
Per
iod
(or
Po
un
ds
per
Acr
e)19
___
19__
_19
___
19__
_19
___
Con
serv
atio
nist
Ass
istin
g w
ith P
lann
ing
Initi
als
of C
onse
rvat
ioni
stA
ssis
ting
with
App
licat
ion
Dat
es o
f App
licat
ion
Che
cks
N
ame
and
Dat
e
Min
imu
m P
erce
nt o
f Key
for
Jud
gin
gK
ey P
lan
t(s)
Pro
per
Gra
zing

4ex–5(190–VI–NRPH, October 2006)
Exhibit 4–3 NRCS RANGE 414, Proper grazing use—Continued
Proper Grazing Use
Grazing Unit : Enter in this column the name of the pasture or field used by the cooperator orthe number from the conservation plan map.
Acres : Enter in this column the acreage of the grazing unit.
Species of Grazing Animal : Enter in this column the species and class of livestock beinggrazed such as: dry cows, cow-calves, ewes and lambs, yearling cattle, 2-year steers,yearling sheep, goats, deer, horses, elk, etc.
Season of Use : Enter in this column the season that unit will be grazed such as: fall, winter,spring, summer, or by months: Sept. - Oct, Nov. - Mar, May- Jul, etc.
Location of Key Grazing Area : Enter in this column a description of the key grazing area.This may be an ecological site, it may be a portion of a site, or it might be a particular locationwithin the grazing unit such as: S-W portion of grazing unit starting about 200 yards frompond to fence.
Key Plant(s) for Judging Proper Grazing Use : Enter in this column the species by commonname on which you and the cooperator decide proper grazing use will be judged. There maybe occasion when you will select two species, in this case enter the name of both species.
Minimum Percent of Key Species at End of Grazing Period : Enter in this column, the percentby weight, of the current year's growth of the key species that should be left ungrazed at theend of the grazing season. Where specifications call for a certain number of pounds offorage to be left ungrazed per acre of the key species, then the specified pounds per acreshould be entered in this column.
Actual Percent or Pounds Remaining : Enter in this column, by calendar year, the percent, byby weight, or pounds remaining of the selected key species in the grazing unit. This measure-ment should be based on the key species on the key grazing area, at or near the end of thegrazing call for use in percent of current year's growth, enter percentage of growth ungrazed.If use is specified in amount of forage to be left ungrazed in pounds per acre, then enter poundsper acre left ungrazed.

4ex–6 (190–VI–NRPH, October 2006)
Exhibit 4–4 Foliage denseness classes
Instructions for use of exhibit 4–4 tables:
Determine yields of juniper and pinyon pine by:
1. On 1/10- or 1/100-acre plots selected by random, tally crown diameter per tree and foliage denseness (sparse, medium, and dense) on each tree. From the tables, find yield per tree for each tree by crown diameter and foliage denseness from the proper table (range site), and record this opposite each tree. Add this column of weights. Multiply by 10 on 1/10-acre plots and by 100 on 1/100-acre plots. This figure is pounds per acre annual yield.
2. On 1/10- or 1/100-acre plots selected by random, tally crown diameter and foliage denseness for each tree. Average the crown diameter for the dense foliage trees; likewise, for the medium and sparse separately. Find the weight per tree in the proper tables opposite for average crown diameter and multiply this figure by the number of trees in the foliage class. Do this for each foliage class. Add the three figures. Multiply by 10 on 1/10-acre plots and by 100 on the 1/100-acre plots to get yield per acre.
Dense
Medium
Sparse

4ex–7(190–VI–NRPH, October 2006)
Exhibit 4–4 Foliage denseness classes—Continued
Guide for Determining Current Yield of Utah Juniper in Utah Upland Stony Loam (Juniper) SiteCurrent Yield Air Dry Pounds
Crowndiameter ft)
Weightper tree
10trees
50trees
100trees
200trees
300trees
400trees
500trees
Sparse foliage1 0.1 1 5 10 20 30 40 502 0.3 3 15 30 60 90 120 1503 0.6 6 30 60 120 180 240 3004 1.0 10 50 100 200 300 400 5005 1.3 13 65 130 260 390 520 6506 1.6 16 80 160 320 480 640 8007 1.9 19 95 190 380 570 760 9508 2.3 23 115 230 460 690 920 11509 2.6 26 130 260 520 780 1040 1300
10 2.9 29 145 290 580 870 1160 145011 3.3 33 165 330 660 990 1320 165012 3.6 36 180 360 720 1080 1440 180013 4.0 40 200 400 800 1200 1600 200014 4.4 44 220 440 880 1320 1760 220015 4.7 47 235 470 940 1410 1880 235016 5.1 51 255 510 1020 1530 2040 255017 5.5 55 275 550 1100 1650 220018 5.8 58 290 580 1160 1740 232019 6.2 62 310 620 1240 1860 248020 6.6 66 330 660 1320 1980 2640Medium foliage
1 0.1 1 5 10 20 30 40 502 0.3 3 15 30 60 90 120 1503 0.6 6 30 60 120 180 240 3004 1.0 10 50 100 200 300 400 5005 1.4 14 70 140 280 420 560 7006 1.9 19 95 190 380 570 760 9507 2.5 25 125 250 500 750 1000 12508 3.1 31 155 310 620 930 1240 15509 3.8 38 190 380 760 1140 1520 1900
10 4.6 46 230 460 920 1380 1840 230011 5.4 54 270 540 1080 1620 2160 270012 6.2 62 310 620 1240 1860 248013 7.2 72 360 720 1440 216014 8.1 81 405 810 1620 243015 9.1 91 455 910 1820 273016 10.2 102 510 1020 204017 11.3 113 565 1130 226018 12.4 124 620 1240 248019 13.6 136 680 136020 14.8 148 740 1480Dense foliage
1 0.1 1 5 10 20 30 40 502 0.3 3 15 30 60 90 120 1503 0.7 7 35 70 140 210 280 3504 1.2 12 60 120 240 360 480 6005 1.9 19 95 190 380 570 760 9506 2.7 27 135 270 540 810 1080 13507 3.6 36 180 360 720 1080 1440 18008 4.7 47 235 470 940 1410 1880 23509 5.9 59 295 590 1180 1770 2360
10 7.2 72 360 720 1440 216011 8.6 86 430 860 1720 258012 10.2 102 510 1020 204013 11.9 119 595 1190 238014 13.7 137 685 1370 274015 15.6 156 780 156016 17.7 177 885 177017 19.9 199 995 199018 22.2 222 1110 222019 24.6 246 1230 246020 27.2 272 1360 2720

4ex–8 (190–VI–NRPH, October 2006)
Exhibit 4–4 Foliage denseness classes—Continued
Annual Foliage and Fruit Production per Juniper Tree on Different Sites and for Different Foliage Classes
Crowndiameter
SiteUpland loamfoliage and fruitsparse/medium/dense
Upland stony loamfoliage and fruitsparse/medium/dense
Upland gravelly loamfoliage and fruitsparse/medium/dense
Upland shallow loamfoliage and fruitsparse/medium/dense
Upland shallow hardpanfoliage and fruitsparse/medium/dense
1 0.1 0.1 0.1 0.2 0.1 0.1 0.1 0.1 0.2 0.1 0.1 0.2 0.1 0.1 0.22 0.2 0.3 0.4 0.4 0.3 0.3 0.4 0.4 0.5 0.2 0.2 0.5 0.3 0.4 0.53 0.4 0.6 0.9 0.7 0.6 0.7 0.6 0.7 0.9 0.4 0.5 1.0 0.7 0.9 1.44 0.6 1.1 1.5 1.0 1.0 1.2 1.0 1.1 1.5 0.7 0.8 1.6 1.2 1.6 2.45 0.9 1.6 2.1 1.3 1.4 1.9 1.3 1.6 2.1 1.0 1.3 2.2 1.8 2.6 3.86 1.3 2.1 3.1 1.6 1.9 2.7 1.7 2.1 2.7 1.4 1.8 2.9 2.7 3.7 5.47 1.6 2.8 4.0 1.9 2.5 3.6 2.1 2.6 3.5 1.7 2.4 3.8 3.6 5.0 7.48 2.0 3.5 5.1 2.3 3.1 4.7 2.6 3.2 4.3 2.2 3.1 4.6 4.7 6.5 9.69 2.5 4.3 6.3 2.6 3.8 5.9 3.1 3.9 5.1 2.6 3.8 5.6 6.0 8.2 12.2
10 3.0 5.2 7.6 2.9 4.6 7.2 3.6 4.6 6.0 3.1 4.6 6.6 7.4 10.1 15.111 3.5 6.2 9.0 3.3 5.4 8.6 4.1 5.3 7.0 3.6 5.5 7.6 9.0 12.1 18.212 4.0 7.2 10.5 3.6 6.2 10.2 4.7 6.1 8.0 4.2 6.5 8.8 10.7 14.4 21.713 4.6 8.3 12.1 4.0 7.2 11.9 5.2 6.9 9.1 4.7 7.6 9.9 12.6 16.9 25.514 5.2 9.4 13.9 4.4 8.1 13.7 5.8 7.8 10.2 5.3 8.7 11.2 14.6 19.5 29.615 5.9 10.6 15.6 4.7 9.1 15.6 6.5 8.7 11.3 6.0 9.9 12.4 16.7 22.4 33.916 6.5 11.9 17.5 5.1 10.2 17.7 7.1 9.6 12.5 6.6 11.1 13.8 19.0 25.5 38.617 7.2 13.2 19.4 5.5 11.3 19.9 7.8 10.5 13.7 7.3 12.4 15.1 21.5 28.7 43.618 8.0 14.6 21.5 5.8 12.4 22.2 8.4 11.5 15.0 8.0 13.8 16.6 24.1 32.1 48.919 8.7 16.1 23.7 6.2 13.6 24.6 9.1 12.5 16.3 8.7 15.3 18.0 26.9 35.5 54.520 9.5 17.6 26.0 6.6 14.8 27.2 9.8 13.6 17.6 9.5 16.8 19.6 29.8 39.5 60.4
General Soil Features Associated with Sites Named in “Guides for Determining Current Yield
of PIMO and JUOS in Utah”
Site namePrecipitation zone(in)
Range in slope(%)
Soil depthCoarse fragmentsin profile
Range in AWC(in)
Upland stony loam 12–16 5–30 Deep to very deep over bedrock
50% (45 60% at soil surface)
2–4 (6)
Semidesert stony loam 8–12 5–30 50 in over bedrock
50% (45-60% at soil surface)
2–4
Upland gravely loam 12–16 4–15 35–40 in 35–65% 2–3
Upland loam 12–16 3–20 40 in to bedrock
35–60% (in upper profile
3–6
Upland shallow hardpan 12–16 5–20 6–20 in over hardpan
15–60% (often nonskeletal)
1.5–3
Upland shallow loam 12–16 8–60 14–20 in (15 in) to bedrock
75% 0.5–1.5

4ex–9(190–VI–NRPH, October 2006)
Exhibit 4–5 Browse resource evaluation worksheet
Note: ___________________________________________________________________________________________________________________________________________________________________________________
Judge compositionand trend based onmajority of evidence
Date of
initial evaluation:
____/____/____
Cooperator: __________________________________ Ecological site: __________________________________Pasture: ____________________________________ Location in pasture: _______________________________Kinds of browsing animals: ______________________________ Examiner: _______________________________Goals for browse resource: ______________________________________________________________________
Preferred species
Non-preferred species
Desirable species
Browse compositionOccurrence
CommonAbundant Scarce Moderate Severe Abundant AdequateNot
evidentNot
adequate
Browse trendHedging or browse line Reproduction
Good
Fair
Poor
Upward
Stable or not apparent
Downward
Browse Resource Evaluation
Browse composition Browse trend
Utilization of current year's growth
Key species
Seasonof
use
Planneduse
percent
Actual use percent
Years
Date observed

4ex–10 (190–VI–NRPH, October 2006)
Exhibit 4–5 Browse resource evaluation worksheet—Continued
Instructions for Browse Resource Evaluation Worksheet
The worksheet can assist managers evaluate the composition and trend of the browse resource, as well as document the actual use of key browse species over time. This information is used to identify problems, formulate alternatives, and measure progress in attaining browse management goals.
Browse composition evaluates the occurrence of browse species according to preference categories. Species are designated as preferred, desirable, or non-preferred based on the species of browsing animal and the appropriate ecological site descriptions.
Occurrence: After a thorough observation of the area, determine the occurrence of each listed species and place a checkmark or an x in the appropriate block as defined.
Abundant The species dominates or characterizes the area observed; it makes up greater than 5% canopy and often greater than 20%.
Common The species is easily found, but is not present in abundance; it usually makes up 1–5% canopy. Scarce Insignificant amounts of the species is present and may be difficult to find; it usually makes up far less than 1%
canopy.
Browse composition is judged as good, fair, or poor based on the preponderance of entries in the shaded boxes. For example, if there were four entries in the fair blocks, one in the good blocks, and 2 in the poor blocks, the overall browse composition would be judged as fair.
Browse trend evaluates the health and vigor of the browse resource based on signs of past use and on reproduction. Hedging and browse lines are distinctive growth forms that occur on shrubs or trees subjected to long term heavy use. After a thorough examina-tion of the selected species in the area, determine the level of hedging or browse line and status of reproduction and place a check mark or x in the appropriate block as defined below.
Hedging or browse line: Hedging is evaluated on short shrubs which are entirely or mostly within reach of browsing animals. Browse line is evaluated on taller shrubs and trees where a portion of the plant is above browsing height.
Notevident On shorter plants, there is little or no evidence of hedging. On taller plants, there is little or no reduction of lower growth. Production of lower branches and twigs is similar to those above the reach of animals.
Moderate On shorter plants, most recent year’s twigs have been browsed, resulting in branching and rebranching from lateral buds; growth form is somewhat compact. On taller plants, there is a visible thinning of growth up to browsing height; lower branches and twigs are considerably less productive than those beyond reach of the animals.
Severe Shorter plants are very compact or have a stunted appearance; may be characterized by very short twigs, stubby branches, small leaves, low production or excessive number of dead branches. On taller plants, a browse line is strikingly evident; there is little or no production on twigs within reach of animals; most lower branches are absent.
Browse trend is judged as upward, stable (or not apparent), or downward based upon the preponderance of entries in the shaded boxes.
Reproduction: A reproduction evaluation is made to determine the future potential of a species in the community. The presence of young seedlings is only one measure of reproduction. The survival of new plants for the first 1 to 5 years is often the limiting factor, even though new seedlings or root sprouts may be present in some abundance in some years. A good distribution of various age plants from young to fully mature is a better indicator of successful reproduction.
Abundant The population of a species is increasing in the community; more young plants are present than are old plants. Adequate Sufficient seedlings and young plants are present to approximately maintain the appropriate population status
of the species in the community; plants that are decadent or dying are being replaced by new plants. Inadequate Few or no seedlings or young plants are present; population is either declining or stagnated with mature
plants.
Utilization of current year’s growth—This section is used to record the actual degree of use on key species in the same area over a period of years. Browse use is usually determined sometime between late fall and late winter. Degree of use is expressed as the percentage, by weight, of the current year’s twig and leaf production within reach of browsing animals that has been consumed. Use is most easily estimated by comparing accessible twigs to twigs which are inaccessible to browsing animals. Determinations should be made by observing many twigs on a number of different plants. Current year’s twig growth is distinguished from older twigs by color, texture, and size.
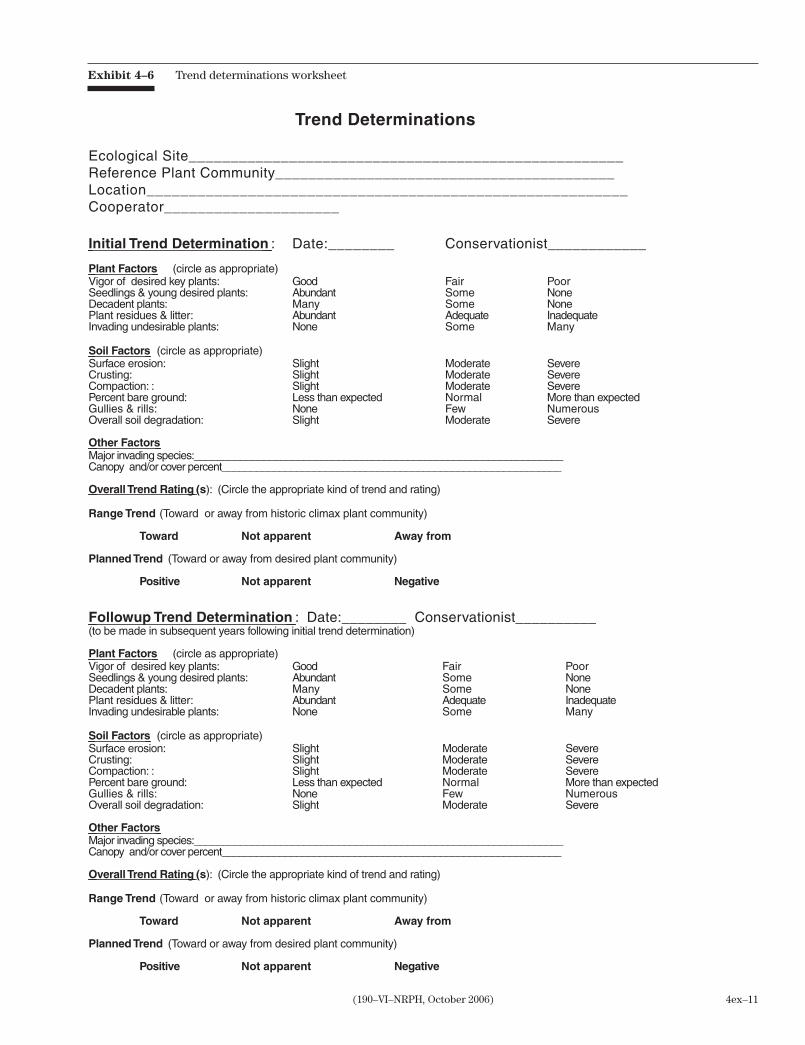
4ex–11(190–VI–NRPH, October 2006)
Exhibit 4–6 Trend determinations worksheet
Trend Determinations
Ecological Site____________________________________________________Reference Plant Community_________________________________________Location_________________________________________________________Cooperator_____________________
Initial Trend Determination : Date:________ Conservationist____________
Plant Factors (circle as appropriate)Vigor of desired key plants: Good Fair PoorSeedlings & young desired plants: Abundant Some NoneDecadent plants: Many Some NonePlant residues & litter: Abundant Adequate InadequateInvading undesirable plants: None Some Many
Soil Factors (circle as appropriate)Surface erosion: Slight Moderate SevereCrusting: Slight Moderate SevereCompaction: : Slight Moderate SeverePercent bare ground: Less than expected Normal More than expectedGullies & rills: None Few NumerousOverall soil degradation: Slight Moderate Severe
Other Factors Major invading species:________________________________________________________________Canopy and/or cover percent___________________________________________________________
Overall Trend Rating (s): (Circle the appropriate kind of trend and rating)
Range Trend (Toward or away from historic climax plant community)
Toward Not apparent Away from
Planned Trend (Toward or away from desired plant community)
Positive Not apparent Negative
Followup Trend Determination : Date:________ Conservationist__________(to be made in subsequent years following initial trend determination)
Plant Factors (circle as appropriate)Vigor of desired key plants: Good Fair PoorSeedlings & young desired plants: Abundant Some NoneDecadent plants: Many Some NonePlant residues & litter: Abundant Adequate InadequateInvading undesirable plants: None Some Many
Soil Factors (circle as appropriate)Surface erosion: Slight Moderate SevereCrusting: Slight Moderate SevereCompaction: : Slight Moderate SeverePercent bare ground: Less than expected Normal More than expectedGullies & rills: None Few NumerousOverall soil degradation: Slight Moderate Severe
Other Factors Major invading species:________________________________________________________________Canopy and/or cover percent___________________________________________________________
Overall Trend Rating (s): (Circle the appropriate kind of trend and rating)
Range Trend (Toward or away from historic climax plant community)
Toward Not apparent Away from
Planned Trend (Toward or away from desired plant community)
Positive Not apparent Negative
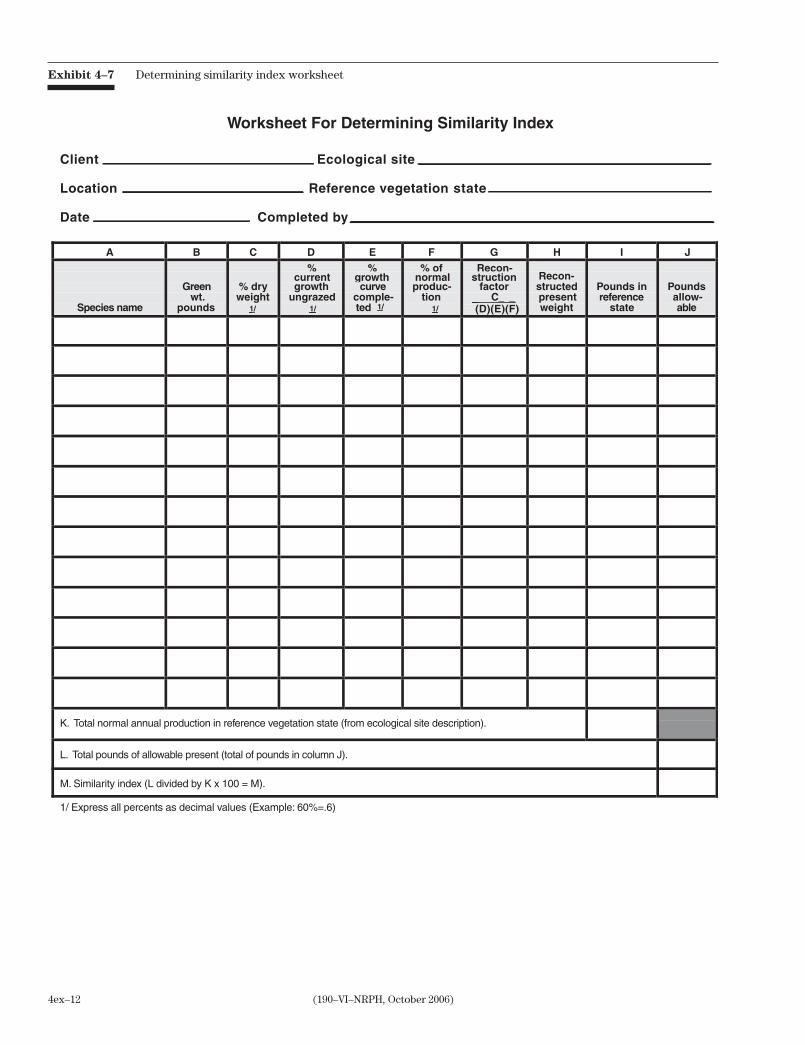
4ex–12 (190–VI–NRPH, October 2006)
Exhibit 4–7 Determining similarity index worksheet
Worksheet For Determining Similarity Index
Client Ecological site
Location Reference vegetation state
Date Completed by
A B C D E F G H I J
Species name
Green wt.
pounds
% dryweight
%currentgrowth
ungrazed
%growthcurve
comple-ted
% ofnormalproduc-
tion
Recon-struction
factor C_ _
(D)(E)(F)
Recon-structedpresentweight
Pounds inreference
state
Poundsallow-able
K. Total normal annual production in reference vegetation state (from ecological site description).
L. Total pounds of allowable present (total of pounds in column J).
M. Similarity index (L divided by K x 100 = M).
1/ Express all percents as decimal values (Example: 60%=.6)
1/ 1/ 1/ 1/

4ex–13(190–VI–NRPH, October 2006)
Instructions for Worksheet for Determining Similarity Index
A. Species name Enter the common or scientific name of the plant species.
B. Green wt. pounds Enter the fresh clipped weight of each species.
C. Percent dry weight Enter the percent air dry weight or oven dry weight as a decimal value.
D. Percent current growth ungrazed
Enter the estimated percent (as a decimal value) of the current growth that hasnot been removed by grazing or harvest.
E. Percent growth curve completed
Enter the percent (as a decimal value) of the current years growth for eachspecies that should normally have occurred by the date of this determination.
F. Percent of normal production
Enter an estimation of the current years forage growth in comparison to normalexpressed as a percent (as a decimal value) of normal. Example: .9 means theyear's production is 90% of normal or 10% below normal. 1.1 is 110% ofnormal or 10% above normal.
G. Reconstruction factor
This factor is calculated by dividing (C) Percent dry weight by the productobtained by multiplying (D) Percent current growth ungrazed times (E) Percentgrowth curve completed times (F) Percent of normal production.(C / D x E x F = G)
H. Reconstructed present weight
This value is calculated by multiplying (B) Green weight in pounds by (G) theReconstruction factor. (B x G = H)
I. Pounds in reference vegetation state
Enter the pounds for each plant species as shown in the appropriate referencevegetation state in the ecological site description.
J. Pounds allowable Enter the lesser of (H) Reconstructed present weight or (I) pounds. No morethan the pounds in the reference vegetation state plant community may becounted in determining similarity index.
K. Total normal annual production in refer- ence vegetation state
This is the total normal product of all plants shown in the appropriate referencevegetation state plant community description of the ecological site description.
L. Total pounds of allowable present
This is the total of all weight shown in column (J). It is all the weight that isallowed to count toward determining similarity index.
M. Similarity index This is calculated by dividing (L) Total pounds of allowable present by (K) totalNormal annual production and multiplying by 100 to express it as a percent.(L / K x 100 = M)
Exhibit 4–7 Determining similarity index worksheet—Continued

4ex–14 (190–VI–NRPH, October 2006)
Exhibit 4–8 Ecological site reference sheet
Author(s)/participants ______________________________________________________________________________________
Contract for lead author ____________________________________________________________________________________
Date ___________ MLRA ______________________Ecological site__________________________ This must be verified based on soils and climate (see ecological site description): Current plant community cannot be used to identify the ecological site.
Composition (Indicators 10 and 12) based on Annual production Foliar cover Biomass
IndicatorsFor each indicator, describe the potential for the site. Where possible, (1) use numbers, (2) include expected range of values for above- and below-average years and natural disturbance regimes for each community within the reference state, when appropriateand (3) cite data. Continue descriptions on separate sheet.
1. Number and extent of rills:
2. Presence of water flow patterns:
3. Number and height of erosional pedestals or terracettes:
4. Bare ground from ecological site description or other studies (rock, litter, lichen, moss, plant canopy are not bare ground):
5. Number of gullies and erosion associated with gullies:
6. Extent of wind scoured, blowouts, and/or depositional areas:
7. Amount of litter movement (describe size and distance expected to travel):
8. Soil surface (top few mm) resistance to erosion (stability values are averages - most sites will show a range of values):
9. Soil surface structure and SOM content (include type of structure and A-horizon color and thickness):
10. Effect of plant community composition (relative proportion of different functional groups) and spatial distribution on infiltration and runoff:
11. Presence and thickness of compaction layer (usually none; describe soil profile features which may be mistaken for compaction on this site):
12. Functional/structural groups (list in order of descending dominance by above-ground production or live foliar cover (specify) using symbols: >>, >, = to indicate much greater than, greater than, and equal to; place dominants, subdominants and “others” on separate lines): Dominants: Subdominants: Other:
13. Amount of plant mortality and decadence (include which functional groups are expected to show morality or decadence):
14. Average percent litter cover (_______%) and depth (_______ inches)
15. Expected annual production (this is TOTAL above-ground production, not just forage production): _________ - _________ lbs/acre or kg/ha (choose one)
16. Potential invasive (including noxious) species (native and non-native). List species which BOTH characterize degraded states and have the potential to become a dominant or codominant species on the ecological site if their future establishment and growth is not actively controlled by management interventions. Species that become dominant for only one to several years what is NOT expected in the reference state for the ecological site:
17. Perennial plant reproductive capability:
Reference Sheet

4ex–15(190–VI–NRPH, October 2006)
Exhibit 4–8 Ecological site reference sheet—Continued
Author(s)/participants ______________________________________________________________________________________
Contract for lead author ____________________________________________________________________________________
Date ___________ MLRA ______________________Ecological site__________________________ This must be verified based on soils and climate (see ecological site description): Current plant community cannot be used to identify the ecological site.
Composition (indicators 10 and 12) based on Annual production Foliar cover Biomass
IndicatorsFor each indicator, describe the potential for the site. Where possible, (1) use numbers, (2) include expected range of values for above- and below-average years and natural disturbance regimes for each community within the reference state, when appropriateand (3) cite data. Continue descriptions on separate sheet.
1. Number and extent of rills:
2. Presence of water flow patterns:
3. Number and height of erosional pedestals or terracettes:
4. Bare ground from ecological site description or other studies (rock, litter, lichen, moss, plant canopy are not bare ground):
5. Number of gullies and erosion associated with gullies:
6. Extent of wind scoured, blowouts, and/or depositional areas:
7. Amount of litter movement (describe size and distance expected to travel):
8. Soil surface (top few mm) resistance to erosion (stability values are averages - most sites will show a range of values):
9. Soil surface structure and SOM content (include type of structure and A-horizon color and thickness):
Reference Sheet (standard example)
Winnemucca class participants (May 12-15, 2005)
5-1-05
Minimal on slopes less than 10% and increasing slightly as slopes increase up to 50%. Rills spaced 15-20 feet apart when present onslopes of 10-50%. After wildfires, high levels of natural herbivory or extended drought, or combinations of these disturbances, rillsmay double in numbers on slopes from 10-50% after high intensity summer thunderstorms.
Generally up to 20 feet apart and short (less than 10 feet long) with numerous obstructions that alter the water flow path. On slopesof 10-50%, flow patterns increase in number and length. Flow pattern length and numbers may double after wildfires, high levels of natural herbivory, extended drought, or combinations of these disturbances if high intensity summer thunderstorms occur.
Plant or rock pedestals and terracettes are almost always in flow patterns. Wind caused pedestals are rare and only would be on thesite after wildfires, high levels of natural herbivory, extended drought, or combinations of these disturbances. Pedestals of Sandberg bluegrass on pedestals outside water flow patterns are generally caused by frost heaving, not erosion. Pedestals and terracetteswould be particularly apparent on 10-50% slpoes, especially immediately after high intensity summer thunderstorms.
10-20% or less bare ground with bare patches less than 10% of the evaluation area occurring as intercanopy patches larger than2 feet in diameter (intercanopy patches can include areas that are not bare ground). Most large patches can include areas that are notbare ground. Within this range, lower slopes are expected to have less bare ground than steeper slopes. Upper end of precip range (10”)will also have less bare ground. Canopy gaps generallyless than 12 inches in diameter in the intervals between natural disturbance events. Bare ground would be expected to increase to 80% or more the first year following wildfire but to decrease to prefire levels with 2-5 years depending on climate and other disturbances. Multi-year droughts can also cause bare ground to increase to 30%.
Gullies are rare and would only be present when a high intensity summer thunderstorm occurs after wildfires, with high levels of natural herbivory, extended drought, or combinations of these disturbances.
Wind erosion is minimal. Moderate wind erosion can occur when disturbances such as severe wildfires, high levels of natural herbivory,extended drought, or combinations of these disturbances. After rain events, exposed soil surfaces form a physical crust that tends to reduce wind erosion.
Litter movement consists primarily of redistribution of fine litter (herbaceous plant material) in flow patterns for distances of 1-3 feeton 2-15% slopes, 4-6 feet on 15-30% slopes and 7-10 feet on 30-50% slopes. After wildfires, high levels of natural herbivory,extended drought, or combinations of these disturbances, size of litter and distance litter moves can increase with coarse woody litter and fine litter moving up to 10’(2-15% slope); 25’ (15-30% slope); 100’ (30-50% slope).
Values of 4.5-5.5 under canopies and in intercanopy spaces.
Surface layer is light brown and 6-7 inches thick with moderate granular structure. Loss of several millimeters of soil may occurimmediately after a high intensity wildfire, high levels of natural herbivory, extended drought, or cominations of these disturbances.
024 Loamy 8-10” PZ 024XY005NV
10’ (2-15% slope); 25‘ (15-30% slope) 100’ (30-50% slope).

4ex–16 (190–VI–NRPH, October 2006)
Exhibit 4–8 Ecological site reference sheet—Continued
10. Effect of plant community composition (relative proportion of different functional groups) and spatial distribution on infiltration and runoff:
11. Presence and thickness of compaction layer (usually none; describe soil profile features which may be mistaken for compaction on this site):
12. Functional/structural groups (list in order of descending dominance by above-ground production or live foliar cover (specify) using symbols: >>, >, = to indicate much greater than, greater than, and equal to; place dominants, subdominants and “others” on separate lines): Dominants: Subdominants: Other:
13. Amount of plant mortality and decadence (include which functional groups are expected to show morality or decadence):
14. Average percent litter cover (_______%) and depth (_______ inches)
15. Expected annual production (this is TOTAL above-ground production, not just forage production): _________ - _________ lb/acre or kg/ha (choose one)
16. Potential invasive (including noxious) species (native and non-native). List species which BOTH characterize degraded states and have the potential to become a dominant or codominant species on the ecological site if their future establishment and growth is not actively controlled by management interventions. Species that become dominant for only one to several years what is NOT expected in the reference state for the ecological site:
17. Perennial plant reproductive capability:
Reference Sheet (standard example cont.)
Perennial plants and especially sagebrush capture snow, increasing soil water availability in the spring. High bunchgrass density increases infiltration by improving soil structure and slowing runoff. Loss of sagebrush after a high intensity wildfire reduces snow accumulation in the winter, reducing the depth of soil water recharge negatively affecting growth and production of deep rooted forbs and perennial grasses. This reduced soil water recharge is part of the site dynamics if exotics or other management actions don’t delay the succession back to a sagebrush-grass plant community.
Compaction layers should not be present. There are soil profile features in the top 8 inches of the soil profile that would be mistakenfor a management induced soil compaction layer. Silica accumulations can cause denser horizons, however these horizons can be distinguished from compaction by their brittleness and “shiny” material in the horizon. These silica accumulations will increase the hardness of the soil, but compaction can still occur and be detected as degradation of soil structure and loss of macropores.
Most of the perennial plants in this community are long lived, especially the perennial forbs and shrubs. After moderate to high intensity wildfires, all of the non-resprouting shrubs would die as would a small percentage of the herbaceous understory species. Extended droughts would tend to cause relatively high mortality in short lived species such as bottlebrush squirreltail and Sandberg bluegrass.Shrub mortality would be limited to severe, multiple year droughts. Combinations of wildfires and extended droughts would cause even more mortality for several years following the fire than either disturbance functioning by itself. Up to 20% dead branches on sagebrushfollowing drought alone.
After wildfires, high levels of natural herbivory, extended drought, or combinations of these disturbances, litter cover and depth decreases to none immediately after the disturbance (e.g. fire) and dependent on climate and plant production increases to post-disturbance levels in one to five growing seasons.
400 lbs/ac in low precip years. 600 lb/ac in average precip years and 800 lb/ac in above average precip years #/acre. After wildfires, high levels of natural herbivory, extended drought, or combinations of these disturbances, can cause production to be significantlyreduced (100 -200 lb per ac. the first growing season following a wildfire) and recover slowly under below average precipitation regimes.
Cheatgrass is the greatest threat to dominate this site after disturbance (primarily wildfires but disturbances also include high levelsof natural herbivory and/or extended drought). Exotic mustards and Russian thistle may dominate soon after disturbance but are eventually replaced as dominants by cheatgrass. Hoary cress, Russian knapweed, bur buttercup and tall whitetop may meet the definition of an invasive species for this site in the future, but do not currently meet the criteria of being a threat to dominate the site after thedisturbance.
Only limitations to reproductive capability are weather-related and natural disease or herbivory that reduces reproductive capability.
Mid+tall grasses > non-sprouting shrubs (except following fire, when non-resprouting shrubs become rare on the site)Shortgrasses > sprouting shrubs
Annual forbs, perennial forbsBiological crust will be present with lichen + moss cover of 10-15%After wildfires the funtional/structural dominance changes to the herbaceous components with a slow 10-20 year recovery of the non-resprouting shrubs (e.g. big sagebrush). Resprouting shrubs tend to increase until the sagebrush re-establishment and increase reduces the resprouting component. High levels of natural herbivory, extended drought, or combinations of these factors can increase shrub/functional/structural groups at the expense of the herbaceous groups and biological crust.
20 1 1/4

4ex–17(190–VI–NRPH, October 2006)
Exhibit 4–9 Rangeland health evaluation sheet
Evaluation area:Surface texture_________________________________Depth: very shallow shallow moderate deepType and depth of diagnostic horizons:1. ____________________ 3. ____________________2. ____________________ 4. ____________________Surf. efferv.: none v. slight slight strong violentTopographic position _________________ Aspect ______Seasonal distribution ______________________________
Soil/ site verification:Range/ecol. site descr., soil surv., and /or ecol.ref. area:Surface texture_________________________________Depth: very shallow shallow moderate deepType and depth of diagnostic horizons:1. ____________________ 3. ____________________2. ____________________ 4. ____________________Surf. efferv.: none v. slight slight strong violentParent material ______Slope _____ % Elevation _____ ft.Average annual precipation _____ inches
Recent weather (last 2 years) (1) drought (2) normal (3) wet
Wildlife use, livestock use (intensity and season of allotted use), and recent disturbances:_____________________________________________________________________________________________________________________________________________________________________________________________________________________________________________________________________________________________________________________________________________________________________________________________________________________________________________________________________________________________________________________________________________
Off-site influences on evaluation area:_____________________________________________________________________________________________________________________________________________________________________________________________________________________________________________________________________________________________________________________________________________________________________________________________________________________________________________________________________________________________________________________________________________
Criteria used to select this particular evaluation area as REPRESENTATIVE (specific info. and factors considered; degree of “representiveness”):
_____________________________________________________________________________________________________________________________________________________________________________________________________________________________________________________________________________________________________________________________________________________________________________________________________________________________________________________________________________________________________________________________________________
Other remarks (contiune on back if necessary):_____________________________________________________________________________________________________________________________________________________________________________________________________________________________________________________________________________________________________________________________________________________________________________________________________________________________________________________________________________________________________________________________________________
Reference: (1) Reference sheet: _______________ Author __________________________________ Creation date ____________
or (2) other (e.g., name and date of ecological site description; locations of ecological reference area(s) _______________________
_________________________________________________________________________________________________________
Aerial photo _______________________________________________________________________________________________
Management unit ___________________ State _____ Office _________________ Range/ecol. site code ____________________
Ecological site name __________________________ Soil map unit/component name ____________________________________
Observers _____________________________________________________________________ Date _______________________
Location (description) ________________________________________________________________________________________
T. _____ R. _____ or ______________N. lat. or UTM E ______________m Position by GPS? Y / N
Sec. _____, ______ ______________W. long. or N ______________m Photos taken? Y / N
Size of evaluation area _______________________________________________________________________________________
Composition (indicators 10 and 12) based on: Annual production Cover produced during current year or Biomass
UTM zone _____ Datum _____
Evaluation Sheet (front)
(Allotment or pasture)

4ex–18 (190–VI–NRPH, October 2006)
Exhibit 4–9 Rangeland health evaluation sheet—Continued
Departure from expected None to Slight Slight to Moderate Moderate Moderate to Extreme Extreme to Total
Indicator
1. Rills
2. Water-flow patterns
3. Pedestals and/or terracettes
4. Bar ground _______%
5. Gullies
6. Wind-scoured, blowouts, and/or deposition areas
7. Litter movement
8. Soil surface resistance to erosion
9. Soil surface loss or degradation
10. Plant community composition and distribution relative to infiltration
11. Compaction layer
12. Functional/structional groups
13. Plant mortality/decadence
14. Litter amount
15. Annual production
16. Invasive plants
17. Reproductive capability of perennial plants
Rating Comments
CodeN-SS-MM
M-EE-T
Instructions for evaluation sheet, page 2(1) Assign 17 indicator ratings. If indicator not present, rate None to Slight.(2) In the three grids below, write the indicator number in the appropriate column for each indicator that is applicable to the attribute.(3) Assign over rating for each attribute based on preponderance of evidence.(4) Justify each attribute rating in writing.
Evaluation Sheet (back)
E-T
S (10 indicators):Soil & Site Stability rating:_____________
Attribute ratingjustificationSoil & Site Stability:
M-E
HS
HS
HS
HS
S
S
S H B
S H
H
B
S H B
B
B
B
B
B
B
H
’
HS
M S-M N-S E-T
B (9 indicators):Biotic Integrityrating:_____________
Attribute ratingjustificationBiotic Integrity:
M-E M S-M N-SE-T
H (10 indicators):Hydrologic FunctionRating:_____________
Attribute ratingjustificationHydrologicFunction:
M-E M S-M N-S

4ex–19(190–VI–NRPH, October 2006)
Exhibit 4–9 Rangeland health evaluation sheet—Continued
Evaluation area:Surface texture_________________________________Depth: very shallow shallow moderate deepType and depth of diagnostic horizons:1. ____________________ 3. ____________________2. ____________________ 4. ____________________Surf. efferv.: none v. slight slight strong violentTopographic position _________________ Aspect ______Seasonal distribution ______________________________
Soil/ site verification:Range/ecol. site descr., soil surv., and /or ecol.ref. area:Surface texture_________________________________Depth: very shallow shallow moderate deepType and depth of diagnostic horizons:1. ____________________ 3. ____________________2. ____________________ 4. ____________________Surf. efferv.: none v. slight slight strong violentParent material ______Slope _____ % Elevation _____ ft.Average annual precipation _____ inches
Recent weather (last 2 years) (1) drought (2) normal (3) wet
Wildlife use, livestock use (intensity and season of allotted use), and recent disturbances:_____________________________________________________________________________________________________________________________________________________________________________________________________________________________________________________________________________________________________________________________________________________________________________________________________________________________________________________________________________________________________________________________________________
Off-site influences on evaluation area:_____________________________________________________________________________________________________________________________________________________________________________________________________________________________________________________________________________________________________________________________________________________________________________________________________________________________________________________________________________________________________________________________________________
Criteria used to select this particular evaluation area as REPRESENTATIVE (specific info. and factors considered; degree of “representiveness”):
_____________________________________________________________________________________________________________________________________________________________________________________________________________________________________________________________________________________________________________________________________________________________________________________________________________________________________________________________________________________________________________________________________________
Other remarks (contiune on back if necessary):_____________________________________________________________________________________________________________________________________________________________________________________________________________________________________________________________________________________________________________________________________________________________________________________________________________________________________________________________________________________________________________________________________________
Reference: (1) Reference sheet: _______________ Author __________________________________ Creation date ____________
or (2) other (e.g., name and date of ecological site description; locations of ecological reference area(s) _______________________
_________________________________________________________________________________________________________
Aerial photo _______________________________________________________________________________________________
Management unit ___________________ State _____ Office _________________ Range/ecol. site code ____________________
Ecological site name __________________________ Soil map unit/component name ____________________________________
Observers _____________________________________________________________________ Date _______________________
Location (description) ________________________________________________________________________________________
T. _____ R. _____ or ______________N. lat. or UTM E ______________m Position by GPS? Y / N
Sec. _____, ______ ______________W. long. or N ______________m Photos taken? Y / N
Size of evaluation area _______________________________________________________________________________________
Composition (indicators 10 and 12) based on: Annual production Cover produced during current year or Biomass
UTM zone _____ Datum _____
Evaluation Sheet (front)
(Allotment or pasture)Allotment 1, pasture 1 NM Las Cruces 042XB999NM
Limy Nickel gravelly fine sandy loam
Joe Smith, Jose Garcia, and Thaddeus Jones
Limy site two miles north of windmill in S.E. pasture
Evaluation area is approximately 3 acres and represents entire ecological site in this pasture
June 10, 2002
11 S 23W
12 NE 1/4
grfsl, grlfs, gl gfsl
Calcic horizon w/in 20”
Toeslope SouthSummer thunderstorms dominate
Calcic horizon at 15”
Alluv 0-5 4,1008-12
Wildlife use is dominated by pronghorn antelope in the winter. Livestock use was extremely heavy year long during 1900-1930.Last 50 years livestock use has been cow/calf moderate year long use.
None
Area is located near a pasture key area. It is located in the center of the ecological site and represents the typical amount of livestock,wildlife, and recreational uses on this area. This ecological site dominates this pasture. The area is 3/4 of mile from the closestwater source.
Limy SD-42B J. Christensen 3-23-2002Limy ecological site042XB999NM, June 2001

4ex–20 (190–VI–NRPH, October 2006)
Departure from expected None to Slight Slight to Moderate Moderate Moderate to Extreme Extreme to Total
Indicator
1. Rills
2. Water-flow patterns
3. Pedestals and/or terracettes
4. Bar ground _______%
5. Gullies
6. Wind-scoured, blowouts, and/or deposition areas
7. Litter movement
8. Soil surface resistance to erosion
9. Soil surface loss or degradation
10. Plant community composition and distribution relative to infiltration
11. Compaction layer
12. Functional/structional groups
13. Plant mortality/decadence
14. Litter amount
15. Annual production
16. Invasive plants
17. Reproductive capability of perennial plants
Rating Comments
CodeN-SS-MM
M-EE-T
Instructions for evaluation sheet, page 2(1) Assign 17 indicator ratings. If indicator not present, rate None to Slight.(2) In the three grids below, write the indicator number in the appropriate column for each indicator that is applicable to the attribute.(3) Assign over rating for each attribute based on preponderance of evidence.(4) Justify each attribute rating in writing.
Evaluation Sheet (back)
E-T
S (10 indicators):Soil & Site Stability rating:_____________
Attribute ratingjustificationSoil & Site Stability:
M-E
HS
HS
HS
HS
S
S
S H B
S H
H
B
S H B
B
B
B
B
B
B
H
HS
M S-M N-S E-T
B (9 indicators):Biotic Integrityrating:_____________
Attribute ratingjustificationBiotic Integrity:
M-E M S-M N-SE-T
H (10 indicators):Hydrologic FunctionRating:_____________
Attribute ratingjustificationHydrologicfunction:
M-E M S-M N-S
Active rill formation evident at infrequent intervals
Flow patterns show cutting and deposition and some connectivity
Pedestalling in flow patterns only not common
Bare ground rarely connected
Small litter shows sign of moderate movement, larger litter - slight movement
Stability values average from 3-4 on surfaces under vegetation canopy and 1-2 in interspacesSevere past erosion has left much of the site without much surface horizon
Change from grass dominated to shrub dominated has decreased infiltration and bare ground has increased run-off
Very little litter is on the site from the time of year and rainfall for the year
Subdominate group basically gone (warm-season stoloniferous grass and subdominate group (warm-season narrow leaf bunchgrass) and minor group (evergreen subshrub) have
Plants show some signs of stress that will reduce seed production and stolon production this yearS-M
2 3 58
1
M
Although there issome active erosionin flow patterns,most is old andhealing. Lots ofwater leaving thesite, but not mucherosion. All erosionoccurring as con-centrated flow.
Lots of waterleaving the site.Runoff is increasingand all litter is being washed away.
Shift in functionalstructural groupsis significant,justifying moderate rating.
M-E M
6479
11
2 3 58
1014
1114
8 13 1114
91612 15
179
N-S
N-S
N-S
N-S
S-M
M-E
M
S-M
S-M
M
M-E
M-E
M-E
M
M
M
Production is about 70 % of expected
Exhibit 4–9 Rangeland health evaluation sheet—Continued

4ex–21(190–VI–NRPH, October 2006)
Exhibit 4–10 Rangeland health evaluation matrix
State __________ Office____________________ Ecological site___________________________________Site ID_________________
Authors ________________________________________________________________________ Revision date____________________
Indicator* Extreme to Total Moderate to Moderate Slight to Moderate None to Slight Extreme
1. Rills ______________________________________________________________________________________ Reference Sheet:________________________________________________________________________________________________________________________________________________________________________________________________________________________________________________________________________________________________________________________________________________________________________________________________________________________________________________________________________________________________________________________________________________________________________________________________________________________________________________________________________________________________
Generic descriptor Rill formation is Rill formation is Active rill No recent formation Current or past severe and well moderately active formation is slight of rills; old rills formation of rills as defined throughout and well defined at infrequent have blunted or expected for the most of the site throughout most of intervals; mostly in muted features site the site exposed areas
2. Water flow patterns ________________________________________________________________________ Reference Sheet:_______________________________________________________________________________________________________________________________________________________________________________________________________________________________________________________________________________________________________________________________________________________________________________________________________________________________________________________________________________________________________________________________________________________________________________________________________________________________________________________________________________________________
Departure from Reference State of the Ecological Site
Evaluation Matrix
Generic descriptor Water flow patterns Water flow patterns Number and length Number and length Matches what is extensive and more numerous of water flow of water flow expected for the numerous; unstable and extensive patterns nearly patterns match what site; minimal with active erosion; than expected; match what is is expected for the evidence of past or usually connected deposition and cut expected for the site; some evidence current soil areas common; site; erosion is of minor erosion. deposition or occasionally minor with some flow patterns are erosion connected instability and stable and short deposition
3. Pedestals and/or ________________________________________________________________________ Reference Sheet:______terracettes ________________________________________________________________________________________________________________________________________________________________________________________________________________________________________________________________________________________________________________________________________________________________________________________________________________________________________________________________________________________________________________________________________________________________________________________________________________________________________________________________________
Generic descriptor Abundant active Moderate active Slight active Active pedestalling Current or past pedestalling and pedestalling; pedestalling; most or terracette evidence of numerous terracettes common. pedestals are in formation is rare; pedestaled plants or terracettes. Many Some rocks and flow paths and some evidence of rocks as expected rocks and plants plants are interspaces and/or past pedestal for the site. are pedestaled; pedestaled with on exposed slopes. formation, Terracettes absent exposed plant roots occasional exposed Occasional especially in water or uncommon are common roots terracettes present flow patterns on exposed slopes
* Descriptions for each indicator should be more specific than those listed in the generic descriptors, if possible, and refer to the criteria included in the none to slight description, which is based on the reference sheet (app. 1).

4ex–22 (190–VI–NRPH, October 2006)
Exhibit 4–10 Rangeland health evaluation matrix—Continued
Indicator* Extreme to Total Moderate to Moderate Slight to Moderate None to Slight Extreme 4. Bare ground _________________________________________________________________________ Reference Sheet:________________________________________________________________________________________________________________________________________________________________________________________________________________________________________________________________________________________________________________________________________________________________________________________________________________________________________________________________________________________________________________________________________________________________________________________________________________________________________________________________________________________________
Generic descriptor Much higher than Moderate to much Moderately higher Slightly to Amount and size of expected for the higher than than expected for moderately higher bare areas match site. Bare areas are expected for the the site. Bare areas than expected for that expected for large and generally site. Bare areas are of moderate the site. Bare areas the site connected are large and size and are small and occasionally sporadically rarely connected connected connected
8. Gullies ________________________________________________________________________ Reference Sheet:________________________________________________________________________________________________________________________________________________________________________________________________________________________________________________________________________________________________________________________________________________________________________________________________________________________________________________________________________________________________________________________________________________________________________________________________________________________________________________________________________________________________
Departure from Reference State of the Ecological Site
Evaluation Matrix cont.
Generic descriptor Common with Moderate in number Moderate in number Uncommon, Match what is indications to common with with indications of vegetation is expected for the active erosion and indications of active active erosion; stabilizing the bed site; drainages are downcutting; erosion; vegetation vegetation is and slopes; no represented as vegetation is is inermittent on intermittent on signs of active natural stable infrequent on slopes an/or bed. slopes and/or be. headcuts, channels; slopes and/or bed. Headcuts are Occasional nickpoints, or bed vegetation common Nickpoints and active; downcutting headcuts erosion and no signs of headcuts are is not apparent may be present erosion numerous and active 6. Wind scoured, _________________________________________________________________________ Reference Sheet:______blowout, and/or _____________________________________________________________________________________________depositional areas _________________________________________________________________________________________________________________________________________________________________________________________________________________________________________________________________________________________________________________________________________________________________________________________________________________________________________________________________________________________________________________________________________________________
Generic descriptor Extensive Common Occasionally Infrequent and few Match what is present expected for the site
* Descriptions for each indicator should be more specific than those listed in the generic descriptors, if possible, and refer to the criteria included in the none to slight description, which is based on the reference sheet (app. 1).

4ex–23(190–VI–NRPH, October 2006)
Indicator* Extreme to Total Moderate to Moderate Slight to Moderate None to Slight Extreme 7. Litter movement _______________________________________________________________________ Reference Sheet:______(wind or water) ______________________________________________________________________________________________________________________________________________________________________________________________________________________________________________________________________________________________________________________________________________________________________________________________________________________________________________________________________________________________________________________________________________________________________________________________________________________________________________________________________________
Generic descriptor Extreme; Moderate to Moderate Slightly to Matches that concentrated extreme; loosely movement of moderately more expected for the around obstructions. concentrated near smaller size classes than expected for site with a fairly Most size classes obstructions. in scattered the site with only uniform distribution of litter have been Moderate to small concentrations small size classes of litter displaced size classes of around obstructions of litter being litter have been and in depressions displaced displaced
8. Soil surface _________________________________________________________________________ Reference Sheet:______resistance to erosion ________________________________________________________________________________________________________________________________________________________________________________________________________________________________________________________________________________________________________________________________________________________________________________________________________________________________________________________________________________________________________________________________________________________________________________________________________________________________________________________________________
Departure from Reference State of the Ecological Site
Evaluation Matrix cont.
Generic descriptor Extremely reduced Significantly Significantly Some reduction in Matches that throughout the site. reduced in most reduced in at least soil surface stability expected for the Biological plant canopy half of the plant in plant interspaces site. Surface soil is stabilization agents interspaces and canopy interspaces, or slight reduction stabilized by including organic moderately reduced or moderately throughout the site. organic matter matter and beneath plant reduced throughout Stabilizing agents decomposition biological crusts canopies. the site reduced below products and/or a virtually absent Stabilizing agents expected biological crust present only in isolated patches 9. Soil surface loss ________________________________________________________________________ Reference Sheet:______of degradation _______________________________________________________________________________________________________________________________________________________________________________________________________________________________________________________________________________________________________________________________________________________________________________________________________________________________________________________________________________________________________________________________________________________________________________________________________________________________________________________________________
Generic descriptor Soil surface horizon Soil loss or Moderate soil loss Some soil loss has Soil surface absent. Soil structure degradation severe or degradation in occurred and/or horizon intact. Soil near surface is throughout site. plant interspaces soil structure structure and similar to, or more Minimal differences with some shows signs of organic matter degraded, than in soil organic degradation beneath degradation, content match that that in subsurface matter content and plant canopies. especially in plant expected for site horizons. No structure of surface Soil structure is interspaces distinguishable and subsurface degraded and soil difference in layers organic matter subsurface organic content is matter content significantly reduced
* Descriptions for each indicator should be more specific than those listed in the generic descriptors, if possible, and refer to the criteria included in the none to slight description, which is based on the reference sheet (app. 1).
Exhibit 4–10 Rangeland health evaluation matrix—Continued

4ex–24 (190–VI–NRPH, October 2006)
Exhibit 4–10 Rangeland health evaluation matrix—Continued
Indicator* Extreme to Total Moderate to Moderate Slight to Moderate None to Slight Extreme
10. Plant community _________________________________________________________________________ Reference Sheet:______composition and ____________________________________________________________________________________________distribution relative _____________________________________________________________________________________________to infiltration and runoff __________________________________________________________________________________________________________________________________________________________________________________________________________________________________________________________________________________________________________________________________________________________________________________________________________________________________________
Generic descriptor Infiltration is Infiltration is greatly Infiltration is Infiltration is slightly Infiltration and severely decreased decreased due to moderately to moderately runoff are not due to adverse adverse changes reduced due to affected by minor affected by any changes in plant in plant community adverse changes changes in plant changes in plant community composition and/or in plant community community community composition and/or distribution. composition and/or composition and/or composition and distribution. Detrimental plant distribution. Plant distribution. Plant distribution. Any Adverse plant cover changes cover changes cover changes changes in cover changes have occurred negatively affect have only a minor infiltration and have occurred infiltration effect on infiltration runoff can be attributed to other factors (e.g. compaction)
11. Compaction _____________________________________________________________________________ Reference Sheet:______layer (below soil___________________________________________________________________________________________________surface)____________________________________________________________________________________________________________________________________________________________________________________________________________________________________________________________________________________________________________________________________________________________________________________________________________________________________________________________________________________________________________________________________________________________________
Departure from Reference State of the Ecological Site
Evaluation Matrix cont.
Generic descriptor Extensive; severely Widespread; Moderately wide- Rarely present or is Matches that restricts water greatly restricts spread, moderately thin and weakly expected for the movement and roof water movement restricts water restrictive to water site; none to penetration and root movement and root movement and root minimal, not penetration penetration penetration restrictive to water movement and root penetration
* Descriptions for each indicator should be more specific than those listed in the generic descriptors, if possible, and refer to the criteria included in the none to slight description, which is based on the reference sheet (app. 1).
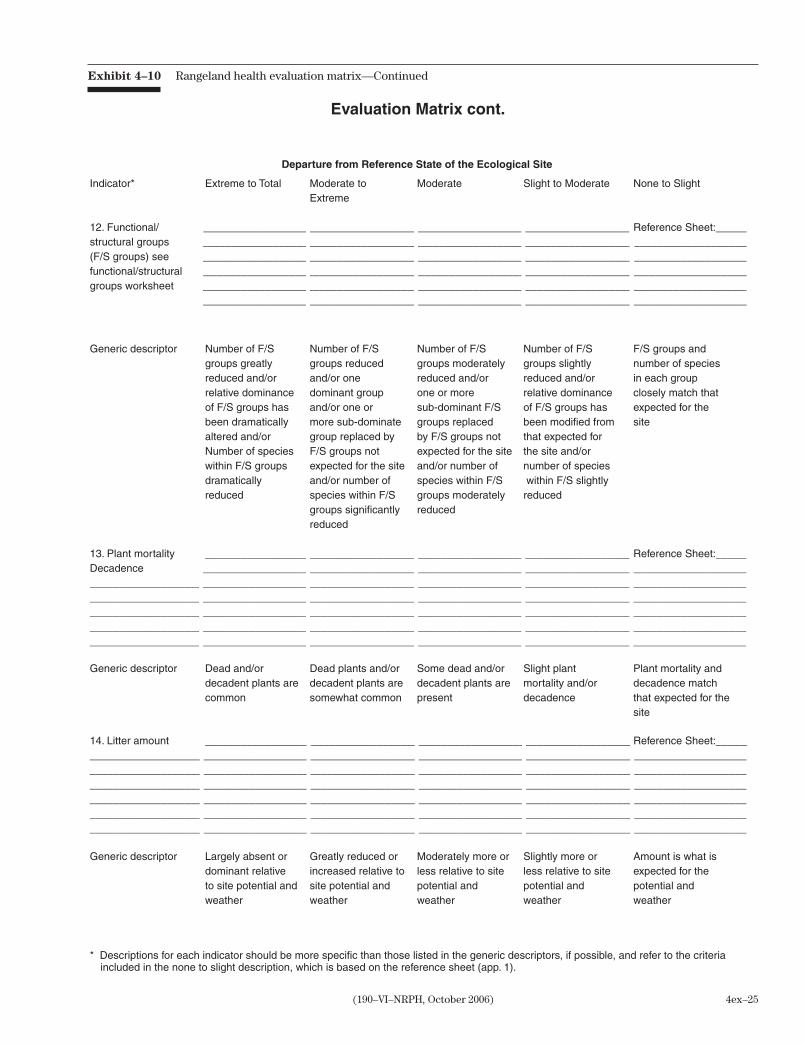
4ex–25(190–VI–NRPH, October 2006)
Exhibit 4–10 Rangeland health evaluation matrix—Continued
Indicator* Extreme to Total Moderate to Moderate Slight to Moderate None to Slight Extreme
12. Functional/ ________________________________________________________________________ Reference Sheet:______structural groups _____________________________________________________________________________________________(F/S groups) see _____________________________________________________________________________________________functional/structural _____________________________________________________________________________________________groups worksheet _____________________________________________________________________________________________ _____________________________________________________________________________________________
Generic descriptor Number of F/S Number of F/S Number of F/S Number of F/S F/S groups and groups greatly groups reduced groups moderately groups slightly number of species reduced and/or and/or one reduced and/or reduced and/or in each group relative dominance dominant group one or more relative dominance closely match that of F/S groups has and/or one or sub-dominant F/S of F/S groups has expected for the been dramatically more sub-dominate groups replaced been modified from site altered and/or group replaced by by F/S groups not that expected for Number of species F/S groups not expected for the site the site and/or within F/S groups expected for the site and/or number of number of species dramatically and/or number of species within F/S within F/S slightly reduced species within F/S groups moderately reduced groups significantly reduced reduced 13. Plant mortality ________________________________________________________________________ Reference Sheet:______Decadence ________________________________________________________________________________________________________________________________________________________________________________________________________________________________________________________________________________________________________________________________________________________________________________________________________________________________________________________________________________________________________________________________________________________________________________________________________________________________________________________________________
14. Litter amount ________________________________________________________________________ Reference Sheet:________________________________________________________________________________________________________________________________________________________________________________________________________________________________________________________________________________________________________________________________________________________________________________________________________________________________________________________________________________________________________________________________________________________________________________________________________________________________________________________________________________________________
Departure from Reference State of the Ecological Site
Evaluation Matrix cont.
Generic descriptor Dead and/or Dead plants and/or Some dead and/or Slight plant Plant mortality and decadent plants are decadent plants are decadent plants are mortality and/or decadence match common somewhat common present decadence that expected for the site
Generic descriptor Largely absent or Greatly reduced or Moderately more or Slightly more or Amount is what is dominant relative increased relative to less relative to site less relative to site expected for the to site potential and site potential and potential and potential and potential and weather weather weather weather weather
* Descriptions for each indicator should be more specific than those listed in the generic descriptors, if possible, and refer to the criteria included in the none to slight description, which is based on the reference sheet (app. 1).

4ex–26 (190–VI–NRPH, October 2006)
Exhibit 4–10 Rangeland health evaluation matrix—Continued
Indicator* Extreme to Total Moderate to Moderate Slight to Moderate None to Slight Extreme
15. Annual ________________________________________________________________________ Reference Sheet:______production _________________________________________________________________________________________________________________________________________________________________________________________________________________________________________________________________________________________________________________________________________________________________________________________________________________________________________________________________________________________________________________________________________________________
Generic descriptor Less than 20% of 20-40% of potential 40-60% of potential 60-80% of potential Exceeds 80% of potential production production for the production for the production for the potential production for the site based site based on recent site based on recent site based on recent for the site based on recent weather weather weather weather on recent weather 16. Invasive plants ________________________________________________________________________ Reference Sheet:________________________________________________________________________________________________________________________________________________________________________________________________________________________________________________________________________________________________________________________________________________________________________________________________________________________________________________________________________________________________________________________________________________________________________________________________________________________________________________________________________________________________
17. Reproductive ________________________________________________________________________ Reference Sheet:______Capability of _____________________________________________________________________________________________Perennial plants _____________________________________________________________________________________________(native or seeded __________________________________________________________________________________________________________________________________________________________________________________________________________________________________________________________________________________________________________________________________________________________________________________________________________________________________________
Departure from Reference State of the Ecological Site
Evaluation Matrix cont.
Generic descriptor Dominate the site Common throughout Scattered throughout Present primarily in If present, the site the site disturbed areas composition of within the site invasive species, matches that expected for the site
Generic descriptor Capability to Capability to Capability to Capability to Capability to produce seed or produce seed or produce seed or produce seed or produce seed or vegetative tillers is vegetative tillers is vegetative tillers is vegetative tillers is vegetative tillers is severely reduced greatly reduced moderately reduced slightly reduced not reduced relative to recent relative to recent relative to recent relative to recent relative to recent climatic conditions climatic conditions climatic conditions climatic conditions climatic conditions
* Descriptions for each indicator should be more specific than those listed in the generic descriptors, if possible, and refer to the criteria included in the none to slight description, which is based on the reference sheet (app. 1).