chapter 15 - tight gas sandstone reservoirs, part 2: petrophysical
TRANSCRIPT

TIGHT GAS SANDSTONERESERVOIRS, PART 2:PETROPHYSICAL ANALYSISAND RESERVOIR MODELING
15W.R. Moore1, Y. Zee Ma1, I. Pirie1, Y. Zhang2
Schlumberger, Denver, CO, USA1; University of Wyoming, Laramie, WY, USA2
15.1 INTRODUCTIONWe discuss petrophysical analysis of wireline logs, methods for formation evaluation and issues inevaluating tight sandstone formations. The main concerns of log interpretation in tight gas sandstonesinclude porosity interpretation, understanding the effect of clay on the log responses, accuratecomputation of water saturation, and permeability determination (Kukal et al., 1985). Moreover,validation of wireline-based petrophysics with routine and special core analysis, well tests, andpetrography is often needed to develop a reliable interpretation model.
Petrophysical analysis can help evaluate the hydrocarbon potential, estimate gas in place and, tosome extent, producibility of tight gas sands; completion technique and effort drive the economicviability for each play. Many tight gas sandstone formations are known as “tease” intervalsdthere isa gas show or gas kick but no or little production occurs on a conventional test. Improved tech-nology in drilling and completion has made it possible to produce gas from many tight sandstonereservoirs. An appropriate stimulation program is critical to make wells economic in these types ofreservoirs.
For optimal development of a field, a reservoir model that integrates all the data can be extremelyvaluable for planning the drilling, completion, and production design. The integrated data shouldinclude geological (including depositional and lithofacies such as discussed in the previous chapter),petrophysical, and engineering data. In this chapter, we first review some common issues in petro-physical analysis of wireline logs in tight gas sandstones. We then discuss the three main reservoirproperties based on well logs and core data, including porosity, permeability, and water saturation. Thethree-dimensional (3D) modeling of these properties is presented to populate the reservoir modelbased on data from the wells. Issues in dynamic modeling of tight-gas sandstone reservoirs are alsodiscussed.
CHAPTER
Unconventional Oil and Gas Resources Handbook. http://dx.doi.org/10.1016/B978-0-12-802238-2.00015-8
Copyright © 2016 Elsevier Inc. All rights reserved.429

15.2 COMMON ISSUES IN PETROPHYSICAL ANALYSIS OF TIGHT GASSANDSTONES
Wireline logs in tight gas sandstones may include basic and high-tier logs. Basic logs are the triple orquad combination of neutron porosity, density porosity, resistivity, sonic velocity, and g-ray logs. As inconventional reservoirs, the basic logs can be quite effective in determining some reservoir parameters.However, light hydrocarbon and clay effects may be exacerbated because of the abnormal pressure andlow porosity. These problems need to be corrected for in characterizing tight gas sandstone reservoirs.
The spontaneous potential log (SP) is a basic measurement that may be available and useful, butoften the deflection from baseline values is minimal or difficult to interpret. The SP deflection from abaseline can indicate permeability and be used to estimate connate water resistivity. In oil-based muds,typical of drilling, the spontaneous potential log is rendered useless by the mud system.
High tier logs may include spectral g-ray, elemental spectroscopy, two-dimensional (2D) and3D acoustic dipole velocity, nuclear magnetic resonance, and dielectric measurements. Spectralg-ray measurements can identify the presence of uranium and help in clay typing and detection ofreservoir zones. Elemental spectroscopy tools can be used to determine the percentage of mineralsin the rock composition so that porosity and clay volume can be calculated more accurately. 2Dand 3D acoustic dipole logs can show anisotropy and the shear-compressional data can be used as adirect hydrocarbon indicator. Nuclear magnetic resonance (NMR) data can be used as an inde-pendent porosity measurement, but can be affected by gas and light hydrocarbons. Density mag-netic resonance processing is commonly used in tight gas to correct the NMR porosity andsubsequent permeability estimate in the presence of gas (low hydrogen index). Dielectric logs canbe used to determine water saturations using an external porosity. Work has shown that nuclearmagnetic resonance and dielectric dispersion logging can be used to determine fluid types,permeability, and residual saturations (Al-Yaarubi et al., 2014).
In tight-gas sandstones, borehole washouts and rugosity can be a problem that affects all logs. Inexploration areas, the log data may be old, the tight gas interval was not a zone of interest, and key datamay be missing or difficult to interpret. Figure 15.1 is an example that shows washouts and a tensionpull producing invalid readings in a well. Approximately 120 ft out of the 200 ft interval has beenaffected by the log pull or washouts. These need to be identified and corrected by using repeat runs thathave useable data over the same interval.
The g-ray measurement can be affected by kerogen and radioactivity not related to clay content(Ma et al., 2014a). Due to shallow invasion in many tight gas sands, neutron porosity deficit can be avery good indicator of formation gas. Excessive neutron porosity or neutron-density cross plots can bevery useful as a shale/clay indicator. An overlay of the neutron porosity and g-ray measurement can beused as a clay/pore fluid indicator. In the gas bearing part of the reservoir, the neutron porosity isusually lower than the g-ray measurement. At the top of the reservoir, the presence of water can flipthis relationship and can be used to pick the top of the pervasive or sustained gas. This technique can bevery useful for thick intervals of stacked sandstones, but it is not really applicable for individual orlimited sandstone deposits. While this technique may not always be precise, it can be a quick way toevaluate a thick stacked sandstone interval. Figure 15.2 illustrates the procedure.
430 CHAPTER 15 TIGHT GAS SANDSTONE RESERVOIRS, PART 2

Because there can be limited invasion in tight gas reservoirs due to low permeability and possiblyhigher pressure, the neutron and density porosities will need to be corrected for light hydrocarbonand gas effects. If there are differing data types from well to well, the data may need to be standardizedto get a basis of comparison. Environment of deposition, rock type, and borehole size should all beconsidered in performing the standardization.
Figures 15.3–15.6 are plots of g-ray, resistivity, and neutron and density porosity over stackedsandstone pay and blanket sandstone for some example intervals. They illustrate a variety of logsignatures in tight gas sandstone intervals.
Figure 15.3 shows a 5000 ft interval of overpressured stacked sandstones in the Lanceformation from Pinedale in the Greater Green River basin, Wyoming. The g-ray, neutron porosity,resistivity, and density porosity all show fairly large deflections due to the moderate to high claycontent.
Figure 15.4 is a 3000 ft interval of a normal to underpressured stacked sandstone in the MesaVerde formation from the Piceance basins in Colorado. The g-ray, resistivity, and neutron porositydeflections reflect less clay content.
Figure 15.5 illustrates a 1300 ft interval of a slightly over to under-pressured stacked sandstonesin the Travis Peak formation from the East Texas Basin in Texas. The formation is fairly clean, andthere is much less clay effect on the logs.
Figure 15.6 shows a 300 ft interval of blanket sandstones in the Frontier formation of the PowderRiver Basin in Wyoming. The formation is slightly overpressured and contains a moderate amount ofclay.
FIGURE 15.1
Typical bad hole problems.
15.2 COMMON ISSUES IN PETROPHYSICAL ANALYSIS OF TIGHT GAS 431
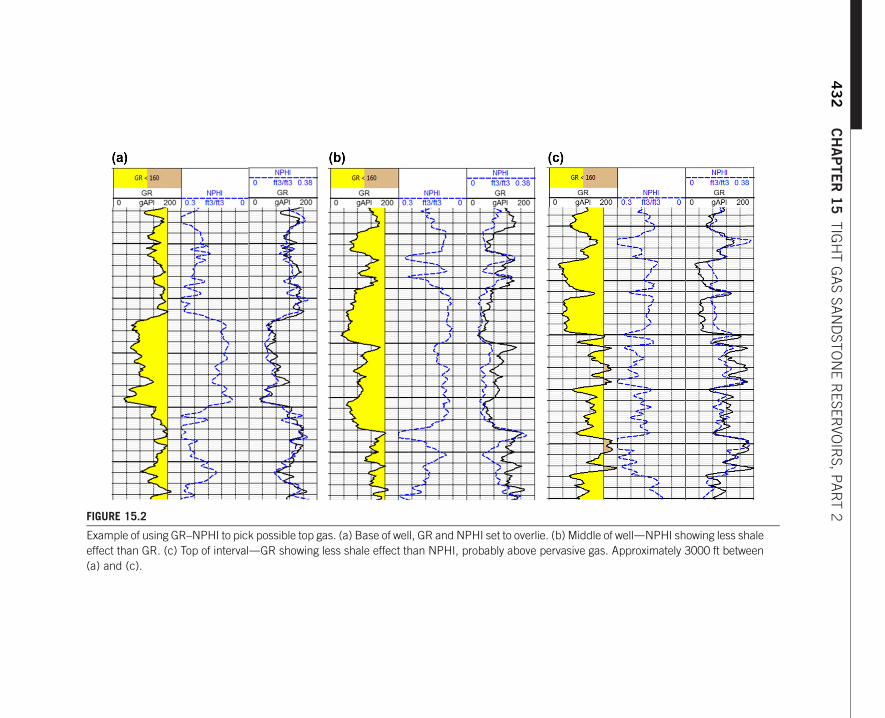
FIGURE 15.2
Example of using GR–NPHI to pick possible top gas. (a) Base of well, GR and NPHI set to overlie. (b) Middle of welldNPHI showing less shale
effect than GR. (c) Top of intervaldGR showing less shale effect than NPHI, probably above pervasive gas. Approximately 3000 ft between
(a) and (c).
432
CHAPTER15
TIGHTGASSANDSTONERESERVOIRS,PART2
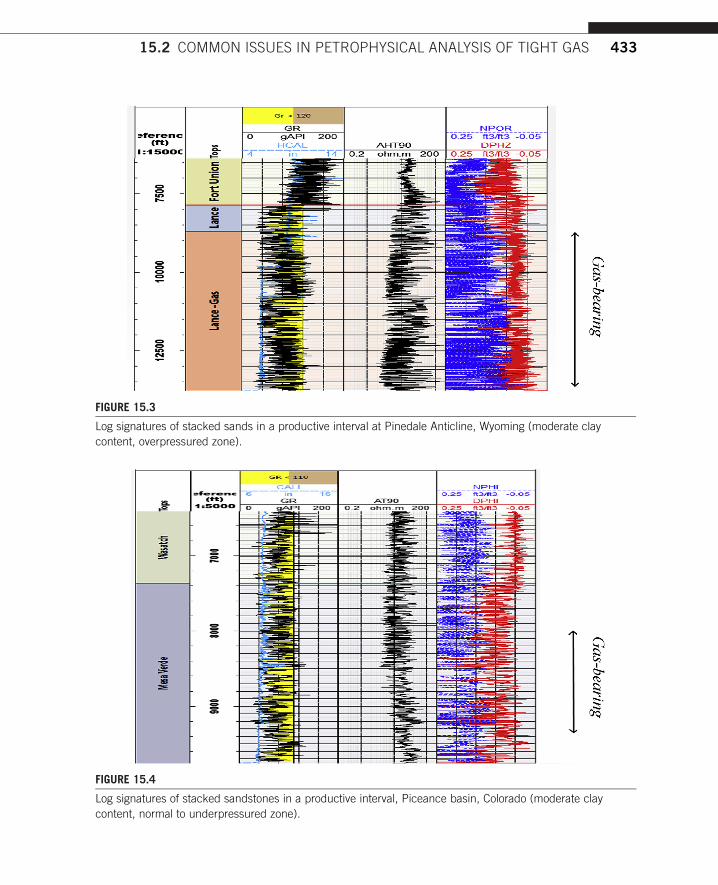
FIGURE 15.3
Log signatures of stacked sands in a productive interval at Pinedale Anticline, Wyoming (moderate clay
content, overpressured zone).
FIGURE 15.4
Log signatures of stacked sandstones in a productive interval, Piceance basin, Colorado (moderate clay
content, normal to underpressured zone).
15.2 COMMON ISSUES IN PETROPHYSICAL ANALYSIS OF TIGHT GAS 433

FIGURE 15.5
Log signatures of stacked sands in a productive interval of the Travis Peak formation in the East Texas Basin
(minimal clay content, somewhat overpressured to underpressured zones).
FIGURE 15.6
Log signatures of blanket sands in a productive interval of the Frontier formation of the Powder River basin,
Wyoming (moderate clay, slightly overpressured zone).
434 CHAPTER 15 TIGHT GAS SANDSTONE RESERVOIRS, PART 2
15.3 PETROPHYSICAL ANALYSIS FOR RESERVOIR PROPERTIESThe main reservoir properties calculated from wireline logs typically include porosity, fluid saturation,and permeability. Interpretations of these properties using wireline logs and core are discussed here.
15.3.1 POROSITYTotal porosity is considered to be the combination of intergranular connected porosity, isolated(nonconnected) porosity, and apparent clay porosity. Effective porosity is considered to be the inter-granular connected porosity. Porosity in tight gas sandstones usually ranges from 2% to 12%. Throughdiagenesis, the primary porosity may be reduced in the primary pore system by quartz overgrowths, andsecondary porosity may be produced in feldspars or clays. The best reservoir may not equate to thecleanest because the cleanest formations often represent low porosity and producibility. (Byrnes, 1997).
The use of logs in tight gas sand analysis is in general similar to those of conventional reservoirs.Two major methods are used to derive porosity from wireline logs. The traditional method is tocalculate effective porosity and water saturation through the environmentally corrected logs using aclay volume log, usually calculated from g-ray, neutron porosity, or a combination of logs. Thecombinations of basic logs (density porosity–neutron porosity–sonic velocity–g-ray measurements)can be quite effective in evaluating the porosity, but the interpretation can be enhanced by the use ofcore data and high tier logs. Many analysts use density porosity alone calculated from the bulk densitywith a variable grain matrix to correct for mineral composition (pyrites and clay minerals) and a fluiddensity lower than 1 to compensate for incomplete flushing in the measurement zone. This procedurecan be used to generate acceptable values for effective formation porosity (Byrnes and Castle, 2000).However, only a limited number of minerals (pyrite, kerogen, quartz) can be confidently modeledusing a basic log suite. In the multimineral method, the environmentally corrected logs are used in themodel that defines the mineral and fluid types, and their log end points. Mineral types and volumes,porosity, and saturation are calculated to fit the input data in the model. The traditional method issimpler to implement but it does not explicitly account for mineral variations. The multimineralmethod is more complex as it requires more information to define mineral types and end points.
Total porosity from log interpretations in tight gas sandstones can appear to be high due to the effectof clay on the neutron porosity and sonic velocity measurements. In many areas, washouts and rugoseboreholes resulting from over or under pressure can affect the log readings and make interpretationdifficult, especially for density porosity. The typical response to borehole problems or increased mud gasis to raise mud weight, which can lead to even more washouts and borehole problems. Therefore,environmental corrections (borehole size, pressure, fluid type, salinity, and temperature) should beperformed on all logs to get the most appropriate data set for analysis (Holditch, 2006; Moore et al.,2011). Figure 15.7 summarizes the general relationships between log measurements, core measurements,pore types, clay, rock framework, and fluid types based on an earlier study by Eslinger and Pevear (1988).
Core data can be used to validate the porosity interpretation from logs. In clean zones, the log andcore should give similar readings, but these are often low porosity intervals. Sometimes, the betterreservoirs could be the “shalier” zones. The g-ray could be higher due to uranium from kerogen, or ifporosity could be developed from the degradation of higher g-ray rocks like feldspar. The core can guidebuilding the interpretation model and the parameter selection used in these zones. Core porosity can bebetween the total and effective porosities depending on how the core was treated during the acquisitionand analysis. Core analysis results are not absolute and can vary by laboratory (Luffel and Howard,1987) or by the technique used (Morrow et al., 1991). Incidentally, how cores are treated prior to analysiscan significantly affect the measured absolute and relative permeability (Morrow et al., 1991). If
15.3 PETROPHYSICAL ANALYSIS FOR RESERVOIR PROPERTIES 435

the available data is from older, publically available reports with unknown or undocumented methods,the error in core porosity may be unacceptable.
In tight gas sandstones, the total porosity calculated from logs is typically a little higher than themeasured core porosity and the effective porosity calculated from logs is close to or a little lower thanthe measured core porosity. However, a number of variables may affect the core-log porosity re-lationships. When clay content is low, the total porosity calculated from logs is usually higher thanmeasured core porosity and the effective porosity calculated from logs can be a little higher tosomewhat lower than measured core porosity. When the clay content (feldspar decompositiondhighillite, chlorite, and swelling clays) is high, the total porosity calculated from logs tends to be muchhigher than the measured core porosity and the effective porosity calculated from logs may be higherthan the measured core porosity. The significant presence of heavy minerals (pyrite, siderite, dolomiteand calcite) in the matrix or cement can affect the above stated core-log porosity relationships as well.A multimineral model can be used to correct the variable compositions, but often there is not enoughspecial core analysis data (such as XRD–FTIR–XRF) or enough log data (such as spectroscopy) todifferentiate the minerals.
In summary, common issues related to porosity interpretation in tight gas sandstones include:
1. Invasion can be shallow due to low permeability and generally high formation pressure, so thecorrection of logs for gas effect can be important.
2. Presence of heavy minerals, even at low volumes, can reduce the calculated porosity if notaccounted for.
3. The cleanest intervals may be the tightest due to diagenetic factors, and may not be the bestreservoir.
FIGURE 15.7
Porosity relationships among log measurements, core, pores, and fluids (modified from Eslinger and Pevear,
1988).
436 CHAPTER 15 TIGHT GAS SANDSTONE RESERVOIRS, PART 2

4. In stacked sandstone intervals, it is important to identify the top of overpressured gas when it ispresent, because the important parameters in the analysis (water salinity, Archie m and n, shale/clay points) may change at that point.
5. Washouts, rugose hole, and log-pull blind spots are common in tight gas intervals, and bad holemodels need to be used over them where repeat passes fail to provide usable data.
15.3.2 FLUID SATURATIONSCommon issues in analyzing fluid saturations for tight gas sandstones include:
1. Irreducible water saturations can be high and may vary greatly depending on rock type.2. Often, there is not much water production from tight gas sandstones even when estimated water
saturations are high, and the water produced may be low salinity vapor from the gas phase. Usingthe parameters derived from traditional methods in a tight shaly sandstone, the Archie saturationequation may give abnormally high water saturation values. In this case, core capillary pressureversus water saturation curves correlated to actual production can be used to back out a salinityvalue that may be more representative.
3. While most tight gas sandstones do not produce a lot of water even for high water saturationzones, there can be higher porosity and permeability intervals that can.
4. Salinity may be variable over thick sections of tight gas sandstones.
Irreducible water saturation in tight gas sandstones can be quite high, and connate water resistivitycan be variable. Because the Archie equation for computing water saturation was developed in the labfrom empirical data in high porosity clean sandstones, using it to calculate water saturation in tight gassandstone intervals can give inaccurate results. The exponents in the Archie equation are usuallyunknown, and the clay content used to correct the logs to use in the equation can be overestimated orunderestimated. Clay corrected Archie equations (like Simandoux, Indonesian, and Dual Water) areoften used but suffer from the uncertainties. Using log data alone for irreducible water saturation is lessreliable; it is better to use core analysis (mercury injection capillary pressure measurements) to guidewhat the particular capillary characteristics of a producible zone are. Adjusting saturation parametersto align with capillary pressure measurements and production results can be very useful in interpretingthe formation interval. The saturation and cementation exponents, m and n, from core data can be veryhelpful when available but should be used with caution due to core handling/analysis inconsistenciesas discussed above. Figure 15.8 is an example of core measured Archie exponent m versus coreporosity in a stacked sandstone interval. A linear or nonlinear fit can be used to calculate a variable,m, but confidence in the correlation, as indicated by the data scatter, will be low. More accuraterelationships could be developed for different rock types, flow regimes, and lithofacies.
In stacked sandstone intervals, it is common to have a top sustained gas point at which abnormalpressure exists below it and normal or under pressure exists above it. Using different analysis pa-rameters for the zone above the sustained gas point (salinity, Archie’s m and n, clay points) can givemore plausible results. Often, the formation water salinity will decrease, and Archie’s m and n pa-rameters will increase above the gas zone; thus keeping the parameters constant may result in falseindications of hydrocarbons. Different methods can be used to pick this pointdan increase in mud gas,an increase in connection gas, and divergence of normalized GR/NPHI (gamma ray and neutronporosity) overlay are commonly used. There are many parameters for the analysis of tight gas intervals
15.3 PETROPHYSICAL ANALYSIS FOR RESERVOIR PROPERTIES 437

that depend on the fluid, pressure and rock type. Among them are neutron porosity corrections, densityand sonic fluid corrections, and Archie m and n values.
Saturation history and not just current calculated saturation, can also affect production. Thereservoir model may need to incorporate static (rock types) and dynamic (flow units) conditions to geta true picture of its viability (Kaye et al., 2013; Spain et al., 2013). If the area involved has a history ofmultiple burials or diagenetic events, saturation history should be investigated to understand pro-duction. Multiple instances of imbibition and drainage can affect the saturation and relative perme-ability of the reservoir, and may be important in reservoir development.
Capillary pressure curves can be important in defining reservoir types. Figure 15.9 illustratescapillary pressuredwater saturation relationships that are typical in tight gas sandstones. There arethree capillary pressure-water saturation relationships. The sweet spot sandstones are conventionalreservoir sandstones within the thicker interval of tight gas sandstones, and show the lowest irre-ducible water saturation (15–20%) along with the lowest capillary pressure profile. The tight gassandstones have higher irreducible water saturation (50%) and a higher capillary pressure. The shaleand siltstones show the highest irreducible water saturation (more than 60%) and highest capillarypressure.
The tight gas sandstones could have relatively high water saturation but still be capable of waterfree gas production.
FIGURE 15.8
Cross plot of core porosity (horizontal axis) versus measured core Archie m (vertical axis) in a tight gas stacked
sandstone interval. Red (gray in print versions) line shows a linear fit, and blue (dark gray in print versions)
shows a nonlinear fit.
438 CHAPTER 15 TIGHT GAS SANDSTONE RESERVOIRS, PART 2

15.3.3 PERMEABILITYLow permeability is a characteristic of tight gas sandstones, and it is generally less than 0.1 mD, oftenbetween 0.0001 and 0.01 mD. The permeability may correlate to porosity, rock type, mineralogy,stratigraphy, and other variables. Core permeability data can be used to derive a correlation betweenpermeability and other petrophysical variables, but there is often a complex interplay among thesevariables in the low permeability of tight gas sandstones. Pressure, stress, rock type, diagenesis andnatural fractures can all impact permeability. Sometimes, multiple porosity and permeabilityrelationships may be necessary to correctly characterize the permeability (Kukal and Simons, 1985;Wells and Amaefule et al., 1985; Luffel et al., 1989; Davies et al., 1991; Deng et al., 2013).
Small scale tests (wireline or drill stem) can be useful in validating permeability and porosity–permeability relationships, but it may take a thorough fracture treatment, extended flow and buildupanalysis to properly evaluate the permeability and porosity–permeability relationships of a tight gassandstone interval. Higher permeability and porosity zones within a larger interval may also be waterproductive.
The measured gas permeability from core needs to be corrected for Klinkenberg effect for gas slip-page. In a twophasegas–water reservoir fluid system, relative permeability as a functionof fluid saturationdrives the fluid production, which is especially pronounced when the absolute matrix permeability is inthemicroDarcy range, such as in tight sandstones. The accuratemeasurement or prediction of gas effectivepermeability as a function of water saturation can maximize gas production and control water cut.
Cluff and Cluff (2004) illustrated how to use core permeability measurements at reservoir netconfining stress versus core measurements at some minimum confining stress for their permeabilitycorrelation. More typically, however, data sets contain only air permeability and Klinkenberg corrected
FIGURE 15.9
Conceptual models of capillary pressure versus water saturation (horizontal axis) for three different reservoir
types.
Adapted from Burnie et al. (2008).
15.3 PETROPHYSICAL ANALYSIS FOR RESERVOIR PROPERTIES 439

permeability values. Figure 15.10(a) is a multiwell core data set showing the spread that is present inmany real datasets. The air permeability has not been reported with the same precision as the Klin-kenberg permeability, and there is uncertainty in the correlation. Figure 15.10(b) uses a best fit linethrough all the data which tends to give an optimistic permeability. Figure 15.10(c) eliminates the lowerpermeability data, and is probably only representative of sweet spots within the tight gas interval. Theselected low permeability data give a more realistic interpretation (Fig. 15.10(d)). The most appropriatesolution is a combination of the models in Figs 15.10(c) and (d) using rock typing or another modelingtechnique for a more accurate correlation. Without enough knowledge, the correlations can be subjec-tive, and care needs to be taken to select the appropriate data. If a permeability cutoff is used for paydetermination, it should be recognized that the correlation may carry a large uncertainty in the model,leading to an uncertain estimate of the recovery, and possibly impacting the completion design.
FIGURE 15.10
(a) A typical core air permeability to Klinkenberg permeability dataset. (b) Using all the data for a correlation.
(c) Nonmagenta points are tight gas rocks, as a subset of the data for a correlation. (d) Green (light gray in
print versions) points are tight-gas rocks, as a subset of the data for correlation. Note: red lines (dark gray in
print versions) are one-to-one fits as a reference.
440 CHAPTER 15 TIGHT GAS SANDSTONE RESERVOIRS, PART 2

15.3.4 DISCUSSION ON PETROPHYSICAL INTERPRETATIONSThere are a number of strategies for planning the evaluation of exploration or delineation wells.If washouts and rugose borehole are a problem, a geomechanical evaluation can be made to generate asafe mud weight window, which can help keep the borehole pressures balanced and the washouts to aminimum so that the traditional triple combo logs are not so adversely affected by the washouts.Repeat logs or down logs over these intervals may be necessary to get useable data. High tier logs canbe acquired for better reservoir analysis. If core data is lacking or the existing core data measurementsare of uncertain quality, more core data will be needed.
The interpretation of porosity from wireline logs can be reconciled with core data, which can thenbe used for model development. Along with routine core analysis, special core analysis should beperformed to build a model: XRD–FTIR–XRF for mineralogy, mercury injection for rock typing,geomechanics testing to help calibrate the mechanical earth models and improve hydraulic stimulationdesign. For stacked sandstones over a thick interval, it may be important to analyze as many data pointsas possible, as the pressure regime may change over the interval.
Often there are just a few wells with core data, common and specialty logs, wherein either thetraditional or multimineral method can be used to get the best analysis possible. The petrophysicalmodel can then be simplified and applied to wells with less complete log suites and no core data.It is important that the core data distribution in both areal and vertical directions be as complete aspossible to ensure adequate rock description. Rock typing can be very important to petrophysicalparameter selection (Chapin et al., 2009; Liu et al., 2012). There can be sweet spots dispersedthroughout the tight gas interval, and the tight gas zone parameters may not all be similar. Using thecore data to constrain the calculated log porosity is generally a good practice, especially in caseswhere log data are limited. If there is not adequate core data for rock types, errors in porosity can bequite substantial. Where there is adequate delineation and validation, rock typing can enhance thereservoir characterization.
In summary, the analyst needs to tailor the log interpretation to fit the available data. Grossreservoir properties are fairly easy to determine, but it is the determination of what is net that requiresthe integration of the reservoir and petrophysical data to derive a relationship to production. High tierlog data, if present, can be used to further refine the log interpretation model. While there is no absolutecombination of basic and high tier logs that works all the time, each can be important and should beinvestigated for a given reservoir to determine its effectiveness. Using a comprehensive suite of logmeasurements can improve the interpretation and evaluation of the reservoir.
15.4 THREE-DIMENSIONAL MODELING OF RESERVOIR PROPERTIESSome of the most important reservoir properties include porosity, fluid saturation, and permeability,of which porosity is the most basic variable that describes the pore space for fluid storage in thesubsurface formation. Analysis and interpretation of core and well-log data describe reservoircharacteristics at or near the wellbores, but hydrocarbon resource and production also depend on thedistribution of reservoir properties in the field away from the wells. 3D modeling of main reservoirproperties enables the calculations of field-wide pore volume and hydrocarbon pore volume, andevaluation of the heterogeneities of reservoir properties.
15.4 THREE-DIMENSIONAL MODELING OF RESERVOIR PROPERTIES 441

Because porosity is one of the most basic reservoir variables and its data are generally moreavailable and reliable than fluid saturation and permeability data, porosity is typically modeled beforemodeling water saturation and permeability. When lithofacies or depositional facies models areavailable (discussed in the previous chapter), the porosity model should be constrained to the lith-ofacies or depositional facies model. This is because in the hierarchy of multiple scales of reservoirheterogeneities, characteristics of petrophysical properties are controlled by geologic facies or lith-ofacies (Ma et al., 2009). Geostatistical methods for modeling porosity include kriging and stochasticsimulation, and they can be used with the lithofacies model as a constraint (Cao et al., 2014).
In tight gas sandstones, porosity, fluid saturation, and permeability are generally correlated with thelithofacies, and they are also correlated between themselves (Ma et al., 2011). Because of the cor-relation with porosity, fluid saturation, and permeability should be modeled in relation to porosity.Researchers often focus on using correlation for prediction; in fact, an accurate modeling of thecorrelation between fluid saturation and porosity is not just for prediction, but it has an impact on theestimation of the in-place volumetrics. Similarly, an accurate modeling of the porosity–permeabilityrelationship is not just for better prediction of permeability, but has an impact on the hydrocarbonrecovery rate.
15.4.1 CONSTRUCTING STATIC MODELS15.4.1.1 Modeling PorosityGeostatistical methods for modeling porosity include kriging and stochastic simulation. Krigingproduces smoother results as the variance of the kriging model is smaller than the variance of the data.Commonly used stochastic simulation methods include sequential Gaussian simulation or SGS(Deutsch and Journel, 1992) and Gaussian random function simulation or GRFS (Gutjahr et al., 1997).
In early development of a field, few data are available and kriging may be a method of choice togenerate the porosity model, and the moving average method can be a valid alternative technique.When more wells are drilled with a thorough formation evaluation program using well logs andgeological analysis, stochastic methods may be a better choice to model porosity, especially forstacked sandstone reservoirs. Some academies have argued that stochastic simulation is preferable formodeling reservoir properties in early field developments because of limited data and high uncertainty.This can be true for the sake of a general analysis of uncertainty. In practice, however, when data isvery limited, stochastic models generally have no operational value. On the other hand, when moredensely sampled seismic data are available and can be calibrated with porosity, cosimulation ofporosity with seismic data can be useful (Cao et al., 2014).
In addition, the lithofacies model can be used to constrain the spatial distribution of porosity usingSGS or GRFS because depositional facies or lithofacies govern spatial and frequency characteristics ofporosity to a large extent. Even though porosity can still be variable within each lithofacies, theporosity statistics by lithofacies generally exhibit less variation (Ma et al., 2008). Figure 15.11compares two porosity models constructed with four different lithofacies models presented in theprevious chapter.
Typically, a histogram of the effective porosity from the well logs exhibits a bimodal distribution(Fig. 15.11(a)), but a bimodal appearance often conceals some components from three or more lith-ofacies, as shown by the example (Fig. 15.11(b)). The hidden and nonhidden modalities can bemodeled by mixture decomposition (Ma et al., 2014b). In this example, the lithofacies include
442 CHAPTER 15 TIGHT GAS SANDSTONE RESERVOIRS, PART 2

sandstone, siltstone and shale, and the lithofacies models constructed using SIS and defined object-based modeling techniques were used to constrain the porosity model. GRFS was used in modelingporosity by lithofacies, honoring its well log data, histogram and variogram. The models are shown inFigs 15.11(c) and (d), in which the shale was assigned zero effective porosity even though it has sometotal porosity.
15.4.1.2 Modeling Water Saturation and PermeabilityPorosity, water saturation (Sw) and permeability in tight gas sandstone reservoirs are correlated, asshown in Fig. 15.12. As a result, Sw and permeability should be modeled in relation to porosity asporosity has more reliable data and its model is constructed first. Sometimes the correlation betweenporosity and Sw may only appear to be moderate; researchers may decide to model them indepen-dently because the statistical literature generally predicates the use of correlated variables for pre-diction. How to model the correlation between fluid saturation and porosity impacts the estimation ofthe in-place volumetrics. Unlike for predictions, when two physical variables are correlated, even
FIGURE 15.11
(a) Histogram of porosity from well logs. (b) Component histograms by lithofacies. Black is the porosity for
shale, green is for siltstone, and red (dark gray in print versions) is for sandstone. (c) Porosity model con-
strained to the SIS lithofacies model (Fig. 14.8(b)) in the previous chapter). (d) Porosity model constrained to
the defined object lithofacies model (Fig. 14.8(d)) in the previous chapter).
15.4 THREE-DIMENSIONAL MODELING OF RESERVOIR PROPERTIES 443

FIGURE 15.12
Reservoir property relationships based on the well-log data from a tight gas sandstone. (a) Porosity–Sw
cross plot (correlation ¼ �0.894), (b) porosity–permeability (logarithm) cross plot (correlation ¼ 0.843).
(c) Sw–Permeability (logarithm) cross plot (correlation ¼ �0.855). (d) Sw model constructed using CocoSim
that is constrained to the lithofacies model and honors the Sw data at the wells and correlation between
porosity and Sw. (e) Permeability model constructed using CocoSim that is constrained to the lithofacies
model and honors the permeability data at the wells and correlation between porosity and permeability.
444 CHAPTER 15 TIGHT GAS SANDSTONE RESERVOIRS, PART 2

moderately, their correlation may need to be modeled because the correlation impacts other physicalproperties. In the case of fluid saturation and porosity, how to model their correlation impacts theestimation of the in-place volumetrics, and thus should be modeled.
Sw and permeability can be modeled using collocated cokriging or collocated cosimulation(CocoSim) to honor the relationship between porosity and Sw or permeability (Ma et al., 2008; Caoet al., 2014). CocoSim can model Sw, honoring the well-log Sw data, its histogram, variogram, and itscorrelation with the porosity based on the well logs data. An example of a Sw model constructed usingCocoSim is shown (Fig. 15.12(d)); the model is constrained to the SIS lithofacies model (Fig. 15.8(b)in the previous chapter) while honoring the Sw data at the wells, correlation between porosity and Sw,and the variogram synchronized between porosity and Sw.
Similarly, a 3D permeability model can be constructed using CocoSim that is constrained to alithofacies model while honoring the well-log’s permeability data, correlation between porosity andpermeability, and the variogram synchronized between porosity and permeability (Fig. 15.12(e)).Other advantages of modeling the permeability using CocoSim have been discussed elsewhere (Maet al., 2008; Cao et al., 2014). Notice that the porosity-permeability (logarithm) relationship in realdata is a nonlinear correlation (Fig. 15.12). A linear transform, such as regression of the logarithm ofpermeability from porosity, reduces the permeability because the exponential of the mean is smallerthan the mean of the exponential (Vargas-Guzman, 2009; Cao et al., 2014).
Because of the high correlations between porosity, Sw, and permeability, the Sw and permeabilitymodels generally are highly correlated as well. This correlation can be either implicitly modeled as aresult of modeling the correlation between porosity and Sw and the correlation between porosity andpermeability, or explicitly modeled using CocoSim.
15.4.2 DYNAMIC MODELINGTypically, static models are constructed at a high resolution to convey the geological heterogeneity,especially important in stacked sandstone reservoirs. These high-resolution models are upscaled into acoarser grid for dynamic simulation. In order to preserve the heterogeneities in the fine-grid model, theupscaling needs to select an appropriate method. Relatively robust upscaling techniques to preserveheterogeneity include the residual optimization method (Li and Beckner, 1999), and constrainedoptimization approach (King et al., 2006). For a relatively small sector model, upscaling may not benecessary (Apaydin et al., 2005).
One of the main tasks in dynamic simulation is the history match of the model to the productiondata, including pressure data from monitoring wells, historical flowing bottom hole pressures andhistorical productions of water and gas from producing wells (Iwere et al., 2009; Diomampo et al.,2010). Alternatively, completion, historical production and pressure data can be consolidated anddirectly input into a flow simulator. Boundary conditions derived from field operation can be used asproduction controls for the wells, and natural and hydraulic fracture properties can be assigned to thefracture cells for each well in the model (Apaydin et al., 2005). Streamline simulation can be alsoperformed to analyze the reservoir connectivity, sweep efficiency, and other reservoir characteristics.
Forecasting performance of planned infill wells for tight gas sandstone reservoirs can be carried outby maintaining the existing well locations in the model while drilling down to the chosen well patternand density or removing the existing well locations in the model while placing new wells with a chosenpattern and density (Diomampo et al., 2010).
15.4 THREE-DIMENSIONAL MODELING OF RESERVOIR PROPERTIES 445

Studies have shown a significant impact of the lithofacies modeling method on forecasting wellperformance (Apaydin et al., 2005). Typically, the SIS model has an overall higher connectivity thanobject-based models, and “produces” more gas and water. On the other hand, the lithofacies modelusing fluvial object-based modeling tends to have higher anisotropy: high connection in the fluvialdirection and low connection in the perpendicular direction. The lithofacies model using object-basedmodeling with defined objects with ellipse-based geometry tends to have an overall spatial connectivitybetween the sequential indicator simulation and fluvial object-based models as this approach offersthe flexibility to generate channel bodies spanning a spectrum of geometries from individual point barsto stacked and amalgamated sheets.
15.5 CONCLUSIONPetrophysical analysis based on well logs is the cornerstone for formation evaluation of tight gassandstone reservoirs. A number of issues related to analyzing well logs in this type of formation arediscussed in this chapter. Porosity is one of the most important reservoir variables in hydrocarbonresource evaluation as it describes the subsurface pore space for fluid storage. Deriving accurateporosity data based on the available well logs is thus highly important for estimation of the effectivepore volume.
Volumetrics, including field-wide pore volume and hydrocarbon pore volume, depend on not onlythe data at wells, but more importantly the distributions of the porosity and fluid saturation of theformation in the field. The correlation between porosity and fluid saturation should be modeled notnecessarily for the sake of the prediction, but for the sake of the physical nature and impact on theaccuracy of in-place resource estimate. Similarly, the correlation between porosity and permeabilityand the correlation between fluid saturation and permeability impact the recovery of fluids in pro-duction. In a reservoir model, pathways characterized by high reservoir quality and connectivityare drained early, and more isolated and heterogeneous sandstone bodies may be drained later orremain undrained.
Because of the uncertainty and risk associated with development of tight gas sandstone reservoirs, allthe development stages, including drilling, completion, stimulation, and production, should be optimized.
ACKNOWLEDGMENTThe authors thank Schlumberger Ltd for permission to publish this work and Dr Shujie Liu for reviewing andcommenting on the manuscript.
REFERENCESAl-Yaarubi, A., Onyeije, R., Lukmanov, R., Faivre, O., 2014. Advances in tight gas evaluation using improved
NMR and dielectric dispersion logging. In: SPWLA-2014-PPPP, 68th Annual Technology Conference andExhibition, Abu Dhabi.
Apaydin, O., Iwere, F.O., Luneau, B.A., Ma, Y.Z., 2005. Critical Parameters in Static and Dynamic Modeling ofTight Fluvial Sandstones. Paper SPE 95910, presented at the 2005 SPE Annual Technical Conference,Dallas.
446 CHAPTER 15 TIGHT GAS SANDSTONE RESERVOIRS, PART 2

Burnie, S.W., Maini, B., Palmer, B.R., Rakhit, K., 2008. Experimental and empirical observations supporting acapillary model involving gas generation, migration, and seal leakage for the origin and occurrence of regionalgasifers. In: Cumella, S.P., Shanley, K.W., Camp, W.K. (Eds.), Understanding, Exploring, and DevelopingTight-Gas Sands, 2005 Vail Hedberg Conference: AAPG Hedberg Series, vol. 3, pp. 29–48.
Byrnes, A.P., 1997. Reservoir characteristics of low-permeability sandstones in the rocky Mountains. MountainGeologist 34, 39–51.
Byrnes, A.P., Castle, J.W., 2000. Comparison of core petrophysical properties between low-permeabilitysandstone reservoirs: Eastern U.S. Medina Group and Western U.S. Mesaverde Group and frontierformation. In: 60304-MS SPE Conference Paper - 2000.
Cao, R., Ma, Y.Z., Gomez, E., 2014. Geostatistical applications in petroleum reservoir modeling. Southern AfricanInstitute of Mining and Metallurgy 114, 625–629.
Chapin, M.A., Govert, A., Ugueto, G., 2009. Examining Detailed Facies and Rock Property Variation in UpperCretaceous. Tight Gas Reservoirs, Pinedale Field, Wyoming. AAPG Search and Discovery Article #20077.
Cluff, S.G., Cluff, R.M., 2004. Petrophysics of the lance sandstone reservoirs in Jonah field, Sublette County,Wyoming. In: AAPG Studies in Geology #52, Jonah Field: Case Study of a Tight-gas Fluvial Reservoir,pp. 215–241.
Davies, D.K., Williams, B.P.J., Vessell, R.K., April 15–17, 1991. Reservoir geometry and internal permeabilitydistribution in fluvial, tight, gas sandstones, travis peak formation, Texas. In: SPE Rocky Mountain RegionalLow Permeability Reservoirs Symposium and Exhibition, Denver, CO.
Deng, J., Hu, X., Liu, X., Wu, X., 2013. Estimation of porosity and permeability from conventional logs in tightsandstone reservoirs of North Ordos Basin. In: 163953-MS SPE Conference Paper - 2013.
Deutsch, C.V., Journel, A.G., 1992. Geostatistical Software Library and User’s Guide. Oxford Univ. Press, 340 p.Diomampo, G.P., Roach, H., Chapin, M., Ugueto, G.A., Brandon, N., Fleming, C.H., 2010. Integrated
Dynamic Reservoir Modeling for Multilayered Tight Gas Sand Development. Society of PetroleumEngineers. http://dx.doi.org/10.2118/137354-MS.
Eslinger, E., Pevear, D., 1988. Clay Minerals for Petroleum Geologists and Engineers. SEPM Short Course 22.Gutjahr, A., Bullard, B., Hatch, S., 1997. General joint conditional simulation using a fast Fourier transform
method. Mathematical Geology 29 (3), 361–389.Holditch, S.A., 2006. Tight gas sands. Journal of Petroleum Technology (June) 86–93.Iwere, F.O., Gao, H., Luneau, B., 2009. Well Production Forecast in a Tight Gas ReservoirdClosing the Loop
with Model-Based Predictions in Jonah Field, Wyoming. Society of Petroleum Engineers. http://dx.doi.org/10.2118/123296-MS.
Kaye, L., Webster, M., Spain, D.R., Merletti, G., 2013. The importance of saturation history for tight gasdeliverability. In: 163958-MS SPE Conference Paper – 2013.
King, M.J., Burn, K.S., Wang, P., Muralidharan, V., Alvarado, F.E., Ma, X., Datta-Gupta, A., 2006. OptimalCoarsening of 3D Reservoir Models for Flow Simulation. Society of Petroleum Engineers. http://dx.doi.org/10.2118/95759-PA.
Kukal, G.C., Biddison, C.L., Hill, R.E., Monson, E.R., Simons, K.E., March 13–16, 1985. Critical problemshindering accurate log interpretation of tight gas sand reservoirs. In: SPE-DOE Joint Symposium on LowPermeability Gas Reservoirs, Denver, CO.
Kukal, G.C., Simons, K.E., May 19–22, 1985. Log analysis techniques for quantifying the permeability of sub-millidarcy sandstone reservoirs. In: SPE-DOE Joint Symposium on Low Permeability Gas Reservoirs, Denver, CO.
Li, D., Beckner, B., 1999. A Practical and Efficient Uplayering Method for Scale-Up of Multimillion-CellGeologic Models. Society of Petroleum Engineers. http://dx.doi.org/10.2118/57273-MS.
Liu, S., Spain, D.R., Dacy, J.M., June 16–20, 2012. Beyond volumetrics: petrophysical characterization using rocktypes to predict dynamic flow behavior in tight Gas sands. In: SPWLA 53rd Annual Logging Symposium.
REFERENCES 447
Luffel, D.L., Howard, W.E., May 18-19, 1987. Reliability of laboratory measurement of porosity in tight gassands. In: SPE-DOE Joint Symposium on Low Permeability Gas Reservoirs, Denver, CO.
Luffel, D.L., Howard, W.E., Hunt, E.R., March 6–8, 1989. Travis peak core permeability and porosity relation-ships at reservoir stress. In: SPE Joint Rocky Mountain Regional Low Permeability Reservoirs Symposiumand Exhibition, Denver, CO.
Ma, Y.Z., et al., 2014a. Identifying Hydrocarbon Zones in Unconventional Formations by Discerning Simpson’sParadox. Paper SPE 169496 presented at the SPE Western and Rocky Regional Conference, April, 2014.
Ma, Y.Z., Wang, H., Sitchler, J., et al., 2014b. Mixture decomposition and lithofacies clustering using wirelinelogs. Journal of Applied Geophysics 102, 10–20. http://dx.doi.org/10.1016/j.jappgeo.2013.12.011.
Ma, Y.Z., Gomez, E., Young, T.L., Cox, D.L., Luneau, B., Iwere, F., 2011. Integrated reservoir modeling of aPinedale tight-gas reservoir in the Greater Green River Basin, Wyoming. In: Ma, Y.Z., LaPointe, P. (Eds.),Uncertainty Analysis and Reservoir Modeling. AAPG Memoir 96, Tulsa.
Ma, Y.Z., Seto, A., Gomez, E., 2009. Depositional facies analysis and modeling of Judy Creek reef complex of theLate Devonian Swan Hills, Alberta, Canada. AAPG Bulletin 93 (9), 1235–1256. http://dx.doi.org/10.1306/05220908103.
Ma, Y.Z., Seto, A., Gomez, E., 2008. Frequentist meets spatialist: A marriage made in reservoir characterizationand modeling. SPE 115836, SPE ATCE, Denver, CO.
Moore, W.R., Ma, Y.Z., Urdea, J., Bratton, T., 2011. Uncertainty analysis in well log and petrophysicalinterpretations. In: Ma, Y.Z., LaPointe, P. (Eds.), Uncertainty analysis and reservoir modeling, memoir, 96.AAPG, Tulsa, Oklahoma, pp. 17–28.
Morrow, N.R., Cather, M.E., Buckley, J.S., Dandge, V., April 15–17, 1991. Effects of drying on absolute andrelative permeabilities of low-permeability gas sands. In: SPE Rocky Mountain Regional Low PermeabilityReservoirs Symposium and Exhibition, Denver CO.
Spain, D.R., Merletti, G., Webster, M., Kaye, L., 2013. The Importance of Saturation History for Tight GasDeliverability. SPE 163958.
Vargas-Guzman, J.A., 2009. Unbiased estimation of intrinsic permeability with cumulants beyond the lognormalassumption. SPE Journal 805–809.
Wells, J.D., Amaefule, J.O., May 19–22, 1985. Capillary pressure and permeability relationships in tight gassands. In: SPE-DOE Joint Symposium on Low Permeability Gas Reservoirs, Denver, CO.
448 CHAPTER 15 TIGHT GAS SANDSTONE RESERVOIRS, PART 2