petrophysical evaluation of middle jurassic reservoirs...
TRANSCRIPT

IOSR Journal of Applied Geology and Geophysics (IOSR-JAGG) e-ISSN: 2321–0990, p-ISSN: 2321–0982.Volume 4, Issue 1 Ver. I (Jan. - Feb. 2016), PP 58-68 www.iosrjournals.org
DOI: 10.9790/0990-04115868 www.iosrjournals.org 58 | Page
Petrophysical Evaluation of Middle Jurassic Reservoirs, Shams
Oil Field, North Western Desert, Egypt.
Eysa, E. A. Geology Department, Faculty of science, Zagazig University P.O. Box. 44519, Zagazig, Al Sharqia, Egypt.
Abstract: The Western Desert is one of the most promising areas for hydrocarbon exploration and production
in Egypt. The present work aims to evaluate the petrophysical reservoir characteristics and the lithology of
Middle Jurassic Upper Safa reservoir (middle part of Khattatba Formation) in Shams oil field, North Western
Desert, Egypt. Five wells (Shams-1x, Shams-2x, Shams-3, Shams-4 and Shams-8) were utilized for this study.
They are analyzed for evaluating the different petrophysical parameters of the Middle Jurassic Upper Safa
reservoir. The well log analysis of the Upper Safa reservoir, including data editing and data correction, are
used in determination of lithology and porosity using density-neutron crossplots. The results of density-neutron
cross plots revealed that, the lithology of Upper Safa reservoir is mainly sandstone with some calcareous
cement. A weak effect of natural gas appears by shifting the plotted samples to the up-left of sand line. The
porosity in the five wells ranges from 5% to 15% indicating fair porosity. Petrophysical parameters of the
Upper Safa reservoir are illustrated in vertical litho-saturation crossplots to delineate the most effective sand
zones in each well. Movable hydrocarbon increases mostly at the top and middle parts of the target reservoir in
the studied wells. The iso-parametric maps of the Upper Safa reservoir show that, the northern and
northwestern parts of Shams oil field are the most promising areas for future development.
Keywords: Middle Jurassic, Petrophysical Evaluation, Shams oil Field, North Western Desert.
I. Introduction The Western Desert is an important hydrocarbon producing region and has been intensely explored
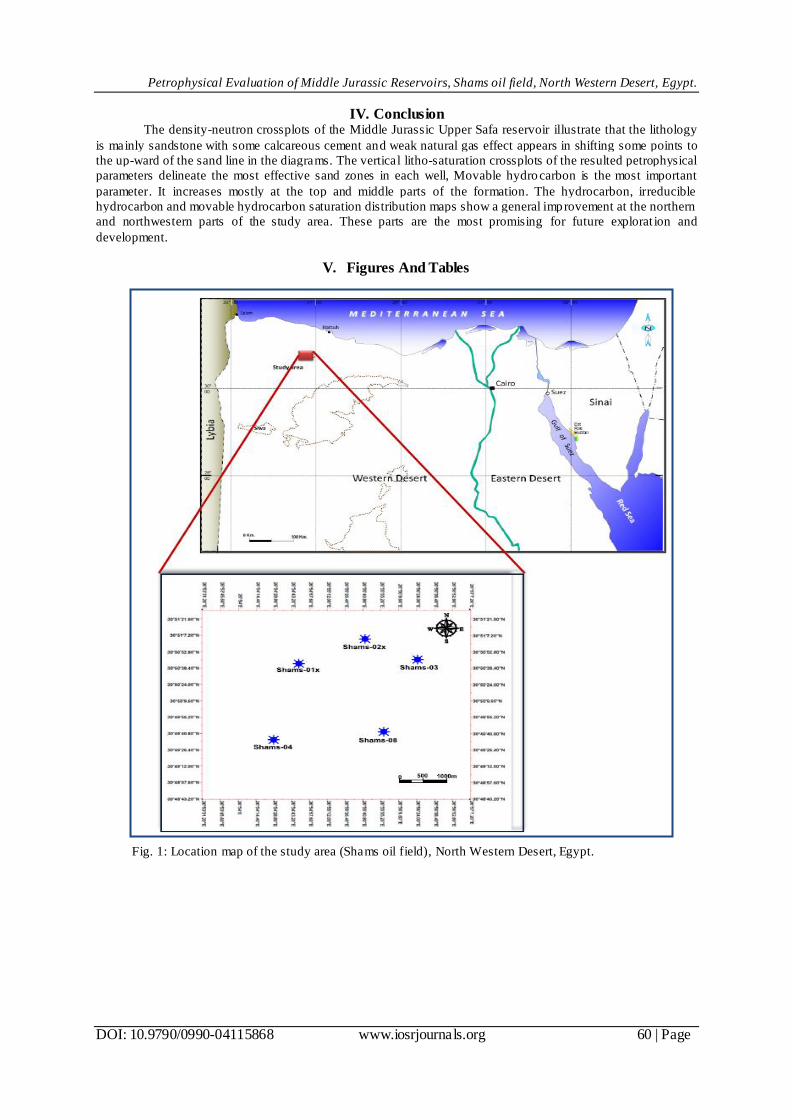
since the middle of the last century [1 & 2]. The study area is located in Shoushan Basin, Northern Western
Desert, Egypt. It lies between latitudes 30° 48’ - 30° 51’ N and longitudes 26° 53’ – 26° 57’ E (Fig. 1). The
northern part of the Western Desert consists of a number of sedimentary basins that received a thick succession
of Mesozoic sediments. The sedimentary section in the northern part of the Western Desert can be divided into
three sequences based on lithology, namely: the lower clastic unit from Cambrian to pre -Cenomanian, the
middle carbonates from Cenomanian to Eocene and the upper clastic unit from Oligocene to Recent [3].
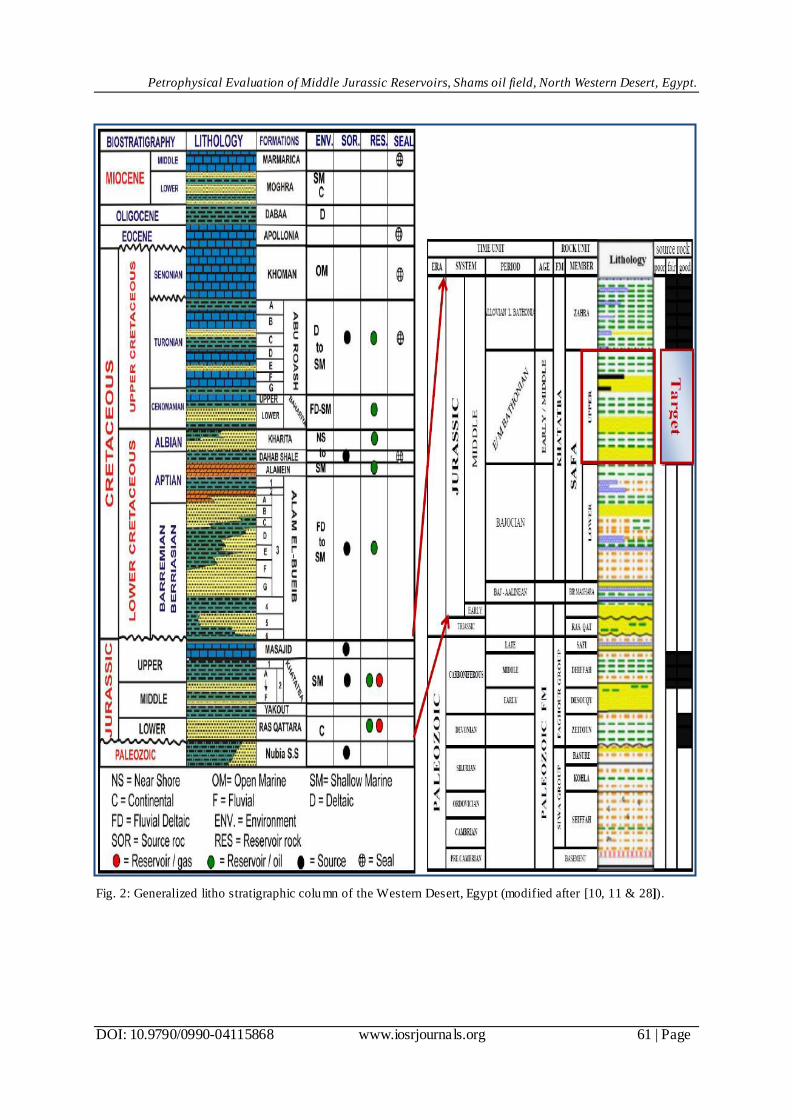
The Mesozoic sequence overlies unconformably Paleozo ic rocks. The Mesozoic stratigraphic
succession is much better understood than the Paleozoic one as it is encountered in all studied wells as indicated
by [4, 5, 6, 7, 8, 9, 10& 11]. Figure (2) illustrates the simplified stratigraphic section in the Western Desert.
The Middle Jurassic sandstones of the Khatatba Formation are an attractive petroleum explorat ion
target in the northern part of the Western Desert. [12] indicated that, Khatatba Formation at the eastern margin
of Shushan basin is mainly composed of sands interbeded with overbank organic -rich shales and coals,
reflecting fluvio -deltiac deposits of fluviatile and tidally influenced channel. It is overlain conformably by
Upper Jurassic Masajid Format ion. Among the key references dealing with the petroleum systems in the north
Western Desert are: [13, 14, 15, 16, 17, 18, 19 & 20].
The structural setting of the North Western Desert has been discussed by many authors such as, [21, 3,
22, 23, 24& 25] and others.
The main objectives of this study are to determine the reservoir lithology and porosity using Density-
Neutron crossplots, identify the different reservoir parameters characterizing the pay zones and construct iso -
parametric maps from well log data to delineate the most effective sand zones and spot light on the promising
locations for other further exp loration.
II. Materials And Methods The studied wells are: Shams-1X, Shams-2X, Shams-3, Shams-4 and Shams-8. The availab le well logs
are density, neutron, gamma ray, resistivity, caliper, and sonic logs. The interpretation of lithology and porosity
of the Upper Safa reservoir was undertaken using all the logs registered through a systematic approach, they
were determined from logs using some chart types of neutron-density crossplots [26]. The neutron-density
crossplots are commonly used to determine the lithology and accurately evaluate the porosity of the reservoir
rocks. The effect of light hydrocarbons (natural gas) can be observed on the cross plot, where the plotted points
tend to shift north-westerly from the sandstone line. Also, the effect of shale can be observed on the crossplot,
where the shale effects tend to be in the lower-right quadrant of the crossplot [27].

Petrophysical Evaluation of Middle Jurassic Reservoirs, Shams oil field, North Western Desert, Egypt.
DOI: 10.9790/0990-04115868 www.iosrjournals.org 59 | Page
The well log evaluation has been achieved using Interactive Petrophysics software (IP) version 4.2.
The petrophysical parameters of the Upper Safa reservoir ext racted from the well log data are used to display
vertical litho-saturation crossplots of resulted petrophysical parameters to delineate the most effective sand
zones in each well. These crossplots are used for the format ion analysis which represents the vertical
distribution of the rocks (lithology), flu ids and porosity (total and effective porosity). This evaluation is useful to
isolate zones for possible future testing. The results of well log analysis are used also to draw distribution maps
for gross thickness, net sand, net pay thickness, total porosity, effective porosity, water saturation, shale volume,
hydrocarbon saturation, irreducible hydrocarbon saturation and movable hydrocarbon saturation. The net pay
thickness is calculated using 10% or more for effect ive porosity, 35% or less for shale volume and 50% or less
for water saturation.
III. Results And Discussions 3.1 Determination Of Lithology And Porosity From Neutron-Density Crossplots
Figure (3) illustrates the neutron-density crossplots of the Upper Safa reservoir in the studied wells, it is
observed that, the majority of plotted points are scattered very close to sandstone line in wells (Shams-1x,
Shams-2x and Shams-3. In wells (Shams-4 and Shams-8) the plotted points scattered between sand and
limestone Lines. The porosity values range from 5% to 15%. This indicates that , the reservoir is mainly
sandstone with some calcareous cement and fair porosity. The effect of gas is weakly observed where some
points are slightly shifted upward above sand line in wells (Shams-1x, Shams-2x, Shams-3 and Shams-8).
3.2 Petrophysical Evaluation
3.2.1 Vertical Litho-Saturation Crossplots
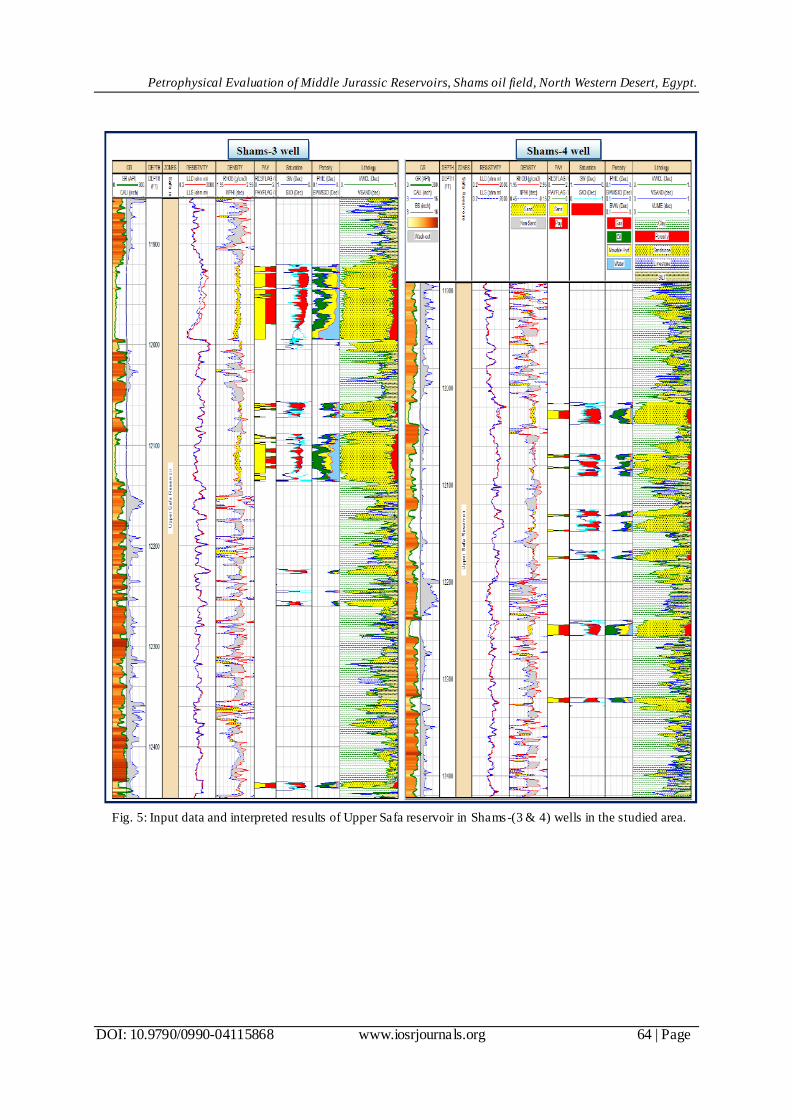
Corrected well logs data and derived reservoir parameters are plotted versus depth in the vertical litho-
saturation crossplots showing the pay zones and hydrocarbon shows in the studied wells . Also the diagram
illustrates the log package on the well from lift to right (first track gamma ray, resistivity, density / neutron, pay
/ reservoir flag, water / hydrocarbon saturation, porosity and the last track is lithology) (Figs. 4, 5 and 6). The
analysis reflects the predominance of calcareous sandstone intercalated with shale streaks. Movable
hydrocarbon is the most important parameter and has a wide vertical distribution in all wells. It increases mostly
at the top and midd le parts of Upper Safa reservoir. Therefore, the productivity is expected to be good in
sandstone parts of the format ion.
3.2.2 Reservoir Mapping
The log- derived petrophysical parameters are presented in contour maps to show their general
distribution throughout the Upper Safa reservoir. The total thickness map of Upper Safa reservoir (Fig.7a)
shows thickness increasing toward the north direction and decreasing toward east and southeast direction s. The
maximum thickness is 682ft at Shams-2X well. The min imum thickness is 662 ft at Shams -8 well. The Net
sand distribution map (Fig.7b) shows general increasing toward north and north east direction, where it reaches
130ft in Shams-2x well. It decreases in southern and central area reaching 13ft in Shams -8 well.
The net pay thickness map (Fig.7c) reflects an increasing toward north and northeast directions and
decreasing toward south and southeast directions. The maximum value 96 ft is recorded at Shams-2x well. The
minimum value 18 ft is recorded at Shams-8 well. The total porosity (Fig.7d) increases toward northeast
direction where it reaches 10.4% in Shams-3 well. It decreases toward south direction where it reaches 7.95% in
Shams-8 well.
The effective porosity (Fig.7e) follows the same directions of total porosity recording maximum value
(9.6%) in Shams-2x well and minimum value (7.7%) in Sha ms-8 well. The water saturation of Upper Safa
reservoir increases to the east and northeast directions . It decreases to the west direction. It reaches 25 % at
Shams-3 well, and attains the lowest value of 13.9 % at Shams -1x well (Fig. 7f).
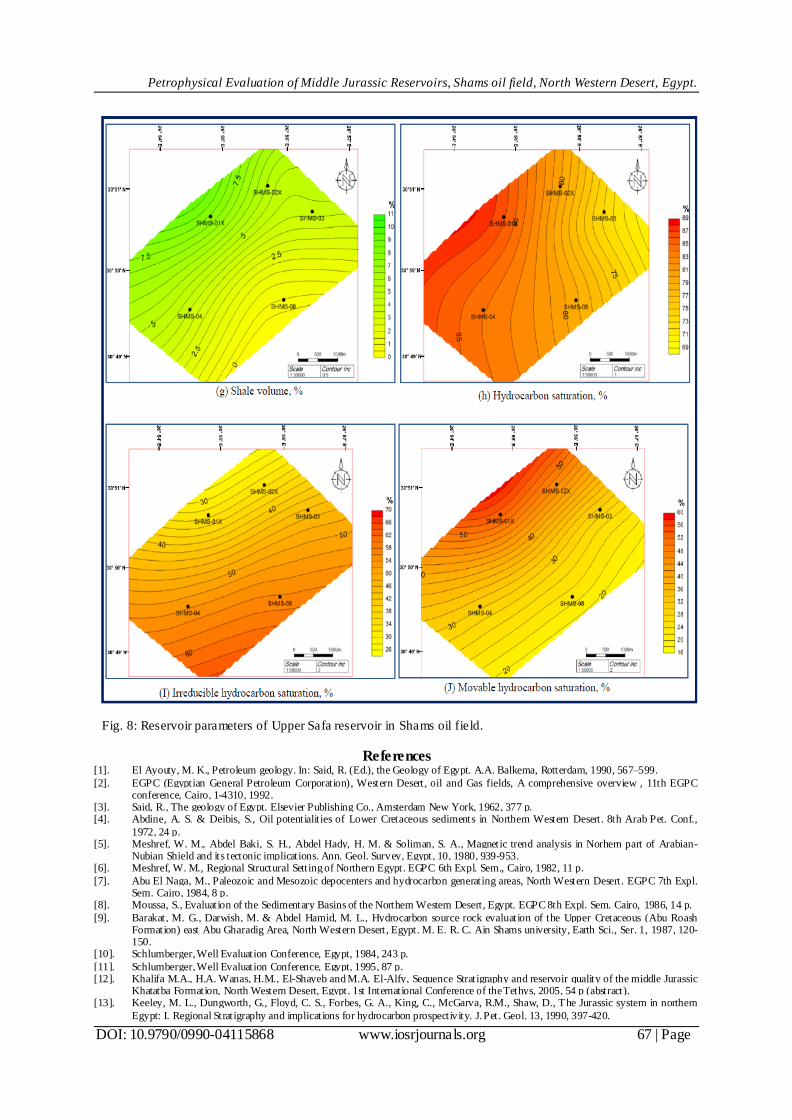
Shale volume content increases in northwest direction, while it decreases in the southeast direction.
The shale volume distribution map (Fig. 8g) shows that, the lowest value is 0.5 % at Shams-8 well and the
greatest value is 7.9 % at Shams-1x well. (Fig. 8h) shows increasing in hydrocarbon saturation in the west and
North West directions. It decreases toward north east direction of the study area. The hydrocarbon saturation
attains a maximum value of 83.9 % at Shams-1x well and the minimum value is 74 % at Shams-3 well.
Irreducib le and movable hydrocarbon saturation shows opposite directions (Figs. 8I & 8J). The
Irreducib le hydrocarbon saturation increases toward south and southeast direction reaching 56.2% in Shams -8
well. The movable hydrocarbon saturation increases toward north and northwest directions reaching the
maximum value 52.5 % in Shams-1x well.
Petrophysical Evaluation of Middle Jurassic Reservoirs, Shams oil field, North Western Desert, Egypt.
DOI: 10.9790/0990-04115868 www.iosrjournals.org 60 | Page
IV. Conclusion The density-neutron crossplots of the Middle Jurassic Upper Safa reservoir illustrate that the lithology
is mainly sandstone with some calcareous cement and weak natural gas effect appears in shifting some points to
the up-ward of the sand line in the diagrams. The vertical litho-saturation crossplots of the resulted petrophysical
parameters delineate the most effective sand zones in each well, Movable hydrocarbon is the most important
parameter. It increases mostly at the top and middle parts of the formation. The hydrocarbon, irreducible
hydrocarbon and movable hydrocarbon saturation distribution maps show a general improvement at the northern
and northwestern parts of the study area. These parts are the most promising for future explorat ion and
development.
V. Figures And Tables
Fig. 1: Location map of the study area (Shams oil field), North Western Desert, Egypt.
Petrophysical Evaluation of Middle Jurassic Reservoirs, Shams oil field, North Western Desert, Egypt.
DOI: 10.9790/0990-04115868 www.iosrjournals.org 61 | Page
Fig. 2: Generalized litho stratigraphic column of the Western Desert, Egypt (modified after [10, 11 & 28]).

Petrophysical Evaluation of Middle Jurassic Reservoirs, Shams oil field, North Western Desert, Egypt.
DOI: 10.9790/0990-04115868 www.iosrjournals.org 62 | Page
Fig. 3: Neutron-Density Crossplots for Upper Safa reservoir in Shams oil field. (Color o f points refers to the GR
value as shown in the right column color code)

Petrophysical Evaluation of Middle Jurassic Reservoirs, Shams oil field, North Western Desert, Egypt.
DOI: 10.9790/0990-04115868 www.iosrjournals.org 63 | Page
Fig. 4: Input data and interpreted results of Upper Safa reservoir in Shams-(1x & 2x) wells in the studied area.
Petrophysical Evaluation of Middle Jurassic Reservoirs, Shams oil field, North Western Desert, Egypt.
DOI: 10.9790/0990-04115868 www.iosrjournals.org 64 | Page
Fig. 5: Input data and interpreted results of Upper Safa reservoir in Shams-(3 & 4) wells in the studied area.

Petrophysical Evaluation of Middle Jurassic Reservoirs, Shams oil field, North Western Desert, Egypt.
DOI: 10.9790/0990-04115868 www.iosrjournals.org 65 | Page
Fig. 6: Input data and interpreted results of Upper Safa reservoir in Shams-8 well in the studied area.

Petrophysical Evaluation of Middle Jurassic Reservoirs, Shams oil field, North Western Desert, Egypt.
DOI: 10.9790/0990-04115868 www.iosrjournals.org 66 | Page
Fig. 7: Reservoir parameters of Upper Safa reservoir in Shams oil field.
Petrophysical Evaluation of Middle Jurassic Reservoirs, Shams oil field, North Western Desert, Egypt.
DOI: 10.9790/0990-04115868 www.iosrjournals.org 67 | Page
Fig. 8: Reservoir parameters of Upper Safa reservoir in Shams oil field.
References [1]. El Ayouty, M. K., Petroleum geology. In: Said, R. (Ed.), the Geology of Egypt. A.A. Balkema, Rotterdam, 1990, 567–599.
[2]. EGPC (Egyptian General Petroleum Corporation), Western Desert, oil and Gas fields, A comprehensive overview , 11th EGPC conference, Cairo, 1-4310, 1992.
[3]. Said, R., The geology of Egypt. Elsevier Publishing Co., Amsterdam New York, 1962, 377 p. [4]. Abdine, A. S. & Deibis, S., Oil potentialities of Lower Cretaceous sediments in Northern Western Desert. 8th Arab Pet. Conf.,
1972, 24 p. [5]. Meshref, W. M., Abdel Baki, S. H., Abdel Hady, H. M. & Soliman, S. A., Magnetic trend analysis in Norhern part of Arabian-
Nubian Shield and its tectonic implications. Ann. Geol. Survey, Egypt, 10, 1980, 939-953. [6]. Meshref, W. M., Regional Structural Setting of Northern Egypt. EGPC 6th Expl. Sem., Cairo, 1982, 11 p.
[7]. Abu El Naga, M., Paleozoic and Mesozoic depocenters and hydrocarbon generating areas, North Western Desert. EGPC 7th Expl. Sem. Cairo, 1984, 8 p.
[8]. Moussa, S., Evaluation of the Sedimentary Basins of the Northern Western Desert, Egypt. EGPC 8th Expl. Sem. Cairo, 1986, 14 p.
[9]. Barakat, M. G., Darwish, M. & Abdel Hamid, M. L., Hydrocarbon source rock evaluation of the Upper Cretaceous (Abu Roash Formation) east Abu Gharadig Area, North Western Desert, Egypt. M. E. R. C. Ain Shams university, Earth Sci., Ser. 1, 1987, 120-150.
[10]. Schlumberger, Well Evaluation Conference, Egypt, 1984, 243 p.
[11]. Schlumberger, Well Evaluation Conference, Egypt, 1995, 87 p. [12]. Khalifa M.A., H.A. Wanas, H.M., El-Shayeb and M.A. El-Alfy, Sequence Stratigraphy and reservoir quality of the middle Jurassic
Khatatba Formation, North Western Desert, Egypt. 1st International Conference of the Tethys, 2005, 54 p (abstract). [13]. Keeley, M. L., Dungworth, G., Floyd, C. S., Forbes, G. A., King, C., McGarva, R.M., Shaw, D., The Jurassic system in northern
Egypt: I. Regional Stratigraphy and implications for hydrocarbon prospectivity. J. Pet. Geol. 13, 1990, 397-420.

Petrophysical Evaluation of Middle Jurassic Reservoirs, Shams oil field, North Western Desert, Egypt.
DOI: 10.9790/0990-04115868 www.iosrjournals.org 68 | Page
[14]. Keeley, M.L.,Wallis, R. J., The Jurassic system in northern Egypt: II. Depositional and tectonic regimes: J. Pet. Geol. 14 (1), 1991, 49-64.
[15]. Taha, M. A., Halim, M., The impact of sequence stratigraphic synthesis on the Petroleum Exploration in the Western Desert, Egypt. In: 11th EGPC, Exploration and Production Conference, Cairo, Egypt, 2, 1992, 39-55.
[16]. Sestini, G., In: Kulke, H. (Ed.), Regional Petroleum Geology of the World. 22, (3), Gebruder Borntraeger, Berlin, 1994, 23-46. [17]. Dolson, J. C., Shann, M. V., Matbouly, S., Harwood, C., Rashed, R., Hammouda, H., The petroleum potential of Egypt. In:
Downey, M.W., Threet, J.C., Morgan, W.A. (Eds.), Petroleum Provinces of the Twenty-first Century: AAPG Memoir, 74, 2001, 453-482.
[18]. Younes, M. A., Bek, M., Alamein basin hydrocarbon potentials, Northern Western Desert, Egypt. In: AAPG Annual Convention. Salt Lake City, Extended abstract, 90013, 2003, AAPG, Tulsa.
[19]. Metwalli, F. I., Pigott, J. D., Analysis of petroleum system criticals of the Matruhe Shushan Basin, Western Desert, Egypt. Pet. Geosci. 11, 2005, 157-178.
[20]. Moretti, I., Kerdraon, Y., Rodrigo, G., Huerta, F., Griso, J. J., Sami, M., Said, M., Ali, H., South Alamein petroleum system (Western Desert, Egypt), Pet. Geosci. 16, 2010, 121-132.
[21]. Amin, M. S., Subsurface features and oil prospects of the Western Desert, Egypt. 3P rd P Arab. Petrol. Cong., Alexandria, Egypt, 2,
1961, 8 p. [22]. El-khadragy, A. A. and M. Sharaf, Inferring the basement structure of North Western Desert, using potential field data. Bull. Fac.
Sci., Zagazig Univ., 16, (2), 1994, 92-110. [23]. Shalaby, M. R., A.T. Abdel Hamid and Abu shady A., Structural setting and sedimentary environments using dipmeter analysis of
some Jurassic reservoirs, North Western Desert, Egypt, 5th International Conf., Geology of the Arab World, Cairo Univ., Egypt, 2000, 217-220.
[24]. Zein El Din, M.Y., Abd El-Gawad A., H. M. El Shayb, and I. A. Haddad, Geological studies and hydrocarbon potentialities of the Mesozoic rocks in Ras Kanayis onshore area, North Western Desert, Egypt, 2001, Accepted for publication in the Annals of the
Geological Survey of Egypt. [25]. El-khadragy, A. A., M. H. Saad and A. Azab, Crustal modeling of south Sitra area, North Western Desert, Egypt, using Bouguer
gravity data. Journal of Applied Science Research, 61, (1), 2010, 22-27. [26]. Schlumberger, Log interpretation charts, U.S.A., 1985, 111 p.
[27]. Poupon, A. and Leveaux, J., Evaluation of water saturation in shaly parts of northern Egypt. AAPG., 60, (1), 1971. [28]. Khalda Petroleum Company Internal Report, 2001, Paleontological Studies for Qasr Field.