chapter 11 the estimation of the project …open_jicareport.jica.go.jp/pdf/11866274_05.pdffor...
TRANSCRIPT

CHAPTER 11 THE ESTIMATION OF THE PROJECT COST

The Feasibility Study on The Development of Dedicated Freight Corridor for Delhi-Mumbai and Ludhiana-Sonnagar in India Final Report (Task 2)
Chapter 11 11-1
CHAPTER 11 THE ESTIMATION OF THE PROJECT COST
11.1 SCOPE OF THE PROJECT COST ESTIMATION AND IT’S CONDITIONS
The following costs are estimated as components of the Project Cost.
1) Construction Costs - Civil & Building works
- Track works
- Electrical & Electrification works
- Mechanical works
- Signal & Telecommunication works
- Procurement of Construction, Maintenance & Inspection Vehicles and Equipments
- ICD (Inland Container Depot) Construction
- Locomotive Maintenance Depot Construction
2) Electric Locomotives Procurement Cost (including spare parts)
3) General Consultancy Services Cost
4) Physical Contingency
5) Price Escalation
6) Land acquisition and compensation Costs for Railway and Replacement of ROBs
7) General Administration Costs (including Preliminary expense)
8) Taxes (only related to Foreign Consultant)
9 Accrued Interests during Construction
In addition, following Costs are excluded from Project cost and noted for reference purpose.
a) Procurement Cost of Containers & Wagons
b) Construction of New Wagon Maintenance Depot
b) New ROBs Construction Cost (including cost of Land) – excluded from PETS-II report)
The conditions of cost estimation by JICA Study Team (JST) are stipulated in the following Table 11-1.
Table 11-1 Comparison of major estimate conditions between JST and PETS-II)
Description JICA Study Team PETS-II Train Traction System JST assumes Electric locomotive
traction system for the both Corridors. Traction systems assumed are Electric locomotive for the Eastern and Deisel locomotive for the Western corridor.
Double stack container (DSC) System
Well-type wagon, double stack container system for Western corridor and single stack for Eastern corridor for the time being.
Double stack container system on Flat-type wagon, for Western corridor and Well-type, double stack container system for Eastern corridor.
Procurement of Locomotives According to the demand forecast based on the revised implementation schedule,
Outside the scope of the DFC project cost estimate.

The Feasibility Study on The Development of Dedicated Freight Corridor for Delhi-Mumbai and Ludhiana-Sonnagar in India Final Report (Task 2)
Chapter 11 11-2
which has been used to calculate the number of locomotives upto at 10-years after opening of Phase I-a of project. (Year-2023) This cost is included in the Project cost of Phase I-a.
Construction of New Locomotive Depot
JST have assumed a new locomotive depot for western DFC and its costs is included in the Project costs of Phase I-a.
Outside the scope of the DFC project cost esti mate.
Construction of New Container Terminal Depot (ICD)
JST have assumed a new ICD at Gurgaon area. The costs of the same is included in the Project costsof Phase I-a.
Out of scope of the DFC project costs.
Construction of branch-line (TKD to Pirthala Junction station) on the Western corridor
JST recommends betterment works for the existing line of due to the limited capacity of expansition of TKD depot. Hence its costs are not included in this Project cost.
Cost Estimate scope is not clear, but assumed no cost included in RITES PETS II report.
Construction of New ROBs JST verified the validity and necessity of its construction costs to be included in the Project cost. JST introduced and recommended an alternative solution of adopting automatic level crossing system instead of ROBs. Thus the ROBs cost is removed from the project cost.
DFCCIL and Railway Safety Fund will take charge of the costs for new ROBs construction at 505 locations for Western corridor, 368 locations for Eastern corridor totaling -873 locations.
Construction of ROBs to be replaced
JST Project cost has taken into account the construction cost of replacing ROBs as per the JST route plan.
For Western – 24 locations and Eastern – 9 locations is the number of ROBs needing replacement, costs of which are included in the report.
Electrical/Electrification Works
Electrification system cost for the both corridors are included in the Project costs.
Electrification system for the Eastern corridor and no cost is assumed for electrification system for the Western corridor.
Signal & Telecommunication Works
The estimation has been made based on the latest AF track circuit systems.
The estimation was made based on the Track circuit type but it is not clear which system is adopted from the report.
General Consultancy Services JST Assumed to employ an International Consulting firm for this STEP loan project. The costs of which have been calculated and divided into stagewise Project costs.
General charges (General Administration costs) have been included and it is assumed that a direct management style of construction supervision is adopted.
Physical Contingency Capitalized 5% on the eligible portion of Yen loan.
Capitalized in the individual items.
Price Escalation Price escalation has been added to the Project costs for the eligible portion of Yen loan included physical contingency.
Not specifically mentioned in the report.
Accrued Interest during Construction
Financial interest during construction has been included in the Project costs.
Not specifically mentioned in the report.
11.2 BASIC CONDITIONS OF THE COST ESTIMATION
The JST has estimated the Project cost based on the following conditions:
1) The Exchange rate of US $ / Indian Rs. and Japanese Yen / Indian Rs. is estimated based on the average of the reference exchange rate of Reserve Bank of India during the period
The Feasibility Study on The Development of Dedicated Freight Corridor for Delhi-Mumbai and Ludhiana-Sonnagar in India Final Report (Task 2)
Chapter 11 11-3
of 1st of December 2006 to end of May 2007.
Description Average Rate ¥/Rs 2.770
Rs/US$ 42.98
2) Estimated cost or price is a contract or purchase price as received from contractors or suppliers. Thus the estimated cost or price includes direct cost, indirect cost, overhead, profit and all necessary taxes excluding import duties.
3) All domestic taxes (i.e. Commodity tax, service tax) have been included in the construction costs except import duties and taxes and domestic taxes for overseas procurements due to imprecise understanding of these in relation to this project.
4) The rates and prices of the Year 2006-2007 are used for the cost estimation.
5) Scope of base-case estimation is taken as for the same routes as that of PETS-II, Dadri to JNPT for Western Corridor, Dadri to Sonnagar and Khurja to Dhandarikalan for Eastern Corridor. However the cost estimation is done as per the stagewise development of these sections as specified in the Construction cost para of this report.
6) The unit costs are divided into three (3) portions, machinery, material and labor cost and ratio among them for each portion was assumed based on the past studies in India. Subsequently, ratio between foreign and local currency for above three portions was assumed. Finally, by comparing ratios between these three portions, foreign and local currency in unit cost was estimated.
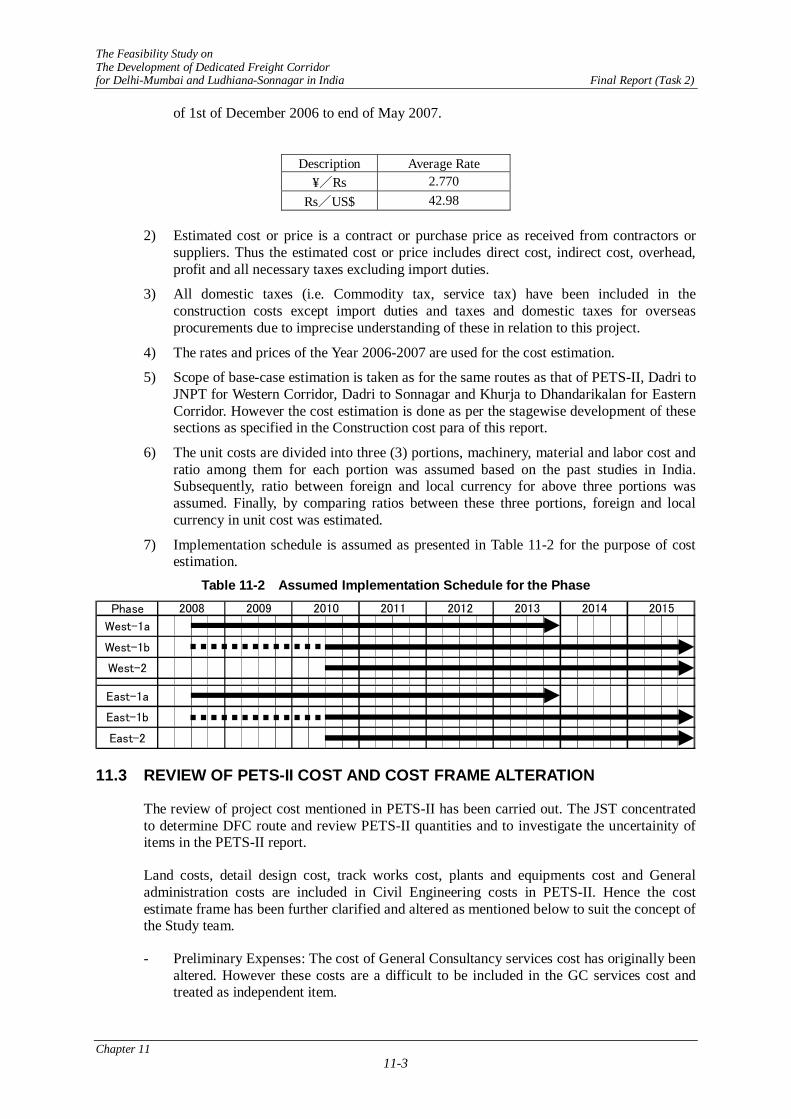
7) Implementation schedule is assumed as presented in Table 11-2 for the purpose of cost estimation.
Table 11-2 Assumed Implementation Schedule for the Phase
Phase
West-1a
West-1b
West-2
East-1a
East-1b
East-2
2008 2009 2010 2011 2012 2013 2014 2015
11.3 REVIEW OF PETS-II COST AND COST FRAME ALTERATION
The review of project cost mentioned in PETS-II has been carried out. The JST concentrated to determine DFC route and review PETS-II quantities and to investigate the uncertainity of items in the PETS-II report.
Land costs, detail design cost, track works cost, plants and equipments cost and General administration costs are included in Civil Engineering costs in PETS-II. Hence the cost estimate frame has been further clarified and altered as mentioned below to suit the concept of the Study team.
- Preliminary Expenses: The cost of General Consultancy services cost has originally been altered. However these costs are a difficult to be included in the GC services cost and treated as independent item.

The Feasibility Study on The Development of Dedicated Freight Corridor for Delhi-Mumbai and Ludhiana-Sonnagar in India Final Report (Task 2)
Chapter 11 11-4
- Land acquisition and compensation costs: This cost has been further clarified and separated as land cost for Railway, land cost for replacing ROBs and land costs for new ROBs, respectively.
- Construction cost of Hospital: This cost has been further clarified and could not justified to including in the eligible yen loan costs.
In the Volume2 Task 0&1, Chapter 12 it has beeen mentioned that the review and verification of the major rates and prices in the PETS-II was required. Thereafter, JST made further revision to following rates and prices.
- Blanketing – Formation works: The rate has been revised to 500 Rs/m3 instead of 400 Rs/m3 in the PETS-II according to the investigation of material rates.
- Replacing ROB – Bridge works: Based on the outline design made by study team, prices are 10% less for ROBs in urban areas and 30% increase for ROBs in sub-urban areas as compare with PETS-II prices. The cost are adapted to the JST’s cost estimates.
- Ballast – Track works: The material rate has been increased by 15% as compare with PETS-II material rate, based on the investigation of purchase rate of Northern Railway and market prices.
- Points & Crossings – Track works: The rates have been revised by a 20% increase as compared with PETS-II rate, due to the modification and change of crossings and use of Head Hardened rail (HH rail).
In addition, following costs are either revised or recently added to the project costs based on the further review and study.
1) Electrical/Electrification works
The estimated costs are based on electrification of both corridors i.e. Western and Eastern. Study team proposes Auto Transformer (AT) system instead of Booster tracton (BT) system as was proposed in the PETS-II report, while for Western corridor it was adopted due to its advantage in long-term cost performance.
Table 11-3 Detail costs of Electrical/Electrification work
Description Western Corridor
(Million Rs)
Eastern Corridor
(Million Rs)
TOTAL (Million Rs)
Electrical/Electrification works OHE System 7,602 6,194 13,796SCADA 69 68 137TPSI works 8,201 6,442 14,643General power supply 231 191 422Civil works 831 636 1,467Total (Electrical/Electrification): 16,934 13,531 30,465
2) Signal & Telecommunication Cost
Cost estimate of Signaling & Telecommunication works are as shown below in Table 11-4. Signalling works cost has been revised due to change to a proven system which is based on AF track circuit instead of Micro-Balise train detection system in the previous report. Also, the cost of Automatic level crossing system has been shifted from previous ROB construction cost to this category.

The Feasibility Study on The Development of Dedicated Freight Corridor for Delhi-Mumbai and Ludhiana-Sonnagar in India Final Report (Task 2)
Chapter 11 11-5
Table 11-4 Detail cost of Signalling & Telecom. Works
Eastern Corridor
Description
Western Corridor
(Million Rs)
Double-line section
(Million Rs)
Single-line section
(Million Rs)
TOTAL
(Million Rs) Train Management System 148 50 102 300 Signalling System at Station 6,197 4,700 4,365 15,262 Signalling System between Station 13,498 4,606 2,225 20,328 Dispatching Telephone System 48 36 39 123 Fixed Communication System 1,233 750 419 2,402 Mobile Communication System 691 474 228 1,392 Digital Electronic Exchange System 108 94 81 283 Total (Signal & Telecom. Works): 21,922 10,709 7,458 40,090 Automatic Level Crossing System 2,214 1,153 460 3,827
Grand Total: 24,136 11,862 7,918 43,917 3) ICD(Inland Container Depot)Construction Cost
The out-line cost has been calculated for a newly established inland container depot which is expected to be built in Gurgaon area. This does not include land acquisition and compensation costs.
4) Vehicle Depots Construction Cost
The cost estimate for Electric locomotives depot to be established one for each Western and Eastern corridor is also included. This cost also does not include land acquisition and compensation costs.
5) Electric Locomotives procurement Cost
The procurement cost has been revised based on the implementation schedule as mentioned in Chapter 14 in this report. The required number of electric locomotives are based on demand forecasting at 10-years from the commissioning of Phase I-a (Year 2023).
Table 11-5 Detail Cost of Elecric Locomotives
Quantity Description Western Eastern
Rate (Million Rs)
Amount (Million Rs)
E. Locomotive (8-axles) 59 165 212 47,488 E. Locomotive (6-axles) 202 5 130 26,910 Spare parts 1,153
Total: 261 170 75,551 11.4 CHARACTERISTICS OF THE PROJECT COSTS
The estimated costs are classified and then divided among the Investment body (DFCCIL), Ministry of Railways (MOR), Indian Railway (IR) and Private parties.
Electric Locomotives cost and the Locomotive Depot’s construction cost are included in the Indian Railway’s portion and some other in the project costs apportioned to DFCCIL’s cost. The cost of Inland Container Depot will only be its basic construction cost, other costs for establishment will be taken up by private partners.

The Feasibility Study on The Development of Dedicated Freight Corridor for Delhi-Mumbai and Ludhiana-Sonnagar in India Final Report (Task 2)
Chapter 11 11-6
11.5 TRANS-SHIPMENT COST FOR FOREIGN AND LOCAL CURRENCY
Each cost and/or price shall be divided into foreign and local currency. (The cost or price is categorized into labor, materials and plant costs and further each cost is divided into foreign and local currency portion based on an assumption.)
Table 11-6 shows the Trans-shipment table for Foreign and Local Currency.
Table 11-6 Trans-shipment Cost - Table for Foreign and Local Currency
S U(%) (%) (%) (%) (%) (%) (%) (%) (%) (%) (%) (%) (Million Rs) (Million Rs) (Million Rs)
CIVIL & BUILDINGEarth work-Cutting 5 5 50 40 0 100 0 100 15 85 6.0 94.0 186 11 174Embankment works 5 5 50 40 0 100 0 100 15 85 6.0 94.0 23,874 1,432 22,441Blanketing 5 5 55 35 0 100 0 100 20 80 7.0 93.0 9,969 698 9,271Tunnel 10 5 45 40 0 100 10 90 40 60 20.5 79.5 3,495 716 2,778Others 10 5 50 35 0 100 0 100 15 85 5.3 94.8 1,460 77 1,384
SubTotal-1: 38,983 2,934 36,049Bridges-Steel 5 10 60 25 0 100 15 85 15 85 12.8 87.3 10,339 1,318 9,021Bridges-Masonry 5 10 55 30 0 100 5 95 15 85 7.3 92.8 16,077 1,166 14,911Bridges-Flyover 5 10 55 30 0 100 5 95 15 85 7.3 92.8 11,094 804 10,290Bridges-Minor 5 10 55 30 0 100 5 95 15 85 7.3 92.8 8,079 586 7,493Others 5 10 55 30 0 100 5 95 15 85 7.3 92.8 631 46 585
SubTotal-2: 46,221 3,920 42,301Office Building 10 5 55 30 0 100 5 95 10 90 5.8 94.3 2,488 143 2,345Station & Shed 10 5 55 30 0 100 5 95 10 90 5.8 94.3 729 42 687Residential Building 10 5 55 30 0 100 10 90 10 90 8.5 91.5 5,318 452 4,866Others 10 5 55 30 0 100 5 95 10 90 5.8 94.3 321 18 302
SubTotal-3: 8,856 655 8,200Miscellaneous works 10 5 60 25 0 100 5 95 20 80 8.0 92.0 12,241 979 11,261
SubTotal-4: 12,241 979 11,261PERMANENT WAYRail & Fastening 5 5 80 10 0 100 80 20 15 85 65.5 34.5 47,532 31,134 16,399Sleeper & Fastening 5 10 55 30 0 100 10 90 15 85 10.0 90.0 15,345 1,535 13,811Point & Crossing 5 5 65 25 0 100 55 45 15 85 39.5 60.5 3,027 1,196 1,831Ballast 5 5 60 30 0 100 0 100 20 80 6.0 94.0 14,844 891 13,953Foot-over Bridge 5 10 55 30 0 100 0 100 15 85 4.5 95.5 997 45 952Others 5 10 55 30 0 100 0 100 15 85 4.5 95.5 50 2 48
SubTotal-5: 81,795 34,802 46,994O&M VEHICLESPlant & Equipment 0 0 0 100 0 0 0 0 80 20 80.0 20.0 3,819 3,055 764ELECTRICAL
25.0 75.0 30,465 7,616 22,849MECHANICAL
25.0 75.0 467 117 351SIGNAL & TELECOMSignal & Telecom 61.0 39.0 37,749 23,027 14,722ICD
5 5 50 40 0 100 5 95 15 85 8.5 91.5 3,000 255 2,745VEHICLE DEPOT
5 5 50 40 0 100 5 95 15 85 8.5 91.5 717 61 656Total (Construction): 264,313 77,422 186,892
ROLLING-STOCKElectric Locomotive 0 0 0 100 0 0 0 0 90 10 90.0 10.0 75,551 67,996 7,555ENGINEERING SERVICEDetail Design Stage 85 5 5 5 75 25 0 100 5 95 67.8 32.3 1,814 1,229 585Tender Assistance Stage 85 5 5 5 77 23 0 100 5 95 69.6 30.5 443 308 135Construction Stage 80 5 5 10 74 26 0 100 15 85 64.4 35.6 6,594 4,247 2,347
TOTAL: 348,716 151,201 197,51443.36% 56.64%
Foreign Local
Weight Currency Allocation
DescriptionPlantLabor Mate.
Currency RatioCost Allocation Ratio
LaborMate. Plant F L F L F L F L
Estimated Amount
Legend: W-Worker Cost、M-Material Cost、P-Plant Cost F-Foreign Currency、L- Local Currency

The Feasibility Study on The Development of Dedicated Freight Corridor for Delhi-Mumbai and Ludhiana-Sonnagar in India Final Report (Task 2)
Chapter 11 11-7
11.6 RESULT OF PROJECT COST ESTIMATION
11.6.1 Sectional Project Cost Estimation
As mentioned in the Chapter-3 earlier, the Study team estimated the project cost in every section to examine the scenario of stage development. Route division map is as shown Figure 11-1.
Figure 11-1 DFC Route Division Map for Stage Development
KHURJAKHURJA
KALANAURKALANAUR
DHANDARIKALANDHANDARIKALAN
KANPURKANPUR
DADRIDADRI
REWARIREWARI
PALANPURPALANPUR
AHMEDABADAHMEDABAD
VADODARAVADODARA
VASAI ROADVASAI ROAD
JNPTJNPT
MUGHAL SARAIMUGHAL SARAISONNAGARSONNAGAR
AJMERAJMER
EE--C2C2
EE--A3A3
WESTERN DFC WESTERN DFC EASTERN DFC EASTERN DFC PORT PORT ICD ICD
LEGENDLEGEND
WW-- B
3B3WW
-- B2B2
WW-- B
1B1
WW-- A
3A3
WW--A
2bA2b
WW--A
2aA2a
WW--A1A1
EE--C1C1
EE--A2A2
EE--A1A1
EE--BB
PipavavPipavav PortPort
KandlaKandla PortPortMundraMundra PortPort
JN PortJN Port

The Feasibility Study on The Development of Dedicated Freight Corridor for Delhi-Mumbai and Ludhiana-Sonnagar in India Final Report (Task 2)
Chapter 11 11-8
DADRIDADRI
REWARIREWARI
PALANPURPALANPUR
AHMEDABADAHMEDABAD
VADODARAVADODARA
VASAI ROADVASAI ROAD
JNPTJNPT
AJMERAJMER
PHASE IPHASE I--aaPHASE IPHASE I--bbPHASE II PHASE II
LEGENDLEGEND
PHASE IPHASE I--aaPHASE IPHASE I--bbPHASE II PHASE II
LEGENDLEGEND
WW-- B
3B3WW
-- B2B2
WW-- B
1B1WW
-- A3A3
WW--A
2bA2b
WW--A
2aA2a
WW--A1A1
KandlaKandla PortPort
MundraMundra PortPort
JN PortJN Port
PipavavPipavav PortPort
Figure 11-2 DFC Route Division Map for Stage Development (Western Corridor)
KHURJAKHURJA
KALANAURKALANAUR
DHANDARIKALANDHANDARIKALAN
KANPURKANPUR
DADRIDADRI
MUGHAL SARAIMUGHAL SARAISONNAGARSONNAGAR
EE--C2C2
EE--A3A3
EE --C1
C1
EE--A2A2
EE--A1A1 EE--BB
PHASE IPHASE I--aaPHASE IPHASE I--bbPHASE II PHASE II
LEGENDLEGEND
PHASE IPHASE I--aaPHASE IPHASE I--bbPHASE II PHASE II
LEGENDLEGEND
Figure 11-3 DFC Route Division Map for Stage Development (Eastern Corridor)
The project cost estimation for various scenarios is shown in Table 11-7 for the each section as described in Figure 11-1.

The Feasibility Study on The Development of Dedicated Freight Corridor for Delhi-Mumbai and Ludhiana-Sonnagar in India Final Report (Task 2)
Chapter 11 11-9
Table 11-7 Sectional Project Cost Matrix
PHASE II PHASE I-b PHASE IIW-A-1 W-A-2a W-A-2b W-A-3 W-B-1 W-B-2 W-B-3 E-A-3 E-A-2 E-A-1 E-B E-C-1 E-C-2Dadri Rewari Ajmer Palanpur Ahmadabad Vadodara Vasai Road Dadri Dadri Khurja Kanpur Mughalsarai Khurja Kalanaur DhandarikalanRewari Ajmer Palanpur Ahmadabad Vadodara Vasai Road JNPT JNPT Khurja Kanpur Mughalsarai Son Nagar Kalanaur Dhandarikalan Son Nagar
(Million Rs) (Million Rs) (Million Rs) (Million Rs) (Million Rs) (Million Rs) (Million Rs) (Million Rs) (Million Rs) (Million Rs) (Million Rs) (Million Rs) (Million Rs) (Million Rs) (Million Rs) (Million Rs) (Million Rs) (Million Rs) (Million Rs) (%)
67,197 12,346 6,965 11,835 4,789 10,825 16,725 3,711 67,197 26,468 12,634 1,065 11,142 9,269 4,993 5,588 7,047 39,103 106,300 21.3
21,925 2,524 3,435 4,457 2,591 4,543 3,699 676 21,925 9,128 4,435 297 5,145 2,750 936 2,138 2,297 13,563 35,488 7.1
3,495 3,495 0 0 0 0 0 0 3,495 0 0 0 0 0 0 0 0 0 3,495 0.7
22,812 3,551 820 2,944 1,035 4,326 8,098 2,038 22,812 5,310 2,636 94 828 2,856 1,532 613 2,023 7,946 30,758 6.2
6,279 1,402 786 1,958 63 376 1,567 126 6,279 3,606 1,210 323 924 804 1,554 532 677 4,815 11,094 2.2
2,203 555 234 182 273 626 307 25 2,203 926 609 0 753 170 2 259 351 1,535 3,738 0.7
505 0 0 0 0 0 379 126 505 126 0 0 0 126 0 0 0 126 631 0.1
4,262 368 874 980 397 417 1,000 227 4,262 3,109 1,484 162 1,366 1,134 447 843 641 4,594 8,856 1.8
5,717 451 816 1,314 430 538 1,676 492 5,717 4,264 2,259 189 2,125 1,430 521 1,202 1,057 6,523 12,241 2.4
45,785 3,649 9,045 11,477 3,867 4,242 10,729 2,776 45,785 27,203 8,807 1,417 11,944 9,930 3,912 5,020 3,787 36,010 81,795 16.4
16,934 1,350 3,345 4,245 1,430 1,569 3,968 1,027 16,934 10,538 2,994 549 4,631 3,843 1,516 1,701 1,293 13,532 30,465 6.1
208 17 41 52 18 19 49 13 208 196 64 10 86 71 28 36 27 259 467 0.1
20,939 1,657 4,255 5,212 1,756 1,926 4,872 1,260 20,939 10,252 6,558 533 4,535 3,721 1,464 3,771 2,787 16,810 37,749 7.6
Signaling work 16,498 1,315 3,259 4,136 1,394 1,528 3,866 1,000 16,498 7,696 5,229 401 3,382 2,806 1,107 2,971 2,259 12,925 29,423 5.9
Traffic Control System 148 0 148 0 0 0 0 0 148 50 102 0 50 0 0 102 0 152 300 0.1
Telecommunication work 2,080 166 411 521 176 193 487 126 2,080 1,354 766 71 595 494 195 435 331 2,120 4,200 0.8
Automatic Level Crossing System 2,214 176 437 555 187 205 519 134 2,214 1,153 460 61 508 421 162 263 197 1,613 3,827 0.8
2,041 0 0 0 2,041 1,495 283 0 0 1,778 3,819 0.8
3,000 0 3,000 0 0 0 0 0 3,000 0 0 0 0 0 0 0 0 0 3,000 0.6
156,104 19,019 27,162 33,332 12,371 19,091 36,343 8,786 156,104 76,153 31,340 3,574 33,085 27,581 11,913 16,257 15,082 107,493 263,596 52.7
717 0 717 0 0 0 0 0 717 0 0 0 0 0 0 0 0 0 717 0.1
38,768 0 0 0 38,768 35,630 0 0 0 0 0 35,630 74,398 14.9
Spare Parts for Electric Locomotives 566 0 0 0 566 587 0 0 0 0 0 587 1,153 0.2
40,051 0 10,551 9,834 9,834 9,834 0 0 40,051 36,217 0 0 18,108 18,108 0 0 0 36,217 76,268 15.3
Sub Total-A: 196,155 19,019 37,712 43,166 22,205 28,925 36,343 8,786 196,155 112,370 31,340 3,574 51,193 45,690 11,913 16,257 15,082 143,709 339,865 68.0
1,113 209 1,113 584 117 117 234 701 1,814 0.4
272 51 272 142 28 28 57 171 443 0.1
4,047 58 4,047 1,816 731 731 0 2,547 6,594 1.3
5,432 318 848 848 848 848 861 861 5,432 2,543 876 876 291 3,419 8,851 1.8
Sub Total-B: 201,588 19,337 38,561 44,014 23,053 29,773 37,204 9,647 201,588 114,913 32,216 4,450 51,881 46,378 12,204 16,695 15,520 147,128 348,716 69.8
10,079 967 1,928 2,201 1,153 1,489 1,860 482 10,079 5,746 1,611 222 2,594 2,319 610 835 776 7,356 17,436 3.5
18,838 1,807 3,603 4,113 2,154 2,782 3,477 901 18,838 10,739 3,011 416 4,848 4,334 1,140 1,560 1,450 13,749 32,587 6.5
230,505 22,111 44,092 50,328 26,360 34,044 42,540 11,030 230,505 131,397 36,838 5,088 59,324 53,031 13,954 19,090 17,747 168,234 398,739 79.8
26,439 5,729 3,128 3,143 5,064 4,996 3,931 449 26,439 17,857 7,535 711 7,754 7,342 2,051 4,744 2,791 25,393 51,831 10.4
201 0 0 9 0 0 88 105 201 91 11 0 0 48 43 11 0 102 303 0.1
742 59 146 186 63 69 174 45 742 347 144 18 152 126 50 82 62 491 1,232 0.2
Construction cost for Replacing ROB 6,465 0 0 87 0 0 3,427 2,951 6,465 897 1,171 0 0 174 723 1,171 0 2,068 8,533 1.7
25 2 5 6 2 2 6 1 25 133 64 7 58 48 19 36 28 197 222 0.0
Utilities Relocation works 1,344 247 139 237 96 217 335 74 1,344 529 253 21 223 185 100 112 141 782 2,126 0.4
9,857 786 1,947 2,471 833 913 2,310 598 9,857 4,879 1,864 254 2,144 1,779 702 1,059 805 6,744 16,601 3.3
2,234 226 2,234 990 336 336 114 1,326 3,560 0.7
Sub Total-D: 277,811 29,159 50,790 56,465 32,417 40,240 53,485 15,254 277,811 157,119 48,217 6,436 69,925 63,004 17,755 26,474 21,742 205,335 483,147 96.7
9,608 1,009 1,757 1,953 1,121 1,392 1,850 528 9,608 5,434 1,668 223 2,418 2,179 614 916 752 7,102 16,710 3.3
56,915 8,057 8,455 8,090 7,179 7,588 12,795 4,751 56,915 31,157 13,047 1,570 13,020 12,152 4,415 8,299 4,747 44,203 101,118 20.2
287,420 30,168 52,547 58,418 33,538 41,632 55,335 15,781 287,420 162,553 49,884 6,658 72,343 65,183 18,369 27,390 27,242 212,437 499,857 100.0
Reference ITEMS (excluded from the Project cost)
Wagons Procurement 20,473 20,473 14,025 14,025 34,498 6.9
526 0 526 0 0 0 0 0 526 1,979 0 0 1,979 0 0 0 0 1,979 2,505 0.5
Cost for new ROBs in the PETS-2 23,780 23,780 8,972 3,427 12,399 36,178 7.2
6,825 141 2,000 1,865 694 213 1,663 249 6,825 192 2,641 3,178 1,010 1,454 1,089 9,563 16,388 3.3
Reference only
Land Acquisition Cost for new ROBs (PETS-2)
Wagons Depot
Grand Total:
Project Cost
Price Escalation
676
695
170
2,528
1,332
Accrued Interest during Construction
Bridge works (exclud. ROB & items bellow)
Corridor Western Corridor Eastern Corridor
TOTALSection No.TOTAL
Whole LinePHASE I-a
StartEndUnit
Phase NO. PHASE I-aTOTAL for E-A & B
(Double line)
TOTAL for E-C
(Single line)
PHASE I-bWhole Line
Bridge works (Flyovers)
Formation works (other than Tunnel)
Civil & Building work
Formation works (Tunnel)
Track work
Electrical work
Bridge works (RUBs)
Bridge works (Protection works)
Station & Building works
Miscellaneous works (missing in the PETS-2)
Mechanical work
Plant & Equipment Procurement
Sub Total-C:
Sub Total-2 (IR):
ES Service Cost during Construction
Total for GC Service:
Sub Total-1 (DFCCIL):
Detail Design & Tender Preparation Stage
Signaling & Telecommunication works
Physical Contingency
Taxes and Duties for Foreign Consultant
1,086
1,376
Land Acquisition cost for Replacing ROB
Preliminary Expenses (Survey & Design)
Land Acquisition cost for Railway
General Administration Cost during Construction
Construction cost for Hospital
336
876
540
28
731
57
2,041
Electric Locomotives Procurement
General Consultancy Service
Tender Assistance Stage
38,768
ICD Construction work
Locomotive Maintenance Depot
566
1,461
PHASE I-b
587
209
51
1,495
117
Sub Total (India portion):
283
35,630
234

The Feasibility Study on The Development of Dedicated Freight Corridor for Delhi-Mumbai and Ludhiana-Sonnagar in India Final Report (Task 2)
Chapter 11 11-10
Following conditions and assumptions may be applicable for calculations.
1) Construction Costs - In the Civil & Building works, items of tunneling work, earthworks (cutting,
embankment and blanketing) are allocated in each and every section of formation works. Items of bridge works, Railway bridges-Steel, Railway bridges-Concrete, Railway bridges-Flyover, Road over Bridges (ROB) and bridge protection works are also allocated and calculated section wise. Building works costs are divided according to the route length.
- The costs of Track works, Electrical engineering works, Mechanical engineering works, Signal & Telecom Engineering works are divided according to the route length for each Western corridor and Eastern corridor which are also allocated according to double track or single track section.
- Plant and equipment costs (construction, maintenance and service vehicles) are included in the Phase I-a section of each corridor.
- New ICD construction costs and Locomotive depot construction costs are allocated to each designated section.
2) General consultancy services cost are not divided by sections. The costs allocation for stage development is mentioned in the Clause 11.6.2.
3) Rolling stock cost is also not divided by sections and the cost allocation for stage development is mentioned in the Clause 11.6.2.
4) The cost of Price escalation is divided for each corridor and then further divided into each section by in the ratio of its cost.
5) Physical contingency cost is divided for each corridor and sections by in the ratio of its cost.
6) Land acquisition and compensation costs are divided for the each section in the ratio of its cost.
7) Taxes for Foreign consultant are divided for each section in the same manner as GC services cost.
8) General administration costs are allocated for the each section according to the route length.
9) Accrued interest during construction is divided for each corridor and then further divided into each section in the ratio of its cost.
Overall costs allocation for the eligible portion of Yen-loan and the Indian Rupee portion are shown in the Table 11-8, and further divided for each corridor as shown in the Table 11-9.

The Feasibility Study on The Development of Dedicated Freight Corridor for Delhi-Mumbai and Ludhiana-Sonnagar in India Final Report (Task 2)
Chapter 11 11-11
Table 11-8 Overall Project Costs (Whole sections)
(Unit: Million Rs)
Description Eligible
portion of Yen-Loan
Indian portion TOTAL Ratio
1) Construction Costs (DFCCIL portion) (except those mentioned below in 2)
263,596 0 263,596 52.7%
2) Construction Costs (DFCCIL portion) (ROB, and Utilities relocation works)
0 10,881 10,881 2.2%
3) Construction Costs (IR portion) 717 0 717 0.1%4) Electric Locomotive procurement costs 75,551 0 75,551 15.1%5) General Consultancy Services Cost 8,851 0 8,851 1.8%6) Physical Contingency 17,436 0 17,436 3.5%7) Price Escalation 32,587 0 32,587 6.5%8) Land acquisition and compensation Costs 0 52,134 52,134 10.4%9) Preliminary expenses (Survey & Design) 0 1,232 1,232 0.2%10) *General Administration Costs 0 16,601 16,601 3.3%11) Taxes (For foreign consultants) 0 3,560 3,560 0.7%12) Accrued Interest during construction 0 16,710 16,710 3.3%
Total Project Costs: 398,739 101,118 499,857 100.0%Proportion (Donor – India): 79.8% 20.2%
**Wagon procurement & Wagon Depot Costs 37,003
**New ROB Construction & Land Cost 52,567
Note) *Including Local Construction Supervisors Cost **The Cost for reference purpose
Table 11-9 Overall Project Costs (by the Each Corridor)
(Unit: Million Rs) Western Corridor Eastern Corridor
Description Eligible portion of Yen-Loan
Indian portion
Eligible portion of Yen-Loan
Indian portion
TOTAL
1) Construction Costs (DFCCIL portion) (except those mentioned below in 2)
156,104 0 107,493 0 263,596
2) Construction Costs (DFCCIL portion) (ROB and Utilities relocation works)
0 7,834 0 3,047 10,881
3) Construction Costs (IR portion) 717 0 0 0 7174) Electric Locomotive procurement costs 39,334 0 36,217 0 75,5515) General Consultancy Services Cost 5,432 0 3,419 0 8,8516) Physical Contingency 10,079 0 7,356 0 17,4367) Price Escalation 18,838 0 13,749 0 32,5878) Land acquisition and compensation Costs 0 26,640 0 25,495 52,1349) Preliminary expenses (Survey & Design) 0 742 0 491 1,23210) *General Administration Costs 0 9,857 0 6,744 16,60111) Taxes (For foreign consultants) 0 2,234 0 1,326 3,56012) Accrued Interest during construction 0 9,608 0 7,102 16,710Total Project Costs: 230,505 56,915 168,234 44,203 499,857Proportion (Western – Eastern): 57.5% 42.5% 100%
Total project costs are Rs. 499.9 billion (approximately Yen 1,384.7 billion), and proportion of eligible for Yen loan and India is 79.8% and 20.2% respectively. The proportion of project cost for Western corridor and Eastern corridor is 57.5% and 42.5% respectively.

The Feasibility Study on The Development of Dedicated Freight Corridor for Delhi-Mumbai and Ludhiana-Sonnagar in India Final Report (Task 2)
Chapter 11 11-12
11.6.2 Estimation of stagewise Project Costs
The stagewise project costs have been estimated based on the Table 11-10 sectional project cost matrix. Each staged developments have been specified as per the following sections based on the evaluations described in the Chapter 3.
Table 11-10 Section of Stagewise Developments
Corridor Western Corridor Eastern Corridor Stage Phase I-a Phase I-b Phase II Phase I-a Phase I-b Phase 2
Section Rewari
- Vadodara
Vadodara - Vasai Rd. -
JNPT
Dadri -
Rewari
Mughal Sarai -
Khurja
Khurja – Dadri and Khurja – Dhandari
Kalan
Sonnagar –
Mughal SaraiRoute Length
918 km Double-line
433 km Double-line
117 km Double-line
710 km Double-line
46 km Double-line 426 km Single-line
127 km Double-line
The cost estimation has taken into account the following points for stagewise project costs.
1) Estimated Electric Locomotive costs are based on 10 years demand forecast from the I-a stage opening (Year 2013) and all costs are allocated to Phase I-a development.
2) Cost of Consulting services and General administration for each stage is calculated by fixed cost (corresponding to the Core team) portion and floating cost (corresponding to the Zonal/Site team) portion.
3) Traffic control system cost in the signaling costs are allocated to the specified Phase I-a section. However its amount has negligible influence (smaller than 1% of signaling cost) so cost has been allocated to each section by route length.
4) Newly established Inland Container Depot (ICD) will be located at Gurgaon area in the Western corridor which belongs to the Rewari – Dadri section (W-A-1). However, its cost has been allocated to Phase I-a section (W-A-2a) due to the establishment of logistic infrastructures between Rewari and Delhi.
Estimated Staged Development Costs are shown in the Table 11-11.
Table 11-11 Stagewise Project Costs
(Unit: Million Rs) Description Phase I-a Phase I-b Phase II TOTAL
1) Construction Costs (DFCCIL portion) (except those mentioned below in 2)
152,622 80,043 30,932 263,596
2) Construction Costs (DFCCIL portion) (ROB and Utilities relocation works)
1,480 8,310 1,091 10,881
3) Construction Costs (IR portion) 717 0 0 7174) Electric Locomotive procurement costs 75,551 0 0 75,5515) General Consultancy Services Cost 4,769 3,473 609 8,8516) Physical Contingency 11,683 4,176 1,577 17,4367) Price Escalation 21,835 7,805 2,947 32,5878) Land acquisition and compensation Costs 31,482 12,830 7,822 52,1349) Preliminary expenses (Survey & Design) 742 381 109 1,23210) General Administration Costs 10,087 5,026 1,487 16,60111 Taxes (For foreign consultants) 1,872 1,348 340 3,56012) Accrued Interest during construction 10,820 4,268 1,623 16,710
Total Project Costs: 323,662 127,658 48,537 499,857Proportion of Stagewise Project Costs: 64.8% 25.5% 9.7% 100.0%

The Feasibility Study on The Development of Dedicated Freight Corridor for Delhi-Mumbai and Ludhiana-Sonnagar in India Final Report (Task 2)
Chapter 11 11-13
The proportion of project costs for Phase I-a, Phase I-b and Phase II are approximately 64.8%, 25.5% and 9.7% respectively.
11.6.3 Project Costs Analysis by comparison (Phase I-a)
The following two Options have been examined and analyzed for consideration of Phase I-a development Plan and each Project Costs which is also mentioned in Chapter 14.
1) Option 1: The project is implemented by funding of all the eligible items of Yen Loan. (Fully Financed Yen Loan Plan)
2) Option 2: Critical items of civil works are carried out in advance by the India-side. (Plan for Advance Works financed by Indian side)
Option-1 Project costs are consistent with Phase I-a Project costs which have been mentioned in the Clause 11.6.2 The Option-2 Project costs are calculated with the following conditions.
a) All of Civil & Building works costs are borne with funds from Indian side.
b) 30% of procurement costs for Ballast materials and PC Sleepers are also borne by funding form Indian-side.
The estimated project costs for the each Option which are based on the above conditions are shown in the Table 11-12 and Table 11-13.
Table 11-12 Phase I-a Project Costs (Fully Financed Yen Loan Plan)
(Unit: Million Rs)
Description Eligible Yen Loan Portion India Portion TOTAL Ratio
1) Construction Costs (DFCCIL portion) (except those mentioned below in 2)
152,622 0 152,622 47.2%
2) Construction Costs (DFCCIL portion) (ROB and Utilities relocation works)
0 1,480 1,480 0.5%
3) Construction Costs (IR portion) 717 0 717 0.2%4) Electric Locomotive procurement costs 75,551 0 75,551 23.3%5) General Consultancy Services Cost 4,769 0 4,769 1.5%6) Physical Contingency 11,683 0 11,683 3.6%7) Price Escalation 21,835 0 21,835 6.7%8) Land acquisition and compensation Costs 0 31,482 31,482 9.7%9) Preliminary expenses (Survey & Design) 0 742 `742 0.2%10) General Administration Costs 0 10,087 10,087 3.1%11 Taxes (For foreign consultants) 0 1,872 1,872 0.6%12) Accrued Interest during construction 0 10,820 10,820 3.3%
Total Project Cost: 267,178 56,484 323,662 100.0%Proportion (Donor – India): 82.5% 17.5% 100.0%
Proportion of (PhaseI-a/Whole section): 64.8%

The Feasibility Study on The Development of Dedicated Freight Corridor for Delhi-Mumbai and Ludhiana-Sonnagar in India Final Report (Task 2)
Chapter 11 11-14
Table 11-13 Phase I-a Project Costs (Advance Works financed by Indian side)
(Unit: Million Rs)
Description Eligible Yen Loan Portion India Portion TOTAL Ratio
1) Construction Costs (DFCCIL portion) (except those mentioned below in 2)
98,833 53,789 152,622 47.2%
2) Construction Costs (DFCCIL portion) (ROB and Utilities relocation works)
0 1,480 1,480 0.5%
3) Construction Costs (IR portion) 717 0 717 0.2%4) Electric Locomotive procurement costs 75,551 0 75,551 23.3%5) General Consultancy Services Cost 4,769 0 4,769 1.5%6) Physical Contingency 11,683 0 11,683 3.6%7) Price Escalation 21,835 0 21,835 6.7%8) Land acquisition and compensation Costs 0 31,482 31,482 9.7%9) Preliminary expenses (Survey & Design) 0 742 742 0.2%10) General Administration Costs 0 10,087 10,087 3.1%11 Taxes (For foreign consultants) 0 1,872 1,872 0.6%12) Accrued Interest during construction 0 10,820 10,820 3.3%
Total Project Cost: 213,389 110,273 323,662 100.0%Proportion (Donor – India): 65.9% 34.1% 100.0%
Proportion of (Phase I-a/Whole section): 64.8%
The percentage of project cost to be funded by India in Phase I-a for Option 1 is 17.5% whereas for Option 2 is 34.1%.

CHAPTER 12 ECONOMIC AND FINANCIAL EVALUATION

The Feasibility Study on The Development of Dedicated Freight Corridor for Delhi-Mumbai and Ludhiana-Sonnagar in India Final Report (Task 2)
Chapter 12 12-1
CHAPTER 12 ECONOMIC AND FINANCIAL EVALUATION
12.1 OBJECTIVE OF THIS CHAPTER
This chapter aims to justify the feasibility of the project plan. All plan alternatives discussed in the previous chapters are compared while appraising and justifying investment feasibility of the DFC project through economic and financial quantitative analysis. While all the chapters are interrelated in carrying out the analyses, the following four chapters are directly relevant: Chapter 4 on “DEMAND FORCAST”, Chapter 6 on “TRANSPORT PLANNING” for the number of rolling stock required and their prices, Chapter 9 on “OPERATION AND MAINTENANCE PLANNING” for operating costs and revenues, and Chapter 11 on “OUT-LINE OF THE ESTIMATION OF THE PROJECT COST” for construction costs.
12.2 ECONOMIC EVALUATION
Economic and Financial Evaluation: Justification of the DFC construction plan should be examined in terms of both economic analysis and financial analysis. Comparison of economic analysis is based on the viewpoint of whether India aims at optimal utilization of the national resources, while financial analysis is based on the viewpoint of whether private enterprises can aim at securing profitability. In case of funding for construction from foreign financing organizations, calculation of national EIRR index will be indispensable.
EconomicEvaluation
NationalStandpoint
OptimumResourcesUtilization
EconomicCost
Benefit
FinancialEvaluation
Discount toPresent Value
Internal EconomicRate of Return(EIRR)
EnterpriseStandpoint
Balance ofEarnings &E penses
MarketCost
Revenue
Internal FinancialRate of Return(FIRR)
Figure 12-1 Evaluation Procedure for Economic and Financial Analysis
Evaluation Comparison Index: Economic evaluation compares economic costs with benefits, and the economic justification index uses the Economic Internal Rate of Return (EIRR). Financial evaluation compares market costs with revenues, and the financial justification index uses the Financial Internal Rate of Return (FIRR). Importance of EIRR takes priority over FIRR. The period of comparison extends up to 35 years of project life (See Figure 12-1).
12.3 CONCLUSION OF ECONOMIC EVALUATION
Table 12-1 and Table 12-2 show the results of investment feasibility analysis for the two DFCs, by dividing them into two sections: one for Western, and the second for Eastern DFC.
Balance of Earnings & Expenses

The Feasibility Study on The Development of Dedicated Freight Corridor for Delhi-Mumbai and Ludhiana-Sonnagar in India Final Report (Task 2)
Chapter 12 12-2
Total cost and benefits over 35 years of the project life discounted at the present value of 2007 were compared for the two sections. EIRR is as follows.
Economic Rate of Return of Western DFC: 14.09% B/C Ratio: 1.22 Economic Rate of Return of Eastern DFC: 15.26% B/C Ratio: 1.37
Investment Judgment: Both the Western DFC of 1468 km at a cost of Rs. 287,420 Million and the Eastern DFC of 1309 km at a cost of Rs. 212,437 Million are economically justified from the viewpoint of national economy, since the EIRR value is higher than the 12% opportunity cost of capital. Initial investment costs and yearly operational expenses will be fully covered by the time savings benefit to passengers and freight transport, operating expenses savings benefit of trains, vehicle operating savings benefit of trucks and buses, and savings benefit of exhaust gas and environmental pollution.
Table 12-1 Statement of the Internal Economic Rate of Return, Western DFC Western DFC Million Rs.
Year Invest. Rolling Total Time Saving Working Expense CO2 Total BalanceCost Stock Cost C.Train P.Train C.Train P.Train Truck Benefit EIRR
2008-09 16,152 16,152 &Truck &Bus &Truck &Bus &Bus -16,1522009-10 31,607 31,607 -31,6072010-11 32,462 32,462 -32,4622011-12 41,487 1,354 42,841 -42,8412012-13 34,563 34,563 -34,5632013-14 19,978 16,721 36,699 1,045 6,455 12,383 6,151 117 26,152 -10,5472014-15 8,452 3,597 12,049 1,112 6,759 13,160 6,324 156 27,511 15,4622015-16 2,874 3,899 6,773 1,182 7,106 14,030 6,502 205 29,026 22,2532016-17 4,132 4,132 1,257 7,509 15,013 6,686 266 30,731 26,5992017-18 4,935 4,935 1,336 7,979 16,139 6,877 342 32,674 27,7392018-19 5,636 5,636 952 8,211 17,808 6,976 455 34,402 28,7662019-20 2,762 2,762 930 8,676 18,466 7,188 513 35,773 33,0102020-21 2,860 2,860 907 9,185 19,202 7,414 580 37,286 34,4262021-22 2,973 2,973 881 9,742 20,029 7,648 654 38,953 35,9812022-23 2,930 2,930 853 11,960 20,961 7,931 746 42,450 39,5202023-24 3,136 3,136 833 11,534 21,993 7,923 824 43,107 39,9712024-25 2,653 2,653 845 11,600 23,097 7,949 879 44,371 41,7182025-26 2,575 2,575 857 12,417 24,291 7,993 943 46,501 43,9262026-27 2,619 2,619 869 13,394 25,584 8,040 1,010 48,898 46,2792027-28 1,583 1,583 881 14,563 26,987 8,091 1,083 51,606 50,0222028-29 1,151 1,151 893 15,961 28,513 8,272 1,181 54,819 53,6682029-30 463 463 883 17,369 29,895 8,080 1,229 57,456 56,9932030-31 467 467 872 19,054 31,394 8,015 1,302 60,637 60,1712031-32 471 471 828 21,068 32,608 7,957 1,380 63,840 63,3702031-33 474 474 838 21,519 33,214 7,977 1,380 64,929 64,4542033-34 282 282 848 21,984 33,840 7,998 1,381 66,051 65,7682034-35 -7 -7 848 21,984 33,840 7,998 1,381 66,051 66,0582035-36 -7 -7 848 21,984 33,840 7,998 1,381 66,051 66,0582036-37 -7 -7 848 21,984 33,840 7,998 1,381 66,051 66,0582037-38 -7 -7 848 21,984 33,840 7,998 1,381 66,051 66,0582038-39 -7 -7 848 21,984 33,840 7,998 1,381 66,051 66,0582039-40 -7 -7 848 21,984 33,840 7,998 1,381 66,051 66,0582040-41 -7 -7 848 21,984 33,840 7,998 1,381 66,051 66,0582041-42 -7 -7 848 21,984 33,840 7,998 1,381 66,051 66,0582042-43 -7 -7 848 21,984 33,840 7,998 1,381 66,051 66,058
Total 187,576 67,605 255,180 27,532 461,903 783,163 229,976 29,054 1,531,629 14.09%
Judgment Reliability: There are many uncertain factors in this railway project, as the scale of investment is very high. There are many cost items, as well as many assumptions made in estimating savings benefits. The EIRR of the Western DFC is lower than that of the Eastern DFC; however, enough EIRR is secured even if benefits vary, and the permissible range of investment justification is high. Thus even if the input index is partially changed, this conclusion will generally not be affected.
Implementation Judgment: As construction delays result in the delay in generation of benefits and damage to the utilization of resources, construction of the DFC for both Western

The Feasibility Study on The Development of Dedicated Freight Corridor for Delhi-Mumbai and Ludhiana-Sonnagar in India Final Report (Task 2)
Chapter 12 12-3
and Eastern DFC should be implemented as soon as possible, even if technical problems arise in each phase.
Table 12-2 Statement of the Internal Economic Rate of Return, Eastern DFC Eastern DFC Million Rs.
Year Invest. Rolling Total Time Saving Working Expenses CO2 Total BalanceCost Stock Cost C.Train P.Train C.Train P.Train Truck Benefit EIRR
2008-09 12,377 12,377 &Truck &Bus &Truck &Bus &Bus -12,3772009-10 24,068 24,068 -24,0682010-11 24,701 24,701 -24,7012011-12 29,563 1,809 31,372 -31,3722012-13 23,899 23,899 -23,8992013-14 12,560 19,477 32,037 13.9 6,365 8,672 5,982 120 21,154 -10,8832014-15 4,889 4,067 8,956 15.2 6,729 9,179 6,145 192 22,261 13,3052015-16 1,392 4,021 5,412 16.5 7,163 9,580 6,312 237 23,309 17,8962016-17 4,501 4,501 17.9 7,686 9,867 6,483 293 24,346 19,8452017-18 4,859 4,859 19.4 8,321 10,031 6,658 361 25,390 20,5322018-19 5,495 5,495 21.0 8,778 10,066 6,738 444 26,047 20,5522019-20 647 647 23.7 9,345 11,495 6,876 535 28,275 27,6282020-21 534 534 26.6 9,997 12,999 7,017 586 30,625 30,0912021-22 672 672 29.6 10,748 14,583 7,160 643 33,163 32,4912022-23 552 552 32.9 11,617 16,255 7,305 704 35,913 35,3612023-24 428 428 36.3 12,520 18,020 7,211 770 38,558 38,1302024-25 548 548 38.2 13,463 18,475 7,194 853 40,024 39,4762025-26 551 551 40.3 14,562 18,979 7,173 938 41,692 41,1412026-27 357 357 42.5 15,839 19,535 7,147 1,034 43,598 43,2402027-28 481 481 44.9 17,319 20,151 7,116 1,141 45,773 45,2922028-29 437 437 47.6 19,031 20,833 7,080 1,262 48,254 47,8172029-30 413 413 50.3 20,826 21,582 6,899 1,398 50,756 50,3422030-31 295 295 53.1 22,937 22,395 6,710 1,532 53,627 53,3322031-32 297 297 56.2 25,415 23,279 6,511 1,681 56,943 56,6462031-33 300 300 57.5 26,009 23,728 6,511 1,848 58,154 57,8552033-34 302 302 58.8 26,620 24,192 6,511 1,848 59,231 58,9292034-35 -8 -8 58.8 26,620 27,307 6,511 1,849 62,346 62,3542035-36 -8 -8 58.8 26,620 27,307 6,511 1,855 62,352 62,3602036-37 -8 -8 58.8 26,620 27,307 6,511 1,855 62,352 62,3602037-38 -8 -8 58.8 26,620 27,307 6,511 1,855 62,352 62,3602038-39 -8 -8 58.8 26,620 27,307 6,511 1,855 62,353 62,3612039-40 -8 -8 58.8 26,620 27,307 6,511 1,856 62,353 62,3612040-41 -8 -8 58.8 26,620 27,307 6,511 1,856 62,353 62,3612041-42 -8 -8 58.8 26,620 27,307 6,511 1,856 62,353 62,3612042-43 -8 -8 58.8 26,620 27,307 6,511 1,856 62,354 62,362
Total 133,450 50,971 184,421 1,272 540,874 589,656 201,345 35,113 1,368,261 15.26%
12.4 CONSTRUCTION COSTS FOR ECONOMIC ANALYSIS
12.4.1 Construction Costs
Financial Cost: The following items were extracted from the construction cost as estimated by market price in Chapter 11.
1) Electric locomotives procurement
2) Spare parts for electric locomotives
3) Price escalation
4) Financial interest during construction
Cost estimated by market price
FinancialCost
Economic Cost
Item Adjustment Value Adjustment

The Feasibility Study on The Development of Dedicated Freight Corridor for Delhi-Mumbai and Ludhiana-Sonnagar in India Final Report (Task 2)
Chapter 12 12-4
Rolling stock is a cost of DFC management, but cost fluctuates according to the transport demand, so it was calculated separately from the construction cost. Price escalation and interest during construction were eliminated because of the transfer items in economic activities.
Economic Costs: Financial costs are divided into domestic currency and foreign currency. Domestic currency is divided further into tradable goods and non-tradable goods, skilled labor and unskilled labor, and tax to correct price distortion, in order to estimate economic cost while evaluating the genuine value of resources. Shadow exchange coefficient is 0.91which is applied to non-tradable goods, and shadow wage rate of 0.77 is applied to unskilled workers.
As for the land costs of non-tradable goods, 7.5% of public land is used, which is obtained without spending money. These costs are regarded as zero for financial analysis, while it is not zero for economic cost since land resources are used. Public land cost estimate is included in the economic cost, based on average market prices.
Financial and Economic Costs: Table 12-3 shows the composition of economic costs of Western and Eastern DFC. These costs are used as the base case for economic analysis. (Volume4 Technical Working Paper Task2, 12 Table12-1 ‘Conversion to Economic Cost from Financial Cost, Western and Eastern DFC’,Table12-20 ‘Shadow Exchange Coefficient’).
Cost estimate by market price: Western Rs. 287,420 Million., Eastern Rs. 212,437 Million. Cost eliminated for 4 items: Western Rs. 220,162 Million, Eastern Rs. 155,908 Million. Cost adjusted by value (economic cost): Western Rs. 187,576 Million, Eastern Rs. 133,450 Million.
Table 12-3 Construction Costs for DFC Economic Evaluation
Million Rs.Western DFC Eastern DFC Items Financial Economic Financial Economic
Civil &Building, Track 109,545 92,219 70,038 58,960 Electrical & Mechanical Work 17,142 14,310 13,791 11,512 Signaling & Telecommunication Work 24,124 20,641 20,420 17,472 Cosultancy Service 5,432 4,711 3,419 2,965 Physical Contingency 10,084 8,199 7,369 5,992 Land Acquisition 26,439 24,597 25,393 23,624 General Administration 10,598 8,785 7,235 5,997 Others 16,799 14,114 8,244 6,927 Total for Evaluation 220,162 187,576 155,908 133,450
Grand Total 287,420 212,437 12.4.2 Economic Costs of Rolling Stock
Conversion to Economic Cost: Rolling stock consists of electric locomotives and freight cars. Locomotives are divided into 8 axles for bulk cargo and 6 axles for containers. The number of vehicles required in operation is calculated based on traffic demand, train-km, train operation planning. Locomotives for the DFC are assumed to be all new. Locomotives are also to be operated on the DFC feeder lines, but they are assumed to be operating within the DFC for investment cost calculation. Economic conversion to economic price from market price is as follows. (Volume4 Technical Working Paper Task2,12 Table 12-2 ‘Conversion to Economic Cost from Financial Cost, Locomotive & Wagon’).

The Feasibility Study on The Development of Dedicated Freight Corridor for Delhi-Mumbai and Ludhiana-Sonnagar in India Final Report (Task 2)
Chapter 12 12-5
Table 12-4 Rolling Stock Cost, Market Price and Economic Price
Million Rs.Items Financial Cost Conversion Ratio Economic Cost
Electric Locomotive for Bulk (8-Axle) 212.00 92.5% 196.1 Electric Locomotive for Container (6-Axle) 130.00 92.5% 120.2 Container & Bulk 2.162 80.6% 1.74
Economic Cost of Rolling Stock: Rolling stock will be used right from the DFC’s opening year, but initially only 10 locomotives for both corridors’ test operation are included from 2 year before opening. It is assumed that at the time of initial operation, 70% of the vehicles on the existing railroad will be used, and that their costs are 50% of the new products. The life of vehicles is estimated at 36 years for new rolling stock and 20 years for old wagons. (Volume4 Technical Working Paper Task2, 12 Table12-3 shows ‘Eastern DFC, Financial Cost, Number of Locomotives, Wagons and the Cost by Operation Years; Table12-4 shows Eastern DFC, Economic Cost, Number of Locomotives, Wagons and the Cost by Operation Years; Table12-5 shows Western DFC, Financial Cost, Number of Locomotives, Wagons and the Cost by Operation Years; Table12-6 shows Western DFC, Economic Cost, Number of Locomotives, Wagons and the Cost by Operation Years’)
Table 12-5 Classification of Rolling Stock, Number and Price Million Rs.
West Classification No. Financial EconomicElectric Locomotive for Container (6 Axle) 246 31,980 29,580
for Bulk (8Axle) 68 14,416 13,334Container New 10,327 22,326 17,998
Old 1,544 1,535 1,237Bulk New 2,441 5,277 4,254
Old 1,503 1,494 1,201Total 77,027 67,605
East Classification No. Financial EconomicElectric Locomotive for Container (6 Axle) 6 780 721
for Bulk (8Axle) 178 37,736 34,904Container New 207 448 361
Old 63 63 50Bulk New 7,076 15,298 12,332
Old 3,248 3,228 2,602Total 57,552 50,971
12.5 TRAFFIC VOLUME FOR COST-BENEFIT CALCULATION
Traffic volume: The traffic volume estimated in Chapter 4 is divided as described below for benefits analysis. The basis for traffic flow is from origin to destination. For the case that assumes the DFC is not built (“without DFC”), traffic estimation was divided into traffic diverted to the parallel highway, and remaining traffic on the existing railway. Passenger traffic is also included in this traffic estimation analysis. Though the DFC is a project for cargo transport only, the DFC project benefits passenger trains as well.
Classifications of Traffic: For the case that assumes the DFC is built (“with DFC”), traffic was classified into four categories; 1) traffic using the DFC, 2) traffic remaining on the existing railways, 3) traffic connected to the DFC directly (feeder), and 4) traffic remaining on the parallel highway. Traffic on the parallel highway is classified into truck transport for freight, and bus transport for passengers. Thus in the economic analysis, all railway and highway traffic are to be analyzed, including the existing railway. The method of traffic distribution is explained in more detail in Chapter 4. The growth rate of traffic volume is not

The Feasibility Study on The Development of Dedicated Freight Corridor for Delhi-Mumbai and Ludhiana-Sonnagar in India Final Report (Task 2)
Chapter 12 12-6
fixed, because the opening period is divided in the first and second stages (see Chapter 4, “DEMAND FORECAST”).
Table 12-6 Traffic Volume with DFC and Without DFC for Economic Analysis
Freight(Billion Ton-km) 2013 2017 2018 2022 2023 2028 2031 Without DFC
Existing Rail 426.2 467.7 510.3 557.6 588.1Road 28.2 73.9 122.7 175.0 209.4
With DFC Eastern Corridor
DFC 35.2 72.8 76.2 79.4 81.0Feeder 49.7 91.3 97.7 103.9 106.9
Without Western CorridorExisting Rail 348.4 352.8 368.7 413.0 441.9Road 15.8 39.3 77.8 119.0 147.1
Western CorridorDFC 29.2 32.6 67.5 86.0 90.6 113.5 128.2Feeder 28.0 30.5 29.4 35.6 37.3 45.5 51.8
Without Eastern CorridorExisting Rail 374.1 397.9 406.8 432.0 439.7 475.3 500.7Road 16.4 25.9 27.2 34.7 38.1 56.5 69.4
Passenger(Billion Pass.km) 2013 2017 2018 2022 2023 2028 2031 Without DFC Case
Existing Rail 120.9 138.6 143.0 160.3 164.0 179.2 186.0Road 2.0 4.8 5.5 9.7 11.4 23.4 34.1
With Eastern DFC Existing Rail (East) 46.0 - 55.3 - 64.9 74.4 80.1Existing Rail (Wes 57.3 - 68.3 - 78.9 85.9 89.6Road 0.9 - 1.8 - 3.6 9.8 15.0
With Western DFCExisting Rail (East) 45.4 - 53.4 - 60.5 65.7 68.0Existing Rail (Wes 57.3 - 69.5 - 81.0 91.6 98.1Road 1.2 - 3.7 - 8.7 17.5 24.8
12.6 COUNTABLE BENEFITS
Classifications of benefits: Countable benefits can be classified as follows. These are direct benefits from the DFC project. Economic and social impact is based on the macro analysis by Intermodal Research Units, which forecasts a ripple effect on households (income and employment), on productivity (GDP), on the government (tax revenue), and on economic and social effects not included in these benefits.
Benefits related to railways
1. Transportation time savings benefit 2. Working expense savings benefit for cargo trains and passenger trains 3. Investment cost (locomotives, freight cars) savings benefit
Direct benefits related to roads 4. Time savings benefit to passengers and freight 5. Capital cost savings benefit of vehicles 6. Road maintenance cost savings benefit 7. Traffic accident decrease benefit 8. Time and vehicle operating cost savings benefit gained from crossing of rail tracks
using ROBs 9. Environmental improvement benefit (decrease of automobile exhaust gas)

The Feasibility Study on The Development of Dedicated Freight Corridor for Delhi-Mumbai and Ludhiana-Sonnagar in India Final Report (Task 2)
Chapter 12 12-7
Counted Benefit: From the list of countable benefits, the following 10 items were calculated. Other uncountable benefits are covered by about 10% plus benefits at sensitivity analysis. Improvement benefits of ports at both ends of the DFC main lines, and of ICD (Inland Container Depot) maintenance are handled as independent facilities not included in the DFC benefits.
1) Time savings benefit for cargo transported by cargo trains (cargo) 2) Time savings benefit for passengers transported by passenger trains (passenger) 3) Time savings benefit for cargo transported by trucks (cargo) 4) Time savings benefit for passenger buses (passenger) 5) Working expense savings benefit from efficient operation of cargo trains (train) 6) Working expense savings benefit from efficient operation of passenger trains (train) 7) Vehicle operating cost savings benefit for trucks (vehicle) 8) Vehicle operating cost savings benefit for buses (vehicle) 9) Benefit from decrease in exhaust gas of route trucks. 10) Benefit from decrease in exhaust gas of route buses.
12.7 “WITH” AND “WITHOUT”
Generation of Benefits: Benefits are generated both with and without the DFC project. In the case of “without DFC”, only existing railroads and highways are analyzed. In the case of “with DFC”, the DFC is added to the analysis. As a result of this, service conditions and allocated transport volume will change, thus generating benefits.
Figure 12-2 is a simplified chart showing the relationship between traffic volume and traveling speed used in calculating benefits.
Benefit related to railway65:16、90(ton or person)
1.Time saving of cargo2.Time saving of passenger3.Cost saving of cargo train
Without 4.Cost saving of passenger trainWith
Benefit related to highway42:1 ton or person
5.Time saving of truck cargo6.Time saving of bus passenger7.Cost saving of truck8.Cost saving of bus
9.CO2 Saving of Bus 10.CO2 Saving of Truck
65
42
16t
1
90
Railway
Road
DFC
26km/h
35km/h
50km
45km/h
70km/h
Figure 12-2 Change in Service Levels and Benefits Generated for With and Without DFC

The Feasibility Study on The Development of Dedicated Freight Corridor for Delhi-Mumbai and Ludhiana-Sonnagar in India Final Report (Task 2)
Chapter 12 12-8
Without DFC, the total traffic volume of 107 (tons or persons) is transported by railways carrying 65 and highways carrying 42. With DFC, the distribution changes to 90 carried by the DFC, 16 by the existing railways, and 1 by highways.
The difference in transport volume between “with DFC” and “without DFC” results in a difference in the service level of the DFC, existing railways, and highways, thus generating benefits. For example, there are differences in operating speed, transportation distance, transportation cost, transported items (cargo, passenger), and working expenses.
In the case above, existing railways gain time and working expenses benefits from the difference in service level between 65 “without DFC” and 16 and 90 “with DFC”. Trucks and buses on the highways get time, cost, and exhaust gas savings benefit from the different service level between 42 “without DFC” and 1 “with DFC”. This is the same for passengers.
These combinations of traffic volume and different service level sometime generate negative benefits. In some cases, it generates much higher operating costs for buses and trucks. The benefit brought about by the construction of the DFC is reflected by the aggregate of all benefits, including positive benefits, negative benefits and decrease of benefits.
12.8 TIME SAVINGS BENEFIT
12.8.1 Measurement of Time Savings Benefit
The time savings benefit for freight trains, passenger trains, and trucks and buses generated by the construction of the DFC are calculated based on changes in freight and passenger transport volume, driving speed, transport distance, and cargo time and passenger time value (see chart below).
12.8.2 Operating Speed
Operating Speed of Railways: The operating speed of railway in the case of “Without” vary according to freight cars, passenger cars, super-express, express, local, regional, number of operating trains, etc.. From the Annual Statistical Statement, the average speed was estimated at 26 km/h, considering the speed of container trains and bulk trains. The operating speed of the DFC is based on the operating schedule prepared by the Study Team. The degree of influence caused by the construction of the DFC on related lines varies depending on whether the line is a feeder lines directly connected to DFC or if it is an unconnected existing line.
For passenger carriages, speed will not increase even ‘with DFC’. Instead, the number of operating trains will increase. The benefits in this case are generated by a decrease in waiting time resulting from increased frequency of trains. The average operating speed of freight and passenger trains is shown in Table 12-7 (see also Chapter 6 “Transport Planning”).
Traffic Demand
Time Saving
Running speedTrain, Bus, Truck
Traveling distance
Time saving benefit
Time value Freight, Passenger

The Feasibility Study on The Development of Dedicated Freight Corridor for Delhi-Mumbai and Ludhiana-Sonnagar in India Final Report (Task 2)
Chapter 12 12-9
Table 12-7 Travelling Speed, With and Without DFC
Traveling SpeedCargo Train
Without Project Existing, Feeder 26 km/hWith Project DFC 70 km/h
Feeder West (Container) 50 km/hEast (Bulk) 40 km/h
Existing 26 km/hPassenger Train
Without Project Existing, Feeder 55 km/hWith Project Feeder 55 km/h
Existing 55 km/hTruck & Bus
Without Project 35 km/hAfter 20years 20 km/h
With Project 50 km/hAfter 20years 30 km/h
Travelling speed of trucks and buses: Running surveys of parallel national highways and improved national highways, as well as congestion surveys were conducted. While it is possible to run at 80~90 km/h on the completed expressway sections of the Western DFC such as the 140-km Ahmedabad-Vadodara segment, the following assumptions are made in consideration of factors such as vehicles running on opposite direction, vehicles violating rules on the passing lanes, and a mixture of 4-lane and 2-lane roads.
・Traveling speed “without DFC”: decrease from 35 km/h to 20 km/h in 20 years
・ Traveling speed “with DFC”: decrease from 50 km/h to 30 km/h in 20 years
12.8.3 Unit time value of cargo
Price per ton: Time savings benefit for cargo was measured by converting cargo time saved for “with” and “without” into monetary value. The time value of cargo differs according to the content of the cargo. For the Western DFC, the main cargo transported are containers having a large variety of contents. However, most containers consist of import-export cargo, and the unit price per ton was thus estimated based on 20 import items and 21 export items, selected using import-export statistics. In the Eastern DFC, the main commodity is coal. Statistical data on coal is available annually in India, and the nationwide average price per ton was used (see Volume4 Technical Working Paper Task2, 12 Table12-19 Unit Price and Time Value of Cargo, Western DFC).
Western DFC commodities: 4,052 Rs./ton (average of imports and exports)
Eastern DFC commodities: 749 Rs./ton (mainly coal)
Time value per ton: Cargo lying in stock due to transport delays incurs costs by the hour. The cost per hour is equal to the short term interest rate (11% per annum) on the commodity price computed per hour. The cost of delayed cargo was computed per ton/hour by applying the economic price conversion coefficient of 85% to the cost per hour. The converted value of time saved is as below.
Western DFC commodities: 0.432 Rs./ton/hour
Eastern DFC commodities: 0.0080 Rs./ton/hour

The Feasibility Study on The Development of Dedicated Freight Corridor for Delhi-Mumbai and Ludhiana-Sonnagar in India Final Report (Task 2)
Chapter 12 12-10
12.8.4 Unit Time Value of Passengers
Characteristics of time value: The time value of passengers is higher than that of cargo. A great variety of passengers use trains: workers and non-workers, high income and low income earners, businessmen and tourists, students, children and the elderly. Detailed statistics on income groups in India are easily available, and there are many analyses in the field of time value in India. It is thus possible to calculate the time value of passengers, but generally accepted figures in other projects was adopted in this analysis.
Unit time value of passengers: The time savings value of existing railroad passengers and time savings value of bus passengers amounted to 2.10~9.3 Rs./passenger hour in 1999, and 5.3~21.4 Rs./passenger hour in 2004. After trial calculations, the average time value of 17.74 Rs./passenger hour was adopted for this analysis.
12.9 OPERATING EXPENSES SAVINGS BENEFIT
12.9.1 Savings Benefit for Railway Operating Expenses
For operating expenses “with DFC”, data from the attached “General Estimate of Operating and Maintenance Costs” was used. Personnel expenses based on scaled-down personnel management and physical expenses based on efficient operating and maintenance management form the basis for estimating operating expenses. In particular, the unit personnel costs for railway stations, facilities, and electricity will decrease annually as the operation length and number of trains increase.
In the case of “without DFC”, average operating expenses of the existing railway is derived from the Indian Railways Annual Statistics Report. It is calculated as 0.31 Rs./ton-km x 85% = 0.264 Rs./ton-km. Average operating expenses of existing railway ‘with DFC’ is assumed to drop by 5% (see Chapter 9, ”Operation and Maintenance Planning”).
12.9.2 Vehicle Operating Costs and Running Benefits for Trucks and Buses
Pre-suppositions: The benefit is generated from the changes in traveling speed between “with DFC” and “without DFC”. The average traveling distance of truck and buses are based on a survey of the origin and destination of each commodity. The traveling distance varies yearly: that of Western DFC is between 780km and 980km, while the Eastern DFC is between 500km and 520km. Average transport volume is estimated at 10 tons by truck and 35 passengers by bus from Enterprise Study of India.
Traveling speed and Running Costs: Vehicle operating costs increase as traveling speed decreases. The formula of the integral curve is from the formula tested by the Federal Highway Authority of United Stated, modified for India as follows. Purchase price for trucks is set at 1,135,264 Rs. and for buses at 1,335,605 Rs., converted to economic value:
・large size bus: Y = 0.003464x2 - 0.452039x + 24.768072 + 3.35
・large size truck: Y = 0.002082x2 – 0.2603x + 17.274845 + 3.64
Where X is traveling speed and Y is vehicle operating cost (fuel, lubricant oil, tires, etc.). The largest change occurs in fuel costs (80%). Some costs that are not affected by speed are overhead cost, crew costs, and capital cost. (See Volume4 Technical Working Paper Task2, 12 Table 12-21, “Input Data for Unit Vehicle Operating Cost at Base Speeds”)

The Feasibility Study on The Development of Dedicated Freight Corridor for Delhi-Mumbai and Ludhiana-Sonnagar in India Final Report (Task 2)
Chapter 12 12-11
12.10 CALCULATION OF BENEFIT FROM DECREASE OF VEHICLE EXHAUST GAS
Exhaust of CO2: Environmental pollution caused by exhaust gases has led to problems of global warming. Increase in traffic and exhaust gases “without DFC” was compared to the benefits of decreasing road traffic and lower CO2 emissions. The relationship between a decrease in speed and the resulting increase in fuel expenses can be calculated by the same formula as the one used for running costs benefit. Converting fuel consumption per 1 litre to calories, 1 litre of gasoline = 0.0371GJ calorie = weight of CO2 per calorie 1= 74.01kg.
Number of Gasoline Gasoline CO2 CO2
Truck/Bus Consumption Joule Mass: Kg Price/ton
EmissionsTrading Market
ConversionRatio74.01kg
ConversionRatio0.037GJ
RunningDistanc
RunningSpeed
CO2 of PowerPlant -36.7%
CO2 SavingBenefit
Figure 12-3 Calculation of Benefit from Decrease of Vehicle Exhaust Gas
Price of CO2 per 1000 kg: Since there has been until now no demand for CO2, it is ordinarily not priced. However, the CO2 Emissions Trading Scheme has created a “demand” for CO2. The trading price of CO2 per 1000kg is determined in the same way as the stock market, but it is very unstable at present, ranging from 1 dollar to 23 dollars. 5 dollars/ton is assumed in the calculation of this benefit.
Power Plant CO2: While electric locomotives do not directly emit CO2, CO2 is produced by the power plant that supply electricity to the trains. A survey of railway CO2 by the Railway Research Institute in Japan reveals that the ratio of CO2 per ton-kg is 100 (trucks): 36.7 (railways). Thus, the benefit due to CO2 was calculated by subtracting power plant CO2 from the “without DFC” emissions of trucks and buses.
(Volume4 Technical Working Paper Task2, Table12-15 Western DFC, Truck, Benefit from Decrease of Automobile Exhaust Gas; Table12-16 Western DFC, Bus, Benefit from Decrease of Automobile Exhaust Gas; 12-17 Eastern DFC, Truck, Benefit from Decrease of Automobile Exhaust Gas; 12-18 Eastern DFC, Bus, Benefit from Decrease of Automobile Exhaust Gas)
12.11 RESULTS OF BENEFIT AND COSTS CALCULATION
Table 12-8 and Table 12-9 show the results of benefit and costs calculation. Benefits are generated not only for cargo, but also for passengers. Furthermore, positive benefits extend beyond railways to trucks & buses as well. On the other hand, trucks & buses generate CO2, hence causing negative benefits.
In order to obtain an accurate grasp of benefits, the period of analysis was set at 20 years, from 2013/14 to 2033/34. However, in the cost-benefit analysis, the period between 2033/34 and 2042/43 has been covered as well. The main characteristics are as follows.

The Feasibility Study on The Development of Dedicated Freight Corridor for Delhi-Mumbai and Ludhiana-Sonnagar in India Final Report (Task 2)
Chapter 12 12-12
Table 12-8 Summary for the Total Benefit Stream, Western DFC Western DFC Billion Rs.
Time Saving Working Expenses Saving Co2 Saving GrandYear Cargo Passenger Cargo Passenger Truck Bus Total
Train Truck Train Bus Train Truck Train Bus2008-092009-102010-112011-122012-132013-14 1.0 0.0 5.9 0.6 11.5 0.9 6.1 0.0 0.1 0.0 26.22014-15 1.1 0.0 6.0 0.8 12.0 1.1 6.3 0.0 0.2 0.0 27.52015-16 1.1 0.0 6.1 1.0 12.5 1.5 6.5 0.0 0.2 0.0 29.02016-17 1.2 0.0 6.3 1.2 13.1 1.9 6.6 0.0 0.3 0.0 30.72017-18 1.3 0.1 6.4 1.5 13.6 2.5 6.8 0.0 0.3 0.0 32.72018-19 0.9 0.1 6.5 1.7 14.5 3.3 6.9 0.1 0.4 0.0 34.42019-20 0.8 0.1 6.7 2.0 14.6 3.9 7.1 0.1 0.5 0.0 35.82020-21 0.8 0.1 6.9 2.3 14.7 4.5 7.3 0.1 0.6 0.0 37.32021-22 0.8 0.1 7.1 2.6 14.8 5.2 7.6 0.1 0.6 0.0 39.02022-23 0.7 0.1 7.3 4.6 14.9 6.1 7.8 0.1 0.7 0.0 42.42023-24 0.7 0.2 7.2 4.3 15.0 7.0 7.8 0.1 0.8 0.0 43.12024-25 0.7 0.2 7.2 4.4 15.3 7.8 7.8 0.2 0.9 0.0 44.42025-26 0.7 0.2 7.2 5.2 15.6 8.7 7.8 0.2 0.9 0.0 46.52026-27 0.7 0.2 7.1 6.3 15.9 9.7 7.8 0.2 1.0 0.0 48.92027-28 0.6 0.2 7.1 7.5 16.2 10.8 7.8 0.3 1.1 0.0 51.62028-29 0.6 0.3 7.0 8.9 16.5 12.0 7.8 0.4 1.1 0.0 54.82029-30 0.6 0.3 6.8 10.5 16.6 13.3 7.7 0.4 1.2 0.0 57.52030-31 0.6 0.3 6.6 12.4 16.8 14.6 7.6 0.5 1.3 0.0 60.62031-32 0.5 0.3 6.4 14.7 16.6 16.0 7.4 0.5 1.4 0.0 63.82031-33 0.5 0.3 6.4 15.1 16.6 16.6 7.4 0.6 1.4 0.0 64.92033-34 0.5 0.4 6.4 15.6 16.6 17.3 7.4 0.6 1.4 0.0 66.12034-35 0.5 0.4 6.4 15.6 16.6 17.3 7.4 0.6 1.4 0.0 66.12035-36 0.5 0.4 6.4 15.6 16.6 17.3 7.4 0.6 1.4 0.0 66.12036-37 0.5 0.4 6.4 15.6 16.6 17.3 7.4 0.6 1.4 0.0 66.12037-38 0.5 0.4 6.4 15.6 16.6 17.3 7.4 0.6 1.4 0.0 66.12038-39 0.5 0.4 6.4 15.6 16.6 17.3 7.4 0.6 1.4 0.0 66.12039-40 0.5 0.4 6.4 15.6 16.6 17.3 7.4 0.6 1.4 0.0 66.12040-41 0.5 0.4 6.4 15.6 16.6 17.3 7.4 0.6 1.4 0.0 66.12041-42 0.5 0.4 6.4 15.6 16.6 17.3 7.4 0.6 1.4 0.0 66.12042-43 0.5 0.4 6.4 15.6 16.6 17.3 7.4 0.6 1.4 0.0 66.1
Total 20.8 6.7 198.4 263.5 462.9 320.3 220.3 9.7 28.5 0.5 1,532% 1.4% 0.4% 13.0% 17.2% 30.2% 20.9% 14.4% 0.6% 1.9% 0.0% 100.0%
Table 12-9 Summary for the Total Benefit Stream, Eastern DFC
Eastern DFC Time Saving Working Expenses Saving Co2 Saving Grand
Year Cargo Passenger Cargo Passenger Truck Bus TotalTrain Truck Train Bus Train Truck Train Bus
2008-092009-102010-112011-122012-132013-14 0.01 0.00 5.7 0.7 7.8 0.9 6.0 0.0 0.1 0.00 212014-15 0.01 0.00 5.8 0.9 8.1 1.1 6.1 0.0 0.1 0.07 222015-16 0.01 0.01 5.9 1.2 8.2 1.4 6.3 0.0 0.1 0.09 232016-17 0.01 0.01 6.1 1.6 8.1 1.8 6.5 0.0 0.2 0.11 242017-18 0.01 0.01 6.2 2.1 7.7 2.3 6.7 0.0 0.2 0.14 252018-19 0.01 0.01 6.3 2.5 7.1 2.9 6.7 0.0 0.3 0.17 262019-20 0.01 0.01 6.4 3.0 8.2 3.3 6.9 0.0 0.3 0.20 282020-21 0.01 0.02 6.5 3.5 9.2 3.8 7.0 0.0 0.4 0.23 312021-22 0.01 0.02 6.6 4.2 10.3 4.2 7.2 0.0 0.4 0.26 332022-23 0.01 0.02 6.7 4.9 11.5 4.8 7.3 0.0 0.4 0.30 362023-24 0.02 0.02 6.5 6.0 12.6 5.4 7.2 0.0 0.4 0.35 392024-25 0.02 0.02 6.4 7.0 12.5 6.0 7.2 0.0 0.4 0.41 402025-26 0.02 0.03 6.4 8.2 12.3 6.6 7.2 0.0 0.5 0.47 422026-27 0.01 0.03 6.3 9.6 12.2 7.4 7.1 0.0 0.5 0.55 442027-28 0.01 0.03 6.2 11.1 12.0 8.1 7.1 0.0 0.5 0.63 462028-29 0.01 0.03 6.1 13.0 11.8 9.0 7.1 0.0 0.5 0.73 482029-30 0.01 0.04 5.8 15.0 11.7 9.9 6.9 0.0 0.6 0.84 512030-31 0.01 0.04 5.5 17.4 11.6 10.8 6.7 0.0 0.6 0.95 542031-32 0.01 0.04 5.2 20.2 11.5 11.8 6.5 0.0 0.6 1.08 572031-33 0.01 0.04 5.2 20.8 11.5 12.2 6.5 0.0 0.6 1.23 582033-34 0.01 0.04 5.2 21.4 11.5 12.7 6.5 0.0 0.6 1.23 592034-35 0.01 0.04 5.2 21.4 11.5 15.8 6.5 0.0 0.6 1.23 622035-36 0.01 0.04 5.2 21.4 11.5 15.8 6.5 0.0 0.6 1.23 622036-37 0.01 0.04 5.2 21.4 11.5 15.8 6.5 0.0 0.6 1.23 622037-38 0.01 0.04 5.2 21.4 11.5 15.8 6.5 0.0 0.6 1.23 622038-39 0.01 0.04 5.2 21.4 11.5 15.8 6.5 0.0 0.6 1.23 622039-40 0.01 0.04 5.2 21.4 11.5 15.8 6.5 0.0 0.6 1.23 622040-41 0.01 0.04 5.2 21.4 11.5 15.8 6.5 0.0 0.6 1.23 622041-42 0.01 0.04 5.2 21.4 11.5 15.8 6.5 0.0 0.6 1.23 622042-43 0.01 0.04 5.2 21.4 11.5 15.8 6.5 0.0 0.6 1.23 62
Total 0.4 0.9 174.0 366.9 320.8 268.9 201.3 0.0 14.0 21.1 1,368% 0.0% 0.1% 12.7% 26.8% 23.4% 19.6% 14.7% 0.0% 1.0% 1.5% 100%

The Feasibility Study on The Development of Dedicated Freight Corridor for Delhi-Mumbai and Ludhiana-Sonnagar in India Final Report (Task 2)
Chapter 12 12-13
Characteristics of Total Benefits: The total component of benefits and order of benefits is as follows. The main benefits consist of the top five items, which amount to 95.8% in the Western DFC and 97.6% in the Eastern DFC.
Table 12-10 Components by Items of Result of Benefits Estimation Benefit Items West East
1 Working expenses saving of the cargo train by efficient 32.5% 26.9%2 Vehicle operating saving benefit of the truck (vehicle) 17.7% 15.7%3 Working expenses saving benefit of the passenger train by 16.5% 17.7%4 Time saving benefit of the passengers by passenger train 15.2% 15.7%5 Time saving benefit of the passenger bus (passenger) 14.5% 21.6%6 Benefit of exhaust gas decrease of route trucks. 1.7% 1.0%7 Time saving benefit of the cargo transported by cargo train 1.6% 0.1%8 Vehicle operating cost saving benefit of the bus (vehicle) 0.5% 0.1%9 Time saving benefit of the cargo transported by truck (cargo) 0.4% 0.1%10 Benefit of exhaust gas decrease of route buses. 0.1% 1.2%
0%
5%
10%
15%
20%
25%
30%
35%
C.T
rain
Tru
ck
P.T
rain
Bus
C.T
rain
Tru
ck
P.T
rain
Bus
Tru
ck
Bus
Time Saving Working
Expenses Saving
Co2
Saving
0%
5%
10%
15%
20%
25%
30%
C.T
rain
Tru
ck
P.T
rain
Bu
s
C.T
rain
Tru
ck
P.T
rain
Bu
s
Tru
ck
Bu
s Time Saving Working Expenses
Saving
Co2
Saving
Western DFC Eastern DFC
Figure 12-4 Benefits Components Graph
Time Savings Benefits: Cargo vs. Passengers: The purpose of constructing the DFC is to transport long-distance cargo quickly and inexpensively. However, the benefit analysis reveals that time savings benefit is actually larger for passengers than for cargo. Time savings benefit generated by the earlier arrival of cargo is very low. On the other hand, time savings benefit for passengers are very high, resulting from the shift of cargo previously transported in mixed passenger-cargo trains to all-cargo trains in the DFC. As the average running speed of passenger trains is 55 km/h for both “with DFC” and “without DFC” scenarios, the time savings benefit is not gained from an increase in the speed of passenger trains but from the higher number of extra trains that can be operated, resulting in the drastic reduction of passenger waiting time.
The ratio of time savings benefit for cargo trains and passenger trains is 5:95 for the Western DFC and 1:99 for the Eastern DFC.
The reason why passenger transport has higher benefit is that the value of persons is higher than the value of cargo. Time value of cargo per ton per hour is 0.043 Rs. in the Western DFC where containers are main cargo, and 0.008 Rs. in the Eastern DFC where coal is the main

The Feasibility Study on The Development of Dedicated Freight Corridor for Delhi-Mumbai and Ludhiana-Sonnagar in India Final Report (Task 2)
Chapter 12 12-14
cargo. On the other hand, value of person is 17.74 Rs. per person per hour, which is much higher. Passenger trains in India are very congested at present, and the construction of the DFC will contribute to the reduction of this problem. This ratio is about the same in the Eastern and Western Bypass Corridors.
Effects of Influence on Road Traffic: Savings of Traveling Cost of Trucks: Construction of the DFC has a big influence on road traffic. In the case of ”without DFC”, cargo and passengers which cannot be transported on the usual lines have to use parallel national highways. The difference in number of trucks per day between”with” and “without” (in other words, “forced out traffic”) is shown in the table below. The average distance of this traffic is estimated at 980km for the Western DFC and 525km for the Eastern DFC.
Table 12-11 Number of Trucks/day on Parallel Highway ”Without DFC”
Year Western DFC Eastern DFC 2013/14 4,138 6,735 2018/19 13,124 17,774 2023/24 23,694 23,464 2028/29 33,564 29,683
For “Without DFC”, traveling speed is set at 35 km/h; and “With DFC” at 50km/h. Along with increase of traffic volume, traveling speed decreases. Thus traveling cost saving accounts for 17.5% of the total benefit of the Western DFC, and 15.7% of the Eastern DFC. Benefits for trucks on regular routes generated from a decrease of traffic congestion and by increase of speed of long–distance cargo to be transferred to DFC.
Effects of Influence on Road Traffic: Benefit of Exhaust Gas Reduction: This accounts for 1% of the total benefit. The price of CO2 is traded in the same way as stocks in the stock market, and the price of gas emission rights fluctuate between 1 to 23 dollars. For the present calculation, the price is assumed to be 5 dollars per ton. If 1 ton is priced at 10 dollars, this benefit will account for 3% each of the Eastern and Western DFC.
In some cases, CO2 savings benefit is included in railroad benefit, and in other cases it is not. It accounts only for 1% of the total benefits. However, total savings benefit of exhaust gas reduction of both the Western and Eastern DFC over a period of 30 years amounts to 58,700,000 Rs. If the DFC is not constructed, roads will overflow with vehicles, resulting in a big national loss (See Chapter 10, “ENVIRONMENT AND SOCIAL IMPACT MEASURES MITIGATION STUDY (ESIMMS)”).
Meaning of Time Savings Benefits of DFC: Importance of ICD: Time savings benefit and operating savings benefit from DFC construction is about the same at 50:50; however, there are specific characteristics depending on transport mode. In cargo transport time, the weight of time savings benefit is not large. Rather than time savings, other savings have more important meaning, such as port areas to connect transport, consolidation of ICD areas, access roads in the surrounding areas, delivery form, savings in delivery time, etc. Transport of freight in lesser time includes benefits of other than just time savings benefit, such as an increase of added value of cargo. In this report only direct benefits are calculated, and indirect added value is not estimated. Furthermore, implementation of the industrial estate and export corridor will raise added value. Accordingly, effects analysis by macro analysis should be considered.
1) Time savings benefit ・・Passenger transport by passenger trains & buses 〉time savings of cargo trains & trucks
2) Operating cost savings・・Cargo transport by freight trains & trucks 〉operating costs of passenger trains & buses

The Feasibility Study on The Development of Dedicated Freight Corridor for Delhi-Mumbai and Ludhiana-Sonnagar in India Final Report (Task 2)
Chapter 12 12-15
Operating Cost Savings Benefit of Cargo Trains: Operating cost savings benefit of cargo trains accounts for the largest benefit. For the Western DFC, it accounts for 33.2 % of the total benefit; for the Eastern DFC, it is 26.9%. Operating cost savings benefit of the cargo trains consist of DFC personnel cost savings, effective operational & maintenance system, and advantage of long distance transport. This is the benefit from comparison of engineering alternatives to operate in the optimum facilities.
(Refer to Volume4 Technical Working Paper Task2, 12 Table 12-7 “Time Savings Benefit of Cargo on Cargo Trains & Trucks, Western DFC”; Table 12-8 “Time Savings Benefit of Passengers Transported by Train & Buses, Western DFC”; Table 12.9 “Time Savings Benefit of Cargo on Cargo Trains & Trucks, Eastern DFC”; Table 12.10 “Time Savings Benefit of Passengers Transported by Trains & Buses, Eastern DFC”; Table 12-11 “Working Expense Savings Benefit for Cargo Trains and Vehicle Operating of Trucks, Western DFC”; Table 12-12 “Working Expenses Saving Benefit for Passenger Trains and Vehicle Operating of Buses, Western DFC”; Table 12-13 “Working Expense Saving Benefit for Cargo Trains and Vehicle Operating of Trucks, Eastern DFC”; Table 12-14 “Working Expense Savings Benefit for Passenger Trains and Vehicle Operating of Buses, Eastern DFC”)
12.12 SENSITIVITY ANALYSIS ON EIRR
Overall Examination: The EIRR of the DFC proves its feasibility as shown by the results of the evaluation. There are uncertain matters for evaluation, since the scale of the project is so large - the length of the Western DFC is 1468 km, and the Eastern DFC is 1309 km.
- Economic Internal Rate of Return of Western DFC i.e. EIRR is 14.09% (Base Case)
B/C Ratio 1.22, Net Present Value (NPV) 35,510Million Rs.
- Economic Internal Rate of Return of Eastern DFC i.e. EIRR is 15.26% (Base Case)
B/C Ratio 1.37, Net Present Value(NPV) 54,274 Million Rs.
Influence of increase of costs: If the costs increase by 30%, the EIRR of the Western DFCs discounted at the capital opportunity cost of 12% makes it unfeasible. Increase of 30% at market price means Rs. 82,960 Million for the Western DFC and Rs. 61,400 Million for the Eastern DFC. Since this much cost increase is not possible, this project will be feasible if estimated benefits are secured.
Table 12-12 Sensitivity Analysis – Western DFC EIRR West
Cost / Base 10% 20% 30%Benefit / Base 14.09% 13.19% 12.40% 11.70%
-10% 12.95% 12.10% 11.36% x-20% 11.74% x x x-30% x x x x
Table 12-13 Sensitivity Analysis – Eastern DFC
EIRR EastCost / Base 10% 20% 30%
Benefit / Base 15.26% 14.38% 13.61% 12.78%-10% 14.11% 13.28% 12.56% 11.90%-20% 12.89% 12.12% 11.44% x-30% 11.60% x x x

The Feasibility Study on The Development of Dedicated Freight Corridor for Delhi-Mumbai and Ludhiana-Sonnagar in India Final Report (Task 2)
Chapter 12 12-16
Influence of Changes of Benefits: Decrease of benefits affects the feasibility of the Western DFC at 20%, but for the Eastern DFC it remains feasible. Benefits have more effect than costs. Benefits were calculated for 10 items, out of which only 5 are important: time value savings benefit of passengers on trains and of passengers on buses, operational cost savings benefit of cargo trains and of trucks, and operational cost savings benefit of passenger trains. These benefits are calculated based on appropriate estimation of presumed unit value and on traffic demand, and will not change drastically.
12.13 FINANCIAL EVALUATION
Short-term index and long-term index: This section analyzes the feasibility of the construction plan from the financial side. The financial analysis in this chapter is to investigate uncertainty of long-term DFC railroad investment, and not a short-term management analysis. It is to prove profitability by comparing revenues and costs estimate for 35 years with revenues and costs discounted at present value. In order to prove the long term revenues and costs for 35 years, an index called the Financial Rate of Return (FIRR) is used in the analysis.
FinancialEvaluation
EnterpriseStandpoint
Balance of Earnings& Expenses
MarketCost
Revenue
Discounted toPresent Value
InternalFinancialRate of Return(FIRR)
Figure 12-5 Evaluation Procedure for Financial Analysis
Enterprise and project durability: The DFC is to be undertaken by two enterprises: Indian Railways (IR) composed mainly of railroad management, and the Public Corporation in charge of construction and maintenance of infrastructure (DFCCIL). Financial analysis is undertaken to examine if the investment will be profitable for the two enterprises in totality. Accordingly, the total traffic using the DFC section is considered as the object of revenue. Division of revenue between the two enterprises will be analyzed in Chapter 13 “Management Plan Needed for DFCCIL,” including interests on construction costs, escalation, and tax, as it is concerned with its business management.
12.14 CONCLUSION OF THE FINANCIAL EVALUATION
Internal Financial Rate of Return: Table 12-14 shows the results of the financial evaluation of the two DFC from the point of profitability of the project. Total costs and total revenues are compared for 35 years. The calculation is aimed at the ratio to be equal between the total discounted cost and total discounted revenue (FIRR). FIRR is as shown in the table.
Financial Rate of Return of Western DFC 9.08%
Financial Rate of Return of Eastern DFC 15.59%

The Feasibility Study on The Development of Dedicated Freight Corridor for Delhi-Mumbai and Ludhiana-Sonnagar in India Final Report (Task 2)
Chapter 12 12-17
Table 12-14 Internal Financial Rate of Return of Western DFC Western DFC Million Rs.
Before Discounting FIRRyear Revenue Capital Rolling Working Total Discount Present
Cost Stock Expenses Cost Rate Value2008-09 18,958 18,958 100.0% -18,958 2009-10 37,098 37,098 91.7% -34,009 2010-11 38,101 38,101 84.0% -32,021 2011-12 48,695 1,464 50,159 77.0% -38,645 2012-13 40,568 40,568 70.6% -28,654 2013-14 16,686 23,449 18,863 5,449 47,761 64.8% -20,121 2014-15 19,599 9,921 4,012 6,404 20,336 59.4% -438 2015-16 23,020 3,374 4,386 7,526 15,286 54.4% 4,2092016-17 27,038 4,706 8,845 13,552 49.9% 6,7282017-18 31,758 5,672 10,395 16,067 45.7% 7,1762018-19 37,301 6,571 12,217 18,788 41.9% 7,7622019-20 39,694 3,134 12,925 16,059 38.4% 9,0852020-21 42,241 3,255 13,674 16,930 35.2% 8,9192021-22 44,952 3,394 14,467 17,861 32.3% 8,7512022-23 47,836 3,366 15,306 18,672 29.6% 8,6372023-24 50,905 3,610 16,193 19,803 27.1% 8,4442024-25 53,101 2,992 16,906 19,898 24.9% 8,2642025-26 55,392 2,914 17,650 20,565 22.8% 7,9462026-27 57,782 2,969 18,428 21,396 20.9% 7,6112027-28 60,275 1,856 19,239 21,094 19.2% 7,5132028-29 62,875 1,395 20,086 21,481 17.6% 7,2772029-30 65,401 543 20,862 21,405 16.1% 7,0902030-31 68,029 548 21,669 22,216 14.8% 6,7682031-32 70,762 553 22,506 23,059 13.5% 6,4612031-33 70,762 557 22,506 23,063 12.4% 5,9232033-34 70,762 350 22,506 22,856 11.4% 5,4532034-35 70,762 -9 22,506 22,497 10.4% 5,0372035-36 70,762 -9 22,506 22,497 9.6% 4,6172036-37 70,762 -9 22,506 22,497 8.8% 4,2332037-38 70,762 -9 22,506 22,497 8.0% 3,8802038-39 70,762 -9 22,506 22,497 7.4% 3,5572039-40 70,762 -9 22,506 22,497 6.8% 3,2612040-41 70,762 -9 22,506 22,497 6.2% 2,9902041-42 70,762 -9 22,506 22,497 5.7% 2,7412042-43 70,762 -9 22,506 22,497 5.2% 2,513
1,653,028 220,162 77,027 528,314 825,503 9.08% -0
Investment Feasibility: Therefore, low-interest rate and long term fund resources must be obtained. Profit and loss balance is excluded from the financial analysis. Management analysis, which is influenced by fund sources and financing conditions, is also excluded from the financial analysis. These flows are not discounted, but analyzed by actual figures, namely cash flows. This analysis of fund balance is in the area of management analysis, and is not included in FIRR.
Conclusion of investment feasibility of the analysis results: If the index is lower than the opportunity cost of capital, i.e. 12%, it means that implementation timing is too early, or that the scale is too big. In this evaluation, as the result of using every possible data for calculation, EIRR of the project was found higher than 12%: 14.09% for the Western DFC, and 15.26% for the Eastern DFC. The conclusion is that the project should be implemented. Investment scale and planning scale are not too large. If it is not implemented, national resources may be wasted. For the financial analysis, FIRR, which is the index of long-term investment evaluation, was found to be 9.08% for the Western DFC and 15.59% for the Eastern DFC. As for the Western DFC, it should be implemented from national viewpoint, since EIRR takes precedence over FIRR. The DFC needs low interest rate and long term repayment loan such as ODA for the implementation.

The Feasibility Study on The Development of Dedicated Freight Corridor for Delhi-Mumbai and Ludhiana-Sonnagar in India Final Report (Task 2)
Chapter 12 12-18
Table 12-15 Internal Financial Rate of Return of Eastern DFC Eastern DFC Million Rs.
Before Discounting FIRRyear Revenue Capital Rolling Working Total Discount Present
Cost Stock Expenses Cost Rate Value2008-09 14,460 14,460 100.0% -14,460 2009-10 28,119 28,119 86.5% -24,326 2010-11 28,858 28,858 74.8% -21,599 2011-12 34,538 1,956 36,494 64.8% -23,631 2012-13 27,921 27,921 56.0% -15,641 2013-14 26,271 14,674 21,911 4,155 40,740 48.5% -7,012 2014-15 30,097 5,712 4,526 4,782 15,020 41.9% 6,3212015-16 34,480 1,626 4,519 5,504 11,649 36.3% 8,2822016-17 39,502 5,095 6,334 11,429 31.4% 8,8092017-18 45,255 5,558 7,290 12,848 27.1% 8,7982018-19 51,846 6,348 8,390 14,738 23.5% 8,7162019-20 52,263 728 8,455 9,183 20.3% 8,7542020-21 52,684 607 8,520 9,128 17.6% 7,6572021-22 53,108 757 8,586 9,343 15.2% 6,6562022-23 53,535 628 8,653 9,281 13.2% 5,8232023-24 53,966 494 8,720 9,214 11.4% 5,0942024-25 54,361 618 8,783 9,401 9.8% 4,4272025-26 54,758 621 8,847 9,467 8.5% 3,8592026-27 55,159 412 8,911 9,322 7.4% 3,3782027-28 55,563 546 8,975 9,521 6.4% 2,9362028-29 55,969 499 9,040 9,539 5.5% 2,5612029-30 56,335 463 9,097 9,559 4.8% 2,2322030-31 56,703 335 9,154 9,489 4.1% 1,9492031-32 57,073 338 9,211 9,549 3.6% 1,6982031-33 57,073 340 9,211 9,551 3.1% 1,4692033-34 57,073 343 9,211 9,554 2.7% 1,2702034-35 57,073 -10 9,211 9,201 2.3% 1,1072035-36 57,073 -10 9,211 9,201 2.0% 9582036-37 57,073 -10 9,211 9,201 1.7% 8292037-38 57,073 -10 9,211 9,201 1.5% 7172038-39 57,073 -10 9,211 9,201 1.3% 6202039-40 57,073 -10 9,211 9,201 1.1% 5372040-41 57,073 -10 9,211 9,201 1.0% 4642041-42 57,073 -10 9,211 9,201 0.8% 4022042-43 57,073 -10 9,211 9,201 0.7% 347
1,566,731 155,908 57,552 252,727 466,187 15.59% 0
12.15 DFC FINANCIAL COSTS
12.15.1 Construction Costs
Financial Cost: The subjects of financial costs are: 1) construction costs, 2) operating costs, and 3) rolling stock costs such as locomotives and freight trains. For the construction cost calculation in financial analysis, price adjustments (economic price) as in the economic analysis are not conducted. For adjustment of items, the following four items were excluded, as in the case for economic analysis.
1) Electric locomotives procurement
2) Spare parts for electric locomotives
3) Price escalation
4) Financial interests during construction
Cost component for financial analysis and amount of cost is as follows.

The Feasibility Study on The Development of Dedicated Freight Corridor for Delhi-Mumbai and Ludhiana-Sonnagar in India Final Report (Task 2)
Chapter 12 12-19
Table 12-16 Financial Costs of Construction
Financial Cost Million Rs.
Items Western DFC
Eastern DFC
Civil &Building, Track 109,545 70,038 Electrical & Mechanical Work 17,142 13,791 Signaling & Telecommunication Work 24,124 20,420 Cosultancy Service 5,432 3,419 Physical Contingency 10,084 7,369 Land Acquisition 26,439 25,393 General Administration 10,598 7,235 Others 16,799 8,244 Total for Financial Evaluation 220,162 155,908
Grand Total 287,420 212,437
Annual Distribution of Construction Costs: The period of construction is 6 years for Phase I-a, 8 years for Phase I-b, and 6 years for Phase II. Phase II starts two years after the start of Phase I-b. The construction cost is distributed yearly and combined for these 3 periods.
Table 12-17 Annual Distribution of Financial Costs of Construction
Finansial Cost Million Rs.Year Western DFC Eastern DFC
2008-09 18,958 9% 14,460 9%2009-10 37,098 17% 28,119 18%2010-11 38,101 17% 28,858 19%2011-12 48,695 22% 34,538 22%2012-13 40,568 18% 27,921 18%2013-14 23,449 11% 14,674 9%2014-15 9,921 5% 5,712 4%2015-16 3,374 2% 1,626 1%
220,162 100% 155,908 100%
12.15.2 Operating and maintenance costs of DFC
Personnel and facility costs: The cost items are divided into personnel costs and facility costs. Personnel costs of locomotive engineers and other train personnel change depending on train/km. Personnel costs of electricity, facilities, and stations change depending on the number of stations and operating km.
Operating unit costs decrease as transport volume increases. First, the unit cost of each item was increased, multiplying with train km and with operating km in order to find personnel costs. The standard estimation for unit personnel cost of the DFC is based on a smaller number of staff, different from the existing lines. The standard of property cost estimation is efficient operating and maintenance system (see Chapter 9, “Operating and Maintenance Costs”section; Primary Standard of DFC).
Facility costs consist of stations, power costs, electricity costs, building costs, general management cost, railroad police cost, etc. and they fluctuate according to operating km. Unit cost of property by facilities is listed in Chapter 9 “Operating and Maintenance cost”.
Locomotive: The required number and cost of locomotives for the first year of operation, 2013-14, are as follows. The unit cost of 8-wheel locomotive for bulk is estimated at 212 Million Rs. Unit cost of 6-wheel locomotive for containers is estimated at 130 Million Rs. (For details, see Volume4 Technical Working Paper Task2,12 Table 12-3,Table 12-5, Number of Locomotives, Wagons and the Cost by Operation Years)

The Feasibility Study on The Development of Dedicated Freight Corridor for Delhi-Mumbai and Ludhiana-Sonnagar in India Final Report (Task 2)
Chapter 12 12-20
8-Wheel Locomotives for Bulk 6-Wheel Locomotives for Containers
Western DFC 68cars 14,416Million Rs. 246cars 31,980 Million Rs
Eastern DFC 178cars 37,736 Million Rs. 6cars 780Million Rs.
Locomotives for the DFC are assumed to be all new. The locomotives actually run from the DFC directly onto the feeder lines, but the cost is estimated assuming they run within the DFC. The number of carriages is calculated based on transport demand, train km, and train operation plan. However, 20 carriages are to be purchased for trials in year 2011-12.
Cargo trains: For cargo trains, the number is assumed to be the same as the required number of locomotives. However, in the opening year it is assumed that 70% will come from existing trains, and the price is assumed to be 50% of the new product. The service life of trains is assumed as 36 years for the new trains, and 20 years for the existing carriages. (For more details, refer to Chapter 6, “TRANSPORT PLANNING”)
12.16 SENSITIVITY ANALYSIS OF FIRR
Renge of Feasibility: Freight revenue forms the basis of FIRR. It is estimated based on the present freight rate of Indian Railways, which is multiplied with estimated transport ton/km of the DFC. On the other hand, construction cost is estimated by items.
Cost of cars is based on the required number of cars linked with volume of demand. Operation cost is estimated on lower number of personnel as compared to existing lines and property costs of the DFC.
Under such conditions, FIRR of the basic case is as follows. Therefore, low-interest rate and long term fund resources must be secured.
Table 12-18 Sensitivity Analysis – Western DFC
FIRR WestCost / Base 10% 20% 30%
Benefit / Base 9.08% 8.43% x x-10% 7.80% 7.19% x x-20% x x x x-30% x x x x
Table 12-19 Sensitivity Analysis – Eastern DFC
FIRR EastCost / Base 10% 20% 30%
Benefit / Base 15.59% 14.61% 13.75% 12.98%-10% 14.06% 13.15% 12.34% 11.63-20% 12.42% 11.58% 10.83% 10.17-30% 10.64% 10.22 x x
Freight and the benefits: Freight charges affect the calculation of FIRR to a great extent. According to the results of FIRR analysis, the freight charges of the Eastern DFC are too high, while that of the Western DFC is appropriate, if estimations of construction costs, carriage costs, and operational costs are correct. Figure 12-6 and Figure 12-7 compares freight charge

The Feasibility Study on The Development of Dedicated Freight Corridor for Delhi-Mumbai and Ludhiana-Sonnagar in India Final Report (Task 2)
Chapter 12 12-21
revenue and benefits. Usually in the case of expressways, toll revenue accounts for 70% of the benefits. Accordingly, highway users receive about 30% of user surplus.
0
10,000
20,000
30,000
40,000
50,000
60,000
70,000
80,000
1 3 5 7 9 11 13 15 17 19 21 23 25
Benefit
Revenue
0
10,000
20,000
30,000
40,000
50,000
60,000
70,000
1 3 5 7 9 11 13 15 17 19 21 23
Benefit
Revenue
Figure 12-6 Revenue and Benefit, Western DFC Figure 12-7 Revenue and Benefit, Eastern DFC
Difference of Revenue Curve: For the Western DFC, benefits and freight charge revenue are comparatively similar, but the freight revenue still exceeds the benefits. The freight revenue of the Eastern DFC is not similar to the benefits. Furthermore, freight revenue far exceeds the benefits.
When charges that are higher than the benefits are levied, users usually decrease. However, the main transport item of the Eastern DFC is coal. Coal is connected directly with electric power generation and depends heavily on railroads. Therefore, the DFC is advantageous. In addition, coal transport has high transport efficiency compared with container transport. Eight years later, when the DFC is 100% completed, demand on the DFC will increase rapidly. Because of these reasons, it is possible to set a high freight charge, and higher revenue leads to higher FIRR. However, giving consideration to the future use of coal as electric power generation, future demand growth rate is estimated to be low.
12.17 CONCLUSION OF ECONOMIC ANALYSIS AND FINANCIAL ANALYSIS
Method of determining investment timing and scale: The improvement of the existing cargo lines as an alternative is not enough to supply the present demand. Even if the passenger line is separated and improved, it will not be able to transport the present freight demand. Faced with this situation, planning has started on a large scale project, but the project’s feasibility cannot be judged simply by overcapacity. As a method to prove the balance of supply and demand with facility investment, the Economic Internal Rate of Return (EIRR) index was developed. This method compares the huge costs with national benefits discounted at the present value, giving consideration to uncertainty in future.
Conclusion of investment feasibility of the analysis results: If the index is lower than the opportunity cost of capital, i.e. 12%, it means that implementation timing is too early, or that the scale is too big. In this evaluation, as the result of using every possible data for calculation, EIRR of the project was found higher than 12%: 14.09% for the Western DFC, and 15.26% for the Eastern DFC. The conclusion is that the project should be implemented. Investment scale and planning scale are not too large. If it is not implemented, national resources may be wasted.
For the financial analysis, FIRR, which is the index of long-term investment evaluation, was found to be 9.08% for the Western DFC and 15.59% for the Eastern DFC. Eastern DFC shows to be financially viable, but Western DFC shows relatively low FIRR. As for the Western DFC, it should be implemented from national viewpoint, since EIRR takes precedence over

The Feasibility Study on The Development of Dedicated Freight Corridor for Delhi-Mumbai and Ludhiana-Sonnagar in India Final Report (Task 2)
Chapter 12 12-22
FIRR. Western DFC needs low interest rate and long term repayment loan for the implementation.
Suitability of construction timing: The construction period was planned initially as 5 years. In the economic and financial calculation, construction period was assumed to be 15 years from the viewpoint of engineering. At the same time, the case of shorter construction period of 8 years was evaluated. In the case that the period is shortened to 8 years from 15 years, EIRR and FIRR usually decreases. As the result of the calculation, even if the construction period is shortened, the EIRR is high enough. The high figure of DFC proves that the project a very important national project.
Reliability of the analysis and securing source of fund: In the process of calculation, all kinds of data are inputted, including freight demand forecast till 35 years later, change of origin and destination, traveling speed, transport cost, and time value of people and goods. If wrong data is entered, the calculation loses its consistency.
Benefits of economic analysis are itemized into: 1) time savings, 2) savings of traveling cost and 3) reduction of exhaust gas. Time savings are itemized into persons and goods (freight carriages, passenger carriages, trucks, and buses). Savings in traveling costs is itemized into freight carriages, passenger carriages, trucks, and buses. Reduction of exhaust gas is itemized into trucks and buses. A total of 10 benefit items were analyzed. Therefore EIRR is a correct result. The high EIRR provides proof that satisfies the conditions for obtaining source of funds for construction from international organizations.
Economic and financial analysis and freight charge policy: Financial analysis regards freight revenue as the only item of benefit. Thus, while economic analysis is conducted upon accumulation of accurate data, in financial analysis, freight revenue is compared with 3 kinds of costs. Increase and decrease of construction costs does not affect FIRR very much, but increase and decrease of freight revenue have considerable effects. The validity of freight level is whether freight of DFC is within the benefits estimated in the economic analysis. As the result of comparison, freight revenue reaches more than the amount of benefit. This shows that the freight is invalid. The freight charges for this analysis are based on the list of charges in India. From the view point of economic analysis, railroad charges need to be within the benefits, from a standpoint of competition as well.
Rapid transport effects of DFC and Container Depots, ICD: As for the benefits of the DFC project, savings in operation and maintenance costs of trains is high, while weight of the time savings benefit of freight is low. Accordingly, we should pay more attention to on-time arrival, and inter-modal transport including improvement of container depots and ICDs at both ends of the DFC, rather than shorter time movement of goods. Movement of long distance freight is important for the increase of added value of freight, acquisition of foreign currency, and for macro effects. Beneficiaries of time savings are passengers rather than freight. From the mixed transport of freight and passengers, freight will be transferred to the DFC. Operating speed of passenger trains is not expected to increase, but the waiting time of passengers will be reduced with the increase of trains.
12.18 ECONOMIC IMPACT (MULTIPLIER) ANALYSIS
12.18.1 Introduction
The DFC Project will have a big impact on the socio-economy of India and the countryside in its surrounding. When the project starts, various activities such as the hiring of workers, procuring goods, buying external services, making contracts with construction companies commence. These investments are considered as initial final demand or direct impact. In real

The Feasibility Study on The Development of Dedicated Freight Corridor for Delhi-Mumbai and Ludhiana-Sonnagar in India Final Report (Task 2)
Chapter 12 12-23
economies, however, the direct demand will induce further demand or first direct impact. And output or production requirements occurring from the first indirect impact will induce further demand. It is like endless and inter-relational economic transactions. To make it simple, the linkage is illustrated as follows:
From (Investment) – (Direct Impact) – (Production) – (Income) – (Consumption) – (Production) to further economic linkage
In the process, employment, tax income and external trade will be also generated and intensified.
Moreover, the above-mentioned project effect can contribute to poverty reduction in a broad sense as indicated in the following points:
- The contribution to national economic growth increases employment and the income earning opportunity of the poor.
- The employment creation and the income earning opportunity of the poor living in areas previously without efficient transport links are facilitated by improving the traveling time described in the economic evaluation.
- Job opportunities for the poor are provided during construction period.
Intermodal Research Unit has measured the economic impact or multiplier effect by use of the Endogenous Household Consumption and import Input Output Model, or so-called the IO model. In this study, the economic impact was calculated and analyzed by using the model of Intermodal Research Unit’s measurement. The conceptual flowchart of economic impact measurement based on IO model is as follows.

The Feasibility Study on The Development of Dedicated Freight Corridor for Delhi-Mumbai and Ludhiana-Sonnagar in India Final Report (Task 2)
Chapter 12 12-24
Figure 12-8 Concept of Overall Multiplier Effect
12.18.2 Methodology
The project cost was inputted into the IO model and the economic impact was measured. The model is calculated are as follows:
Induced Impact on Production : [ ]ΔFMIKBΔXΔXΔX 21ˆˆˆ −=+=
Induced Impact on GVA (Income, Tax, OS [Profit]) : [ ]ΔFMIKBvΔVΔVΔV 21
ˆˆˆ −=+=
Induced Impact on Employment : [ ]ΔFMIKBlΔLΔLΔL 21ˆˆˆ −=+=
Impact (III)
2nd Induced Impact
Measurement of 1st Indirect Impact (Leontief effect): Production、GVA (Income、OS、Tax)、Employment、Import & Export
Measurement of 2nd Indirect Impact (Inter-relational Income effect) : Production、GVA (Income、OS、Tax)、Employment 、Import & Export
IO model
Impact (I) Direct Impact
Impact (II)
1st Induced Impact
GVA Ratio Import Coefficient
Construction、Material Procurement by the DFC
Demand on Consumption and Investment (Final Demand: FD): Input Information
Measurement of Direct Impact: Production、GVA (Income、OS、Tax)、Employment、Import & Export
Incremental Consumption and Investment Demand
IO model
Overall Impact
Induced Income
GVA Ratio Import Coefficient
Propensity for Consumption
Output Information

The Feasibility Study on The Development of Dedicated Freight Corridor for Delhi-Mumbai and Ludhiana-Sonnagar in India Final Report (Task 2)
Chapter 12 12-25
Induced Impact on Imports : [ ]ΔFMIKBMΔMΔMΔM 21ˆˆˆˆ −=+=
Induced Impact on Exports : [ ]ΔFMIKBEΔEΔEΔE 21ˆˆˆˆ −=+=
where
( )[ ] 1AMIIB −−−=ˆ : Leontief Inverse Matrix (Macro Multiplier Matrix),
( )[ ] 1CVBMIIK −−−=ˆ : Keynesian Inverse Matrix or Inter-relational Income Multiplier Matrix,
ΔF : Vector of Final Demand,
1ΔX , 1ΔV , 1ΔL , 1ΔM , 1ΔE : Vectors of Induced Impact [Direct and 1st indirect spill over effect];
2ΔX , 2ΔV , 2ΔL , 2ΔM , 2ΔE : Vectors of Induced Impact (2nd indirect induced impact),
M , E : Coefficient Matrix of Import and Export;
C : Consumption Expenditure Ratio Matrix;
v : GVA Ratio Matrix; and
l : Labor Input Coefficient Matrix.
Measurement assumptions are made as shown below:
- Project cost: Rs. 348.7 Billion (local portion),
- Allocation Ratio of Investment by Industry: : Construction (Rs. 301.8 Billion) and Manufacturing (Rs. 46.9 Billion), respectively,
- DFC Construction Time: 8 Years,
- Average Consumption Propensity: 0.75,
- Share of import of the total investment: 30%
The economic impact was classified in consideration of the spread to the economic impact by the project as follows.
- Nationwide: Induced Impact on Production , GVA,
- Government: Induced Impact on Tax Revenue,
- Industry: Induced Impact on Profit (Operation Surplus),
- Household: Induced Impact on Income, Employment,
- International Trade: Import, Export
12.18.3 Economic Impact
Table 12-20 shows the calculation results.

The Feasibility Study on The Development of Dedicated Freight Corridor for Delhi-Mumbai and Ludhiana-Sonnagar in India Final Report (Task 2)
Chapter 12 12-26
Induced impact on production
The total output requirements induced by the DFC Project amount to Rs. 1,386 billion. The impact amount is bigger than the project investment by at least 4.0 times.
Induced impact on gross value added (GVA)
The total GVA requirements induced by the DFC Project amount to Rs. 700 billion. The impact amount is bigger than the project investment by 2.0 times.
Induced impact on tax revenue
This exercise estimates tax revenue from the domestic business sector starting from the DFC Project investment. The result indicates Rs. 22 billion or 6.3% of the DFC investment.
Induced impact on operating surplus
The DFC Project will create numerous business transactions and bring about reasonable operating surplus among contracted firms directly and indirectly. The total sum of the induced impact on operating surplus is estimated at Rs. 249 billion which accounts for 71.4% of the total DFC investment.
Induced impact on income and employment
It is part of the Project’s spill over effect to the stakeholders. As a result, the induced impact on household income is estimated at Rs. 372 billion. Meanwhile, the employment opportunities created by the DFC Project amount to Rs. 1.1 million.
Induced impact on international trade
The effect on international trade & exports is Rs. 50 billion. This corresponds to 1.3% of Rs. 3,752 billion of 2004-05 export. On the other hand, the import is about Rs. 67 billion. This corresponds to 1.3 percent of Rs. 5,011 billion of 2004-05 import.
Impact on the poor
The induced impact on income and employment to the above-mentioned is going to reach the poor. The poor in this study area is estimated to be about 190 million people for 2004-05 years, according to the investigation of Planning Commission. These people are below the poverty level, who can expect further job opportunity and the increase of the income because of the increase of the convenience by shortening the travel time described in the economic valuation.

The Feasibility Study on The Development of Dedicated Freight Corridor for Delhi-Mumbai and Ludhiana-Sonnagar in India Final Report (Task 2)
Chapter 12 12-27
Table 12-20 Economic Impact of the DFC
DirectInpact
1st InducedImpact
2nd InducedImpact Total
Production 340.5 629.4 416.1 1,386.0
GVA 152.6 298.5 248.6 699.7
Government Tax 2.7 12.4 6.8 21.9
Firms Operating Surplus[OS] 37.7 108.4 102.7 248.8
Income 104.9 150.1 116.6 371.6
Employment 0.25* 0.53* 0.32* 1.10*
Import 6.8 38.2 22.2 67.2
Export 4.5 26.6 19.0 50.1
Note: * Millon persons
(Unit: Billion Rps)
Impact onDomesticEconomy
Nation wide
EconomicUnit
Household
Impat onAbroad International Trade
12.19 REGIONAL DEVELOPMENT EFFECTS
The effects gained by the DFC Project may be classified into two major categories: “direct effects” and “indirect effects”. Direct effects are described in the economic evaluation. Indirect effects are induced by the direct effects. Most indirect effects can be represented as regional and national development effects.
The DFC Project has various far-reaching effects on a variety of individuals and economic sectors not only in areas where they are constructed, but also other parts of the wider region. It is important to promote regional development from the viewpoint of sustainable development where the balance of the country can be taken. The following effects can be indirectly expected by executing the DFC Project.
- Acceleration of Nationwide Development
- Promotion of Industry
- Promotion of Agriculture, Forestry and Fisheries
- Improvement in Living Conditions
Since many of these effects cannot be estimated in monetary terms, they are evaluated by means of comparing the transportation conditions in the existing railway network with those of the future railway network.
(1) Acceleration of Nationwide Development
The DFC Project will shorten distances between different areas in the study area in terms of traveling time. When the DFC Project is completed, the traveling time will be shortened by about 1/3 as shown in Figure 12-9. Through the improvement of transportation conditions such as less traveling time, the DFC Project will bring large opportunities for encouraging development of industry, agriculture and other socio-economic activities in the core cities as well as in their surrounding areas. These new conditions will provide jobs through industrial

The Feasibility Study on The Development of Dedicated Freight Corridor for Delhi-Mumbai and Ludhiana-Sonnagar in India Final Report (Task 2)
Chapter 12 12-28
development, reduce disparities in income, and produce a more balanced distribution of production.
EXISTING
WITH DFC
MUNBAIMUNBAI
JNPTJNPT
VADODRAVADODRA
AHMEDABADAHMEDABAD
PALANPURPALANPUR
REWARIREWARI
DADRIDADRI
DELHIDELHI--MUNBAI INDUSTRIAL CORRIDORMUNBAI INDUSTRIAL CORRIDOR
AJMERAJMER
KALANAURKALANAUR
DHANDARIKALANDHANDARIKALAN
KANPURKANPUR
MUGHAL SARAIMUGHAL SARAISON NAGARSON NAGAR
KOLKATKOLKATAA
KHURJAKHURJA
KALANAURKALANAUR
DHANDARIKALANDHANDARIKALAN
KANPURKANPUR
MUGHAL SARAIMUGHAL SARAISON NAGARSON NAGAR
KOLKATKOLKATAA
KHURJAKHURJA
MUNDLAMUNDLA
KANDLAKANDLA
PIPAVAVPIPAVAV
LEGENDLEGEND
WESTERN DFC WESTERN DFC EASTERN DFC EASTERN DFC WESTERN FEEDERWESTERN FEEDEREASTERN FEEDER EASTERN FEEDER PORTPORT
LEGENDLEGEND
WESTERN DFC WESTERN DFC EASTERN DFC EASTERN DFC WESTERN FEEDERWESTERN FEEDEREASTERN FEEDER EASTERN FEEDER PORTPORT
Figure 12-9 Betterment of Nationwide Development

The Feasibility Study on The Development of Dedicated Freight Corridor for Delhi-Mumbai and Ludhiana-Sonnagar in India Final Report (Task 2)
Chapter 12 12-29
Promotion of Industry
One of the most important impacts on regional development by the DFC Project is the location and relocation of manufacturing plants. Since the DFC Project will offer speedy and scheduled transport of raw materials and products, most factories and facilities of relevant businesses will be constructed along the DFC, especially in the vicinity of freight station.
The Government of India has further proposed consideration of establishing, promoting and facilitating the “Delhi-Mumbai Industrial Corridor (DMIC) along the alignment of Western DFC between Delhi and Mumbai. The joint initiative of the Governments of India and Japan, “Special Partnership Initiative (SEPI)”, envisages cooperation in early realization of the DFC and assistance in promoting the DMIC with development of industrial estate and special economic regions with high physical and social infrastructure and facilitate investment from abroad.
Figure 12-10 shows the outline of the DMIC. The project influence area is extended up to 150 km on both sides of the alignment of the DFC. The project goals for the DMIC are double employment potential, triple industrial output and quadruple exports from seven investment regions and thirteen industrial areas.
On the other hand, the DFC Project has an important effect on promoting industries such as grain, fertilizer, limestone, cement, etc. on the northwest; and enhancing coal mines, steel plants, etc. on the southeast side in the Eastern DFC.
MUNBAIMUNBAI
JNPTJNPT
VADODRAVADODRA
AHMEDABADAHMEDABAD
PALANPURPALANPUR
REWARIREWARI
DADRIDADRI
DELHIDELHI--MUNBAI INDUSTRIAL CORRIDORMUNBAI INDUSTRIAL CORRIDOR
AJMERAJMER
KALANAURKALANAUR
DHANDARIKALANDHANDARIKALAN
KANPURKANPUR
MUGHAL SARAIMUGHAL SARAISON NAGARSON NAGAR
KOLKATKOLKATAA
KHURJAKHURJA
KALANAURKALANAUR
DHANDARIKALANDHANDARIKALAN
KANPURKANPUR
MUGHAL SARAIMUGHAL SARAISON NAGARSON NAGAR
KOLKATKOLKATAA
KHURJAKHURJA
MUNDLAMUNDLA
KANDLAKANDLA
PIPAVAVPIPAVAV LEGENDLEGEND
WESTERN DFC WESTERN DFC EASTERN DFC EASTERN DFC WESTERN FEEDERWESTERN FEEDEREASTERN FEEDER EASTERN FEEDER PORTPORTINVESTMENT REGIONINVESTMENT REGIONINDUSTRIAL AREAINDUSTRIAL AREA
Figure 12-10 Promotion of Industry

The Feasibility Study on The Development of Dedicated Freight Corridor for Delhi-Mumbai and Ludhiana-Sonnagar in India Final Report (Task 2)
Chapter 12 12-30
Promotion of Agriculture, Forestry and Fisheries
The development of the DFC will cut down the time required for delivering products to the markets as well as to food processing plants. This will make it possible to grow and cultivate such products in other places. This will no doubt contribute substantially to promote a new agro-industry. Moreover, because the traveling time from the coastal area to the inland is shortened, more marine products can be expected to circulate. Therefore, it plays an important role in the promotion of the primary industry that is one of the important sectors in the country.
Improvement in Living Conditions
The improvement of transportation conditions with the DFC will greatly help people in local areas to utilize and gain access to social service facilities such as hospitals, schools, government offices, among others. Therefore, it plays a major role in improving people's living conditions and providing a stable life.
CHAPTER 13 STRATEGIC BUILDING BLOCKS
IN BUSINESS PLAN FOR DFC

The Feasibility Study on The Development of Dedicated Freight Corridor for Delhi-Mumbai and Ludhiana-Sonnagar in India Final Report (Task2)
Chapter 13 13-1
CHAPTER 13 STRATEGIC BUILDING BLOCKS IN BUSINESS PLAN FOR DFC
13.1 MEASURES FOR SOUND MANAGEMENT
13.1.1 Subjects for Business Plan
The management of the DFC proposed by the Government of India is a vertical separated model, because the owner of the railway infrastructure is DFCCIL and IR is the exclusive operator for DFC. But we should consider it as an integrated model by Indian Railway (IR), because more than 51% (actually 100%) of DFCCIL equity is held by IR, resulting that IR holds the corporate governance of DFCCIL.
The Task Force under the Central Government Committee on Infrastructure recommended an integrated model by the SPV with open access to the DFC lines by other operators besides the SPV. MOR has been improving its business performance in terms of productivity and profitability, resulting in posting of a net profit of Rs. 149.2billion in 2006-07, 6.3 times higher than that in 2001-02. This can be attributed to its business efforts in cooperation with World Bank and ADB. MOR has begun to create organization and management of DFC based on the integrated model concept by DFCCIL which was originally the rail track owner only.
Furthermore, free competition would be expected on the DFC rail based on the given right of non-discriminatory access by 15 authorized “Container (Bulk) train operators on IR networks”.
The scheme wherein MOR collects fare charge from customers and distributes Track Access Charge (TAC) to DFCCIL remains. MOR has also showed confidence in the past 30-year track-record of accounting separation between Zonal Railways.
We should give it first priority that inefficiency in DFC operation, which would be the weak point of an integrated model, must be drastically improved by promoting current “IR’s railway reform”. (The objective)
It should be prioritized that making Track Access Charge formula, ample enough to cover not only initial capital expenditure and working capital expenditure but sound additional investments for future freight demand growth.
For this purpose, cash flow analysis of DFC Project and DFCCIL business operations, risk analysis of cash flow assumptions and planning on risk hedge are essential.
Main issues requiring considerations are as follows:
1) Increase Feasibility of Project
2) Separation of Accounting from Indian Railway Accounting
3) Organizational separation from existing Zonal Railways
4) Formulation of Track Access Charge (TAC)
5) Measures to make DFCCIL accounting sound
6) Timely completion of construction of DFC
7) Management action plans and target for DFCCIL

The Feasibility Study on The Development of Dedicated Freight Corridor for Delhi-Mumbai and Ludhiana-Sonnagar in India Final Report (Task2)
Chapter 13 13-2
13.1.2 Increasing Feasibility of Project by Increasing Business Income of DFC and Setting up New Expenditure Norm for DFC Operations and Maintenance
(1) Increase of freight tonne-km by economic growth and restoring of market share of railway sector.
1) Increase of freight tonne-km by economic growth
Figure 13-1 Economic Growth and the Railway Market Share
The Above figure shows the relationship between increase of total freight traffic demand by economic growth and IR’s market share on the assumption that railway share recovers slowly from 2007. Area above the level line of tonne-km as of 2007 and below the railway share curve shows IR’s incremental traffic demand. There will be also falling-off portion from IR’s freight traffic shown as “Share down”. Area sandwiched by yellow lines represents tonne-km IR can enjoy.
IR and DFCCIL should not be satisfied with the natural demand increase by national economic growth but set up the strategic target of stopping the trend of declining market share and promoting recovery of past IR’s market share.

The Feasibility Study on The Development of Dedicated Freight Corridor for Delhi-Mumbai and Ludhiana-Sonnagar in India Final Report (Task2)
Chapter 13 13-3
2) Restoring IR’s market share
Trends in Rail Freight Traffic Shares, 1950-2004 and
forecast after 2007
0.0%
10.0%
20.0%
30.0%
40.0%
50.0%
60.0%
70.0%
80.0%
90.0%
100.0%
1951
1960
1970
1980
1990
1991
1996
2001
2004
2007
2012
2017
2022
Source: Ministry of Railway, Planning Commission, RITES PETS2 final report Data from 1951 to 2001sourced by Ministry of Railway and Planning Commission as IR total
market share and data after 2004 represent the forecast for DFC market share by RITES
Figure 13-2 Past Trend and Forecast of IR’s Freight Traffic Share
IR’s share of freight traffic, amounting to 88% (44 billion ton-km) as of 1951, declined steadily to the level of 32% (312 billion ton-km) as of 2001, in proportion to the increase of total transport demand. RITES survey predicts that IR’s market share will hit the bottom in 2004 at 23.7% and will grow gradually to the level of 37.7% in 2022 by 14%.
But this forecast could not be achieved without IR’s management effort. Especially market share recovery from road transport in short-mid distance-bands, where IR’s share has dropped rapidly, needs special management strategy and best sales effort because the recovery scenario is against the current trend of highway development and advance in motorization.

The Feasibility Study on The Development of Dedicated Freight Corridor for Delhi-Mumbai and Ludhiana-Sonnagar in India Final Report (Task2)
Chapter 13 13-4
(2) Market share-up by distance-bands
Source: JICA study team
Figure 13-3 Rail Freight Demand Curve by Distance-Bands
As is shown in above figure, railway freight demand curve varies by distance-bands and by commodity classes. In other word, demand depends not only on freight tariff but on other factors like punctuality of arrival date of goods in longer distance-band or with/without pick-up and delivery services.
Accordingly IR has to develop innovative tactics to follow the user’s preference other than freight tariff in the non tariff-sensitive distance-bands.
(3) Overview of DFC demand forecast
1) Major commodity of Eastern DFC is would be Coal both in 2013 and 2031 while Container transportation would be the overwhelming majority in Western DFC by 2031.
2) Coal transportation of both 700-1,000Km and 300-700Km distance bands will grow drastically from 2013 to 2031, resulting to increase from almost 0 to 5 billion tkm, and 2 billion tkm respectively. Container transportation of both 1,000-1,500 Km and 300-700 Km distance-bands will also sharply grow from 2013 to 2031, resulting in from 0 to 70 billion tkm, to 20 billion tkm respectively. Demand for distance-band of 700-1,000 Km will double to the level of 20 billion tkm.
3) Demand for both corridors is not well balanced.

The Feasibility Study on The Development of Dedicated Freight Corridor for Delhi-Mumbai and Ludhiana-Sonnagar in India Final Report (Task2)
Chapter 13 13-5
(4) Optimum freight tariff by distance- bands
Unit tariff by commodity class and distance-bands (Rs/Ton-Km)
0
0.2
0.4
0.6
0.8
1
1.2
1.4
105 215 400 620 900 1450 2000 2550 3100 3650 4200 4750
Km
Rs
Class-LR5
Class-100
Class-150
Class-200
Class-220
Source: Ministry of Railway COMMODITY......CLASS: SALT, FERTILIZERS...100, FOOD GRAINS...110, COAL 、 CEMENT, ORES…140,
LPG…180, POL..220
Figure 13-4 Current Unit Tariff by Commodity Class and Distance
But nobody denies the importance of freight rates by distance bands to recover railway market share. IR takes commodity-oriented stiff unit freight rate in shorter than 1,500km distance-band as is shown in above figure. DFC management should take demand-creative tariff strategy than current freight rate/ton-km. Different tariff system can not work effectively in one organization. (Separate division just like Zonal Railways is needed for DFC operation in Indian Railway in order to make DFC operation and most efficient.)
Rail freight rate in tariff-sensitive mid distance-band because of strong competitors like truck transport should be determined subject to the effective competitor’s freight charge including all other charges like Export/Import tariff between States, transit time cost and cost of service frequency on an assumption of the demand curve in Figure 13-3.
Average truck rate is Rs. 1.46/t-km but detailed data by directions and by distance-bands are unknown according to JICA Study Team. Former, Director LRDSS MoR, Dr. Nalin Singhal made generalized cost analysis between road and railway in “Rail-Road Competition in Freight Transportation” and analyzed that generalized cost consists of monetary cost, transit time cost, reliability cost and cost of service frequency. Shippers make mode choice decision not only by monetary cost but also by other factors. He established that while rail services have an advantage over road on a pure transport cost basis over medium to long distances, on a generalized cost basis however, road transport can have an advantage even over long distances.
Railways can maintain the monetary cost advantage over road transport if the railway system can improve transit time, reliability and service frequency or if target market is in the distance-band where shippers do not prefer non-monetary factors to monetary cost.
Railway also can take an additional extreme bargaining tariff tactic as is shown in the following figure in order to get over other disadvantages in the field of transit time cost and cost of service frequency. Risk analysis on the assumption is set out in 13.2.1-(7) “Financial Projection for DFC”

The Feasibility Study on The Development of Dedicated Freight Corridor for Delhi-Mumbai and Ludhiana-Sonnagar in India Final Report (Task2)
Chapter 13 13-6
Bargain Tariff/Tonne-Km by Class and by Distance shorter than700Km
0
0.2
0.4
0.6
0.8
1
1.2
1.4105
185
280
440
600
760
1100
1500
1900
2300
2700
3100
3500
3900
4300
4700
Km
Rs
Class-LR5
Class-100
Class-150
Class-200
Class-220
Figure 13-5 Bargain Tariff/Tonne-Km by Distance-bands shorter than 700Km
(5) Improvement of productivity indices and setting up new norms for expenditure in IR
Over the years IR increased TU (Transport Units (tkm + pkm)) by 40%, cut staff by 10%, improved operating ratio from 99% to 84% (2005-06), increased productivity of traffic by 45% and improved employee productivity and productivity of wagon as showed in following figure.
IR indices current trend
80
90
100
110
120
130
140
150
160
170
1999 2003-04 2004-05
Rail route Km
P-km million
Freight ton-km million
Staff
Operating ratio
Employee productivity (000 ofTU per employee)
Employee per km of line
Traffic density (000 of TU perKm)
Source: Ministry of Railway、World Bank
Figure 13-6 Trend in productivity indices of IR
But IR has to improve employee productivity continuously because it is still far less than that of the standard of advanced countries as shown in Figure 13-7. Current passenger train operations in Eastern and Western Corridors have priority over freight train operation. Drastic improvement in employee productivity in DFC is likely, because freight train has no more operational limitation in DFC and has most advanced ground facilities.

The Feasibility Study on The Development of Dedicated Freight Corridor for Delhi-Mumbai and Ludhiana-Sonnagar in India Final Report (Task2)
Chapter 13 13-7
Actually DFC should target the productivity level of Canada and USA, because DFC has not expensive passengers and will be better equipped by state of the art technology and services compared with USA and Canada. Assumptions regarding to expenses and demand forecast as shown in Table 13-5 and Figure 13-12 respectively prove the same level of productivity as Canada at Year-1 and that of USA at Year-20, exhibited in Figure 13-23
Productivity improvement in DFC hopefully expands firstly to the parallel route of Zonal Railways and then gradually to the railways in the same region.
0
2,000
4,000
6,000
8,000
10,000
12,000
Indi
a
Chin
a
US
A: A
llC
lass
1*
Bra
zil
(RFFSA
)
South
Afr
ica
Germ
any
Can
adia
nPac
ific
Russ
ia
Employee Productivity (000 of TU per employee)
Source: World Bank Railway data, IR Year Book (1998-99) and Transnet Annual Report 1999
Figure 13-7 Employee productivity
(6) Recommendable tactics
DFCCIL should elaborate on the tactics based on analysis of customer’s needs. The following are some suggestions of tactics:
1) Railway freight rates by distance-bands and by commodities.
2) Introducing “Arrival date guarantee system” for long distance-bands customer.
3) Alliance with truck transport industry for providing pick-up and delivery services to mid/short-bands freight customers.
4) Development of Rail-side Warehouse and Logistic Parks.
5) Preferential treatment by core customers/new customers.
13.1.3 How to Separate DFC Accounting from Total IR Accounting
Next figure shows structure of revenue and operational expenditure of both Indian Railway (IR) and DFCCIL.
The figure clearly tells us that accounting separation is absolutely important for DFC/DFCCIL management, because without accounting separation system, we can not recognize DFC income and DFCCIL income.
Accordingly, accounting separation of DFC revenue and expenditure from total IR is indispensable. Accounting separation of DFC makes it possible for the first time that DFC

The Feasibility Study on The Development of Dedicated Freight Corridor for Delhi-Mumbai and Ludhiana-Sonnagar in India Final Report (Task2)
Chapter 13 13-8
employees do their best to ensure reduction of their operating costs to the level marked by the circle (○). It is neither the level of the IR Norms (X), nor the average level of the DFC Norms and the IR Norms (XX). Operating ratio in recent IR posted around 80% but following Cash Flow Projections estimated about 31% of operating ratio in all DFC and about 30% in Western Corridor at the highest. as is shown in Figure 13-24.
Then, we can divide DFC gross profit into DFCCIL and IR by using Track Access Charge formula.
Source: JICA study team
Figure 13-8 Overview of the accounting separation
(1) How to separate DFC income
Total income generated by DFC operation at first flows into IR Zonal Railway account because the shipper is the customer of the Zonal Railways. This raises the issue how to get the DFC income out of the Zonal Railway income. One billing system from start to destination is important for customer’s convenience. The accounting system is needed to split the bill into DFC and other IR in terms of tonne-km. Splitting common expenditure into DFC and other IR is also essential.
The accounting computer system must be designed not only for daily booking but for strategic management purposes. All data from business, operation and accounting are assembled into one management information system for analyzing the feature of customers and operating routes. The system could strongly help the restoration of IR’s market share to planned levels. Followings are simplified models of apportionment mechanism currently employed among Zonal Railways which could make the DFC apportionment possible with registration of DFC Railway into the system.

The Feasibility Study on The Development of Dedicated Freight Corridor for Delhi-Mumbai and Ludhiana-Sonnagar in India Final Report (Task2)
Chapter 13 13-9
1) Relations of customers and branch with different railways:
Customer A A BBranch a b -
IR (Zonal Railways) X Z DFC
2) Payment and receivers of freight fare (Rs)
Aa Ab B
X railway 130DFC Railway 40
Z railway 70IR total 130 70 40
3) Transportation records
20Km 30KmDFC
RailwayZ railway
20Km 30Km
20Km 30Km
20Km 10Km
Transaction-2
Transaction-3
X railway
Transaction-1
50Km
50Km
4) Apportionment between Zonal Railways (Rs)
X DFC Z
Original receiptfrom customer
130 40 70
Terminal &transhipment
charges(30) (10) (20)
X railway ▲ 50 △ 20 △ 30DFC Railway ▲ 10 △ 10
Z railway △ 20 ▲ 20
OFFSET result ▲ 50 △ 30 △ 20
After OFFSET △ 80 △ 70 △ 90
5) Customer Management
More than half of DFC Railway revenue comes from customer-A, which is the customer of X Railway as is shown in the table below. It is worthwhile for DFCCIL to solicit customer-Aa and Ab with the help of X Railway.
B Aa Ab A totalX railway △ 80 80
DFC Railway △ 30 △ 20 △ 20 40Z railway △ 10 △ 30 △ 50 80IR total 40 130 70 200

The Feasibility Study on The Development of Dedicated Freight Corridor for Delhi-Mumbai and Ludhiana-Sonnagar in India Final Report (Task2)
Chapter 13 13-10
(2) How to separate DFCCIL income
Aforementioned accounting separation requires the accurate management information system of DFC, which would then enable to make DFCCIL income appropriate to recover the huge investment with continuing investments for further growth of demand.
Track Access Charge (TAC) is the major income source for DFCCIL from DFC operation. Formulation of TAC is set out in 13.1.5 in detail but following two points are important for formulating the TAC:
1) The TAC must be increased as DFC income increase. This mechanism is very important for the management of DFCCIL to be always ready for additional investments for the future demand growth.
2) The TAC must at least cover following expenditure:
- Maintenance personnel cost
- Facility maintenance cost
- Depreciation cost
- Debt repayment and Interest payment
- Additional Capital Expenditure
- Dividend payment to equity holders
13.1.4 Organizational separation from existing Zonal Railways for innovative business
development of DFC
Originally it was stipulated that DFCCIL takes role of construction and maintenance and IR’s role is business, operation and accounting in DFC project. This function sharing made the DFC system complicated. Simplifying its interface with customers is very important for customer’s convenience. This is the first reason why the organization handling DFC in all IR should be one. From business point of view customer services in DFC by distance-bands and commodity types are essential as is already mentioned above. This style of business requires integrated and exclusive organizational services to customers over Zonal Railways. From operational and rolling stock point of view one organization (DFC Railway) should handle total DFC line because of the dedicated corridor. Lastly it is clear that organization separation is essential for revenue apportionment.
New organization for DFC in IR should be at least the same level organization as current Zonal Railways considering the expected business volume, profit scale and investment magnitude. IR should give the new organization (DFC Railway) authority to set up other standard of tariff strategy, business rule of conduct, expenditure norm and the like.
MOR is veering towards the direction of making DFCCIL take on roles other than maintaining rolling stocks and drivers. This is proven by the recent public offering of Director positions for Project Planning and Operations & Business Development. DFCCIL has GMs not only for Design, Development and maintenance of DFC ground facilities but also for operation and business development.
DFC is an important but a portion of total IR rail network expanded nationwide. IR can select DFC or existing South line of Western DFC between JNPT and Delhi. Accordingly DFCCIL has to work along with other IR network very closely in order to accomplish good result in project planning, business development and sales with the advanced Customer Management Information System.

The Feasibility Study on The Development of Dedicated Freight Corridor for Delhi-Mumbai and Ludhiana-Sonnagar in India Final Report (Task2)
Chapter 13 13-11
Nevertheless, setting up DFC Railway in IR is absolutely needed not only for operation and rolling stock purposes but also as the control tower of DFC business as follows: DFC Railway should be responsible for both integrated logistic management including feeder lines and authority to propose aforementioned strategic freight fare in the special distance-band of 300-700 km to Railway Board.
Current discussion on roles of IR and DFCCIL leads to the functional diagram shown in Figure 13-9.

The Feasibility Study on The Development of Dedicated Freight Corridor for Delhi-Mumbai and Ludhiana-Sonnagar in India Final Report (Task2)
Chapter 13 13-12
Figure 13-9 DFC Functional Diagram
DFC Management Diagram
DFCCIL In charge of every roles other than IR・DFC
Rail
IR/ DFC Railway Haulage Business, maintaining
Locomotives, Wagons and Drivers
Container/Bulk Operator(15 Concessionaire)
ICD, Container chassis, Wagon
Container customers
Bulk goods customers
Concession Agreement
Track Access Charge
Concession Agreeme
nt
Haulage Charge
Sales Freight Charge
Freight Charge
Bulk goods customers
holding wagons
Sales
Freight Charge
Container customers holding Container chassis

The Feasibility Study on The Development of Dedicated Freight Corridor for Delhi-Mumbai and Ludhiana-Sonnagar in India Final Report (Task2)
Chapter 13 13-13
13.1.5 How to formulate Track Access Charge (TAC)
(1) Categorizing the world TACs for the formulation
Reviewing the formulation of TAC of each country in the world (Europe, North America and Japan) we found the formulas depend upon the way of separation of railway of each country. Accordingly concepts and rules are different from country to country concluding that there is no one best way both theoretically and practically.
But following are trial attempt to extract underlying structure and key factors for formulations in TAC of many countries:
Structure: Railway Operators pay not only operating expenses of DFC Railway but its capital costs and investment return?
There is a business model at one end where no relationship between fare and compensation cost for railway development. On the other hand, there is another business model at the other end where rail operators pay not only operating expenses of DFC Railway but its capital costs and investment return. There is a business model between the two where rail operators pay only operating expenses (or part of operating expenses) as TAC in order to promote new entries of competitive operators or to release/mitigate too much burdens of capital expenditure and construction risks.
Table 13-1 Track Access Charge in other Countries
Countries Charge Concept Structure
Sweden
Social marginal cost concept (Air pollution cost, Traffic accident cost, Rail maintenance cost)
No relationship between fare and compensation cost for railway development
Germany
TAC should recover the depreciation cost of the Rail Track Corporation(DB-Netz)
Deferent TAC table is applied by kinds of rail (high speed or normal) and kinds of train (passenger or freight)
England
Rail Track Corporation recovers not only operating expenses but capital expenditure and capital returns. (Costs and returns model)
Deferent TAC table is applied by kinds of train (passenger or freight)
France Modification by kinds of train and competitiveness should be added to basic cost calculation
TAC consists of base charge, Diagram charge and Distance charge
USA Rail Track Corporation recovers short term avoidable costs(Operating expense) plus beneficiary’s portion of improvement investment plus On-time incentives
Canada Rail Track Corporation recovers short term avoidable costs(Operating expense) plus Capital costs plus On-time incentives
Japan(JR)
JR recovers short term avoidable costs(Operating expenses) plus beneficiary’s portion of improvement investments
TAC consists of Track charge and Electric facilities charge
Japan(Narita Airport Express rail)
Rail Track Corporations (JR East and Keisei Railway) recover not only operating expenses but capital expenditure and capital returns. (Costs and returns model)
Source: Mr. Masamichi Hori, “Separation of Infrastructure and Operation in the Railway System and Rail Access Charge”

The Feasibility Study on The Development of Dedicated Freight Corridor for Delhi-Mumbai and Ludhiana-Sonnagar in India Final Report (Task2)
Chapter 13 13-14
(2) What are key factors for the formulation
Following 3 items are key factors to position a TAC formula between the two ends.
1) Project durability to pay TAC
Projects whose cash flow is not sufficient can only afford to support operating expenses of DFC Railway but not afford to support its capital costs and investment return.
In case of worse situation, operators cannot afford to pay full amount of operating expenses of DFC Railway.
2) Relationship between fare and compensation cost for railway development
TAC of England is few times higher than that of Sweden. This is because England operators have to pay full amounts for operation, capital cost and investment return as private company, while in Sweden railway development cost is owed by public sector resulting that TAC has not direct relation with railway capital cost.
3) Degree of Open Access
The higher the TAC is the less entry into the railway operation business. If DFC Railway lowers the TAC level in order to increase new entry, then it can not even pay operational cost.
(3) Trial application of the formulation to DFCCIL
Objective of separation in DFC project is to reduce capital expenditure for ground facilities and operational cost of DFCCIL which could not have realized in case of integration model by IR. Business model of DFC is quite different from Swedish, French and Germany business model.
Approval of new 15 entries into Container/bulk operator business could accelerate the competition. While competition does not depend on level of TAC but on haulage charge because IR is sole TAC-payer to DFCCIL.
From cash flow projection point of view, DFC project is durable to pay not only operating expenses of DFCCIL but its capital costs and investment return thanks to high freight rate level and low operating ratio of 30%.
Accordingly, application of UK business model, “Costs and returns model” is recommended..
Following conditions should be important in developing TAC system:
1) Achievement degree of Operating Ratio should be important part of TAC Equation.
2) Price escalation must be in the formula.
3) TAC should be revised yearly.
4) Rail Regulator’s approval is needed for its instalment and revision.
(4) Simulations for attaining optimum split ratio of profit after tax
TAC is major income source for DFCCIL. It has to cover all expenditures including repayment of huge amount of debt and operating costs as well as cash surplus for future

The Feasibility Study on The Development of Dedicated Freight Corridor for Delhi-Mumbai and Ludhiana-Sonnagar in India Final Report (Task2)
Chapter 13 13-15
investments. A simulation process for the financial analysis was then carried out in 13.2 based on this requirement.
Further analysis regarding Split Rate of profit after tax between MOR and DFCCIL is in 13.2.2.
13.1.6 How to make DFCCIL accounting sound
Following figure illustrate cost structure of DFCCIL both construction period and operation period.
Source: JICA Study Team
Figure 13-10 Cost structure of DFCCIL
Cash flow analysis of DFCCIL, risk analysis of risk assumptions and risk hedge planning will be scrutinized in detail in 13.2.1 but following items must be included:
1) Reduction of initial investment by introducing phasing method of investment, following after demand growth.
2) Balancing of Debt Equity Ratio (Considering dividend rate and interest rate)
3) Maximizing Soft Loan portion (Considering interest rates of Soft Loan and Commercial Loan)
4) Setting up the DFCCIL Norm of maintenance personnel cost.
5) Formulating income-slide TAC system for additional investments.
13.1.7 How to complete construction of DFCCIL as scheduled (No Completion Delay,
No Cost Overrun)
As is already stated in 12.5.3.-(1)-4) in the Volume 2 Task0&1 report there are many risks which trigger the completion delay and cost overrun. The DFC project is really a gigantic

The Feasibility Study on The Development of Dedicated Freight Corridor for Delhi-Mumbai and Ludhiana-Sonnagar in India Final Report (Task2)
Chapter 13 13-16
project and gigantic scale of construction India never experienced in terms of track length (2,800 km), advanced technology utilized, number of states concerned, number of construction institutions concerned, number of facilities and equipment purchased, number of labours required, number of inhabitants suffered, amounts of construction cost needed (Rs. 267.2 billion), difficulty of funding estimated. Instead of these difficulties this is a challenging project because shorter construction period is required than Konkan Railway (track length: 741 km, construction cost: Rs. 35.5 billion) which caused 2 years of completion delay (40%, original construction period: 5 years) and huge amount of cost overrun (3 times of original cost estimate).
Uncontrollable completion delay and cost overrun would happen in the project if detail risk analysis is not executed and if risk-hedge measures such as phasing of construction process, taking into consideration of long environmental approval process and strong expected resistance against land acquisition and adoption of construction management are not taken.
First of all it is urgently requested that DFCCIL set up specialist team for the construction management.
13.1.8 Management Action Plans and essential Target Figures for successful DFC
Table 13-2 summarizes aforementioned strategies, tactics and recommendations and adds action plans. Picking up practical tactics, target figures are selected for monitoring achievement of tactics.
IR has improved its productivities by gaining big amount of freight volume and by constant reduction of employees for several years and posted huge amount of unparalleled profit as a government owned business in the world. But it is essential for IR to restore the past high market share in the trunk industrial corridors in order to support expected high GDP growth and industrialization. DFC is most expected development project.
DFC has to go through following two reforms to satisfy the expectations and following two target figures are needed for monitoring the degree of the achievement.
(1) Railway Container market share: Western Corridor 35%
This is an index which monitors the development, enhancement and prevalence of “Customer Oriented Business Development” in DFCCIL and IR.
(2) Operating Ratio: DFC (35%), Western Corridor (30%)
This is an index which monitors achievement of high target of productivity of Canada and USA by DFC,

The Feasibility Study on The D
evelopment of D
edicated Freight Corridor for D
elhi-Mum
bai and Ludhiana-Sonnagar in India Final Report (Task2)
Chapter 13
13-17
Table 13-2 PP & BD & F/A : Project planning & Business development & Finance & Accounting
Strategies Tactics Recommendation Action Plan Target f igures
Consensus on "No strategy, no restoration of market share" MOR,DFCCIL agree
Rcommendation to set up business development & sales in DFCCILDirector, Operation & Business development (Mr.Shkura), GM, Business development(Neeraj Kumar)
Data collection on shipper's shipping record by commodities and by OD
Data collection on shipper's shipping plan by commodities and by OD
Data collection on shipper's strategic truck-transportation plan bycommodities and by ODDeveloping DB with shipper's track record, forecast and planning data andestablishing tactics for restoring market share
Data collection on inter-modal shipping record by commoditiesand by OD by field surveyAnalysis on effective freight fare of all transportation modesDoor to door service Multi-User/Multi-Commodity Logistic ParkArrival date guarantee system System design
Cost of servicefrequency
Pick-up & Delivery service Alliance with truck co.
Energy cost Promoting electrification in Western CorridorIn troduction of Electric Locomotive inWestern Corridor
Operating Ratio Setting up DFC Norm.Operating Ratio :DFC(35%), WesternCorridor(30%)
One window system for DFC customers and Co-workingbetween DFC railways (IR) and DFCCIL in the field of PP & BD& F/A
Make the new DFC Railways in MOR
Design and Data collection of Integrated MIS system (PP & BD& F/A)
Deve lopment of MIS ( Shipper's forecast,Sales, Operation , Accounting, )
Operation (One-man operation) Establish one-man operation systemYear-1(2,400), Year-20(9,000)
Profit sharingbetween MOR andDFCCIL
Track Access Charge (TAC)Adoption of Whole cost system likeEngland
Split Rate of prof it aftertax between MOR(70%)and DFCCIL(30%)
6Total LogisticManagement
DFC solutionbusiness
Which Organization in MOR group is responsible Setting up Control tower in MOR
Restore ofrai lway marketshare
Railway Container marketshare : Western Corridor35%Setting up Development project of
Customer Management System
Distance-bandFreight fare
Setting up Research Pro ject of AllTransportation Master plan alongsideDMIC
Reduction of freight farefor 300-700Km distant-band: Figure13.5
Transit timecost/reliability cost
Longest days fortransportation betweenmajor cities: FS8.3Table8-11
Personnel cost Setting up DFC Norm.Ce iling of total number of DFCCILemployee
Year-1(8,700), Year-20(14 ,600)
1Growth ofTonne-Km
2 Fre ight fare
5 Organ ization
3No-Freightfare
4Improverailwayproductivity
Role sharingbetween MOR andDFCCIL
Construction (No Completion Delay, No Cost Overrun)Phasing of the project and Planning ofcost of price escalation on the phased

The Feasibility Study on The Development of Dedicated Freight Corridor for Delhi-Mumbai and Ludhiana-Sonnagar in India Final Report (Task2)
Chapter 13 13-18
13.2 CASH FLOW PROJECTION FOR DFC/ DFCCIL
13.2.1 Financial Projection for DFC
The following projections were arrived at using the Cash Flow Projection Model developed for simulations and risk analysis.
(1) Base Case
1) Assumption1: Capital Expenditure Table 13-3 3 Phased Capital Expenditure
Project Start Year 2008 2008 2010 2008 Construction Completion Year 2013 2015 2015 2015
Stage Phase Ⅰ-a Phase Ⅰ-b Phase Ⅱ Total Route Km 1,628 Km 905 Km 244 Km 2,777 Km
Civil & Track work Cost 114,066 66,455 25,991 206,512 Electrical Engineering Cost 19,063 8,538 2,866 30,467 Mechanical Engineering Cost 287 135 45 467 Signal & Telecom Engineering Cost 21,405 13,223 3,121 37,749
Sub Total-1 (Construction works): 154,821 88,351 32,023 275,195 Electric Locomotives 75,551 0 0 75,551
Sub Total-A (Construction costs): 230,372 88,351 32,023 350,746 Engineering Service Cost 4,769 3,473 609 8,851 Price Escalation 11,683 4,176 1,577 17,436 Contingency 21,835 7,805 2,947 32,587
Sub Total-B: 38,287 15,454 5,133 58,874 Land acquisition & compensation Cost 31,482 12,830 7,822 52,134 General Administration Cost 10,829 5,407 1,596 17,832 Taxes for Foreign Consultant 1,872 1,348 340 3,560 Accrued Interest during construction 10,820 4,268 1,623 16,711
Sub Total-C: 55,003 23,853 11,381 90,237 Grand Total: 323,662 127,658 48,537 499,857
1stPhase CAPEX
44%
25%
1%7%
4%10% 4%0% 5%
Sub Total-1 (Construction Works):
Sub Total-2 (Procurements):
Engineering Service Cost
Price Escalation
Contingency
Land Acquisition & CompensationCost
General Administration Cost
Taxes for Foreign Consultant
Accrued Interest duringConstruction
Figure 13-11 1st Phase Capital Expenditure

The Feasibility Study on The Development of Dedicated Freight Corridor for Delhi-Mumbai and Ludhiana-Sonnagar in India Final Report (Task2)
Chapter 13 13-19
2) Assumption2: Traffic Demand forecast (Unit: million tonne-Km) Con
tain
er
Coa
l
Ore
Ste
elFo
odg
rains
PO
LFe
rtilize
rs
Cem
ent
Oth
ers
-300
1,000-1,5000
5,000
10,000
15,000
20,000
25,000
30,000
35,000
40,000
Eastern Corridor demand in 2013Con
tainer
Coa
l
Ore
Stee
lFo
odgra ins
POL
Ferti lize
rsCem
ent
Oth
ers
-300
1,000-1,5000
10,000
20,000
30,000
40,000
50,000
60,000
70,000
Demand by commodities & distance in Western Corridor in
2013
Conta
iner
Coal
Ore
Steel
Foo dg
rains
POL
Fertiliz
ers
Cemen
t
Other
s
-300
1,000-1,5000
5,000
10,000
15,000
20,000
25,000
30,000
35,000
40,000
East Corridor demand in 2031
-300
300-700
700-1,000
1,000-1,500
1,500Km-
Conta in
er
Ore
Food
grain
s
Ferti
lizer
s
Others
-300Km
1,000-1,500Km0
10,000
20,000
30,000
40,000
50,000
60,000
70,000
Western Corridor demand in 2031
-300Km
300-700Km
700-1,000Km
1,000-1,500Km
1,500Km-
Figure 13-12 Traffic Demand Structure of both Corridors (2013, 2031)
3) Assumption 3: Freight Fare Table 13-4 Freight Fare by Commodities and by distant-bands
by Commodities By Distant-bands Commodities Unit -300Km 300-700Km 700-1,000Km 1,000-1,500Km 1,500Km-
Container Rs/TEU・Km 10.070 8.264 7.946 7.8 7.478 Coal Rs/Tonne・Km 1.035 0.850 0.817 0.802 0.769 Ore Rs/Tonne・Km 1.035 0.850 0.817 0.802 0.769 Steel Rs/Tonne・Km 1.035 0.850 0.817 0.802 0.769 Food grains Rs/Tonne・Km 0.813 0.668 0.642 0.63 0.604 POL Rs/Tonne・Km 1.627 1.335 1.284 1.26 1.208 Fertilizers Rs/Tonne・Km 0.739 0.607 0.583 0.573 0.549 Cement Rs/Tonne・Km 1.035 0.850 0.817 0.802 0.769 Others Rs/Tonne・Km 1.035 0.850 0.817 0.802 0.769 Average Rs/Tonen・Km 1.044 0.857 0.824 0.809 0.776

The Feasibility Study on The Development of Dedicated Freight Corridor for Delhi-Mumbai and Ludhiana-Sonnagar in India Final Report (Task2)
Chapter 13 13-20
4) Assumption 4: Operating Expense Table 13-5 Unit Costs of Operating Expense
Unit cost Variables Comments Overhead 0.52 Route-Km 4fold of JR track record Station (Small) 10.5 Number of stations Station master:1, Signal:1, Others:1 Station (Big) 35.0 Number of stations 3.5 shift, each 10 staff Driver 0.01 Train-Km/day Apply JR track record
Facilities 2.60 Route-Km Apply twofold of track record of Konkan Railway (double track)
Electric 1.70 Route-Km Apply JR track record Rolling stock 0.0098 Train-Km/day Apply JR track record
Personnel cost
Unit wage 158,419 Number of employee Apply IR track record
Overhead cost 258,633.6 Route-Km Apply Konkan Railway track record
Station 4,644,000 Number of stations Apply 80% of IR track record Driver 2.1 Train-Km Apply 80% of IR track record Fuel (EL) 94.85 Train-Km Apply IR track record Facilities 11.52 Train-Km Apply 80% of IR track record electric 14.16 Train-Km Apply 80% of IR track record
Material cost
Rolling stock 38.32 Train-Km Apply 80% of IR track record
5) Assumption 5: Train operation and station Table 13-6 Business-Km Train-Km, Number of stations
2013 2018 2023 2028 2031
East 697 697 1190 1190 1190West 928 1487 1487 1487 1487East 19.184 24.057 40.741 42.790 43.852West 25.248 61.132 85.245 108.404 122.796East 14 14 52 52 52West 22 32 32 32 32East 8 8 14 14 14West 6 12 12 12 12
Number ofsmall stationNumber ofbig station
Train-Km(million)
Route-Km
846 .563785 25
423 2 .8
2767.6
1 444 .0 4882945
72 20 .2
4720.9
14 44 .0 48829 45
722 0 .2
4720.9
1 444 .0488294 5
7 220 .2
4720.9
144 4 .048829 45
72 20 .2
4720.9
0
2000
4000
6000
8000
10000
12000
14000
16000
2014 2018 2023 2028 2031
DFCCIL's Staff Number
Electric
Facilities
Station (Big)
Station (Small)
Overhead
Figure 13-13 Number of DFCCIL’s Staff

The Feasibility Study on The Development of Dedicated Freight Corridor for Delhi-Mumbai and Ludhiana-Sonnagar in India Final Report (Task2)
Chapter 13 13-21
12 20 .08
11 83 .84259 1 .3 832 88
251 4 .4 115 07
34 32 .865 47 9
33 30 .899 17 8
41 12 .913 69 9
39 90 .747 94 5
4 53 1 .13 67 12
4 39 6 .54 84 93
0
1000
2000
3000
4000
5000
6000
7000
8000
9000
2014 2018 2023 2028 2031
DFC Railway's Staff Number
Rolling stock
Driver
Figure 13-14 Number of DFC Railway’s Staff
6) Assumption 6: Financing
a) Financing percentage
- Equity 1/3 of Total finance - Yen Loan Yen 500billion - Other Soft Loan 50% of remnant after Equity and Yen Loan - Commercial Loan 50% of remnant after Equity and Yen Loan
b) Terms and Conditions
- Equity Dividend: 7.0% p.a. - Commercial Loan 15 years (2 years grace) Interest rate 12%p.a. Soft Loan
JBIC STEP
ADB World Bank
Finance amount Yen 200billion 50% of remnant after Equity and Yen Loan Term year (Grace year) 40(10) 30(5) 30(5) Interest rate 0.40% 6months-LIBOR+0.75% 6months-LIBOR+0.75%
7) Other Assumptions:
a) TAC (Track Access Charge) revenue of DFCCIL from MOR
- DFCCIL receives Expenditure reimbursement (Operation cost, Depreciation, Interest payment, Tax) plus 30% of Profit after tax as TAC.
b) Tax
- Based on domestic corporate tax rate (35%) and added tax (5%) of Income Tax Act 1964. Assume 50% tax exemption for DFCCIL portion upon the suggestion of MOR, taking account other similar projects. MOR portion is not taxable.
c) Depreciation
- Apply SLM (Straight Line Method) rate of depreciation, The Companies Act, 1988 Schedule XIV
d) Capitalize interest payment during Phase I-a construction period (2008-2012).
- Assume interest payment from revenue after operation (2014).

The Feasibility Study on The Development of Dedicated Freight Corridor for Delhi-Mumbai and Ludhiana-Sonnagar in India Final Report (Task2)
Chapter 13 13-22
e) Order of disbursement is as follows according to commitment amount:
1. Pro rata disbursement of Equity from MOR and Yen Loan 2. Other Donor Loans 3. Commercial Loan
8) Summary list of the Base-case projection
Table 13-7 Summary of the Projections
DSCR ROE FIRR
Whole DFC project 4.5 47.1% 10.8%
DFCCIL(TAC revenue) 1.8 14.1% 2.8%
Projection results showing ROE of 47.1% and Debt Service Coverage Ratio (DSCR) of 4.5 prove that the whole DFC is an excellent project. The computed FIRR of 10.8% is also high taking into account of the amount of price escalation for 8 years.
9) Projection result-1: Profit & Loss (Unit: Rs. Million)
Profit after tax is posted from Year One. Depreciation and Interest payment begins to decrease about Year-17 resulting to an accumulation of retained earning after that. Average Operating Ratio of less than 30% makes this possible. The reasons for low Operating Ratio are:
a) Three-folds of freight rate compared with other countries
b) Low operating costs assumed as shown in Table 13-6.
0
20,000
40,000
60,000
80,000
100,000
120,000
140,000
160,000
180,000
2014
2016
2018
2020
2022
2024
2026
2028
2030
2032
2034
2036
TAC Payment in total DFC PL
MOR share on DFC profit
For DFCCIL's Future investment
Debt repayment
Tax
Interest payment & Dividend
Depreciation
Expense total
Figure 13-15 DFC Profit & Loss Structure
10) Projection result-2: Debt Service Coverage (Unit: Rs. Million)
Average Debt Service Coverage Ratio (DSCR) of DFCCIL results in 1.8 which shows sufficient repayment ability of debt and interest. In terms of yearly DSCR of DFCCIL, the worst is 1.5 and the best is 2.5 between 2014 and 2036.

The Feasibility Study on The Development of Dedicated Freight Corridor for Delhi-Mumbai and Ludhiana-Sonnagar in India Final Report (Task2)
Chapter 13 13-23
0
5,000
10,000
15,000
20,000
25,000
30,000
35,000
40,000
45,000
2014
2016
2018
2020
2022
2024
2026
2028
2030
2032
2034
2036
DFCCIL Debt Service Coverage
DFCCIL Cash Flow Surplus
Debt repayment
Interest payment & Dividend
Figure 13-16 DSC Structure of DFCCIL
11) Projection result-3: Equity & Loan Balance of DFCCIL
Equity from MOR begins to be disbursed from 2008. MOR equity and Yen Loan are disbursed on pro rata from 2009. Other Donor loans will be disbursed 2013 and 2014. Commercial loans will be disbursed after 2015. Grace period of each loans are 10years, 5years and 2 years respectively.
0
50,000
100,000
150,000
200,000
250,000
300,000
350,000
400,000
450,000
500,000
2008
2011
2014
2017
2020
2023
2026
2029
2032
2035
Equity & Loan Balance of DFCCIL
Commercial Banks
Donors
JBIC
Equity
Figure 13-17 Equity & Loan Balance of DFCCIL
12) Projection result-4: Dividend & Interest Payment
Interest-payment-burden of JBIC is extremely light even compared with mandated dividend payment to MOF as to government contribution to IR, by comparison between loan balance in Figure 13-17 and interest payment amount in Figure 13-1.

The Feasibility Study on The Development of Dedicated Freight Corridor for Delhi-Mumbai and Ludhiana-Sonnagar in India Final Report (Task2)
Chapter 13 13-24
0
2,000
4,000
6,000
8,000
10,000
12,000
14,000
16,000
2008
2011
2014
2017
2020
2023
2026
2029
2032
2035
Dividend & Interest payment
Commercial Banks
Donors
JBIC
Equity
Figure 13-18 Dividend &Interest Payment
13)Projection result-5:TAC simulation (Unit: Rs. Million)
If DFCCIL receives Expenditure Reimbursement (Operation cost, Depreciation, Interest payment, Tax) plus 30% of Profit after tax as TAC, DFCCIL can repay debt and accumulate retained earning for future investment as shown as red in Figure 13-19 The retained earning of DFCCIL seems to be essential and appropriate for additional investments in the future in order to maintain competitiveness and customer satisfaction.
0
20,000
40,000
60,000
80,000
100,000
120,000
140,000
160,000
180,000
2014
2016
2018
2020
2022
2024
2026
2028
2030
2032
2034
2036
TAC Payment in total DFC PL
MOR share on DFC profit
For DFCCIL's Future investment
Debt repayment
Tax
Interest payment & Dividend
Depreciation
Expense total
Figure 13-19 TAC Simulation

The Feasibility Study on The Development of Dedicated Freight Corridor for Delhi-Mumbai and Ludhiana-Sonnagar in India Final Report (Task2)
Chapter 13 13-25
14) Projection result-6:Retained earnings
0
200,000
400,000
600,000
800,000
1,000,000
1,200,000
1,400,000
2014
2016
2018
2020
2022
2024
2026
2028
2030
2032
2034
2036
Retained Earning (Rs. million)
MOR
DFCCIL
Figure 13-20 Retained earnings
15) Projection result-7:Balance Sheet (B/S) of DFCCIL (Asset)
0
100,000
200,000
300,000
400,000
500,000
600,000
2014
2016
2018
2020
2022
2024
2026
2028
2030
2032
DFCCIL Assets
Current Assets
Total Net Fixed Asset
Figure 13-21 Balance Sheet (B/S) of DFCCIL (Asset)

The Feasibility Study on The Development of Dedicated Freight Corridor for Delhi-Mumbai and Ludhiana-Sonnagar in India Final Report (Task2)
Chapter 13 13-26
16) Projection result-8:B/S of DFCCIL (Capital & Liability)
0
100,000
200,000
300,000
400,000
500,000
600,000
2014
2016
2018
2020
2022
2024
2026
2028
2030
2032
DFCCIL Capital & Liability
Loan Balance
Equity
Retained Earning
Figure 13-22 B/S of DFCCIL (Capital & Liability)
17) Projection result-9:Employee productivity
As is already stated, Employee productivity in 2014 is as same as Canada and that of 2032 is around the same level of U.S.A. as of 1999.
0
1
2
3
4
5
6
7
8
9
2,014 2,019 2,024 2,029 2,032
DFC Employee Productivity (MM ・tkm/Employee
Figure 13-23 Employee productivity
18) Projection result-10:Operating Ratio of DCF project
Main cause of fluctuation as is shown below is fluctuation from depreciation amount.

The Feasibility Study on The Development of Dedicated Freight Corridor for Delhi-Mumbai and Ludhiana-Sonnagar in India Final Report (Task2)
Chapter 13 13-27
Operating Ratio
15%
17%
19%
21%
23%
25%
27%
29%
31%
33%
2014
2016
2018
2020
2022
2024
2026
2028
2030
2032
2034
2036
2038
Total DFC Western corridor
Figure 13-24 Operating Ratio
(2) Business Risk:What if Railway market share is not recovered and GDP growth rate remains 5%.
1) Assumption Change
Base case assumes that IR’s market share will hit the bottom in 2004 at 23.7% and will grow gradually to the level of 37.7% in 2022 by 14%. Business Risk-case assumes Railway market share will remain at 23.7% throughout the project period and Western DFC’s traffic demand will depend only on natural growth by GDP growth rate of 5%.
2) Summary list of the Business Risk-case projection Table 13-8 Summary of the Business Risk case Projection
DSCR ROE FIRR Whole DFC project 3.49 34.7% 8.7%
DFCCIL(TAC revenue) 1.5 10.4% 1.3%
3) Conclusion
Projection result of Whole DFC project (Average DSCR: 3.49 and Average ROE: 34.7%) shows that the Project stands well against the business risk assumption. It is noteworthy that the average ROE of 34.7 is ample enough for the return of capital investment by MOR. DFCCIL’s DSCR (1.5) also seems to clear the minimum requirement of 1.2.
(3) Organizational Risk
1) Assumption Change
This scenario assumes that DFC accounting separation will not work well, resulting in 20% of DFC revenue remaining in the zonal railways.
2) Summary list of the Organizational risk-case projection Table 13-9 Summary of the Organizational risk projection
DSCR ROE FIRR Whole DFC project 3.4 33.4% 8.0% DFCCIL(TAC revenue) 1.5 10.0% -

The Feasibility Study on The Development of Dedicated Freight Corridor for Delhi-Mumbai and Ludhiana-Sonnagar in India Final Report (Task2)
Chapter 13 13-28
3) Conclusion
The probability of the organizational risk is not high because of current apportionment system in IR for many years. Even under the very rigid assumption of 20% of revenue reduction, DSCR of DFC and DFCCIL are 3.4 and 1.5 respectively and yearly DSCRs are over 1.2.
(4) Operating-Expenses Risk
1) Assumption Change
This scenario assumes that New Standard of Operating expenses are not set up nor achieved by a strong labor resistance and personnel cost jump up 3 times bigger and material cost is 25% higher than the planed.
2) Summary list of the Operating Expense Risk-case projection Table 13-10 Summary of the risk projection
DSCR ROE FIRR Whole DFC project 3.81 43.2% 9.1% DFCCIL(TAC revenue) 1.3 13.0% -
3) Conclusion
The result is that Operating Ratio jumps up 40s and DSCR drops to 3, presenting bad effects. This proves that streamlining all expenditure is fundamental for the project. Effect to average DSCR of DFCCIL is worst among all, resulting in 1.3. Yearly DSCR of DFCCIL drops to the level of 1.1, under the safe level of 1.2, in Year-5 and 5 years from Year-9 to Year-13, alarming the needs of cash injection from MOR’s portion of DFC retained earning.
(5) Interest Risk
1) Assumption Change
It is assumed that World Bank loan and ADB loan are not applicable to the project and commercial loans take the place and Yen Loan commitment remains Yen400billion.
2) Summary list of the Interest Risk-case projection Table 13-11 Summary of the Interest risk projection
DSCR ROE FIRR Whole DFC project 3.64 45.2% 10.9% DFCCIL(TAC revenue) 1.5 13.6% 3.4%
3) Conclusion
Effects of the interest risk assumption to the total DFC-financials seems to be absorbed. Average DSCR of DFCCIL (1.5) seems to clear the minimum requirement of 1.2 and ROE and FIRR are even improved because the shorter repayment period required by commercial loan lessens the burden of interest payments as long as DFC cash flow is sufficient. But DSCRs of DFCCIL for 2 years from Year-4 to Year-5 after start of operation are under 1.2. This proves that World Bank/ADB Loan should not be ruled out because of big amount of fund requirement.
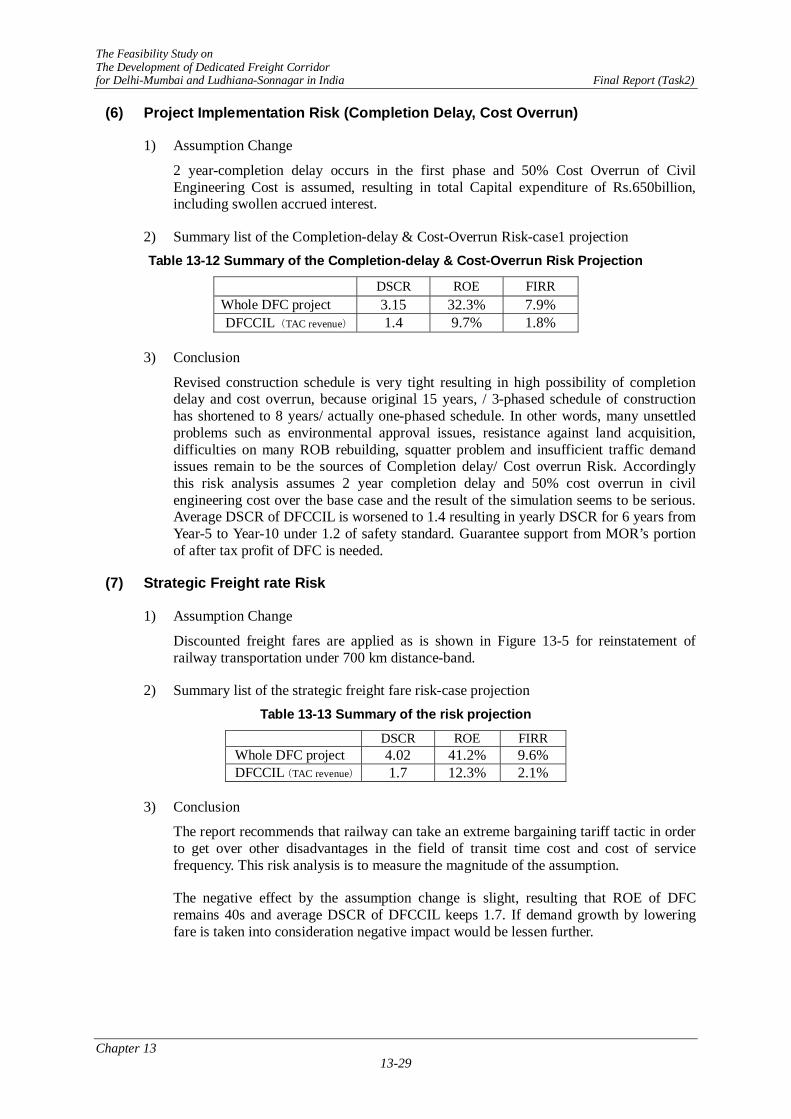
The Feasibility Study on The Development of Dedicated Freight Corridor for Delhi-Mumbai and Ludhiana-Sonnagar in India Final Report (Task2)
Chapter 13 13-29
(6) Project Implementation Risk (Completion Delay, Cost Overrun)
1) Assumption Change
2 year-completion delay occurs in the first phase and 50% Cost Overrun of Civil Engineering Cost is assumed, resulting in total Capital expenditure of Rs.650billion, including swollen accrued interest.
2) Summary list of the Completion-delay & Cost-Overrun Risk-case1 projection Table 13-12 Summary of the Completion-delay & Cost-Overrun Risk Projection
DSCR ROE FIRR Whole DFC project 3.15 32.3% 7.9% DFCCIL(TAC revenue) 1.4 9.7% 1.8%
3) Conclusion
Revised construction schedule is very tight resulting in high possibility of completion delay and cost overrun, because original 15 years, / 3-phased schedule of construction has shortened to 8 years/ actually one-phased schedule. In other words, many unsettled problems such as environmental approval issues, resistance against land acquisition, difficulties on many ROB rebuilding, squatter problem and insufficient traffic demand issues remain to be the sources of Completion delay/ Cost overrun Risk. Accordingly this risk analysis assumes 2 year completion delay and 50% cost overrun in civil engineering cost over the base case and the result of the simulation seems to be serious. Average DSCR of DFCCIL is worsened to 1.4 resulting in yearly DSCR for 6 years from Year-5 to Year-10 under 1.2 of safety standard. Guarantee support from MOR’s portion of after tax profit of DFC is needed.
(7) Strategic Freight rate Risk
1) Assumption Change
Discounted freight fares are applied as is shown in Figure 13-5 for reinstatement of railway transportation under 700 km distance-band.
2) Summary list of the strategic freight fare risk-case projection Table 13-13 Summary of the risk projection
DSCR ROE FIRR Whole DFC project 4.02 41.2% 9.6% DFCCIL(TAC revenue) 1.7 12.3% 2.1%
3) Conclusion
The report recommends that railway can take an extreme bargaining tariff tactic in order to get over other disadvantages in the field of transit time cost and cost of service frequency. This risk analysis is to measure the magnitude of the assumption.
The negative effect by the assumption change is slight, resulting that ROE of DFC remains 40s and average DSCR of DFCCIL keeps 1.7. If demand growth by lowering fare is taken into consideration negative impact would be lessen further.

The Feasibility Study on The Development of Dedicated Freight Corridor for Delhi-Mumbai and Ludhiana-Sonnagar in India Final Report (Task2)
Chapter 13 13-30
(8) Compound Risk of the business risk and project implementation risk
1) Assumption Change
It assumes that the business risk (no market share recovery and 5% GDP growth rate) and project implementation risk (2 year completion delay and 30% cost overrun) occur simultaneously.
2) Summary list of the compound risk-case projection Table 13-14 Summary of the risk projection
DSCR ROE FIRR Whole DFC project 2.68 25.9% 6.8% DFCCIL(TAC revenue) 1.2 7.8% -
3) Conclusion
Impact not only to DFCCIL but to DFC is serious, resulting in about 40% shrinking of all ROE, FIRR and DSCR. Above all DSCR of DFCCIL has serious damage, showing yearly DSCR for 7 years from Year-6 to Year-12 1.1. Guarantee support from MOR’s portion of after tax profit of DFC is needed.
13.2.2 Simulations for optimum split rate of DFC’s profit after tax
A simulation for the optimum TAC-split-rate was carried out, resulting in Figure 13-19 and Figure 13-20 based on the requirement as follows:
1) Expenditure (Operation cost, Depreciation, Interest & dividend payment, Tax) is deducted from DFC revenue according to operating expenses assumptions for DFCCIL.
2) Then the projection iron out optimal split percentages of profit after tax between MOR and DFCCIL. The DFCCIL portion should cover both Debt repayment and surplus for further investment. MOR portion should cover current and future income of existing freight corridor and investment return.
Risk analysis proves that DFCCIL accumulates Rs. 100 billion retained earnings at Year-20 even under very hash risk assumptions with 30:70 (DFCCIL: MOR) split rate. Please refer to Volume 4 Technical Working Paper Task2, 13 about the detail result of risk simulation.
30:70 split seems to be appropriate if current assumptions are correct.
13.3 FUNDING PLANS
Capital Expenditure (CAPEX) of the 3 phased project amounts to Rs. 498.8 billion (1st Phase: Rs. 329.2 billion, 2nd Phase: Rs. 119.7 billion, 3rd Phase: Rs. 49.8 billion) according to the results of the JST study shown below.

The Feasibility Study on The Development of Dedicated Freight Corridor for Delhi-Mumbai and Ludhiana-Sonnagar in India Final Report (Task2)
Chapter 13 13-31
0
50,000
100,000
150,000
200,000
250,000
300,000
350,000
400,000
450,000
500,000
1stPhase
2ndPhase
3rdPhase
Total
DFC Capital Expeniture (Rs million)
Accrued Interestduring Construction
Taxes for ForeignConsultant
General AdministrationCost
Land Acquisition &Compensation Cost
Contingency
Price Escalation
Engineering ServiceCost
Sub Total-2(Procurements):
Sub Total-1(Construction Works):
Source: JICA Study Team
Figure 13-25 Capital Expenditure of DFC project
Rs. 498.8 billion is assumed to be the total amount expected to fund the project. Preliminary research and funding feasibility is shown below based on past track record and the analysis on potential market size because the project is still under F/S and potential financiers have not started their analysis.
13.3.1 Fund sources
Possible fund sources are as follows:
1) Equity finance from MOR
2) Yen Loan
3) Donor finance from international finance institutions like World Bank and ADB
4) Indian domestic commercial finance already financed to Konkan Railway and railway developments by RVNL
13.3.2 Equity finance
Indian Cabinet decided that Ministry of Railway (MOR) invests 100% of equity to the newly built project company (DFCCIL).
Let’s assume MOR invests 1/3 of total required fund amounting to Rs. 166.7 billion.
MOR wants to make the money for the investment from IR’s cash flow for first 6 years (Rs. 18.3 billion per year). IR posted Rs. 213 billion of cash flow as of FY 2006 and Rs. 133 billion of total increase in fixed assets. Required fund (Rs. 23 billion per year) is 13% of IR’s annual cash flow and 7% of annual total increase in fixed assets. The magnitude is acceptable for the IR’s sound financing taking Government Contribution of 25% into consideration.

The Feasibility Study on The Development of Dedicated Freight Corridor for Delhi-Mumbai and Ludhiana-Sonnagar in India Final Report (Task2)
Chapter 13 13-32
Detail analysis on PL, cash flow and B/S of IR are as follows. These are the reasons why the above conclusion has come out:
IR's net profit has improved after FY 2002 exceeding ADB forecast. Income increased by both rapid growth of freight traffic while freight rates kept stable. Net Income posted Rs. 149.2billion as of FY2007, 6.3 times larger than as of FY 2002.
0
20,000
40,000
60,000
80,000
100,000
120,000
140,000
160,000
Rs
Millio
n
2002-03
2003-04
2004-05
2005-06
2006-07
Net Income of IR
Achievements
ADB forecast
Source: Ministry of Railway
Figure 13-26 IR’s Net Income Trend
Increase of net profit leads to increase of cash flow (net profit before depreciation) which posted Rs. 117.1 billion as of FY2006, 2.6 times larger than as of FY 2002. Government contribution has increased in line with the growth of cash flow, posted Rs. 83.1 billion as of FY 2005, 1.6 times larger than as of FY2002. Total source of fund as of FY 2005 is Rs. 213 billion.

The Feasibility Study on The Development of Dedicated Freight Corridor for Delhi-Mumbai and Ludhiana-Sonnagar in India Final Report (Task2)
Chapter 13 13-33
50,981
55,68569,987
85,546
83,133
-50,000
0
50,000
100,000
150,000
200,000
250,000Rs.
Millio
n
2001-02
2002-03
2003-04
2004-05
2005-06
Sources of Funds
Other Sources
Net Increase inPension Fund
Interest on Fundbalances
GovernmentContribution
Add Depreciation
Add Dividend
Net Income(Loss) forAppropriation
Source: Ministry of Railway
Figure 13-27 IR’s Sources of Funds
Looking into the Use of Funds as of FY 2006, 47% (Rs. 100 billion) of source of fund is consumed by purchase of Fixed Assets and 15% (Rs. 32.5 billion) is used for replacement of Fixed Assets. After all, about 62% (Rs. 132.8 billion) of available fund is allotted for Fixed Assets investment. Out of 38% of source of fund, 17% is used for Dividend to the balance of Government Contribution amounted to Rs. 559.5billion. Funds Deposited to Government is mainly for pension fund purpose.
61,509
15,69613,37214,232
71,143
14,648
27,148
18,642
83,005
19,050
33,871
18,363
98,296
22,346
31,993
25,566
100,246
32,556
36,679
43,516
0
50,000
100,000
150,000
200,000
250,000
Rs.
Millio
n
2001-02
2002-03
2003-04
2004-05
2005-06
Uses of Funds
Funds Deposited toGovernment
Dividend toGovernment
Replacement of FixedAssets
Purchase of FixedAssets
Source: Ministry of Railway
Figure 13-28 IR’s Uses of Funds

The Feasibility Study on The Development of Dedicated Freight Corridor for Delhi-Mumbai and Ludhiana-Sonnagar in India Final Report (Task2)
Chapter 13 13-34
510,277
164,566
568,041
196,341
633,984
228,580
721,266
272,093
816,605
342,103
0
200,000
400,000
600,000
800,000
1,000,000
1,200,000
1,400,000
2001-02
2002-03
2003-04
2004-05
2005-06
Assets
Other Non-CurrentAssets
Fixed Assets
Total Current Assets
Source: Ministry of Railway
Figure 13-29 IR’s BS
Total Assets as of FY2006 is Rs. 1,200 billion. 68% is Fixed Assets and 28% is Funds Deposits with Government which is mainly for Pension Fund and balance of Depreciation Fund.
As to Liabilities & Equity, 47% is the balance of Government contribution and 49% is Retained Earnings and Deposit-Provident Fund which are the results of corporate activities.
367,575
188,424
407,093
221,541
456,720
260,198
508,450
322,117
559,502
423,598
0
200,000
400,000
600,000
800,000
1,000,000
1,200,000
1,400,000
2001-02
2002-03
2003-04
2004-05
2005-06
Liabilities & Capitals
Retained Earnings
GovernmentContribution
Reserved PensionFund
Deposits-ProvidentFund etc.
Accounts Payable
Figure 13-30 IR’s BS
13.3.3 Yen Loan
Rs. 27.8 billion per year for 6 years is challenging amount considering current yearly acceptance amount of Yen Loan to India is Rs. 56.5 billion as of FY 2005.
According to “the rule of country of origin”, one of the financing rule of Special Terms for Economic Partnership (STEP), it stipulated that more than 30% of agreed STEP loan amount must be procured by facilities & equipment of “Japan Origin” which includes facilities & equipment procured from Japanese companies not only in Japan but from Japanese subsidiaries in the borrower’s country* and in other developing countries**.

The Feasibility Study on The Development of Dedicated Freight Corridor for Delhi-Mumbai and Ludhiana-Sonnagar in India Final Report (Task2)
Chapter 13 13-35
* Japanese subsidiaries is defined that (1) more than not less than 10% of the equity of the manufacturer are held by Japanese companies and (2) The proportion of the shares held by the Japanese firm mentioned in (1) above is the same as or greater than that of the shares held by any firm of a country or region other than Japan and the country or the territory where the manufacturer is located.
** is defined (1) not less than one-third of the shares of the manufacturer are held by a Japanese firm and (2) the same above.
Assumed Rs.166.7 billion as Yen Loan amount, Yen 150billion, 30% of the loan, could be procured from afore-defined “Japan Origin”.
Repayment period (grace period) of STEP is 40 years (10 years) or 30 years (10 years) and interest rate is 0.4% p.a. and 0.3% p.a. respectively.
13.3.4 Other Donors
Assuming that other donors are requested to finance half of the remnant after equity finance and Yen Loan, it is about US$2.2billion. It is possible amount for their subscription because World Bank suggested US$1.5-2billion and ADB are willing to participate the financing with unofficial commitment. But the project is record magnitude in terms of construction scale, tight construction schedule against the construction magnitude and finance amount. Completion delay could destroy the project. Accordingly it is absolutely needed that MOR and other donors get rid of the barriers, which caused troubles in the previous finance. It may be recommendable that Donors clarify their precondition beforehand and find out solutions for it, for example qualified construction bidder because of the importance of other donor portion for total finance scheme.
Followings are terms & conditions of the last financing for MOR’s PSU by ADB and World Bank just for information:
Table 13-15 Terms and conditions
ADB World Bank
epayment years (Grace period) 30years (5years) 30years (5years)
Interest rate and others
LIBOR-based US$ Lending facility, Int. Margin, front-end fee: 1% pa, Commitment fee: 0.75% pa
LIBOR-based US$ Lending facility, Int. Margin: 0.75%, front-end fee: 1% pa, Commitment fee: 0.75% pa
Source: Ministry of Railway 13.3.5 Domestic Commercial Banks
Let’s assume that domestic/foreign Commercial Finance Market takes on the remnant financing amounting to Rs. 83.3 billion.
Domestic Commercial Finance Market has provided following financing both to Konkan Railway and RVNL railway projects. IRFC maintains AAA rating in domestic capital market.
IRFC, the financial arm of MOR, can raise funds from foreign financial/capital markets with a BB+ rating from S&P, Baa3 from Moodys’ and BBB from JCR. It has also issued Samurai Bond amounting to Yen 15billion in Tokyo Bond Market in February 2007.

The Feasibility Study on The Development of Dedicated Freight Corridor for Delhi-Mumbai and Ludhiana-Sonnagar in India Final Report (Task2)
Chapter 13 13-36
Financing Rs. 83.3 billion for 8 years from the domestic/foreign commercial markets seems to be viable from both funding size and credibility of DFCCIL (100% owned by Central Government) because Konkan Railway raised Rs. 27.6 billion and RVNL (50% owned by Central Government) railway projects is under financing of Rs. 150 billion for 5 years and Rs. 400 billion for 10 years from the domestic Commercial Finance Market.
Current terms and conditions of the domestic Commercial Finance Market are as follows:
1) Commercial Bank Loan
Terms: 10-15 years(incl. 2 year grace period), Most favourable interest rate: 11.5%
2) Bond
Terms: 3-5 years, Interest rate: around 7.5%
3) Capital Gain Tax Exemption Bond
Terms: 5 years, Interest rate: around 5.5-5.6%
The lending balance of designated commercial banks in Indian financial market is Rs. 7.3 trillion, that of other banks like Indian Industrial development Bank is scaled about Rs. 2.4 trillion and Company Bonds market size is about Rs. 600 billion. Total size of Commercial Finance Market is Rs. 10 trillion as of the end of FY2003.
1) Konkan Railway
Other than 22.5% of equity financing are commercial sources (Debts, Company Bonds, Leases etc.) amounted to Rs. 27.6 billion. Interest rates of Company Bonds are around 10% and term is 5-10 years.
Amount (Billion Rs.)
Percentage
Equity 8 22.5% Long term Loan (Bond) 22.5 63.3% ECB 4.09 11.5% Lease 0.86 2.4% Suppliers’ Loan 0.1 0.3% Total 35.55 100%
Borrowing feature: Bond issuing and debt are on project financing basis with support of Letter of Comfort from MOF. Taxable Bond and Tax-free Bond were issued. Bonds are subscribed by Commercial Banks, institutional investor and residents of the railway site.
2) Railway projects under RVNL
RVNL railway projects is under finance amounting to Rs. 150 billion for 5 years. Interestingly enough, most of the projects are schemed to have equity partners from provincial governments, port authorities/trust and major industrial groups and to have financing from ADB, SPV borrowing from commercial banks and bond financing subscribed by banks and institutional investors with oversubscription
Viability-test is on combination of IRR and other financial indices. Threshold of IRR-test is funding cost + 2%. Commercial financiers are satisfied with the borrower’s credibility because projects are 50% owned by RVNL (100% owned by Central Government)

The Feasibility Study on The Development of Dedicated Freight Corridor for Delhi-Mumbai and Ludhiana-Sonnagar in India Final Report (Task2)
Chapter 13 13-37
13.4 REVIEWING POSSIBILITY OF PRIVATE/PUBLIC SECTOR PARTICIPATION (PSP) IN DFC
Current PSP activities in MOR as a part of “Railway Sector Reform” are already stated in “MOR’s PPP Strategy (Task 0&1)”. Possibility of PSP for the DFC project is reviewed hereunder.
13.4.1 PSP to DFCCIL as Equity holders/Major customers
(1) As fund providers:
PSP as equity holders in KRC (Konkan Railway Corporation) and MRVC (Mumbai Rail Vikas Corporation Ltd.) projects is limited to local governments. However equity holders in RVNL (Rail Vikas Nigam) projects extend to port authorities and port trusts. Furthermore if loan and bond funding is considered as PSP much more private sector funds would be involved in KRC and RVNL projects.
Public Sector Undertakings (PSU) such as power generators, steel manufacturers and coal miners have been suggested in the “Report of DFC Task Force” to participate in DFCCIL as equity holders. Equity participation by major shippers might be recommendable and possible, taking into account over Rs.600 billion funding-needs.
(2) As the board members of DFCCIL:
MOR has not placed the main priority in obtaining shipper’s needs and taking actions which might lead to a decline in long-term market share. Although MOR has conducted hearing request with major shippers it would be very important for DFCCIL to take in directors from these major shipper and have their opinions on marketing, operation, investment, operating cost reduction and transportation securities during director’s meetings.
13.4.2 New entry to container train-operator business with ICD facilities
(1) Promoting PSP in container train-operator business
CONCOR, 100% owned PSU by MOR, used to be the only operator of container (bulk) train with the exception of IR along the IR networks. MOR introduced other 15 operators due to the rapid increase of container demand
The new competitive system of train-operator business with ICD facilities is important for Western DFC where container train will dominate in future. Door to Door strategy of container transportation will be essential in order to realize current demand forecast of Western DFC.
The expected Development Plans of ICD facilities by the 15 operators of container (bulk) train on IR networks will be the key step for successful PSP in railway sector.
13.4.3 Cooperation of Logistic Park/Rail Side Warehousing with ICD/SEZ
(1) Development of a railway-centred integrated transportation business
Road-centred integrated transportation business is prevailing in developed countries where highway network is well developed, motorization is matured and logistic park for truck transportation is well developed nationwide and where railway network is only a part of the total transportation system.

The Feasibility Study on The Development of Dedicated Freight Corridor for Delhi-Mumbai and Ludhiana-Sonnagar in India Final Report (Task2)
Chapter 13 13-38
The share of medium ad long-distance railway transportation to the total Indian transportation system is still high while short-distance market share has been dropping. Thus, development of a railway-centred integrated transportation base like a Logistic Park/ Rail side Warehousing is highly recommended in order to block the entry of inefficient truck mode in the medium & long-distance Railway transportation business. PSP in the field is a very important building block for a total PPP. This Logistic Park/ Rail side Warehousing must cooperate with nation wide SEZ/ICD.

CHAPTER 14 EXECUTING AGENCY AND STAKEHOLDERS

The Feasibility Study on The Development of Dedicated Freight Corridor for Delhi-Mumbai and Ludhiana-Sonnagar in India Final Report (Task2)
Chapter 14 14-1
CHAPTER 14 PROJECT IMPLEMENTATION PLAN
14.1 EXECUTING AGENCY AND STAKEHOLDERS
DFCCIL is the executing agency of the DFC Project and is positioned in the centre and would manage the communication and interaction of the stakeholders of the Project such as the Ministry of Railways (MOR), relevant Ministries, Zonal Railways, contractors, suppliers, and consultant which will be managing the design and construction supervision.
The following Figure14-1 indicate the assumed organization structure for the DFC Project.
Figure 14-1 Relevant Stakeholders for Implementation of DFC Project
Organisations and role of each of them in the implementation of the DFC Project :is indicated in the following Table 14-1.
GOJ
Ministries
JBIC
GOI
MOF
MOEF
MOST
IR Zonal Railways
RDSOState
Governments
DFCCIL
EnvironmentalConsultant
Track Material Supplier
Civil & Track workContractors
Core system & ElectrificationContractors
ICDContractor
Locomotive& Depot
Contractor
MOR
MORD
General Consultants

The Feasibility Study on The Development of Dedicated Freight Corridor for Delhi-Mumbai and Ludhiana-Sonnagar in India Final Report (Task2)
Chapter 14 14-2
Table 14-1 Role of Stakeholders in DFC Project
Abbreviation Organisation Role Pertaining to DFC Project GOJ Government of Japan GOI Government of India JBIC Japan Bank of International
Cooperation Prime Lending Agency
MOR Ministry of Railways Ministry responsible for DFC Project. MoF Ministry of Finance Ministry responsible for budget allocation. MoST Ministry of Shipping and
Transport Ministry responsible for development of ports and highways.
MoEF Ministry of Environment and Forests
Ministry responsible for environment issues, wild life and forests.
MORD Ministry of Rural Development
Ministry responsible for social environmental issues.
SG State Governments Responsible for management of development and maintenance of roads within State, land acquisition, resettlement, and rehabilitation.
IR (Zonal Railways)
Indian Railway Responsible for management of railway development, maintenance, and operation of feeder lines within respective Zones.
RDSO Research Design and Standards Organization
Responsible for preparing standards and R&D for railway, approval of new technologies railway technologies applied to DFC.
DFCCIL Dedicated Freight Corridor Corporation of India Ltd.
SPV for DFC Project responsible for construction maintenance of DFC.
14.2 DFC PROJECT IMPLEMENTATION SCHEDULE
14.2.1 Schedule for the Implementation of DFC Project
(1) Critical Factors of the Implementation
The Project aims to construct a new freight railway line, mainly on embankment structures and the sequence of the works involved can be generalised as: 1) Civil works (earthworks and bridge structures); 2) Track works; 3) Electrification, telecommunication, and signalling works. The implementation of the works is desired to be completed in a short period of time, and JST envisages that the track works and civil works will be carried out simultaneously with a reasonable time between the commencement of each work. Since the civil works being the forerunner of the works, followed by the track works, the critical path of the whole construction schedule lies in these two activities.
The volume of earthworks in Phase I-a Project alone amounts to 107.27 million m3, and assuming the duration of the works of the whole project is five (5) years, the earthworks is required to be completed effectively in two (2) years. Thus the JST assumes that one team for the construction of earthwork is required to be deployed at every 20km along the DFC.
With regard to track works, the procurement of track material such as ballast, sleepers, and rail is largest critical factor which affect the schedule. In Phase I-a alone, 430,000 tons of 60kg rail, 8,400,000m3 of ballast and 6,000,000 pieces of PC sleepers are required to be procured.

The Feasibility Study on The Development of Dedicated Freight Corridor for Delhi-Mumbai and Ludhiana-Sonnagar in India Final Report (Task2)
Chapter 14 14-3
With regard to ballast, the DFC lines being planned on three zonal railways i.e. Northern Railway, North Western Railway, and Western Railway, and it is assumed that the total volume of ballast procured by the three Zonal Railways to the extent of 2,000,000m3 per annum will be required for maintenance. JST calculates that it will take four (4) years to procure ballast required for DFC Project even if the suppliers of the ballast doubles their production capacity. The procurement of ballast is envisaged to be a difficult task since the acquisition of approval for the expansion of concession, and expansion of the facility will take time. The situation for the procurement of the sleeper is no different. The expansion of the production facility in a short time frame is perceived to be difficult.
Thus, as a countermeasure, it will be desirable to make a long term material procurement plan, in which the process for the procurement of material is recommended to start in advance of the commencement of the construction.
As an essential consideration, the completion of the land acquisition is absolute prerequisite, in advance of the commencement pf the civil works. If the land acquisition is delayed, the overall schedule will be delayed (time overrun) as well as trigger the increase of Project cost (cost overrun). In recent years there were cases in which a road construction project was delayed, and an industrial park project was terminated due to protest from nearby residents.
The social impact arising from the implementation of mega-scale infrastructure development project such as this DFC Project is substantial, and there is a high possibility that land acquisition issue itself becomes the largest risk factor as well as the critical factor. It is advised that MOR/DFCCIL endeavour with maximum effort for the early acquisition of land required for the Project.
(2) Critical Factors for Financing the Project
The DFC Project is a massive scale project requiring a vast amount of finance. The Government of India is requesting the Government of Japan for Yen Loan since self-financing and borrowing from domestic market alone is not sufficient.
The process for financing from international lending agency such as JBIC, ADB, and World Bank requires some time. In case of financing from these organisations, it is mandatory to comply with the guidelines of the respective organisations stipulating the procurement of consultants and contractors. After the consultants and contractors are procured under competitive bidding procedures of Yen Loan, it requires 2.5 years from the day of the signing of the Loan Agreement (L/A) until the signing of contract for the construction and the commencement of works.
For the case of this Project, in which the application of the Special Terms for Economical Partnership (STEP) will be applied, the procurement of the consultant takes 10 months, and after that the total duration to complete activities such as the detailed design by the consultant, preparation of tender documents, tender assistance, tender evaluation and concurrence by JBIC, negotiation with contractors, signing of contract and concurrence by JBIC of the contractor, and commencement of works, is at least 20 months.
The following Figure 14-2 indicate the duration for the standard procedures for the procurement of consultants and contractors under Yen Loan.

The Feasibility Study on The Development of Dedicated Freight Corridor for Delhi-Mumbai and Ludhiana-Sonnagar in India Final Report (Task2)
Chapter 14 14-4
Time: Month 1 2 3 4 5 6 7 8 9 10
Signing Contract
PQ Short ListConsultant Tender Tender
Evaluation
Contract Negotiation
Incl. Cont. Doc.
ApprovalOf
DFCCIL
ConcurrenceOf
JBIC
PQ Short List
ApprovalOf
JBIC
LCOpening
PQ Short ListConsultant Tender Tender
Evaluation
Contract Negotiation
Incl. Cont. Doc.
ApprovalOf
DFCCIL
ConcurrenceOf
JBIC
PQ Short List
ApprovalOf
JBIC
LCOpening
PQ Short ListContractor Tender
(Design & Build)Tender
Evaluation
Contract Negotiation
Incl. Cont. Doc.
ConcurrenceOf
JBIC
ApprovalOf
JBIC
LCOpening
Approval of DFCCIL Signing Contract
-3
Approval of Tender Documents by JBIC
Time: Month 1 2 3 4 5 6 7 8 9 10 11 12
Figure 14-2 Process for Procurement of Consultants and Contractors Under Yen Loan
14.2.2 Implementation Plan for Phased Development
In this section, the implementation plan for the prioritised section covered by Phase I-a, proposed in Chapter 3, has deliberated with the assumption that the STEP loan is financed.
The implementation plan is based on the evaluation carried out for each section, taking into consideration the level of seriousness of the traffic situation, the soundness of the design, and level of impact envisaged on the natural and social environment.
The following is the resultant classification of the Project:
For the development scenario, following three phases are considered.
Phase I-a Project: A particular section composed of smaller sections having commonality of stringent traffic situation in the short to mid-term future, and no existence of engineering and environmental issues (category A section) in the near future that would undermine the implementation of the works on the combined sections, and constitutes as an independently viable project that generate viable project effect. The Project is earmarked as a priority project since it was judged to be capable of bearing scrutiny by JBIC and other international lending agencies in the project appraisal process for the financial assistance.
Phase I-b Project: A particular section composed of smaller sections having commonality of stringent traffic situation in the short to mid-term future. However if it is contemplated to get the project financed by international lending agencies, the subject section has serious engineering and environmentally related obstacles, thus the implementation of the

The Feasibility Study on The Development of Dedicated Freight Corridor for Delhi-Mumbai and Ludhiana-Sonnagar in India Final Report (Task2)
Chapter 14 14-5
section is judged as not eligible for being taken up by the international lending agencies in the immediate future (category B section). However, even if a category C section can be implemented earlier if it is likely to uplift the overall effect of the implementation, the implementation of such section can be done by self-financing and responsibility of the Government of India. And however if the particular sections are assumed to be financed by international lending agencies, then maximum effort by the Indian Government will be required to eliminate the obstacles and address the issues. The Project 1-B is assumed to be a project that will be implemented by the Indian Government taking immediate action to remove the obstacles, commence with the preparation works on site by self –finance, and seek financial assistance from international lending agencies with approximately a two year lead time.
Phase II Project: A particular section composed of smaller sections having commonality of no serious traffic situation in the short to mid-term future, and is judged that its implementation can be deferred until the traffic demand exceeds its capacity. And sections which require reconsideration of the alignment over the whole stretch, and its immediate implementation is impossible.
Taking into consideration the above condition, the sections to be implemented in each phase have been determined as follows:
Table 14-2 Sections Implemented by Each Phase
Phase Western Corridor Eastern Corridor
Phase I-a Rewari – Ahmedabad – Vadodara ( 918 Km )
Mughal Sarai – Kanpur – Khurja ( 710Km )
Phase I-b Vadodara – Vasai Rd.(339Km)
Vasai Rd. – JNPT ( Total 433 Km )
Khurja – Dadri (46Km) Khurja – Kalanaur (242km)
Kalanaur – Dhandarikalan (184Km) (Total 472 Km )
Phase II Rewari – Dadri (117 Km) Sonnagar – Mughal Sarai (127Km)
14.2.3 Implementation Schedule For Phase I-a Project
For the deliberation of the implementation schedule for Phase I-a Project, it is important that the vast 1,600km extensive section is completed as early as possible. For the realisation of this, it is an absolute prerequisite that the Government of India (GOI) promptly resolve problems such as land acquisition, settlement and compensation to habitants, and environmental impact etc. Further more, detailed design works should be accelerated, and after freezing the final alignment, the overall DFC project area be divided into ten (10) to twenty (20) construction segments, and start works on segments having no constraints.
1) For the cases for which Yen Loan is available to implement the works for all sections eligible. (Refer to Table 14-3)
The procedures for procurement of consultants can commence once the Yen Loan is pledged. Assuming that the L/A for Phase I-a Project is concluded in February 2008,

The Feasibility Study on The Development of Dedicated Freight Corridor for Delhi-Mumbai and Ludhiana-Sonnagar in India Final Report (Task2)
Chapter 14 14-6
the selection of the General Consultant will take about 10 months. After that, it is assumed that the General Consultant will take approximately one (1) year and eight (8) months for activities such as: to arrange the procurement of major track materials (such as rail, ballast, and PC sleepers), prepare the detailed design for construction works such as civil, track, electrical, depot for locomotive), prepare tender documents, tendering, tender evaluation, and contract signing with the selected contractor.
In case of ROB construction, coordination activities such as the selection of its route, discussion with road authority, and construction of detour, etc is envisaged to take time. Therefore, JST estimates it will take approximately four (4) years from the conclusion of the L/A to the commencement of the ROB works. Once the civil works completes, the track works and electrical works will follow. Running test of prototype locomotives, and functional tests of the electrical facilities will be carried out, after their arrival. After completion of all works, a comprehensive operational and integrated test would be carried out. After clearance of the operational conditions from the safety point view, the facilities will be handed over to the Indian Railways (IR) who will carry out practical operational and track maintenance trainings for approximately six (6) months. Accordingly, the full commissioning of the DFC of Phase I-a Project becomes a reality, approximately 8 (eight) years after concluding the L/A.
2) For the case that the Government of India commences with all civil works by self-financing. (Refer to Table 14-4)
As a measure to advance the commencement of the works, it is conceived that specific project component be implemented in advance by self-financing from the Government of India (MOR/DFCCIL), later followed by financing by the Government of Japan. Such components are: land acquisition (which is not eligible for Yen Loan), basic design and construction of all civil works (earthworks, bridges, reconstruction of ROBs, construction of RUBs, etc.), determination of site for ICDs and depots.
For this case, JST estimates a duration of fifteen (15) months for the detailed design and preparation of tender document for the civil works. In the whole stretch of Phase I-a (divided into 10 to 20 working sections), construction can commence from in the sections having no constraints, followed by selection of Indian contractors. JST estimates that forty five (45) months is required for the implementation of the civil works. Similarly, JST estimates fifty-four (54) months for the reconstruction of ROBs, and construction of long-span bridges, including the duration from basic design until the completion of its construction.
JST estimate the quantum of main materials necessary for track works of Phase I-a Project as, 8,400,000 m3 of ballast, 5,900,000 pieces of PC sleeper, and about 430,000 tons of head hardened (HH) rail. Ballast and PC sleeper can be procured domestically in India, but due to the limit of manufacturing capacity of existing suppliers, it is recommended that procurement of those materials be planned on a long term basis. Accordingly, JST recommends that GOI procure about 30% of the whole amount of ballast & PC sleeper in the Phase I-a in advance of the commencement of the works funded by Yen Loan, currently estimated to be in the middle of 2009. Regarding procurement of HH rail, it will take Japanese manufacturer three and half (3.5) years from the material order to the delivery of the rails to supply approximately 400,000 tons required for Phase I-a Project. However, rail are also contemplated to be procured by Yen Loan, its delivery can still be made before the commencement of the track works.
Procurement of locomotive is contemplated to be made by Yen Loan. The technical specification for the locomotives are required to be determined by the Indian Railways and approved by Research Design & Standards Organisation (RDSO) before the

The Feasibility Study on The Development of Dedicated Freight Corridor for Delhi-Mumbai and Ludhiana-Sonnagar in India Final Report (Task2)
Chapter 14 14-7
commencement of its procurement, which is scheduled in 2009. Based on the approved specification the General Consultant will provide the design documents and tender documents, and will select the contractor through tender. It is envisaged that the awarded contractor (manufacturer) will produce say 10 prototype locomotives. Then the delivered prototype locomotives will be tested on the completed sections of the DFC line for approximately six (6) months in order to confirm its performance. After the test run, the results will be feed backed to the manufacturer who will make necessary improvements, and will start preparation for mass production. After completion of installation of all track facilities including signal, telecommunication, CTC, and electrification system, a comprehensive running test will be executed. The duration for the delivery of the locomotives is expected to take six (6) years from the conclusion of the L/A of the Phase I-a Project to the completion of its delivery.
The provision of at least one inland container depot (ICD) in Phase I-a Project, is required. The determination of its location, basic design, and environmental study (rapid EIA study) of ICD need to be initiated by the GOI, and the tender design, preparation of tender document, procurement of contractor, and the construction of the ICD will be made using Yen Loan. It is estimated that it would take approximately one and a half (1.5) years for the construction of the 50 hectare ICD, for the earthwork, drainage, and pavement works etc. After the completion of the land development works, track works, signalling and telecommunication facility works will follow. Finally, the container company will be selected through tender to install the necessary facilities such as gantry cranes, portal cranes, etc. that are used for loading and unloading containers.
The construction of a locomotive depot, having an area of approximately 50 hectare, is proposed to be covered by Yen Loan. It is estimated to take approximately two (2) years for the completion of the detailed design, selection of contractor, and conclusion of the contract for the construction, and another two (2) years for the construction of the depot. Inside the locomotive depot, a separate repair-maintenance will be built, and machines utilised for repair and rehabilitation is installed in it. Since those machines will be custom-made, JST assumes them to be procured from abroad, which will take 2 and half years for delivery and installation.
Simultaneous to the running test of the locomotives, and integration tests of the electrical facilities, it is envisaged that the Indian Railways will recruit crew, train them for train operation and maintenance, as well as impart training for handling, inspection and maintenance of other facilities. This procedure is estimated to take about six (6) months.
Assuming that the L/A is concluded in March 2008, the procurement of the General Consultant to the commissioning of the DFC operation for Phase I-a, will take approximately 6 years, and commissioning in around January 2014.
The JST concludes that this collaborative implementation of Phase I-a Project, in which procurement of major track material, and advanced commencement of all civil works initiated by the GOI financing, and followed by Yen Loan for the implementation of the remaining works can reduce the project duration by two and half (2.5) years than the schedule implemented by the full Yen Loan, which was presented in 1) above.

The Feasibility Study on The Development of Dedicated Freight Corridor for Delhi-Mumbai and Ludhiana-Sonnagar in India Final Report (Task2)
Chapter 14 14-8
Table 14-3 DFC Project Implementation Schedule for Phase I-a
Case Study ---- Option 1: All Eligible Works Fully Covered by Yen Loan
A. Works Implemented by the Indian Government Budget and ResponsibilityA01 Final Alignment Survey
A02 Basic Design of Facilities and Defining the Technical Specification of theElectric Locomotives
A03 General Plan for new ICD
A04 EIA (Environmental Impact Assessment) for new ICD
A05 Land Acquisition & Resettlement for Track Line, Station & Depot
A06 Procurement Process of EIA and RRP Consultant/NGO
A07 Selection of EIA and RRP Consultant/NGO
A08 Implementation of RRP
A09 1) Relatively less difficult sections
A10 2) Relatively difficult sections
A11 3) Implementation of Comprehensive EIA (1 full year survey/monitoring)
A12 Environmental Baseline Survey
【ROB Replacement】A13 General Arrangement Drawing for ROB replacement
A14 Detailed Design / Bid Documents for ROB
A15 Agreement with Road Owner for ROB construction (Design, Permit, CostSharing, etc.)
A16 Selection of Contractor for ROB (Replacement)
A17 Construction of ROB (Replacement)
【Other Works】A18 Determination of Technical Specification for Locomotive
A19 Approval to the Specification for Locomotive by RDSO
A20 Preparation of Train Operation Manual & Track Maintenance Manual by RDSO
A21 Training for Operation, Training for Maintenance
A22 Open to Public DFC Operation
B01 JICA Feasibility Study
B02 EIA based on the guideline-design
B03 Resettlement Action Plan Frame Work based on the Guideline Design
B04 Approval for EIA by the Indian Government 120 days
B05 Appraisal to the Project funded by Japanese ODA Loan
B06 Review of EIA & RAP (Resettlement Action Plan) Frame Work by JBIC
B07 Pledge ★
B08 Loan Agreement (Japanese ODA Loan ) ★
B09Selection of General Consultant (Track Line, Signal, CTC,Telecommunication, Electrification, ICD, Locomotive Depot, EIA, RAP, etc.)
Minimum 10 Months
B10 General Consultant Engineering Service
B11 Environmental Management Monitoring Programme
【Civ il and Track Works】
B12 Detailed Design / Bid Documents for Route Alignment, Station &Locomotive Depot by DFCCI
B13 Detailed Design / Bid Documents for Civil Works & Track Works ( EarthWorks, Bridge, Culvert, Track etc) by DFCCIL
Design & Document
B14 Review of Detailed Design / Bid Documents for Civil and Track Works byGC
B15 Selection of Contractor for Civil Works (Earth Work, Station, Bridge, Culvert,etc.)
Tender
B16 Construction of Civil Works (Earth Work, Station, Culvert, etc) Construction (Civil Work)
B17 Construction of Long-span Bridge (L=3Km)
B18 Procurement of Ballast Procurement (Ballst)
B19 Procurement of PC Sleepers & Fasteners Procurement (Sleeper)
Procurement (Rail)
B21 Construction of Track Works Construction (Track)
【Signal and Telecommunicat ion Works】
B22 Tender Design & Bid Document (Signal, Telecommunication, Train Control,
Electrification)
B23 Selection of Contractor (Tender) for Electrical Works(Signal,
Telecommunication, Train Control, Electrification)
Tender
B24 Construction for Electrical Works (Signal, Telecommunication, Train Control,Electrification)
Signal, Electrif ication
【Locomotive and Loco. Depot Works】
B25 Tender Design & Documentation for Locomotove and Locomotive Depot
B26 Selection of Contractor for Locomotive Procurement and MaintenanceDepot Construction
Tender
B26 Procurement of Locomotive (Prototype 10 Rolling Stocks) Manufacturing
B27 Procurement of Locomotive (Feedback of Test Run, Preparation of SeriesProduction & Series Production)
Manufacturing
Tender Construction & Machinery Setting
【ICD Works】B29 Tender Design & Document for ICD (Inland Container Depot)
B30 Reviewing Basic Design & EIA for ICD & Locomotive Depot ApprovalB31 Approval by the Provincial Government
Tender Equipment Installation by the Container Company
Tender Construction & Machinery Setting
【Running Test】
B34 Running & Integration Test (Locomotive, Signal, Telecommunication,Electrification & Train Operation)
B. Works Implemented Using Yen Loan
2007
B28
B33
B20
B32 Inland Container Depot (ICD) --- Tender, Construction)
Procurement of Rail & Turnout
Depot of Locomotive -- Tender, Construction
Depot of Locomotive -- Tender, Construction
2012Description 2009 20102008 20162014 20152011 2013
★

The Feasibility Study on The Development of Dedicated Freight Corridor for Delhi-Mumbai and Ludhiana-Sonnagar in India Final Report (Task2)
Chapter 14 14-9
Table 14-4 DFC Project Implementation Schedule for Phase I-a
Case Study ---- Option 2: All Civil Works Advanced by GOI's prior to other Works Covered by Yen Loan
A. Works Implemented by the Indian Government Budget and ResponsibilityA01 Final Alignment Survey
A02 Basic Design of Facilities
A03 General Plan for new ICD
A04 EIA (Environmental Impact Assessment) for new ICD
A05 Land Acquisition & Resettlement for Track Line, Station & Depot
A06 Procurement Process of EIA and RRP Consultant/NGO
A07 Selection of EIA and RRP Consultant/NGO
A08 Implementation of RRP
A09 1) Relatively less difficult sections
A10 2) Relatively difficult sections
A11 3) Implementation of Comprehensive EIA (1 full year survey/monitoring)
A12 Environmental Baseline Survey
【ROB Replacement】A13 General Arrangement Drawing for ROB replacement
A14 Detailed Design / Bid Documents for ROB
A15 Agreement with Road Owner for ROB construction (Design, Permit, CostSharing, etc.)
A16 Selection of Contractor for ROB (Replacement)
A17 Construction of ROB (Replacement)
【Civil Works】
A18 Detailed Design / Bid Documents for Route Alignment, Station &Locomotive Depot
A19 Detailed Design / Bid Documents for Overall Civil Works ( Earth Works,Bridge, Culvert, etc)
Design & Document
A19 Selection of Contractor for Overall Civil Works (Earth Work, Station, Bridge,Culvert, etc.)
Tender
A20 Construction of Civil Works (Earth Work, Station, Culvert, etc) Construction (Civil Work)
A21 Construction of Long-span Bridge (L=3Km)
【Procurement of Track Materials】A22 Procurement of Ballast by DFCCIL
A23 Procurement of PC Sleepers & Fasteners by DFCCIL
【Other Works】A24 Determination of Technical Specification for Locomotive
A25 Approval to the Specification for Locomotive by RDSO
A26 Preparation of Train Operation Manual & Track Maintenance Manual byRDSO
A27 Training for Operation, Training for Maintenance
A28 Open to Public DFC Operation
B01 JICA Feasibility Study
B02 EIA based on the guideline-design
B03 Resettlement Action Plan Frame Work based on the Guideline Design
B04 Approval for EIA by the Indian Government 120 days
B05 Appraisal to the Project funded by Japanese ODA Loan
B06 Review of EIA & RAP (Resettlement Action Plan) Frame Work by JBIC
B07 Pledge ★
B08 Loan Agreement (Japanese ODA Loan ) ★
B09 Selection of General Consultant (Track Line, Signal, CTC,Telecommunication, Electrification, ICD, Locomotive Depot, EIA, RAP, etc.)
Minimum 10 Months
B10 General Consultant Engineering Service
B11 Environmental Management Monitoring Programme
B12 Preparation of Tender Design & Bid Document for Track Works
【Track Works】B13 Selection of Contractor for Track Works Tender
Rail = 388,000 ton
B15 Construction of Track Works Track
【Signal and Telecommunication Works】
B16 Tender Design & Bid Document (Signal, Telecommunication, TrainControl, Electrification)
B17 Selection of Contractor (Tender) for Electrical Works(Signal,Telecommunication, Train Control, Electrification)
Tender
B18 Construction for Electrical Works (Signal, Telecommunication, TrainControl, Electrification)
Signal, Electrif ication
【Locomotive and Loco. Depot Works】B19 Tender Design & Documentation for Locomotive and Locomotive Depot
B20 Selection of Contractor for Locomotive Procurement and MaintenanceDepot Construction
Tender
B21 Procurement of Locomotive (Prototype 10 Rolling Stocks) Manufacturing
B22 Procurement of Locomotive (Feedback of Test Run, Preparation of SeriesProduction & Series Production)
Manufacturing
Construction & Machinery Setting
【ICD Works】B24 Tender Design & Document for ICD (Inland Container Depot)
B25 Reviewing Basic Design & EIA for ICD Approval
B26 Approval by the Provincial GovernmentTender ConstructionICDTrack Equipment Installation by the Container Company
【Running Test】
B28 Running & Integration Test (Locomotive, Signal, Telecommunication,Electrification & Train Operation)
B. Works Implemented Using Yen Loan
2007Description
Inland Container Depot (ICD) --- Tender, Construction)
Procurement of Rail & TurnoutB14
Depot of Locomotive -- ConstructionB23
B27
20122010 201120092008
★
2014 2015 20162013

The Feasibility Study on The Development of Dedicated Freight Corridor for Delhi-Mumbai and Ludhiana-Sonnagar in India Final Report (Task2)
Chapter 14 14-10
14.2.4 Implementation Schedule For Phase I-b Project
The length of the section covered in Phase I-b is 905 km which is approximately a little more than that of Phase I-a. However, since the route of Project Phase I-b passes through more built-up areas than that of Project Phase I-a where the land acquisition, resettlement, and compensation is considered to be extremely difficult, JST envisages that the resolution of these issues and the determination of the basic alignment will take time. The largest obstacle that hinders the implementation of the works in this section is the reconstruction of the existing ROBs, particularly a large number of ROBs which are concentrated on sections between Surat to Vasai Rd. and Vasai Rd. to JNP of the Western Corridor. Under the current plan, in which the DFC is planned parallel and adjacent to the existing lines, the existing ROBs need to be demolished and reconstructed. The ROBs located in urbanised are a integral part of the trunk road having a significant traffic volume, thus if its reconstruction is contemplated, discussions and coordination with the road authorities regarding the reconstruction plan is required for engineering and consideration of social environmental aspects. JST concludes that for those sections having concentration of existing ROBs, deliberation for carrying out a comparative study for a detour route in addition to the parallel route plan is necessary.
The implementation of the Phase I-b Project has engineering challenges, and JST considers that financial assistance from international lending agency is essential. For the foreseeable future, JST assumes that the construction works that can be implemented within the right of way can be implemented by self-finance of the Indian Government. For the implementation of other works of which financing from international lending agency is contemplated, the Government of India need to address the conditions for the realisation of the phased development scenario, which is presented in Chapter 3. In consideration of the aspiration of MOR for the early commencement of the DFC works and its completion, JST estimates that it will take eight (8) years for the overall duration of the Project considering a two year lead time required to refine the Project plan to a level which bear scrutiny of international lending agency. (refer to Figure 14-3). It is crucial that the Government of India fully understand that maximum effort is required for the resolution of the aforementioned issues within the short time frame. The following summarises the prerequisites for the realisation of the Project.
[Prerequisites for the realisation of Phase I-b Project]
1) The Phase I-b Project extends to more than 900km, having engineering challenges as well as environmental issues that complicate the implementation. The cost for land acquisition and construction is estimated to be large. It is advised that the Government of India urgently deliberate the necessity of requesting financing from international lending agencies such as ADB and World Bank.
2) Immediate securing of self-financing required for land acquisition and the cost of the works determined to be implemented by the Indian Government.
3) Urgent commencement of detailed site survey and careful study of engineering feasibility of the existing ROBs which are subject to reconstruction.
4) It is envisaged that the land acquisition of the subject section will be difficult since it is situated in a heavily built-up area. The review of plan and the preliminary design of the station need to be prepared to minimise the scale of land acquisition and resettlement.
5) In view of the above, a comparative study is urgently required between the DFC planned in parallel to the existing line and that of an alternative route established that avoids those

The Feasibility Study on The Development of Dedicated Freight Corridor for Delhi-Mumbai and Ludhiana-Sonnagar in India Final Report (Task2)
Chapter 14 14-11
sections, having many ROBs, and area where it is extremely built-up or populated. For this purpose the topographical survey is required to be carried out immediately.
6) This section mainly passes through the suburbs and fertile agricultural land, and the residents have voiced dissent in the stakeholder meetings. Since it is envisaged that it would not be easy to build consensus among the residents, thus continuous effort initiated by MOR/DFCCIL is required for the materialisation of the consensus building.
7) In order to acquire fund for international lending agencies, MOR/DFCCIL need to take initiative to carry out a ESIMMS of JICA Study (a rapid EIA level study) in a timely manner that would withstand the appraisal.
14.2.5 Implementation Schedule For Phase II Project
The extent of the section covered in Phase II is approximately 200km which is approximately 10% of the combined section of Phase I-a and Phase I-b. The traffic situation of the freight transport in this section is not serious compared to that of Phase I-a and 1-B, and the line capacity has some margin. The requirement for the reinforcement of containerised freight is low. Since there is possibility of alteration of the whole route of those sections designated as implemented in Phase II on both corridors, the commencement of the works on these sections is not possible in the near future. It is assumed that two (2) years is necessary to determine the route.
The route between Mughal Sarai and Son Nagar cannot be fixed until the track layout of the massive Mughal Sarai Junction Station is determined. There are no prominent constraints on this section other than the issue of this junction station.
A four (4) km tunnel is perceived to be necessary due to the existing gap of the terrain between the Rewari and Dadri section on the Western Corridor. JST has conducted a preliminary study on possible detour routes avoiding this gap, but could not determine a feasible detour route due to difficulty to locate land within the heavily built-up condition of the area. The tunnel option bears environmental impact issues of dewatering of ground water currently utilised for agricultural purposes. Thus, JST judges that a thorough engineering study and planning of the route and structures is required.
JST estimates that two (2) years are necessary to carry out the additional engineering studies (refer to Figure 14-3) which include topographical survey, geological survey, and environmental survey, which require immediate execution. Besides this, discussions with local residents are necessary. The following summarises the prerequisites for the realisation of the Project.
[Prerequisites for the realisation of Phase II Project]
1) The urgent reconsideration of the detour route for the tunnel section between Rewari and Dadri is advised. Also, the urgent execution of engineering survey and preliminary design for the tunnel section is advised.
2) There is a high possibility that the construction of the tunnel section between Rewari and Dadri will cause lowering of the water level, and thus site survey and thorough evaluation is required to assess its impact. The urgent execution of the natural environment survey is advised.
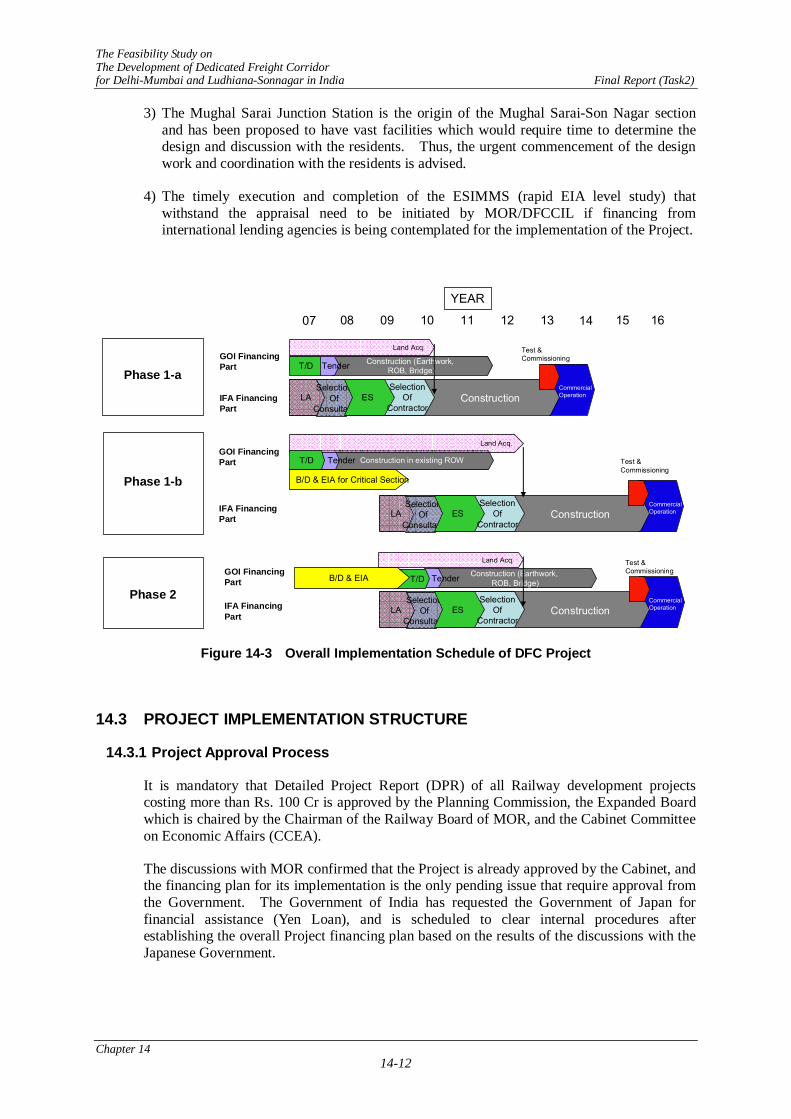
The Feasibility Study on The Development of Dedicated Freight Corridor for Delhi-Mumbai and Ludhiana-Sonnagar in India Final Report (Task2)
Chapter 14 14-12
3) The Mughal Sarai Junction Station is the origin of the Mughal Sarai-Son Nagar section and has been proposed to have vast facilities which would require time to determine the design and discussion with the residents. Thus, the urgent commencement of the design work and coordination with the residents is advised.
4) The timely execution and completion of the ESIMMS (rapid EIA level study) that withstand the appraisal need to be initiated by MOR/DFCCIL if financing from international lending agencies is being contemplated for the implementation of the Project.
Construction (Earthwork, ROB, Bridge)
Phase 2
Phase 1-b
LASelection
OfConsultant
ESSelection
OfContractor
Construction
YEAR
07 08 09 10 11 12 13 15 16
Phase 1-a
Land Acq.
T/DGOI Financing Part
IFA Financing Part
Test &Commissioning
CommercialOperation
14
Construction in existing ROWTender
LASelection
OfConsultant
ESSelection
OfContractor
Construction
Land Acq.
T/D Test &Commissioning
CommercialOperation
B/D & EIA for Critical Section
Tender
Construction (Earthwork, ROB, Bridge)
LASelection
OfConsultant
ESSelection
OfContractor
Construction
Land Acq. Test &Commissioning
CommercialOperation
TenderT/DB/D & EIA
GOI Financing Part
IFA Financing Part
GOI Financing Part
IFA Financing Part
Figure 14-3 Overall Implementation Schedule of DFC Project
14.3 PROJECT IMPLEMENTATION STRUCTURE
14.3.1 Project Approval Process
It is mandatory that Detailed Project Report (DPR) of all Railway development projects costing more than Rs. 100 Cr is approved by the Planning Commission, the Expanded Board which is chaired by the Chairman of the Railway Board of MOR, and the Cabinet Committee on Economic Affairs (CCEA).
The discussions with MOR confirmed that the Project is already approved by the Cabinet, and the financing plan for its implementation is the only pending issue that require approval from the Government. The Government of India has requested the Government of Japan for financial assistance (Yen Loan), and is scheduled to clear internal procedures after establishing the overall Project financing plan based on the results of the discussions with the Japanese Government.

The Feasibility Study on The Development of Dedicated Freight Corridor for Delhi-Mumbai and Ludhiana-Sonnagar in India Final Report (Task2)
Chapter 14 14-13
Figure 14-4 presents the flow for project appraisal process of DFC Project.
Review ofFeasibility Study Report of RITES
Consensus by Steering Committee
GOI
MOR/RB
DFCCIL
Stake-holder’s Approval
JICA StudyFinal Report
Japanese Funding Agency’s FF Mission & Appraisal Mission
Review by GOI for Sub-Loan Scheme to DFCCIL
Validation of the L/A by both Governments
Proposal for Project Financial Scheme according to result of discussion with stakeholders concerned
Process for EN & LA by GOI &GOJ
Present
Discussion by SC
- MOR/RB- DEA- PLG. COMM.- DFCCIL- Advisory
Committee of JICA
- JST
Decision MakingBy High Level Authorities
Finalization and approval of the
Project Financial Scheme
GOJ’sGovernment
Approval
GOI’sGovernment
Approval(MOF)
Figure 14-4 Project Appraisal Process for DFC Project
14.3.2 Project Executing Organisation
The executing organisation for the DFC Project is as follows:
1) DFCCIL: An infrastructure management company (SPV) responsible for the construction of the railway infrastructure, train operation control, and the maintenance. JST proposes that DFCCIL be responsible for the construction of the ICD required in Phase I-a Project.
2) MOR: Responsible for the procurement of the rolling stock (locomotives and wagons), train operation, and the maintenance of the rolling stock.
DFCCIL was incorporated on November 03, 2006 and provisional senior Executives consisted of three Boards of Directors and four Officers for the Project Commencement Group. However, DFCCIL is to be managed by a Board of Directors consisting of one Managing Director and four Directors who have been/ are being selected through open applications. The current position is that the Managing Director and Director Finance have already assumed charge of their posts. Besides the Director (Operation & Business Development) is also expected to join soon. However the incumbents for the post of Director (Infrastructure) and Director (Projects & Planning) are under process of finalization.
The Board of Directors of DFCCIL will be supported by the Senior Officers and other supporting staff. As per the information available with JST, the following Senior Officers have already joined their Duty in DFCCIL:

The Feasibility Study on The Development of Dedicated Freight Corridor for Delhi-Mumbai and Ludhiana-Sonnagar in India Final Report (Task2)
Chapter 14 14-14
Officer on Special Duty 1 officer
General Manager (S&T) 1 officer
General Manager (Electrical) 1 officer
General Manager (Operation) 1 officer
General Manager (Business Development) 1 officer
General Manager (Finance) 1 officer
General Manager (Mechanical) 1 officer
General Managers (Civil) 3 officers
General Managers of following Regional Offices have also assumed charge:
[Western DFC]
General Manager, DFCCIL Mumbai
General Manager, DFCCIL Vadodara
General Manager, DFCCIL Ahmedabad
General Manager, DFCCIL Jaipur
[Eastern DFC]
General Manager, DFCCIL Allahabad
General Manager, DFCCIL Kanpur
General Manager, DFCCIL Ludhiana
5) Schedule in the Future
DFCCIL will continue to proceed with the expansion of the organisation in accordance to the developments in the Project..
The JST has proposed the establishment of a dedicated Section within the DFCCIL organisation that will handle environmental and social consideration issues, which was accepted in principle by MOR/DFCCIL. The Section Chief is scheduled to be assigned.
14.3.3 Project Management Structure
The MOR nor DFCCIL have experience implementing railway development projects using Yen Loan. In order for DFCCIL, as an executing organisation, to implement and complete the Project as per schedule complying to JBIC Guidelines, it is imperative to hire a Consultant who is well versed with the tasks of design, tender assistance, construction supervision.
Figure 14-5 and 14-6 presents the project management structure during design and tender assistance stage, and project management structure during construction supervision stage, respectively.

The Feasibility Study on The Development of Dedicated Freight Corridor for Delhi-Mumbai and Ludhiana-Sonnagar in India Final Report (Task2)
Chapter 14 14-15
DFCCIL/ MOR
EnvironmentalConsultants
Track Material Procurement
Contract
Civil & Track workContracts
ICDContract
Core system & Electrification
Contracts
Locomotive& Depot Contract
GC Core GroupPD/Co PDContract
Specifications
Infrastructure & Building GroupDesign Manager
Earth workTrack work
BridgesCulverts
Station BuildingsDepotICD
Locomotive Group
Design ManagerLoco Elect.Loco Mech.
Expatriate & National Experts
LEGEND
Expatriate & National Experts
LEGEND
Core system & Electrification
GroupDesign Manager
SignalTelecommunication
Train ControlElectrification
Figure 14-5 Project Management Structure during Design and Tender Assistance Stage
DFCCIL
ZMTWestern Zone
Civil TeamTrack TeamE/M Team
Expatriate & National Experts
National Experts
ZMTNW Zone -1Civil Group
Track GroupE/M Group
ZMTNC Zone-1Civil Group
Track GroupE/M Group
ZMTNC Zone-2Civil Group
Track GroupE/M Group
Rolling StockTeam
ZonalManagement
Team(ZMT)
DivisionalSupervision
Team(DST)
Eastern Corridor
cont
ract
orco
ntra
ctor
DST
(Vad
odar
a)co
ntra
ctor
cont
ract
orco
ntra
ctor
cont
ract
orD
ST(V
adod
ara)
cont
ract
orco
ntra
ctor
DST
(Ahm
edab
ad)
cont
ract
orco
ntra
ctor
cont
ract
orco
ntra
ctor
DST
(Ahm
edab
ad)
cont
ract
orco
ntra
ctor
DST
(Ajm
er-1
)co
ntra
ctor
cont
ract
orco
ntra
ctor
cont
ract
orD
ST(A
jmer
-1)
cont
ract
orco
ntra
ctor
DST
(Ajm
er-2
)co
ntra
ctor
cont
ract
orco
ntra
ctor
cont
ract
orD
ST(A
jmer
-2)
cont
ract
orco
ntra
ctor
DST
(Jai
pur-
1)co
ntra
ctor
cont
ract
orco
ntra
ctor
cont
ract
orD
ST(J
aipu
r-1)
cont
ract
orco
ntra
ctor
DST
(Jai
pur-
2)co
ntra
ctor
cont
ract
orco
ntra
ctor
cont
ract
orD
ST(J
aipu
r-2)
cont
ract
orco
ntra
ctor
DST
(Alla
haba
d-1)
cont
ract
orco
ntra
ctor
cont
ract
orco
ntra
ctor
DST
(Alla
haba
d-1)
cont
ract
orco
ntra
ctor
DST
(Alla
habd
-2)
cont
ract
orco
ntra
ctor
cont
ract
orco
ntra
ctor
DST
(Alla
habd
-2)
cont
ract
orco
ntra
ctor
DST
(Alla
habd
-3)
cont
ract
orco
ntra
ctor
cont
ract
orco
ntra
ctor
DST
(Alla
habd
-3)
cont
ract
orco
ntra
ctor
DST
(Alla
haba
d-4)
cont
ract
orco
ntra
ctor
cont
ract
orco
ntra
ctor
DST
(Alla
haba
d-4)
cont
ract
orco
ntra
ctor
cont
ract
orco
ntra
ctor
ZMTNW Zone-2Civil Group
Track GroupE/M Group
Depot Group
ICD
DST
Western Corridor
Core TeamPD/Co PDContract
Specificationsco
ntra
ctor
Supp
lier
cont
ract
orSu
pplie
r
ICD Team
Figure 14-6 Project Management Structure during Construction Supervision Stage

The Feasibility Study on The Development of Dedicated Freight Corridor for Delhi-Mumbai and Ludhiana-Sonnagar in India Final Report (Task2)
Chapter 14 14-16
The construction supervision is proposed to be executed by the tri-layered organization. The first layer is the Core Group of General Consultant which has its head office stationed in the DFCCIL Headquarters, and takes on responsibilities for the overall management of schedule and control of Project cost by close communication with DFCCIL.
The Zonal Management Team (ZMT) is placed at the second layer which is expected to make day to day communication with the Zonal Railways, and be responsible for the overall project management of the works of the respective sections within each Zonal Railways, and report the progress to the Core Team. The ZMT is considered to be part of the General Consultant, and international experts will be deployed.
The third layer, the Divisional Supervision Team (DST), will coordinate with the Divisional Office, which is responsible of maintenance of the existing railway facility of the Zonal Railways, and manage the day to day construction activities of the DFC. The DST is proposed to have a site office and under the directions of the ZMT and carry out the day to day construction supervision activities, and report the management record to ZMT.
The DST is required to be established before the hiring of the General Consultants and in place from the beginning of the construction the DFC. Thus it is proposed that the DST is established by the DFCCIL.
The CPM & Experts Groups and Resident Engineer (Site Management) teams that manage and supervise the earthworks, the construction of station facilities, will be deployed according to requirements at site offices.
14.4 DISCUSSIONS REGARDING CONTRACT PACKAGES OF PHASE I-A PROJECT AND CONSTRUCTION SEGMENTS
The following are the preconditions considered for the division of the contract packages and the construction segments.
i) The General Consultant is deployed to manage the overall implementation of the Project.
ii) Implementation of the works and procurement of the rolling stock be made through self-financing from Government of India, and Yen Loan as well as from other international lending agencies.
iii) The Special Terms on Economic Partnership (STEP) conditions is applied for the portion of Yen Loan, and the prime contractor is limited to Japanese firms.
iv) The executing organisation responsible for the construction of the infrastructure and its maintenance is DFCCIL, and the executing organisation responsible for the procurement of rolling stock and its maintenance is MOR.
The division of the contract packages were made considering the following factors:
Factors considered for contract packaging Clarification
1. Packaging of the same Project component not allowed under different executing organisation.
- Components of construction of infrastructure is to be included in contract of DFCCIL Project, and procurement of rolling stock and construction of the depot to be included in the contract with MOR.

The Feasibility Study on The Development of Dedicated Freight Corridor for Delhi-Mumbai and Ludhiana-Sonnagar in India Final Report (Task2)
Chapter 14 14-17
2. For project component(s) which are implemented on different period, packages that is (are) have critical activity are isolated and its implementation be advanced.
- Isolation of the civil/track, works which are implemented in the early stage of the overall schedule, and the electric/signal/telecommunication works, which are implemented in later.
3. Consolidation of Project components that have commonality and mutually relevant
- Consolidation of electric/ signal /telecommunication works into a single package.
4. Consolidation of Project components into a single package that are considered to realise efficient construction.
- Material required for track works need to be procured in advance of the track works. The procurement of track material done in advance together with the procurement of the material required by civil works.
5. The size of one package is required to be small as possible and be able to manage the project efficiently.
- Separate the infrastructure works into two packages, one for each corridor.
- The signal/telecommunication system is required to be a unified system by each corridor. Each corridor to have a single package.
6. Since prime contractor are limited to Japanese contractor(s), Project components that are difficult to divide are proposed to be integrated into other Project components.
- The integration of electrification works with signalling/telecommunication works.
- The integration of the package for the construction of the depot with the package of procurement of rolling stock.
7. In principle, one main contract package is concluded for each Zonal Railways and site activities managed by ZMT and works carried out by main contractor. However, for Zonal Railways where long sections of DFC is planned, the main contract will be separated into secondary contract packages which will be managed by DST, and its works carried out by a subcontractor.
- [Western Corridor] Phase I-a Project: 2 sub contract packages for North Western Railway between Rewari and Palanpur section; 1 contract package for Western Railway between Palanpur and Vadodara section
- [Eastern Corridor] Phase I-a Project: 2 contract packages for North Central Railway between Mughal Sarai and Khurja.

The Feasibility Study on The Development of Dedicated Freight Corridor for Delhi-Mumbai and Ludhiana-Sonnagar in India Final Report (Task2)
Chapter 14 14-18
Table 14-5 Contract Packages Assumed for Phase I-a Project
No. Item Package Estimated Contract
Amount *) (million Rs.)
Western DFC A. Civil and track works Rewari-Madar (Ajmer) / 290km Package W-A2a 16,402 Madar (Ajmer) – Palanpur / 368km Package W-A2b 23,566
Palanpur- Vododara / 260km Package W-A3 & W-B1 20,188
B. Electric, signal, telecommunication, machinery Package W-B 25,805
C. Operation and Maintenance Equipment Package W-C 2,041 D. Construction of ICD Package W-D 3,000 Eastern DFC A. Civil and track works Khurja-Kanpur / 388 km Package E-A2 21,937 Kanpur-Mugar Sarai / 322km Package E-A1 17,628
B. Electric, signal, telecommunication, machinery Package E-B 20,197
C. Operation and Maintenance Equipment Package E-C 1,495 Common items on both DFC
Procurement of Locomotives and construction of depot Package F 78,335
Note: *) Amount excludes price escalation and physical contingency.
In order to complete the earthworks within two (2) years, the deployment of one construction team at every 20km interval, which is the minimum unit for the construction section. Hence, there will be 12 to 18 construction sections working on civil and track works for each contract package. Each construction section is perceived to be managed by one prime contractor and several subcontractor positioned under the prime contractor. For the tender of the prime contractor, the prime contractor will be asked to provide information of the subcontractor that will be deployed in each section, and technical evaluation be made on the experience and capability of those subcontractor.

CHAPTER 15 COMPREHENSIVE EVALUATION OF THE PROJECT

The Feasibility Study on The Development of Dedicated Freight Corridor for Delhi-Mumbai and Ludhianai-Sonnagar in India Final Report (Task 2)
Chapter 15 15-1
CHAPTER 15 COMPREHENSIVE EVALUATION OF THE PROJECT
This chapter summarises the Study results, and presents the overall evaluation based on the aspects of technical, environmental, project implementation structure, economical and financial and project implementation plan.
(1) Evaluation of Technical Feasibility
The phased development scenario was established in Task 2 considering the technical adequacy of each section. The scope of the proposed Phase I-a Project and the technologies applicable were evaluated to be adequate.
However, the following technical elements proposed in the PETS-II were judged by JICA Study Team (JST) to be lacking in technical feasibility.
1) Double Stack Container (DSC) transport with flat-type wagons on the Western Corridor
The PETS-II proposed the application of the DSC transport with flat-type wagons on the Western Corridor. However, this transport system is not proven on any commercial lines and the JST views that the operational safety, particularly with regard to the stability against wind load, need to be verified. The JST has carried out a comparative evaluation of the transport system and concludes that the proven system of DSC transport utilising well-type wagons is feasible for application on the Western Corridor.
2) The existing ROBs in urban areas
The reconstruction of the existing ROBs in urban areas, included in Phase I-b project and Phase II project, are considered to inflict negative social impact to the residents residing of the area. The reconstruction work is envisaged to be an extreme engineering challenge. Therefore, technical feasibility of the reconstruction of the ROBs requires further examination.
(2) Evaluation of Feasibility on Social and Environmental Considerations
With regard to the Phase I-a project, the JST concludes that serious negative impacts to natural and social environment can be avoided and/or minimized, if careful design works for the track alignment, stations and bridges are conducted by the Indian side, as per the Guideline Design proposed by the JST. However, it is imperative that simultaneous efforts are made by the MOR/DFCCIL to build sufficient consensus among the residents regarding land acquisition, resettlement, and compensation through public disclosure of information and public consultation.
A large scale relocation program, reconstruction of urban ROBs and construction of a new tunnel are envisaged in Phase I-b project and Phase II project. The occurrence of serious negative impact to social environment in the planned areas is likely if the DFC project is implemented without due consideration. The JST concludes that careful and further examination of the plan should be carried out.
On the other hand, it was expected that the implementation of DFC Project will have a gradual effect in inducing road transport users to shift to railways, as well as the tremendous improvement on social and natural environment, such as reducing energy consumption, and green house gas.

The Feasibility Study on The Development of Dedicated Freight Corridor for Delhi-Mumbai and Ludhianai-Sonnagar in India Final Report (Task 2)
Chapter 15 15-2
(3) Evaluation of Feasibility on Organizational Aspect
The DFCCIL was established in November 2006, as a Public Sector Undertaking under Ministry of Railways. It will be responsible for the construction of the two corridors as also for maintenance of their infrastructure. Since the organisation has been set up recently, it is expected that the staffing at various levels will be strengthen and take full shape in due course of time. The DFCCIL will have a branch for Marketing function and Business Development. JST has confirmed through interviews with concerned personnel that DFCCIL is expected to adopt a completely different approach from that of IR in terms of tangible and intangible aspects and from the success of the DFC project which will be achieved by this approach, they expect that it will result in rationalisation and innovation of the existing Freight Transport System of IR. This innovative willingness of the Indian side will certainly contribute to the realisation of the DFC, although feasibility of the innovation in organizational/institutional aspects cannot be evaluated at the moment.
(4) Evaluation of Feasibility on Economic/Financial Aspect
Economic analysis confirmed the feasibility of the DFC project for both the Western and Eastern Corridor. The financial viability of the Eastern Corridor was proved as well. However, the financial internal rate of return (FIRR) of the Western Corridor resulting at approximately 9%, concluded that low interest loans are essential to secure the financial viability.
The economic and financial analysis of the priority section of the Phase I-a Project concluded a figure slightly lower, but a close internal rate of return, than that of the overall Project. This confirms that the implementation of the Phase I-a Project alone is capable of generating sufficient impact, and the economic impact analyses carried out by the JST in this Study proved huge impacts such as inducing increase in production, increase of gross added value, increase of tax revenue, increase of household income, and increase of employment. Even if there is delay or suspension for the implementation of projects other than Phase I-a, the implementation of Phase I-a Project is independently viable.
Thus, the Study confirmed that the DFC project would have a significant investment value to the national economy of India with direct and indirect economic impact.
(5) Evaluation of Feasibility of Project Implementation Plan
The JST proposes the commencement of works of Phase I-a Project in 2008/09 and complete its construction within 6 years period.
Yen Loan is assumed to be available for the implementation of the Project. However JST proposes that the implementation plan should include the provision for procurement of material required for civil and track works in advance using self-financing from the Government of India. JST also proposes that MOR and DFCCIL take necessary action for timely land acquisition.
The construction period of the Phase I-b project is estimated to be 8 years considering the lead time to resolve the technical issues mentioned in para (1) of this chapter. Phase II project is also assumed to take a 2-year lead time to examine and solve the technical issues of the tunnel section
The JST estimated that eight years is required to complete the overall Project, which is longer than the policy made by the Government of India. It is not a easy task to maintain the project implementation schedule. For the timely progress of the overall project depends on the

The Feasibility Study on The Development of Dedicated Freight Corridor for Delhi-Mumbai and Ludhianai-Sonnagar in India Final Report (Task 2)
Chapter 15 15-3
extraneous effort by the Government of India for land acquisition and resolving technical issues.
(6) Evaluation of Feasibility on Definition of Project Scope
The project scope of the Study defined the scope of the DFC Project as construction of railway infrastructure for DFC, reconstruction of the existing ROBs accompanied by the activity mentioned in the preceding paras, and the construction of a new ICD required for the Project which will be taken up by DFCCIL as also the procurement of electric locomotives and construction of locomotive depot which will be taken up by the IR. This definition of the project scope is considered to be appropriate when JBIC loan is being contemplated since it suffices the conditions that the Project is sustainable, the Project is characterized as highly public service oriented, and that Project provides exclusive use by DFC.
The PETS-II proposes the construction of ROBs at all level crossings along the DFC. However, the implementation of such project component cannot be justified in terms of technical feasibility, economic and social/environmental sustainability and economic viability as well as the condition for exclusive utilisation for DFC not being met. Therefore, JST proposes that the construction of the ROBs be excluded from the scope of the Project and its implementation taken up separately by MOR as a independent project.
It should be noted that land acquisition, compensation for relocation and consultancy services are included in the Project scope.
As for the branch line section between Asaoti and Tuglakabad ICD of the Western Corridor, JST concludes that this section be excluded from the project scope, since the reconstruction of existing ROB is prohibitive considering the site condition and the limited capacity expansion of TKD ICD yard and the difficulty of land acquisition. The transport of containers on this section can be managed by strengthening the transport capacity by improvement of existing lines.

CHAPTER 16 CONCLUSION AND RECOMMENDATIONS

The Feasibility Study on The Development of Dedicated Freight Corridor for Delhi-Mumbai and Ludhiana-Sonnagar in India Final Report (Task 2)
Chapter16 16-1
CHAPTER 16 CONCLUSION AND RECOMMENDATION
16.1 CONCLUSION OF THE STUDY
The DFC Project is concluded as a comprehensively high investment value project including the aspects of economic and financial evaluations.
(1) Phased Development Scenario
The implementation of Phase I-a Project is judged to be reasonable in engineering terms, and in terms of environmental aspects as well - when appropriate measures proposed in the report are executed, the impact on the environment and society can be minimised. Also, the necessity of the Project is justified by the projected demand, hence urgent implementation of the Project is strongly recommended.
With regard to Phase I-b Project, its implementation is inevitable due to the serious traffic situation. However there are sections in which technical and environmental issues need to be solved which require maximum effort by the Government of India for its resolution prior to the start of construction.
With regard to the implementation of Phase II Project, the traffic situation of the relevant sections are not serious at current, but the plan of the tunnel section would require careful investigation and examination in the technical and environmental aspect which require continuous and maximum effort by the Government India.
(2) Optimal Technical Option
After careful and detailed study of various options, the following technical options were judged as optimum for the DFC development:
- The traction system shall be electrified on both western and eastern corridor. - Container transport system for the Western Corridor shall be the Double Stack
Container (DSC) with the “Well Type”; - Container transport system for the Eastern Corridor shall be the Single Stack Container
(SSC); - Access to the TKD shall be through an improved existing railway line, not through the
DFC; - Clear standing room (CSR) at stations shall be 750m (Land acquisition shall be 1,500m
preparing for future traffic demand); and, - Construction of Road Over Bridges (ROBs) along the existing railway lines was not
included in the Project. This shall be developed by the Indian side.
(3) Environmental and Social Considerations
Out of all the Project sections, some sections were deemed to have significant impact on social environment. In addition, some dissenting opinions against the Project were raised by the local residents at the Stakeholder meetings. Thus the JICA Study Team (JST) emphasises in the conclusion and recommendation of the Study that it is crucial for DFCCIL and MOR to make maximum effort to build consensus with the local residents for the implementation of the Project. It was also judged indispensable for the smooth implementation of the Project that appropriate land price is fixed for necessary land acquisition, earlier completion of the relocation plans and prompt procedures for the land acquisition and the relocation.

The Feasibility Study on The Development of Dedicated Freight Corridor for Delhi-Mumbai and Ludhiana-Sonnagar in India Final Report (Task 2)
Chapter16 16-2
(4) Railway Management Plan
It was confirmed that an institutional set up of a totally independent management is necessary for a rapid and an independent decision making. In addition to this, introduction of modernized railway technologies and system is a must for the sound railway operation. The Dedicated Freight Corridor Project is merely a part of the whole freight transport system. Throughout the course of the Study, it was confirmed that the relevant intermodal facilities and service of the system need to be developed in order for the Project investment to be effectively utilised and for the expected various effects of the Project. It was concluded that MOR/DFCCIL need to take initiative in approaching the relevant authorities for the realisation of the total transport system development.
16.2 ACTIONS NEED TO BE TAKEN BY THE GOVERNMENT OF INDIA
The following actions need to be taken by the Government of India for the smooth implementation of the Project:
1) Immediate decision should be made by the MOR on the technical options proposed in the JICA Study Report.
2) The approval of the EIA-level report by the Government is a prerequisite to obtain funds from international lending agencies, including Yen Loan, for the implementation of the Project. Particularly, approval of the Government of India, is positively required by November 2007 on the EIA-level report for the sections to be implemented in Phase I-a by Yen Loan.
3) It is imperative that the fund raising for the Project is be arranged at favourable terms for the success of the whole Project. It is advised that the Government of India deliberate on the necessity of funds from international lending agencies such as ADB and World Bank in addition to the funds from Japan, for the implementation of the Project including the implementation of Phase I-a Project and start consultation with them.
4) Necessary funds to cover the cost for land acquisition and advanced implementation of work are arranged immediately by the Government of India.
5) The completion of the preliminary engineering design and Final Location Survey of the facilities covered in Phase I-a should be made by December 2007.
6) With regard to the existing ROBs, which are major obstacles of the Project, immediate execution of engineering survey and preliminary engineering design of the existing ROB subject to reconstruction should be made. Prior to the work, discussions with the road authorities should be commenced as soon as possible.
7) In view of dissenting opinion against the Project received in the Stakeholder Meetings, continuous effort for consensus building of the residents residing along alignment is required through public consultation meetings initiated by MOR/DFCCIL.
8) With regard to the construction of the new ICD between Rewari - Delhi, which is necessary for the Western Corridor Phase I-a Project, immediate decision making should be done considering the proposal made in the JICA Study.
9) Actions for improvement towards the intermodal transport is necessary regardless of the DFC Project. It is imperative that MOR/DFCCIL take initiative in making immediate actions in establishing the Intermodal Transport Improvement Taskforce as was proposed in the Report.