chapter 10. stratospheric ozone - cnrutls/sites/default/files/chimica_ozono.pdf · chapter 10....
TRANSCRIPT

CHAPTER 10. STRATOSPHERIC OZONE The stratospheric ozone layer, centered at about 20 km above the surface of theEarth ( Figure 10-1 ), protects life on Earth by absorbing UV radiation from theSun. In this chapter we examine the mechanisms controlling the abundance ofozone in the stratosphere and the effect of human influence.
Figure 10-1 The natural ozone layer: vertical and latitudinal distribution of the ozone number
density (1012 molecules cm-3) at the equinox, based on measurements taken in the 1960s. FromWayne, R.P., Chemistry of Atmospheres, Oxford, 1991.
10.1 CHAPMAN MECHANISM The presence of a high-altitude ozone layer in the atmosphere was firstdetermined in the 1920s from observations of the solar UV spectrum. A theory forthe origin of this ozone layer was proposed in 1930 by a British scientist, SydneyChapman, and is known as the Chapman mechanism. It lays the foundation forcurrent understanding of stratospheric ozone.
10.1.1 The mechanism
Chapman proposed that the ozone layer originates from the photolysis ofatmospheric O2. The bond energy of the O2 molecule (498 kJ mol-1) correspondsto the energy of a 240 nm UV photon; only photons of wavelengths less than 240nm can photolyze the O2 molecule. Such high-energy photons are present in thesolar spectrum at high altitude ( Figure 10-2 ). Photolysis of O2 yields two Oatoms:
(R1)
where the O atoms are in the ground-level triplet state O(3P) ( section 9.4 ) and arehighly reactive due to their two unpaired electrons. They combine rapidly with O2
CHAPTER 10. STRATOSPHERIC OZONE http://acmg.seas.harvard.edu/people/faculty/djj/book/bookch...
1 di 23 19/10/09 10:35

to form ozone:
(R2)
where M is a third body ( section 9.1.2 ).
Figure 10-2 Solar actinic flux at different altitudes, for typical atmospheric conditions and a 30osolar zenith angle. From DeMore, W.B., et al., Chemical Kinetics and Photochemical Data for Use in
Stratospheric Modeling, JPL Publication 97-4, Jet Propulsion Lab, Pasadena, CA, 1997. The O3 molecules produced in reaction (R2) go on to photolyze. Because the bondsin the O3 molecule are weaker than those in the O2 molecule, photolysis isachieved with lower-energy photons:
(R3)
where O(1D) is the O atom in an excited singlet state ( section 9.4 ) and is rapidlystabilized to O(3P) by collision with N2 or O2. Note that See is not a terminal sinkfor O3 since the O atom product may recombine with O2 by See to regenerate O3.For O3 to actually be lost the O atom must undergo another reaction, which in theChapman mechanism is
CHAPTER 10. STRATOSPHERIC OZONE http://acmg.seas.harvard.edu/people/faculty/djj/book/bookch...
2 di 23 19/10/09 10:35

(R4)
10.1.2 Steady-state solution
A schematic for the Chapman mechanism is shown in Figure 10-3 . Rate constantsfor reactions (R1) - (R4) have been measured in the laboratory. Reactions (R2) and(R3) are found to be much faster than reactions (R1) and (R4) , as might beexpected from our discussion above. We thus have a rapid cycle between O andO3 by reactions (R2) and (R3) , and a slower cycle between O2 and (O+O3) by (R1)and (R4) . Because of the rapid cycling between O and O3 it is convenient to referto the sum of the two as a chemical family, odd oxygen (Ox O3 + O), which isproduced by (R1) and consumed by (R4) .
Figure 10-3 The Chapman mechanism Simple relationships between O2, O, and O3 concentrations can be derived from achemical steady-state analysis of the Chapman mechanism. As we saw in section3.1.2 , chemical steady state can be assumed for a species if its production and lossrates remain roughly constant over its lifetime. We first examine if chemical steadystate is applicable to the shortest-lived species in Figure 10-3 , the O atom. Thelifetime tO of the O atom against conversion to O3 by (R2) is
(10.1) where we have used the low-pressure limit in the rate expression for (R2) , as isappropriate for atmospheric conditions. In equation (10.1) , [M] is the air numberdensity na, and [O2] = CO2na where CO2 = 0.21 mol/mol is the mixing ratio ofO2. Thus:
(10.2) All terms on the right-hand side of (10.2) are known. Substituting numericalvalues one finds that tO in the stratosphere is of the order of seconds or less ( SeeThe Chapman mechanism and steady state ). Production and loss rates of the Oatom depend on the meteorological environment (pressure, temperature,radiation) and on the O3 abundance, neither of which vary significantly over atime scale of seconds. We can therefore assume chemical steady state for O atomsbetween production by (R3) and loss by (R2) , neglecting reactions (R1) and (R4)
CHAPTER 10. STRATOSPHERIC OZONE http://acmg.seas.harvard.edu/people/faculty/djj/book/bookch...
3 di 23 19/10/09 10:35

which are much slower:
(10.3) Rearrangement of (10.3) yields
(10.4) Substituting numerical values one finds [O]/[O3] << 1 throughout thestratosphere ( See The Chapman mechanism and steady state ). Observedconcentrations ( Figure 10-4 ) obey closely this steady state.
Figure 10-4 Simultaneous measurements of O and O3 concentrations in the stratosphere overTexas in December 1977. Adapted from R.P. Wayne, op. cit.
An important result of our steady-state analysis for the O atom is that O3 is themain component of the Ox family: [Ox] = [O3} + [O] ª [O3]. This result has twoimplications:
The concentration of O3 is controlled by the slow production and loss of Oxfrom reactions (R1) and (R4) rather than by the fast production and lossof O3 from reactions (R2) and (R3) ;
The effective lifetime of O3 against chemical loss is defined by the lifetime ofOx.
The lifetime of Ox is given by:
(10.5) where we have included a factor of 2 in the denominator because (R4) consumestwo Ox (one O3 and one O). The factor of 2 can be derived formally from a massbalance equation for Ox as the sum of the mass balance equations for O3 and O:
CHAPTER 10. STRATOSPHERIC OZONE http://acmg.seas.harvard.edu/people/faculty/djj/book/bookch...
4 di 23 19/10/09 10:35

(10.6) Values of tOx computed from (10.5) range from less than a day in the upperstratosphere to several years in the lower stratosphere, reflecting the abundance ofO atoms ( Figure 10-4 , See The Chapman mechanism and steady state ). In theupper stratosphere at least, the lifetime of Ox is sufficiently short that chemicalsteady state can be assumed to hold. This steady state is defined by
(10.7) Substituting (10.4) into (10.7) yields as solution for [O3]:
(10.8) The simplicity of equation (10.8) is deceiving. Calculating [O3] from this equationis actually not straightforward because the photolysis rate constants k1(z) andk3(z) at altitude z depend on the local actinic flux Il(z), which is attenuated due toabsorption of radiation by the O2 and O3 columns overhead. From (9.13) , thegeneral expression for a photolysis rate constant is
(10.9) The actinic flux Il(z) at altitude z is attenuated relative to its value Il,· at the top ofthe atmosphere by
(10.10) where q is the solar zenith angle, that is the angle between the Sun and the vertical( section 7.6 ), and d is the optical depth of the atmosphere above z computed from(7.30) :
(10.11) Values of Il at UV wavelengths decrease rapidly with decreasing altitude in thestratosphere because of efficient absorption by O2 and O3 ( Figure 10-2 ), and k1and k3 decrease correspondingly ( Figure 10-5 ).
CHAPTER 10. STRATOSPHERIC OZONE http://acmg.seas.harvard.edu/people/faculty/djj/book/bookch...
5 di 23 19/10/09 10:35
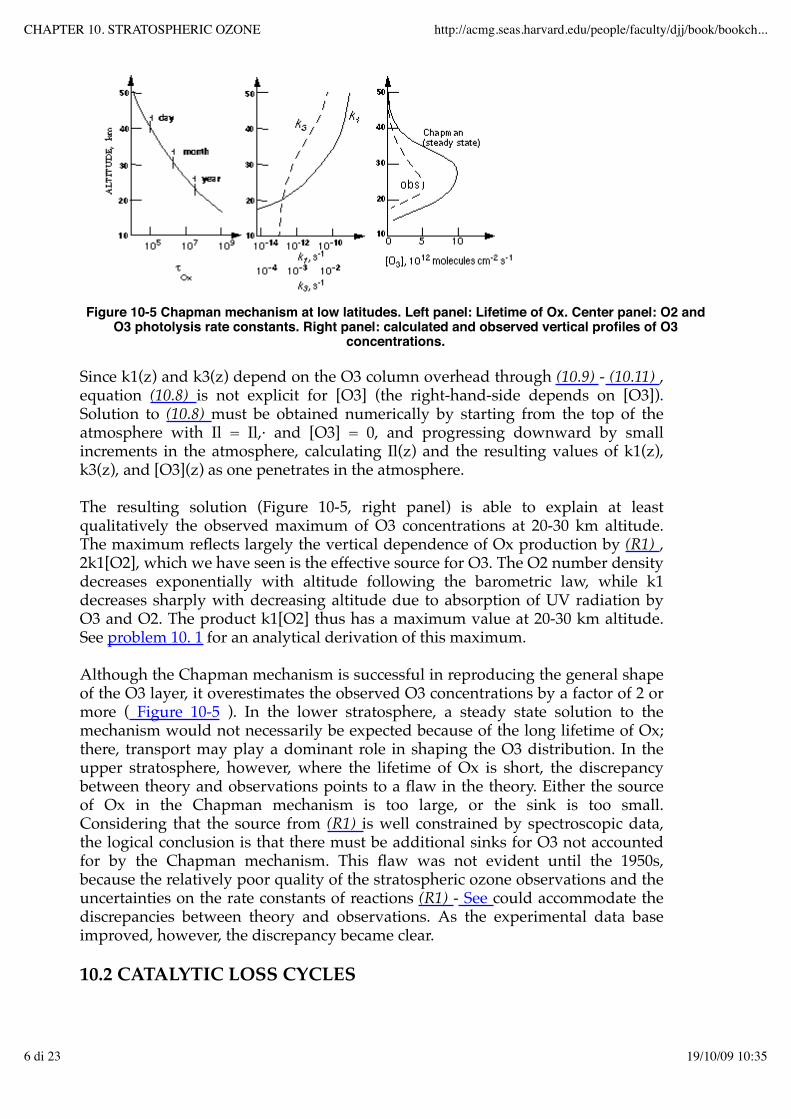
Figure 10-5 Chapman mechanism at low latitudes. Left panel: Lifetime of Ox. Center panel: O2 andO3 photolysis rate constants. Right panel: calculated and observed vertical profiles of O3
concentrations. Since k1(z) and k3(z) depend on the O3 column overhead through (10.9) - (10.11) ,equation (10.8) is not explicit for [O3] (the right-hand-side depends on [O3]).Solution to (10.8) must be obtained numerically by starting from the top of theatmosphere with Il = Il,· and [O3] = 0, and progressing downward by smallincrements in the atmosphere, calculating Il(z) and the resulting values of k1(z),k3(z), and [O3](z) as one penetrates in the atmosphere. The resulting solution (Figure 10-5, right panel) is able to explain at leastqualitatively the observed maximum of O3 concentrations at 20-30 km altitude.The maximum reflects largely the vertical dependence of Ox production by (R1) ,2k1[O2], which we have seen is the effective source for O3. The O2 number densitydecreases exponentially with altitude following the barometric law, while k1decreases sharply with decreasing altitude due to absorption of UV radiation byO3 and O2. The product k1[O2] thus has a maximum value at 20-30 km altitude.See problem 10. 1 for an analytical derivation of this maximum. Although the Chapman mechanism is successful in reproducing the general shapeof the O3 layer, it overestimates the observed O3 concentrations by a factor of 2 ormore ( Figure 10-5 ). In the lower stratosphere, a steady state solution to themechanism would not necessarily be expected because of the long lifetime of Ox;there, transport may play a dominant role in shaping the O3 distribution. In theupper stratosphere, however, where the lifetime of Ox is short, the discrepancybetween theory and observations points to a flaw in the theory. Either the sourceof Ox in the Chapman mechanism is too large, or the sink is too small.Considering that the source from (R1) is well constrained by spectroscopic data,the logical conclusion is that there must be additional sinks for O3 not accountedfor by the Chapman mechanism. This flaw was not evident until the 1950s,because the relatively poor quality of the stratospheric ozone observations and theuncertainties on the rate constants of reactions (R1) - See could accommodate thediscrepancies between theory and observations. As the experimental data baseimproved, however, the discrepancy became clear. 10.2 CATALYTIC LOSS CYCLES
CHAPTER 10. STRATOSPHERIC OZONE http://acmg.seas.harvard.edu/people/faculty/djj/book/bookch...
6 di 23 19/10/09 10:35

10.2.1 Hydrogen oxide radicals (HOx)
In the late 1950s it was discovered that catalytic cycles initiated by oxidation ofwater vapor could represent a significant sink for O3 in the stratosphere. Watervapor is supplied to the stratosphere by transport from the troposphere, and isalso produced within the stratosphere by oxidation of CH4. Water vapor mixingratios in the stratosphere are relatively uniform, in the range 3-5 ppmv. In thestratosphere, water vapor is oxidized by O(1D) produced from (R3) :
(R5)
The high-energy O(1D) atoms are necessary to overcome the stability of the H2Omolecule. The hydroxyl radical OH produced by See can react with O3, producing thehydroperoxy radical HO2 which in turn reacts with O3:
(R6)
(R7)
We refer to the ensemble of OH and HO2 as the HOx chemical family. Thesequence of reactions (R6) and (R7) consumes O3 while conserving HOx.Therefore HOx acts as a catalyst for O3 loss; production of one HOx molecule by(R5) can result in the loss of a large number of O3 molecules by cycling of HOxthrough (R6) and (R7) . Termination of the catalytic cycle requires loss of HOx by areaction such as
(R8)
The sequence (R5) - (R8) is a chain reaction for O3 loss in which (R5) is theinitiation step, (R6) - (R7) are the propagation steps, and (R8) is the terminationstep. There are several variants to the HOx-catalyzed mechanism, involvingreactions other than See - See ; see problem 10. 4 . From knowledge of stratosphericwater vapor concentrations and rate constants for (R5) - (R8) , and assumingchemical steady state for the HOx radicals (a safe assumption in view of theirshort lifetimes), one can calculate the O3 loss rate. Such calculations conducted inthe 1950s and 1960s found that HOx catalysis was a significant O3 sink but notsufficient to reconcile the chemical budget of O3. Nevertheless, the discovery ofHOx catalysis introduced the important new idea that species present at tracelevels in the stratosphere could trigger chain reactions destroying O3. This conceptwas to find its crowning application in subsequent work, as described below.
CHAPTER 10. STRATOSPHERIC OZONE http://acmg.seas.harvard.edu/people/faculty/djj/book/bookch...
7 di 23 19/10/09 10:35

Another key advance was the identification of (R5) as a source for the OH radical,a strong oxidant. As we will see in chapter 11, oxidation by OH provides theprincipal sink for a large number of species emitted in the atmosphere. Finally,recent work has shown that the HOx-catalyzed mechanism represents in fact thedominant sink of O3 in the lowest part of the stratosphere ( section 10.4 ).
10.2.2 Nitrogen oxide radicals (NOx)
The next breakthrough in our understanding of stratospheric O3 came about in thelate 1960s when the United States and other countries considered the launch of asupersonic aircraft fleet flying in the stratosphere. Atmospheric chemists werecalled upon to assess the effects of such a fleet on the O3 layer. An importantcomponent of aircraft exhaust is nitric oxide (NO) formed by oxidation ofatmospheric N2 at the high temperatures of the aircraft engine. In the stratosphereNO reacts rapidly with O3 to produce NO2, which then photolyzes:
(R9)
(R10)1.
This cycling between NO and NO2 takes place on a time scale of about one minuteduring daytime. It has no net effect on O3 and is called a null cycle. It causes,however, rapid exchange between NO and NO2. We refer to the ensemble of NOand NO2 as a new chemical family, NOx. Further investigation of NOx chemistry in the stratosphere showed that a fractionof the NO2 molecules produced by (R9) reacts with oxygen atoms produced by(R3) :
(R11)
The sequence of reactions (R9) and (R11) represents a catalytic cycle for O3 losswith a net effect identical to (R4) :
1.
1.
Each cycle consumes two Ox molecules, which is equivalent to two O3 molecules
CHAPTER 10. STRATOSPHERIC OZONE http://acmg.seas.harvard.edu/people/faculty/djj/book/bookch...
8 di 23 19/10/09 10:35

(see section 10.1.2 ). The rate-limiting step in the cycle is (R11) because NO2 hasthe option of either photolyzing (null cycle) or reacting with O (O3 loss cycle). TheO3 loss rate is therefore given by
(10.12) Termination of the catalytic cycle involves loss of NOx radicals. In the daytime,NOx is oxidized to HNO3 by the strong radical oxidant OH ( section 10.2.1 ):
(R12)
At night OH is absent, because there is no O(1D) to oxidize H2O by (R5) . Loss ofNOx at night takes place through the oxidation of NO2 by O3 and subsequentconversion of the NO3 radical to N2O5:
(R13)
(R14)
This formation of N2O5 can take place only at night, because during daytime NO3is photolyzed back to NO2 on a time scale of a few seconds:
(R15)
The products of NOx oxidation, HNO3 and N2O5, are non-radical species andhave therefore relatively long lifetimes against chemical loss (weeks for HNO3,hours to days for N2O5). They are eventually converted back to NOx:
(R16)
(R17)1.
(R18)
and serve therefore as reservoirs for NOx. We refer to the ensemble of NOx and its
CHAPTER 10. STRATOSPHERIC OZONE http://acmg.seas.harvard.edu/people/faculty/djj/book/bookch...
9 di 23 19/10/09 10:35

reservoirs as yet another chemical family, NOy. Ultimate removal of NOy is bytransport to the troposphere where HNO3 is rapidly removed by deposition. A diagram of the ensemble of processes is shown in Figure 10-6 . The loss rate ofO3 can be calculated from knowledge of the aircraft emission rate of NO, thechemical cycling within the NOy family, and the residence time of air (andtherefore NOy) in the stratosphere. Model calculations conducted in the 1970sfound that an aircraft fleet in the stratosphere would represent a serious threat tothe O3 layer. This environmental concern, combined with economicconsiderations, led to scrapping of the supersonic aircraft plan in the United States(the Europeans still built the Concorde).
Figure 10-6 Sources and sinks of stratospheric NOx and NOy. The direct conversion of N2O5 toHNO3 takes place in aerosols and will be discussed in section 10.4 .
The identification of a NOx-catalyzed mechanism for O3 loss turned out to be acritical lead towards identifying the missing O3 sink in the Chapman mechanism.Beyond the source from supersonic aircraft, could there be a natural source of NOxto the stratosphere? Further work in the early 1970s showed that N2O, a low-yieldproduct of nitrification and denitrification processes in the biosphere ( section 6.3 ),provides such a source. N2O is a very stable molecule which has no significantsinks in the troposphere. It is therefore transported to the stratosphere where itencounters high concentrations of O(1D), allowing oxidation to NO by
(R19)
Reaction (R19) actually accounts for only about 5% of loss of N2O in thestratosphere; the remaining 95% are converted to N2 by photolysis and oxidationby O(1D) via an alternate branch. The conversion to N2 is however of no interestfor driving stratospheric chemistry. On the basis of Figure 10-6 , we see that the loss rate of O3 by the NOx-catalyzedmechanism can be calculated from knowledge of the production and loss rates ofNOy, and of the chemical cycling within the NOy family. We examine now ourability to quantify each of these terms:
Production rate of NOy. In the natural stratosphere, NOy is produced as NOfrom oxidation of N2O by O(1D). The concentration of N2O in the
CHAPTER 10. STRATOSPHERIC OZONE http://acmg.seas.harvard.edu/people/faculty/djj/book/bookch...
10 di 23 19/10/09 10:35

stratosphere is readily measurable by spectroscopic methods, and theconcentration of O(1D) can be calculated from chemical steady state byreaction (R3) , so that the source of NOy is well constrained.
Loss rate of NOy. The dominant sink for NOy in the stratosphere is transportto the troposphere followed by deposition. We saw in chapter 4 that theresidence time of air (and hence of NOy) in the stratosphere is 1-2 years.Thus the loss rate of NOy is relatively well constrained, to within a factorof two.
Chemical cycling within the NOy family. The rate of O3 loss depends on thefraction of NOy present as NOx, that is, the NOx/NOy ratio. This ratiocan be calculated from the rate equations for the different components ofthe NOy family. Under most conditions, chemical steady state betweenthe different NOy components is a good approximation.
We therefore have all the elements needed to calculate the O3 loss rate from theNOx-catalyzed mechanism. When atmospheric chemists did these calculations inthe 1970s they found that they could fully account for the missing sink of O3 in theChapman mechanism! Figure 10-7 shows results from such a calculationconstrained with simultaneous observations of NOy, O3, H2O, and CH4 throughthe depth of the stratosphere. The Ox loss rates in this calculation are computed onthe basis of the gas-phase mechanisms described above, and the resulting total Oxloss (solid line) is compared to the source of Ox from photolysis of O2 (longdashes). Results show a close balance between Ox production and loss, with NOxcatalysis providing the dominant sink in most of the stratosphere. The budget ofstratospheric O3 finally appeared to be closed. Paul Crutzen received the 1995Nobel Prize in Chemistry for this work.
Figure 10-7 24-hour average rates of Ox production and loss computed with a gas-phase chemistrymodel constrained with simultaneous observations of O3, H2O, CH4, NOy, and Cly from the space
shuttle. We will see in section 10.4 that consideration of aerosol chemistry modifies greatly themodel results in the lower stratosphere. From McElroy, M.B., and R.J. Salawitch, Science 243,
763-770, 1989. Ice core data show that atmospheric concentrations of N2O have risen from 285
CHAPTER 10. STRATOSPHERIC OZONE http://acmg.seas.harvard.edu/people/faculty/djj/book/bookch...
11 di 23 19/10/09 10:35

ppbv in the 18th century to 310 ppbv today, and present-day atmosphericobservations indicate a growth rate of 0.3 % yr-1 ( Figure 7-1 ). There is muchinterest in understanding this rise because of the importance of N2O not only as asink for stratospheric O3 but also as a greenhouse gas (chapter 7). Table 10.1 givescurrent estimates of the sources and sinks of atmospheric N2O. Although theestimates can provide a balanced budget within their ranges of uncertainty(atmospheric increase ª sources - sinks), the uncertainties are in fact large. Biogenicsources in the tropical continents, cultivated areas, and the oceans provide thedominant sources of N2O. The increase of N2O over the past century is thought tobe due principally to increasing use of fertilizer for agriculture.
1. Present-day global budget of N2O
Rate, Tg N yr-1
best estimateand range of uncertainty
SOURCES, natural 9 (6-12)Oceans 3 (1-5)Tropical soils 4 (3-6)Temperate soils 2 (0.6-4)SOURCES, anthropogenic 6 (4-8)Cultivated soils 4 (2-5)Biomass burning 0.5 (0.2-1.0)Chemical industry 1.3 (0.7-1.8)Livestock 0.4 (0.2-0.5)SINK Stratosphere 12 (9-16)ATMOSPHERIC INCREASE 4
10.2.3 Chlorine radicals (ClOx)
In 1974, Mario Molina and Sherwood Rowland pointed out the potential for O3loss associated with rising atmospheric concentrations of chlorofluorocarbons(CFCs). CFCs are not found in nature; they were first manufactured for industrialpurposes in the 1930s and their use increased rapidly in the following decades.During the 1970s and 1980s, atmospheric concentrations of CFCs rose by 2-4% yr-1( Figure 7-1 ). CFC molecules are inert in the troposphere; they are thereforetransported to the stratosphere, where they photolyze to release Cl atoms. Forexample, in the case of CF2Cl2 (known by the trade name CFC-12):
(R20)
CHAPTER 10. STRATOSPHERIC OZONE http://acmg.seas.harvard.edu/people/faculty/djj/book/bookch...
12 di 23 19/10/09 10:35
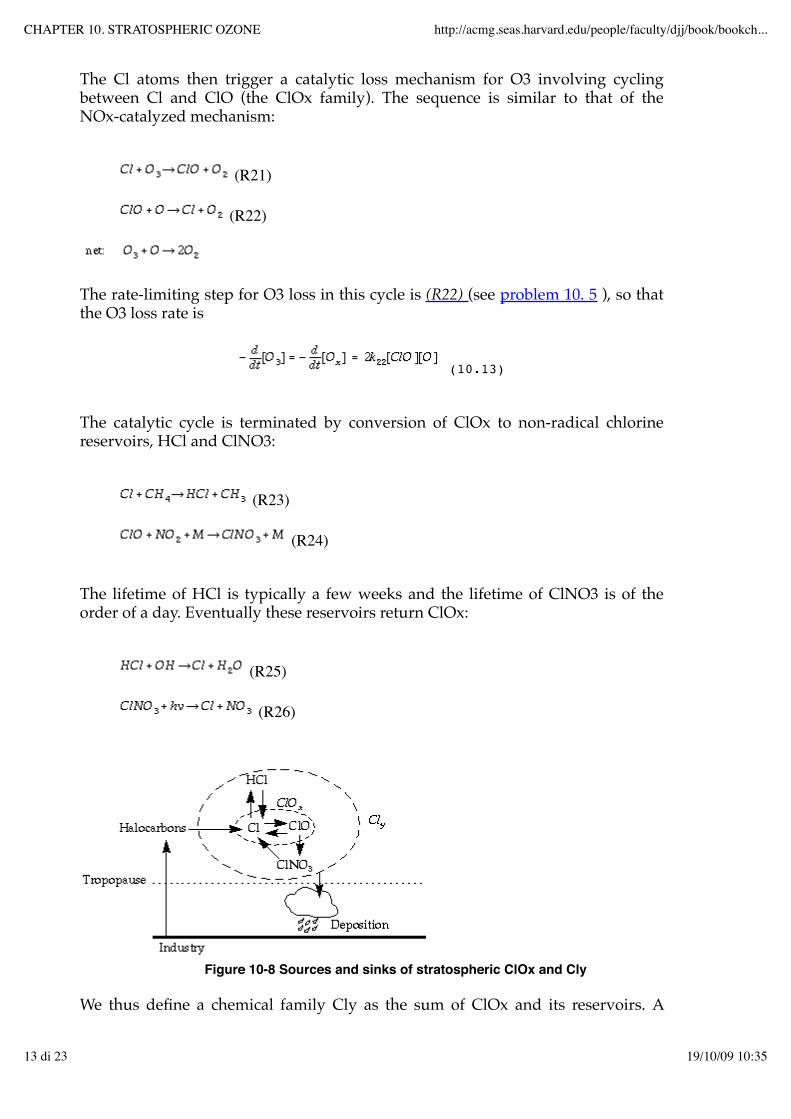
The Cl atoms then trigger a catalytic loss mechanism for O3 involving cyclingbetween Cl and ClO (the ClOx family). The sequence is similar to that of theNOx-catalyzed mechanism:
(R21)
(R22)
The rate-limiting step for O3 loss in this cycle is (R22) (see problem 10. 5 ), so thatthe O3 loss rate is
(10.13) The catalytic cycle is terminated by conversion of ClOx to non-radical chlorinereservoirs, HCl and ClNO3:
(R23)
(R24)
The lifetime of HCl is typically a few weeks and the lifetime of ClNO3 is of theorder of a day. Eventually these reservoirs return ClOx:
(R25)
(R26)
Figure 10-8 Sources and sinks of stratospheric ClOx and Cly We thus define a chemical family Cly as the sum of ClOx and its reservoirs. A
CHAPTER 10. STRATOSPHERIC OZONE http://acmg.seas.harvard.edu/people/faculty/djj/book/bookch...
13 di 23 19/10/09 10:35

diagram of the ensemble of processes is shown in Figure 10-8 . Note the similarityto Figure 10-6 . Similarly to the NOx-catalyzed mechanism, the rate of O3 loss by theClOx-catalyzed mechanism can be calculated from knowledge of theconcentrations of CFCs and other halocarbons in the stratosphere, the residencetime of air in the stratosphere, and the ClOx/Cly chemical partitioning. Molinaand Rowland warned that ClOx-catalyzed O3 loss would become a significantthreat to the O3 layer as CFC concentrations continued to increase. Their warning,backed up over the next two decades by increasing experimental evidence andcompounded by the discovery of the antarctic ozone hole, led to a series ofinternational agreements (beginning with the Montreal protocol in 1987) whicheventually resulted in a total ban on CFC production as of 1996. For this work theyshared the 1995 Nobel Prize in Chemistry with Paul Crutzen.
Figure 10-9 Historical trend in the total ozone column measured spectroscopically over Halley Bay,Antarctica in October, 1957-1992. One Dobson unit (DU) represents a 0.01 mm thick layer of ozone
under standard conditions of temperature and pressure; 1 DU = 2.69x10¹⁶ molecules cm-2s-1.From: Scientific Assessment of Ozone Depletion: 1994, World Meteorological Organization (WMO),
Geneva,1995. 10.3 POLAR OZONE LOSS In 1985, a team of scientists from the British Antarctic Survey reported thatspringtime stratospheric O3 columns over their station at Halley Bay haddecreased precipitously since the 1970s ( Figure 10-9 ). The depletion was confinedto the spring months (September-November); no depletion was observed in otherseasons. Global satellite data soon confirmed the Halley Bay observations andshowed that the depletion of stratospheric O3 extended over the totality of theantarctic vortex, a large circumpolar region including most of the southern polarlatitudes. The depletion of O3 has worsened since 1985, and springtime O3columns over Antarctica today are less than half of what they were in the 1960s (Figure 10-9 ). Measured vertical profiles show that the depletion of O3 isessentially total in the lowest region of the stratosphere between 10 and 20 km (Figure 10-10 ), which normally would contain most of the total O3 column in polarspring ( Figure 10-1 ).
CHAPTER 10. STRATOSPHERIC OZONE http://acmg.seas.harvard.edu/people/faculty/djj/book/bookch...
14 di 23 19/10/09 10:35

Figure 10-10 Vertical profiles of ozone over Antarctica measured by chemical sondes. In August theozone hole has not developed yet, while in October it is fully developed. From Harris, N.R.P., et al.,
Ozone measurements, in WMO, op. cit.. Discovery of this " antarctic ozone hole" (as it was named in the popular press)was a shock to atmospheric chemists, who thought by then that the factorscontrolling stratospheric O3 were relatively well understood. The establishedmechanisms presented in sections See CHAPMAN MECHANISM and SeeCATALYTIC LOSS CYCLES could not explain the O3 depletion observed overAntarctica. Under the low light conditions in that region, concentrations of Oatoms are very low, so that reactions (R11) and (R22) cannot operate at a significantrate. This severe failure of theory sent atmospheric chemists scrambling tounderstand what processes were missing from their understanding ofstratospheric chemistry, and whether the appearance of the antarctic O3 hole couldbe a bellwether of future catastrophic changes in stratospheric O3 levels over otherregions of the world.
10.3.1 Mechanism for ozone loss
Several aircraft missions were conducted in the late 1980s to understand the causesof the antarctic ozone depletion. These studies found the depletion of O3 to beassociated with exceptionally high ClO, a result confirmed by satellite data.Parallel laboratory experiments showed that at such high ClO concentrations, anew catalytic cycle involving self-reaction of ClO could account for most of theobserved O3 depletion:
(R27)
(R28)
(R29)1.
CHAPTER 10. STRATOSPHERIC OZONE http://acmg.seas.harvard.edu/people/faculty/djj/book/bookch...
15 di 23 19/10/09 10:35

The key behind discovery of this catalytic cycle was the laboratory observationthat photolysis of the ClO dimer (ClOOCl) takes place at the O-Cl bond ratherthan at the weaker O-O bond. It was previously expected that photolysis wouldtake place at the O-O bond, regenerating ClO and leading to a null cycle. The rateof O3 loss in the catalytic cycle is found to be limited by (R27) and is thereforequadratic in [ClO]; it does not depend on the abundance of O atoms, in contrast tothe ClOx-catalyzed mechanism described in the previous section. Another catalytic cycle found to be important in the depletion of O3 duringantarctic spring involves Br radicals produced in the stratosphere by photolysisand oxidation of anthropogenic Br-containing gases such as CH3Br (see problem 6.4 ):
1.
(R30)
(R31)
Again, this catalytic cycle is made significant by the high concentrations of ClOover Antarctica. According to current models, the ClO+ClO mechanism accountsfor about 70% of total O3 loss in the antarctic ozone hole; the remaining 30% isaccounted for by the BrO+ClO mechanism. Why are ClO concentrations over Antarctica so high? Further research in the 1990sdemonstrated the critical role of reactions taking place in stratospheric aerosols atlow temperature. Temperatures in the wintertime antarctic stratosphere aresufficiently cold to cause formation of persistent ice-like clouds called polarstratospheric clouds (PSCs) in the lower part of the stratosphere. The PSC particlesprovide surfaces for conversion of the ClOx reservoirs HCl and ClNO3 to Cl2,which then rapidly photolyzes to produce ClOx:
(R32)
(R33)
Reaction (R32) is so fast that it can be regarded as quantitative; either ClNO3 orHCl is completely titrated. Whereas in most of the stratosphere the ClOx/Clymolar ratio is less than 0.1, in the antarctic vortex it exceeds 0.5 and can approach
CHAPTER 10. STRATOSPHERIC OZONE http://acmg.seas.harvard.edu/people/faculty/djj/book/bookch...
16 di 23 19/10/09 10:35

unity. Recent research indicates that (R32) proceeds rapidly not only on PSCsurfaces but also in the aqueous H2SO4 aerosols present ubiquitously in thestratosphere ( section 8.1 ) when the temperatures fall to the values observed inantarctic winter (below 200 K). Low temperature rather than the presence of PSCsappears to be the critical factor for (R32) to take place. Nevertheless, as we will seebelow, PSCs play a critical role in the development of the O3 hole by providing amechanism for removal of HNO3 from the stratosphere.
10.3.2 PSC formation
Because the stratosphere is extremely dry, condensation of water vapor to form iceclouds requires extremely low temperatures. The stratospheric mixing ratio ofwater vapor is relatively uniform at 3-5 ppmv. In the lower stratosphere at 100 hPa(16 km altitude), this mixing ratio corresponds to a water vapor pressure of3-5x10⁻⁴ hPa. The frost point at that vapor pressure is 185-190 K; such lowtemperatures are almost never reached except in antarctic winter. Whentemperatures do fall below 190 K, PSCs are systematically observed. Observationsshow however that PSCs start to form at a higher temperature, about 197 K (Figure 10-11 ), and this higher temperature threshold for PSC formation isresponsible for the large extent of the O3 hole.
Figure 10-11 Frequency distributions of temperature (total bars) and PSC occurrence (shaded bars)in the winter lower stratosphere of each hemisphere at 65o-80o latitude. Adapted from McCormick,
M.P., et al., J. Atmos. Sci., 39, 1387, 1982. Discovery of the antarctic ozone hole spurred intense research into thethermodynamics of PSC formation. It was soon established that the stratospherecontains sufficiently high concentrations of HNO3 that solid HNO3-H2O phasesmay form at temperatures higher than the frost point of water. These solid phasesare:
HNO33H2O - Nitric acid trihydrate (NAT)HNO32H2O - Nitric acid dihydrate (NAD)HNO3H2O - Nitric acid monohydrate (NAM)
Figure 10-12 is a phase diagram for the binary HNO3-H2O system. The diagramshows the thermodynamically stable phases of the system as a function of PHNO3and PH2O. There are six different phases in the diagram: NAT, NAD, NAM, H2O
CHAPTER 10. STRATOSPHERIC OZONE http://acmg.seas.harvard.edu/people/faculty/djj/book/bookch...
17 di 23 19/10/09 10:35

ice, liquid HNO3-H2O solution, and gas. The presence of a gas phase is implicit inthe choice of PHNO3 and PH2O as coordinates. From the phase rule, the numbern of independent variables defining the thermodynamically stable phases(s) of thesystem is
(10.14) where c is the number of components of the system (here two: HNO3 and H2O),and p is the number of phases present at equilibrium. Equilibrium of a PSC phasewith the gas phase (p = 2) is defined by two independent variables (n = 2). If weare given the HNO3 and H2O vapor pressures (representing two independentvariables), then we can define unambiguously the composition of thethermodynamically stable PSC and the temperature at which it forms. That is theinformation given in Figure 10-12 .
Figure 10-12 Phase diagram for the HNO3-H2O system. The shaded area identifies typical ranges of
PHNO3 and PH2O in the lower stratosphere. The shaded region in Figure 10-12 indicates the typical ranges of PHNO3 andPH2O in the lower stratosphere. We see that condensation of NAT is possible attemperatures as high as 197 K, consistent with the PSC observations. It appearsfrom Figure 10-12 that NAT represents the principal form of PSCs; pure water icePSCs can also form under particularly cold conditions ( problem 10. 10 ). Recentinvestigations show that additional PSC phases form in the ternaryHNO3-H2SO4-H2O system.
CHAPTER 10. STRATOSPHERIC OZONE http://acmg.seas.harvard.edu/people/faculty/djj/book/bookch...
18 di 23 19/10/09 10:35

10.3.3 Chronology of the ozone hole
Figure 10-13 Chronology of the antarctic ozone hole The chronology of the antarctic ozone hole is illustrated in Figure 10-13 . It beginswith the formation of the antarctic vortex in austral fall (May). As we saw inchapter 4, there is a strong westerly circulation at southern midlatitudes resultingfrom the contrast in heating between the tropics and polar regions. Because of thelack of topography or land-ocean contrast to disturb the westerly flow at southernmidlatitudes, little meridional transport takes place and the antarctic atmosphereis effectively isolated from lower latitudes. This isolation is most pronouncedduring winter, when the latitudinal heating gradient is strongest. The isolatedantarctic air mass in winter is called the antarctic vortex because of the strongcircumpolar circulation. By June, temperatures in the antarctic vortex have dropped to values sufficientlylow for PSC formation. Reaction (R32) then converts HCl and ClNO3 to Cl2, whichphotolyzes to yield Cl atoms. In the winter, however, loss of O3 is limited by thelack of solar radiation to photolyze the ClOOCl dimer produced in (R27) .Significant depletion of O3 begins only in September when sufficient light isavailable for ClOOCl photolysis to take place rapidly.By September, however, temperatures have risen sufficiently that all PSCs haveevaporated. One would then expect HNO3 in the vortex to scavenge ClOx by
1.
CHAPTER 10. STRATOSPHERIC OZONE http://acmg.seas.harvard.edu/people/faculty/djj/book/bookch...
19 di 23 19/10/09 10:35

followed by
1.
suppressing O3 loss. This removal of ClOx is found to be inefficient, however,because observed HNO3 concentrations in the springtime antarctic vortex areexceedingly low ( Figure 10-13 ). Depletion of HNO3 from the antarcticstratosphere is caused by sedimentation of HNO3-containing PSC particles overthe course of the winter; it is still not understood how the PSC particles grow tosufficiently large sizes to undergo sedimentation. Better understanding of thissedimentation process is critical for assessing the temporal extent of the antarcticozone hole, and also for predicting the possibility of similar O3 depletion takingplace in the arctic. There is indeed much concern at present over the possibility of an O3 holedeveloping in the arctic. Temperatures in arctic winter occasionally fall to valuessufficiently low for PSCs to form and for HCl and ClNO3 to be converted to ClOx( Figure 10-11 ), but these conditions are generally not persistent enough to allowremoval of HNO3 by PSC sedimentation. As a result, O3 depletion in arctic springis suppressed by (R16) + (R24) . If extensive PSC sedimentation were to take placein arctic winter, one would expect the subsequent development of a springtimearctic O3 hole. Observations indicate that the arctic stratosphere has cooled inrecent years, and a strong correlation is found between this cooling and increasedO3 depletion. One proposed explanation for the cooling is increase in theconcentrations of greenhouse gases. Greenhouse gases in the stratosphere have anet cooling effect (in contrast to the troposphere) because they radiate away theheat generated from the absorption of UV by O3. Continued cooling of the arcticstratosphere over the next decades could possibly cause the development of an"arctic ozone hole" even as chlorine levels decrease due to the ban on CFCs. Thissituation is being closely watched by atmospheric chemists. 10.4 AEROSOL CHEMISTRY Another major challenge to our understanding of stratospheric chemistry emergedin the early 1990s when long-term observations of O3 columns from satellites andground stations revealed large declines in O3 extending outside the polar regions.The observations ( Figure 10-14 ) indicate a ~6% decrease from 1979 to 1995 in theglobal mean stratospheric O3 column at 60oS-60oN, with most of the decreasetaking place at midlatitudes.
CHAPTER 10. STRATOSPHERIC OZONE http://acmg.seas.harvard.edu/people/faculty/djj/book/bookch...
20 di 23 19/10/09 10:35

Figure 10-14 Trend in the global ozone column at 60oS-60oN for the 1979-1995 period. From WMO,op. cit.
This large decline of O3 was again a surprise. It was not forecast by the standardgas-phase chemistry models based on the mechanisms in section 10.2 , whichpredicted only a ~0.1% yr-1 decrease in the O3 column for the 1979-1995 period.The models also predicted that most of the O3 loss would take place in the upperpart of the stratosphere, where CFCs photolyze, but observations show that mostof the decrease in the O3 column actually has taken place in the lowermoststratosphere below 20-km altitude ( Figure 10-15 ). This severe failure of themodels cannot be explained by the polar chemistry discussed in section 10.3because temperatures at midlatitudes are too high. Dilution of the antarctic ozonehole when the polar vortex breaks up in summer is not a viable explanation eitherbecause it would induce a seasonality and hemispheric asymmetry in the trendthat is not seen in the observations.
Figure 10-15 Vertical distribution of the O3 trend at northern midlatitudes for the period 1980-1996:best estimate (solid line) and uncertainties (dashed lines). Adapted from Scientific Assessment of
Ozone Depletion: 1998, WMO. Geneva ,1999.Recent research indicates that aerosol chemistry in the lower stratosphere couldprovide at least a partial explanation for the observed long-term trends of O3 atmidlatitudes. Laboratory experiments have shown that the aqueous H2SO4
CHAPTER 10. STRATOSPHERIC OZONE http://acmg.seas.harvard.edu/people/faculty/djj/book/bookch...
21 di 23 19/10/09 10:35

aerosol ubiquitously present in the lower stratosphere ( section 8.1 ) provides amedium for the rapid hydrolysis of N2O5 to HNO3:
(R34)
From the standpoint of the NOx-catalyzed O3 loss mechanism discussed in section10.2.2 , (R34) simply converts NOy from one inactive reservoir form to the other.However, HNO3 is a longer-lived reservoir than N2O5, so that conversion ofN2O5 to HNO3 slows down the regeneration of NOx and hence decreases theNOx/NOy ratio. Although one might expect O3 loss to be suppressed as a result,the actual picture is more complicated. Lower NOx concentrations slow down thedeactivation of ClOx by conversion to ClNO3 (R24) , so that ClOx-catalyzed O3loss increases. Also, a fraction of HNO3 produced by (R34) eventually photolyzesby (R16) , and the sequence (R34) + (R16) provides a source of HOx that enhancesthe HOx-catalyzed O3 loss discussed in section 10.2.1 . When all these processes are considered, one finds in model calculations that (R34)has little net effect on the overall rate of O3 loss in the lower stratosphere, becausethe slow-down of the NOx-catalyzed loss is balanced by the speed-up of the HOx-and ClOx-catalyzed losses; in this manner, the gas-phase models of the 1980s werelulled into a false sense of comfort by their ability to balance Ox production andloss ( Figure 10-7 ). The occurrence of (R34) implies a much larger sensitivity of O3to chlorine levels, which have increased rapidly over the past two decades. Figure10-16 illustrates this point with model calculations of the relative contributions ofdifferent catalytic cycles for O3 loss, considering gas-phase reactions only (leftpanel) and including (R34) (right panel). Whether or not the enhanced sensitivityto chlorine arising from (R34) can explain the observed long-term trends of O3 (Figure 10-14 ) is still unclear.
Figure 10-16 Effect of N2O5 hydrolysis in aerosols on model calculations of ozone loss in the lowerstratosphere at midlatitudes. The Figure shows the fractional contributions of individual processes
to the total loss of O3 in model calculations conducted without (left panel) and with (right panel)hydrolysis of N2O5 in aerosols. From McElroy, M.B., et al., The changing stratosphere, Planet.
Space Sci., 40, 373-401, 1992. Field observations over the past five years have provided ample evidence thatN2O5 hydrolysis in aerosols does indeed take place rapidly in the stratosphere.The observed NOx/NOy ratio in the lower stratosphere at midlatitudes is lower
CHAPTER 10. STRATOSPHERIC OZONE http://acmg.seas.harvard.edu/people/faculty/djj/book/bookch...
22 di 23 19/10/09 10:35

than expected from purely gas-phase chemistry mechanisms, and more consistentwith a mechanism including (R34) . In addition, the observed ClO/Cly ratio ishigher than expected from the gas-phase models, because of the slower ClNO3formation resulting from the lower NOx levels. Aircraft observations following theMt. Pinatubo eruption in 1991 indicated large decreases of the NOx/NOy ratioand increases of the ClO/Cly ratio, as would be expected from (R34) taking placeon the volcanic aerosols. The resulting enhancement of ClO is thought to beresponsible in part for the large decrease in the O3 column in 1992, the yearfollowing the eruption ( Figure 10-14 ). Further reading: McElroy, M.B., R.J. Salawitch, and K.R. Minschwaner, The changing stratosphere,Planet. Space Sci., 40, 373-401, 1992. Catalytic loss cycles. Warneck, P., Chemistry of the Natural Atmosphere, Academic Press, New York,1988. Historical survey, photochemistry of O2 and O3. World Meteorological Organization, Scientific assessment of ozone depletion:1998, WMO, Geneva, 1999. Polar ozone loss, ozone trends.
CHAPTER 10. STRATOSPHERIC OZONE http://acmg.seas.harvard.edu/people/faculty/djj/book/bookch...
23 di 23 19/10/09 10:35