review stratospheric ozone depletion - ps.uci.edurowlandblake/publications/fsr415.pdf · review...
TRANSCRIPT
Phil. Trans. R. Soc. B (2006) 361, 769–790
doi:10.1098/rstb.2005.1783
Published online 21 February 2006
Review
Stratospheric ozone depletion
F. Sherwood Rowland1,2,**rowlan
ReceivedAccepted
1Department of Chemistry, and 2Department of Earth System Science, University of California Irvine,Irvine, CA 92697, USA
Solar ultraviolet radiation creates an ozone layer in the atmosphere which in turn completely absorbsthe most energetic fraction of this radiation. This process both warms the air, creating the stratospherebetween 15 and 50 km altitude, and protects the biological activities at the Earth’s surface from thisdamaging radiation. In the last half-century, the chemical mechanisms operating within the ozonelayer have been shown to include very efficient catalytic chain reactions involving the chemical speciesHO, HO2, NO, NO2, Cl and ClO. The NOX and ClOX chains involve the emission at Earth’ssurface of stable molecules in very low concentration (N2O, CCl2F2, CCl3F, etc.) which wander in theatmosphere for as long as a century before absorbing ultraviolet radiation and decomposing to createNO and Cl in the middle of the stratospheric ozone layer. The growing emissions of syntheticchlorofluorocarbon molecules cause a significant diminution in the ozone content of the stratosphere,with the result that more solar ultraviolet-B radiation (290–320 nm wavelength) reaches the surface.This ozone loss occurs in the temperate zone latitudes in all seasons, and especially drasticallysince the early 1980s in the south polar springtime—the ‘Antarctic ozone hole’. The chemicalreactions causing this ozone depletion are primarily based on atomic Cl and ClO, the product of itsreaction with ozone. The further manufacture of chlorofluorocarbons has been banned by the 1992revisions of the 1987 Montreal Protocol of the United Nations. Atmospheric measurements haveconfirmed that the Protocol has been very successful in reducing further emissions of these molecules.Recovery of the stratosphere to the ozone conditions of the 1950s will occur slowly over the rest of thetwenty-first century because of the long lifetime of the precursor molecules.
Keywords: chlorofluorocarbons; ozone depletion; stratosphere; ultraviolet; Montreal Protocol;Antarctic ozone hole
1. INTRODUCTIONHomer speaks of lightning bolts after which ‘a grim reek of
sulphur bursts forth’ and the air was ‘filled with reeking
brimstone.’ (Homer 3000 BC). The odour was not
actually the smell of sulphur dioxide associated with
burning sulphur, but rather was the first recorded
detection of the presence in Earth’s atmosphere of
another strong odour, that of ozone (O3). These
molecules were formed by the passage of the lightning
through the air, created by the splitting in two of the
abundant molecular oxygen (O2) molecules, followed by
the addition of each of the free O atoms to another O2 to
form the triatomic product. In fact, most of the ozone
molecules present in the atmosphere at any time have
been made by this same two-step splitting-plus-combi-
nation process, although the initiating cause usually
begins with very energetic solar ultraviolet (UV) radiation
rather than lightning. Many thousands of years later, the
modern history of ozone began with its synthesis in the
laboratory of H. F. Schonbein in 1840 (Nolte 1999),
although the positive confirmation of its three-oxygen-
atom chemical formula came along somewhat later.
Scientific interest in high-altitude stratospheric
ozone dates to 1881 when Hartley measured the
27 January 200513 April 2005
769
spectrum of ozone in the laboratory and found that its
ability to absorb UV light extended only to 293 nm at
the long wavelength end (Hartley 1881a). He thenconnected this result with the earlier field observations
(Cornu 1879) that there was a short wavelength cut-
off in solar UV radiation at 293 nm. Hartley
concluded that this limitation on solar UV arriving atEarth’s surface was caused by the ubiquitous presence
of some absorbing substance in the atmosphere, and
the match between these two cut-offs identified ozoneas the molecule involved (Hartley 1881b). Cornu’s
field work had been carried out at three different
mountain altitudes, and his experiments showed thatthe solar cut-off was slightly less effective—a little less
ozone—at higher altitudes (293.2 nm at 2570 m;
294.8 nm at 1650 m; 295.4 nm at 660 m). From thevery small changes in cut-off wavelength with
altitude—about 20% of the total atmosphere lies
between 660 and 2570 m—Hartley further reasoned
that ozone was not distributed uniformly through theatmosphere, but rather that most of it was at altitudes
higher than 2570 m. These measurements were all
made in the lowest part of the atmosphere, thetroposphere,1 and the structure of the atmosphere at
much higher altitudes was not yet fully understood in
Hartley’s time. However, the groundwork had beenlaid for our present understanding that most of
q 2006 The Royal Society

450
400
350
300
250
Dob
son
units
Jan Feb Mar Apr May Jun Jul Aug Sep Oct Nov Dec
Leningrad (60∞N)
Arosa (47∞N)
Huancayo (12∞S)
Aspendale (38∞S)
Figure 1. Seasonal and latitudinal variations of atmosphericozone (Rowland 1991).
200 nm 300 nm
290 nm 320 nmUV-Bmid-stratosphere
ozone cutoff
earth,s surface
SOLAR RADIATION
400 nmULTRAVIOLET visible
violetO
2O
3O+O O+O
2
UV redinfrared
700 nm
Figure 2. Schematic of vertical distribution of chlorine frommethyl chloride.
770 F. S. Rowland Stratospheric ozone depletion
the atmospheric ozone lies far overhead in the
stratosphere.
Detailed knowledge of the Earth’s atmospheric
ozone distribution seasonally and geographically was
outlined beginning in the 1920s by a series of
experimenters, especially G. M. B. Dobson, who
began regular measurements with an UV spec-
trometer—an improved version of Hartley’s measure-
ment technique. Dobson realized that careful
measurements of the relative intensities of solar UV
radiation at different wavelengths could be converted
into quantitative estimates of the amount of ozone
overhead, and his initial work near Oxford established
that the amount of ozone varied from day to day and
month to month. The Dobson UV-spectrometer,
adapted into an instrument suitable for daily measure-
ments in remote locations by trained technicians,
became a standard instrument applied by many other
scientists. With such instruments operating in various
distant locations and monitored throughout the year,
the global distribution of ozone was quantified in the
next decades, as shown in figure 1 for four different
locations (Rowland 1991)2. Tropical locations, such as
Huancayo in Peru, were found to have approximately
the same amount of ozone overhead year-round.
Higher ozone concentrations were measured through-
out the year in the temperate latitudes than in the
tropics, but with a strong seasonal variation super-
imposed. The peak ozone values in the temperate zones
in both north and south occur at the end of winter—the
further north the station from Arosa to Leningrad, the
higher the maximum ozone concentration. Spitzbergen
(788 N) recorded the highest ozone concentrations of
all, again maximizing early in the spring. No measure-
ments were made in the south Polar region until the
preliminary stages in preparation for the International
Geophysical Year of 1957–1958.
Phil. Trans. R. Soc. B (2006)
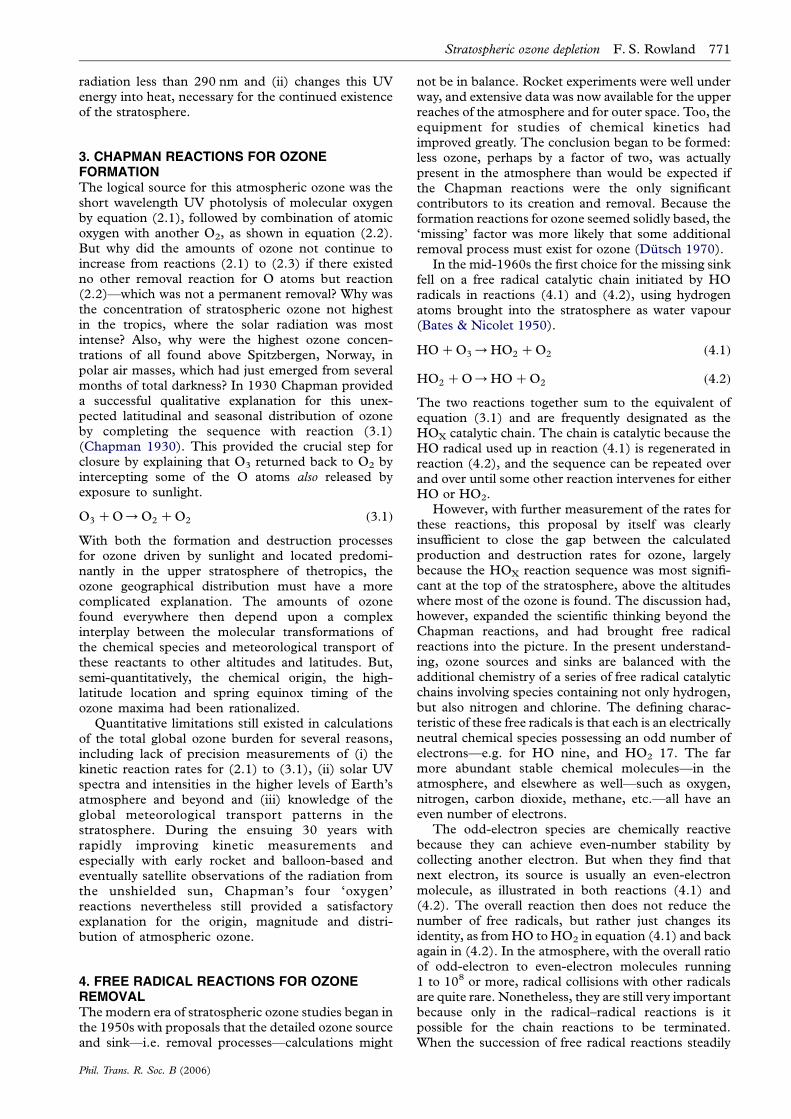
2. SOLAR SPECTRUMThe radiation from the sun has wavelengths visible tohumans from violet (400 nm) to red (700 nm), plusinvisible infrared (O700 nm) and UV (!400 nm)wavelengths. The energy of the radiation increases asthe wavelengths shorten, and the absorption of highlyenergetic UV radiation usually causes the decompo-sition of simple atmospheric molecules. In the upperatmosphere, the UV wavelengths below 242 nm can beabsorbed by O2 (figure 2), initiating the sequence ofreactions of equations (2.1)–(2.3).
O2 CUVð!242 nmÞ/OCO ð2:1Þ
OCO2 CM/O3 CM ð2:2Þ
O3 CUV or visible/OCO2 ð2:3Þ
The O3 molecules formed in (2.2) can in turn absorbvisible UV radiation, as in (2.3), with absorptionincreasing greatly in strength at shorter wavelengthsin the UV. Through these processes, plus othersdiscussed later, a balance of ozone is maintained bywhich an average of three parts in 107 of all of theatmospheric molecules are present as ozone, versus21% as O2. About 90% of these ozone molecules arepresent at altitudes between 10 and 50 km, i.e. mostlyin the stratosphere where the mixing ratio of O3, itsfraction of all atmospheric molecules, can rise as highas one part in 105. (For comparison, the regulatorycontrol mechanisms in urban surface locations typicallybecome applicable when the O3 mixing ratios exceedone part in 107.)
Because both O2 and O3 can absorb short wave-length UV radiation, no solar radiation with wave-lengths less than 290 nm (the ‘ozone cut-off ’ forinstruments more sensitive than Cornu’s) penetratesbelow the stratosphere. The solar UV energy absorbedin (2.3) is converted into heat by processes such asenergy transfer to M in (2.2), providing a thermalsource in the 30–50 km range. This influx of heatcreates the stratosphere, and is responsible for main-taining its positive temperature gradient versus alti-tude. This increase in temperature with increasingaltitude creates a very stable, stratified atmosphericregime with a very slow turnover time of several years.The ozone layer thus performs two important physicalprocesses: (i) it prevents the arrival at Earth’s surface—and its exposed biology—of short wavelength UV
Stratospheric ozone depletion F. S. Rowland 771
radiation less than 290 nm and (ii) changes this UVenergy into heat, necessary for the continued existenceof the stratosphere.
3. CHAPMAN REACTIONS FOR OZONEFORMATIONThe logical source for this atmospheric ozone was theshort wavelength UV photolysis of molecular oxygenby equation (2.1), followed by combination of atomicoxygen with another O2, as shown in equation (2.2).But why did the amounts of ozone not continue toincrease from reactions (2.1) to (2.3) if there existedno other removal reaction for O atoms but reaction(2.2)—which was not a permanent removal? Why wasthe concentration of stratospheric ozone not highestin the tropics, where the solar radiation was mostintense? Also, why were the highest ozone concen-trations of all found above Spitzbergen, Norway, inpolar air masses, which had just emerged from severalmonths of total darkness? In 1930 Chapman provideda successful qualitative explanation for this unex-pected latitudinal and seasonal distribution of ozoneby completing the sequence with reaction (3.1)(Chapman 1930). This provided the crucial step forclosure by explaining that O3 returned back to O2 byintercepting some of the O atoms also released byexposure to sunlight.
O3 CO/O2 CO2 ð3:1Þ
With both the formation and destruction processesfor ozone driven by sunlight and located predomi-nantly in the upper stratosphere of thetropics, theozone geographical distribution must have a morecomplicated explanation. The amounts of ozonefound everywhere then depend upon a complexinterplay between the molecular transformations ofthe chemical species and meteorological transport ofthese reactants to other altitudes and latitudes. But,semi-quantitatively, the chemical origin, the high-latitude location and spring equinox timing of theozone maxima had been rationalized.
Quantitative limitations still existed in calculationsof the total global ozone burden for several reasons,including lack of precision measurements of (i) thekinetic reaction rates for (2.1) to (3.1), (ii) solar UVspectra and intensities in the higher levels of Earth’satmosphere and beyond and (iii) knowledge of theglobal meteorological transport patterns in thestratosphere. During the ensuing 30 years withrapidly improving kinetic measurements andespecially with early rocket and balloon-based andeventually satellite observations of the radiation fromthe unshielded sun, Chapman’s four ‘oxygen’reactions nevertheless still provided a satisfactoryexplanation for the origin, magnitude and distri-bution of atmospheric ozone.
4. FREE RADICAL REACTIONS FOR OZONEREMOVALThe modern era of stratospheric ozone studies began inthe 1950s with proposals that the detailed ozone sourceand sink—i.e. removal processes—calculations might
Phil. Trans. R. Soc. B (2006)
not be in balance. Rocket experiments were well underway, and extensive data was now available for the upperreaches of the atmosphere and for outer space. Too, theequipment for studies of chemical kinetics hadimproved greatly. The conclusion began to be formed:less ozone, perhaps by a factor of two, was actuallypresent in the atmosphere than would be expected ifthe Chapman reactions were the only significantcontributors to its creation and removal. Because theformation reactions for ozone seemed solidly based, the‘missing’ factor was more likely that some additionalremoval process must exist for ozone (Dutsch 1970).
In the mid-1960s the first choice for the missing sinkfell on a free radical catalytic chain initiated by HOradicals in reactions (4.1) and (4.2), using hydrogenatoms brought into the stratosphere as water vapour(Bates & Nicolet 1950).
HOCO3/HO2 CO2 ð4:1Þ
HO2 CO/HOCO2 ð4:2Þ
The two reactions together sum to the equivalent ofequation (3.1) and are frequently designated as theHOX catalytic chain. The chain is catalytic because theHO radical used up in reaction (4.1) is regenerated inreaction (4.2), and the sequence can be repeated overand over until some other reaction intervenes for eitherHO or HO2.
However, with further measurement of the rates forthese reactions, this proposal by itself was clearlyinsufficient to close the gap between the calculatedproduction and destruction rates for ozone, largelybecause the HOX reaction sequence was most signifi-cant at the top of the stratosphere, above the altitudeswhere most of the ozone is found. The discussion had,however, expanded the scientific thinking beyond theChapman reactions, and had brought free radicalreactions into the picture. In the present understand-ing, ozone sources and sinks are balanced with theadditional chemistry of a series of free radical catalyticchains involving species containing not only hydrogen,but also nitrogen and chlorine. The defining charac-teristic of these free radicals is that each is an electricallyneutral chemical species possessing an odd number ofelectrons—e.g. for HO nine, and HO2 17. The farmore abundant stable chemical molecules—in theatmosphere, and elsewhere as well—such as oxygen,nitrogen, carbon dioxide, methane, etc.—all have aneven number of electrons.
The odd-electron species are chemically reactivebecause they can achieve even-number stability bycollecting another electron. But when they find thatnext electron, its source is usually an even-electronmolecule, as illustrated in both reactions (4.1) and(4.2). The overall reaction then does not reduce thenumber of free radicals, but rather just changes itsidentity, as from HO to HO2 in equation (4.1) and backagain in (4.2). In the atmosphere, with the overall ratioof odd-electron to even-electron molecules running1 to 108 or more, radical collisions with other radicalsare quite rare. Nonetheless, they are still very importantbecause only in the radical–radical reactions is itpossible for the chain reactions to be terminated.When the succession of free radical reactions steadily
772 F. S. Rowland Stratospheric ozone depletion
converts some chemicals to other forms, as withO3CO/O2CO2 from equation (4.1) and (4.2) with-out removing the HOX radicals, the catalytic chain canremove many thousands of molecules for each initialradical formed.
This HOX chain plus two other chain reactions arethe most important in the present-day atmosphere,although a number of others exist. These other two mostimportant chains involve chemical species containingnitrogen or chlorine, as in the NOX reactions (4.3) and(4.4) and the ClOX reactions of (4.5) and (4.6).
NOCO3/NO2 CO2 ð4:3Þ
NO2 CO/NOCO2 ð4:4Þ
ClCO3/ClOCO2 ð4:5Þ
ClOCO/ClCO2 ð4:6Þ
Again, the sum of each of these pairs of reactions is theequivalent of reaction (3.1). Cumulatively, the additionof free radical chain reactions (4.1) to (4.6) to theoriginal Chapman oxygen reactions can bring thecalculated global ozone quantities in the atmosphereinto agreement with the actual measured amounts.
Most descriptions of ozone production and loss aredescribed in terms of ‘odd oxygen’ (i.e. the summedconcentrations of O3 plus O) in contrast to the veryabundant ‘even’ oxygen O2. For example, the photo-chemical destruction of O3 in equation (2.3) does notresult in permanent ozone removal because, as isusually the case, the O atom immediately re-forms O3
in reaction (2.2). In this odd oxygen calculus, equations(2.2) and (2.3) have values of zero, equation (2.1) hasC2, equation (3.1) has the value K2, and equations(4.1)–(4.6) each have the value of K1. The overallremoval of ozone can thus be considered to be thesteady conversion of odd oxygen back to even oxygen.
5. RESERVOIR MOLECULES AND HUMANACTIVITIESThe inclusion of catalytic chain reactions in the ozonebalance requires description of the initial sources of thechain carriers, and the possibility for either temporaryor permanent interruption of the chains by theformation of reservoir compounds from the inter-actions of radicals from two separate chains (e.g. 2HOCM/H2O2CM; ClOCNO2CM/ClONO2CM). In both of these cases, the energy released in theformation of a chemical bond joining the two radicalsmust be carried away by collision with anothermolecule, and this third participant is generallydesignated as M because collision with almost anymolecule can accept this transfer of excess energy.Some reservoirs are only temporary, usually becausethey are readily photodecomposed by solar UVradiation. Occasionally, the reservoirs are unreactiveenough to become permanent repositories for the chaincarriers. Furthermore, the realization over the last threedecades that some of the sources for the chain carriershave been substantially augmented by human activitiesraised major concerns about the possibilities thatsignificant ozone depletion might occur in the near
Phil. Trans. R. Soc. B (2006)
future (Crutzen 1971; Johnston 1971; Molina &Rowland 1974).
The major method for introducing chain-carryingchemical species into the stratosphere is the release intothe troposphere of chemical compounds sufficientlyinert that a significant fraction of them survive to driftinto the much more intense solar UV radiation of themid-stratosphere, which can break the molecule apartinto a pair of free radicals. An important aspect of‘inertness’ is the necessity that the molecule betransparent to solar radiation with wavelengths longerthan the ozone cut-off at 290 nm—otherwise, destruc-tion would quickly occur within the daylight tropo-sphere. The greatly increased photochemicalsusceptibility of these unreactive molecules at altitudesof 30 km or higher is necessarily preceded byatmospheric mixing to altitudes above most of the O2
and O3 that absorb solar UV by equations (2.1) andespecially (2.3).
A second method for delivering chain carriers tostratospheric altitudes is direct injection. Large volca-nic eruptions can introduce other volatile moleculeswhen the explosive plume rises all of the way into thestratosphere, but experimental study of actual eventshas shown that no more than a small fraction of chainprecursors are started through this process. Mostvolcanic eruption plumes do not reach the strato-sphere, and the gaseous content of water-solublemolecules such as hydrogen chloride (HCl) is greatlyreduced by dissolution into the water droplets rainingback as the plume cools. Alternatively, direct chemicalformation of NO can be accomplished in the strato-sphere by raising the natural air mixture of N2CO2 toan extremely high temperature as occurs in the fireballof an atmospheric nuclear weapons test (Bauer 1979;Chang et al. 1979), or through the engine of a high-flying aircraft such as the Anglo-French Concorde(NAS 1975).
At the beginning of the twentieth century, sourceshad already existed in the natural atmosphere for aeonsthat serve as precursors for the delivery of HO, NO andCl into the stratosphere, although most of theunreactive precursors had not yet been identified asatmospheric components, and none of the chainprocesses had been discovered until the latter half ofthe century. Entrance to the stratosphere is essentiallylimited meteorologically to large air masses that rise indeep convection in the tropics and pass through thecold trap (usually about K78 8C) of the tropicaltropopause, the temperature minimum separating thestratosphere from the troposphere below. Water vapourhas always been one of the primary moleculesdelivering hydrogen into the stratosphere, wheretransformation to HO occurs. At the tropopause, thewater content of the air passing upward is limited toabout 3 p.p.m.3—that is, very dry in comparison withamounts up to 3 parts per hundred near the surface inthe tropics. These rising air masses also transport manyother trace gaseous molecules without regard to theirmolecular weights—the gravitational separation ofatmospheric components by molecular diffusion isoverwhelmed by small-scale turbulence and largeconvective motions to altitudes of 100 km or more,far above the 50 km top of the stratosphere.
50
40
30
20
10
0 0.2 0.4 0.6al
titud
e (k
m)
mixing ratio (PPBV)
HCl
HOCl
tropopause
ClO
Cl
ClONO2
CH3Cl
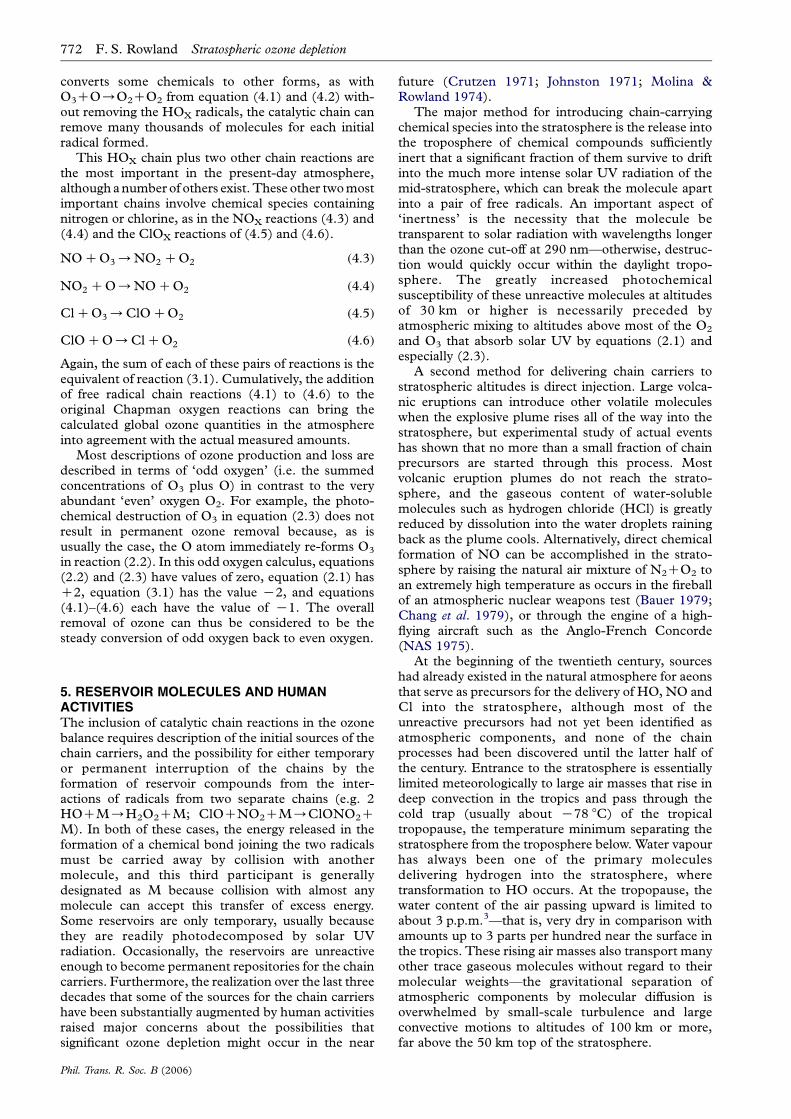
Figure 3. Schematic of vertical distribution of chlorine frommethyl chloride.
Stratospheric ozone depletion F. S. Rowland 773
These tropical storms will also carry upward tracegases in the troposphere with low enough boiling pointsthat they too are able to pass through the cold trap atthe tropopause. These include hydrogen delivery whilechemically bound in methane (CH4) or molecularhydrogen (H2), nitrogen atoms (for the NO radical) innitrous oxide (N2O), and chlorine atoms in methylchloride (CH3Cl). The definite detections in theremote atmosphere of methane at about 1 p.p.m.(Migeotte 1949) and nitrous oxide at 0.3 p.p.m.(Adel 1949) were not established until 1948 and1937, respectively. Methyl chloride at about 0.6 p.p.b.was not even recognized as a regular atmosphericcomponent until concerns had already been expressedabout chlorine in the gaseous chlorofluorocarbon(CFC) compounds (Rowland & Molina 1975). Thepossibility that the atmospheric concentrations ofseveral of these precursor molecules might be increas-ing because of the activities of mankind was notrecognized until the 1970s.
Both methane and methyl chloride have sinks in thelower atmosphere through reaction with HO radical, asin equations (5.1) and (5.2). Most of these moleculesare destroyed in the lower atmosphere with lifetimes ofabout 8 years for methane, and 1.3 years for methylchloride (WMO 2003).
HOCCH4/H2OCCH3 ð5:1Þ
HOCCH3Cl/H2OCCH2Cl ð5:2Þ
Nevertheless, their abundance is large enough andtropospheric mixing occurs on a time scale of monthsso that appreciable concentrations exist in the uppertroposphere in tropical latitudes, and are swept into thestratosphere. Both chemical compounds are stillsubject to HO attack in the stratosphere and eventuallyrelease Cl atoms and additional HO there.
The measured tropospheric concentrations ofCH3Cl are now approximately 550 p.p.t., with a smallseasonal effect with lower concentrations in thesummer for both the Northern and Southern Hemi-spheres (WMO 2003). The currently available datasuggest that the stratospheric mixing ratio of Clsummed over all chemical species present a centuryago—before large-scale industrial synthesis of volatilechlorinated compounds—was not much larger thanthat furnished by CH3Cl alone (i.e. !600 p.p.t.).Measurement of the amounts of methyl chloride inglacial ice cores does indicate that its atmosphericconcentration in the nineteenth century was probablyslightly less than now, perhaps 450–500 p.p.t. (WMO2003). One important source of CH3Cl is the burningof forests or agricultural waste (‘biomass burning’); theformer was always part of our natural surroundingseven in prehistoric times, while the latter has probablygrown in intensity in the past two centuries.
Because gaseous mixing in the stratosphere is notaffected by changes in chemical form, the mixing ratio(or mole fraction in chemical terminology), of all formsof chlorine resulting from CH3Cl and its decompo-sition products will be essentially constant throughoutthe atmosphere from the surface to 50 km and above,as shown schematically in figure 3. Although thechemical form of the Cl is initially CH3Cl in the
Phil. Trans. R. Soc. B (2006)
troposphere, smaller and smaller fractions surviveintact to higher altitudes, and the released Cl fraction
is distributed among the available forms of inorganicchlorine— chiefly the chain components, Cl and ClO,
and the temporary reservoirs HCl, ClONO2, andHOCl. Redistribution of Cl among these compounds
is controlled by the various chemical and photochemi-
cal reactions that affect these molecules at each altitude(WMO 2003). The lower temperatures of the strato-
sphere, as low as K67 8C at 20 km in temperatelatitudes and K90 8C at polar latitudes, strongly affect
the rates of some of the chemical reactions ( JPL 2003).However, the intensity of energetic solar UV radiation
becomes rapidly greater at higher altitudes with moreand more of the O2 and O3 molecules now beneath.
Both HOCl and ClONO2 have significant absorption
cross-sections at wavelengths longer than 293 nm ( JPL2003) and are subject to solar photodecomposition
throughout the atmosphere, albeit more intensively athigher altitudes.
The total amount of hydrogen in the stratosphere isessentially the amount summed over all of the gaseous
chemical species penetrating through the tropopause,i.e. essentially H2O plus CH4 plus H2. The mixing ratio
of CH4 at the 50 km level (the top of the stratosphere) isonly about one-eighth the value at the tropopause, with
the remaining seven-eighths already oxidized and largely
converted to H2O. Satellite simultaneous measurementsof the concentrations of both CH4 and H2O in the
stratosphere have confirmed that the sum of hydrogenpresent is nearly constant for all stratospheric latitudes
and altitudes ( Jones et al. 1986) at 12–13 p.p.m. (e.g.3 p.p.m. H2O!2 H atoms/molecule plus 1.5 p.p.m.
CH4!4 H atoms/molecule plus 0.5 p.p.m. H2!2atoms/molecule.) The contribution of hydrogen from

1800
1750
1700
1650
1600
1550
15001975 1980 1985 1990 1995 2000 2005
year
glob
al a
nnua
l CH
4 (p
pbv)
single seasonmeasurements
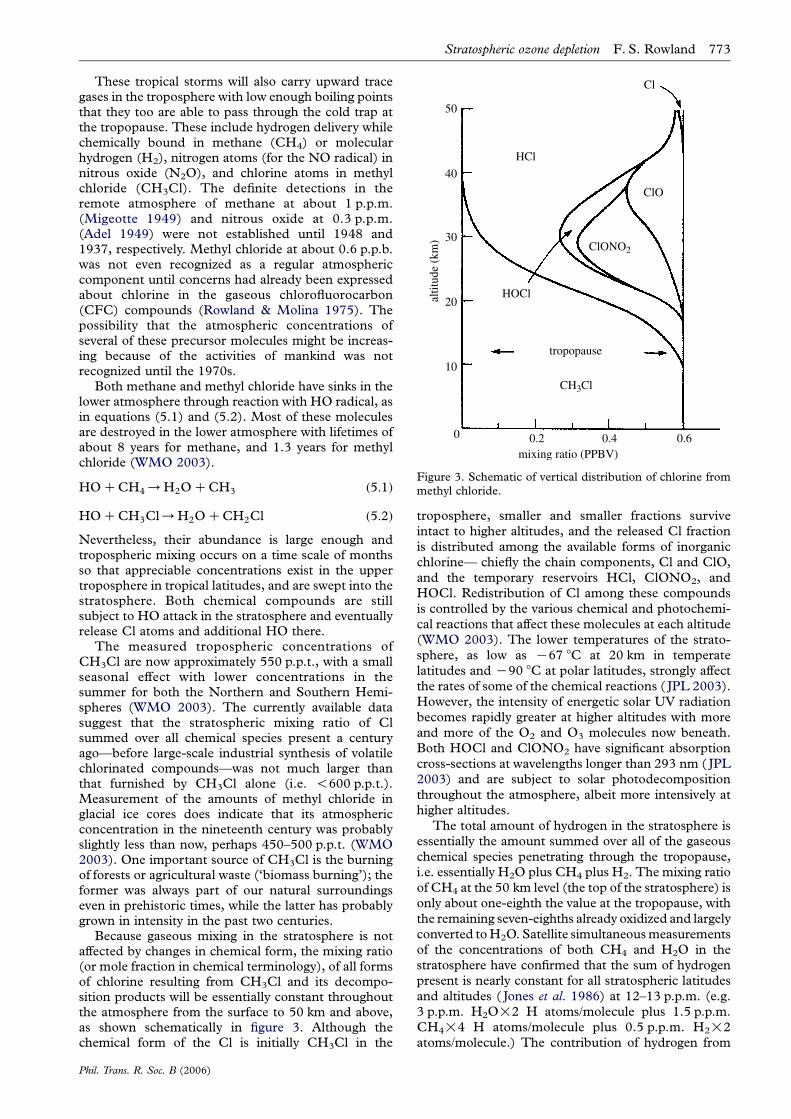
Figure 4. Moving average of four successive seasonalmeasurements. (Simpson et al. 2002 plus unpublished data.)
774 F. S. Rowland Stratospheric ozone depletion
CH3Cl with 3 H atoms per molecule!0.00055 p.p.m. isa negligible 0.002 p.p.m. Molecular H2O is much morestable in the stratosphere than either CH4 or CH3Cl,with the consequence that only a minor fraction of thehydrogen is present in the free radical forms HO andHO2, or more reactive reservoir compounds such asnitric acid (HONO2), hypochlorous acid (HOCl) orhydrogen peroxide (H2O2).
Unlike methyl chloride, the measurements of thepast 20 years have clearly shown that the troposphericconcentrations of methane have been increasing on aglobal scale (figure 4), from about 1.52 p.p.m. in 1978to 1.78 p.p.m. in 2003 (Blake & Rowland 1988;Dlugokencky et al. 1998; Simpson et al. 2002 plusadditional data). A corollary consequence is that theamounts of hydrogen transported into the stratospherehave also been steadily increasing. If H2O contentpenetrating upward through the tropical tropopausehas remained constant at an average of about 3 p.p.m.,then the observed change in methane would raise totalH from 13.1 p.p.m.v. in 1978 to 14.1 p.p.m.v. in 2004.Measurements of methane in glacial ice cores haveestablished that the atmospheric CH4 level was about0.75 p.p.m. in 1800 (Etheridge et al. 1998), and as lowas 0.35 p.p.m. 20 000 years ago during the coldest partof the last ice age. In fact, the measured CH4
concentration in the atmosphere has not exceeded0.8 p.p.m. in the past 420 000 years (Chappelaz et al.1990) until the increases of the past 200 years. Thus,the total delivery of hydrogen to the stratosphere hasincreased by 50% to its present level from about9 p.p.m. two centuries ago. This conclusion dependsimplicitly on the plausible assumption, untestable inthe absence of any pertinent data, that the averagetemperature of the tropical tropopause—and therebycontrol of the freeze-drying of air entering the strato-sphere—has remained unchanged during that period.
The extent to which this doubling in CH4 concen-trations over the past 200 years is anthropogenic inorigin has some quantitative uncertainty, but all of themajor biological CH4 emission sources (cattle, ricepaddies, swamps) and the non-biological sourcesassociated with fossil fuels have been perturbed bymankind during the past two centuries (Cicerone &Oremland 1988). An increase in total hydrogen in
Phil. Trans. R. Soc. B (2006)
the stratosphere then impacts directly on the ambientozone concentrations through altered levels of HO andHO2, and indirectly from the likely increase with morewater vapour present in both frequency of formationand total volume of clouds in the stratosphere. The roleof polar stratospheric clouds (PSCs) in stratosphericozone depletion in the Antarctic polar vortex isparticularly important, as discussed later.
Direct emission of the NOX free radicals into thetroposphere, or formation there by the action oflightning, have little effect on the stratosphere, becauserainout removes oxygen-bonded N from the atmos-phere as nitric acid or in other water-soluble chemicalforms. The major source of NO and NO2 in thestratosphere is N2O emitted at the surface, as firstrecognized by Crutzen (1970). This concept ofimportant stratospheric free radical concentrationssupported by trace gas precursors in the tropospherebrought a new emphasis on both the complications ofstratospheric chemistry and realization of the potentialimportance of compounds released by mankind invanishingly small quantities.
The state of atmospheric knowledge at the end of the1960s is well illustrated by the published scientificpapers from the 1969 International Symposium inHeidelberg on atmospheric trace constituents andatmospheric circulation. At this symposium, Dutschused 17 chemical reactions and eight chemical species,involving only atoms of H and O (O, O2, O3, H, HO,HO2, H2O and H2O2) to describe stratosphericchemistry. The state of current chemical understandingby the atmospheric scientific community is under-scored by his added comment that these were the ‘onlyreactions that are of importance under stratosphericconditions’ (Dutsch 1970). In the same symposium,the problems of measurement of N2O in the tropo-sphere are discussed in some detail, with a conclusionthat a calculated atmospheric lifetime of 70 years ispossible, if the limiting factor is photochemicaldestruction in the stratosphere. However, the uncer-tainties were emphasized: ‘seasonal variations andother observations seem to indicate shorter atmos-pheric lifetimes, however, suggesting additionaldestruction processes’ (Schutz et al. 1970). Our presentknowledge, however, indicates that N2O has nosignificant tropospheric sink and an average lifetimein the atmosphere of 120 years (WMO 2003). Its mostimportant sources are microbiological activity in thesoil and the oceans, resulting from side pathwaysduring the creation of N2 from the nitrification of NH3
or the denitrification of NO3K. In the stratosphere, N2O
can be destroyed either by direct photolysis, as inequation (5.3) or by reaction with electronically excitedO(1D) atoms in equation (5.4). Approximately 90% ofN2O removal occurs by photolysis, so that most Natoms delivered to the stratosphere as N2O areconverted directly into inert N2.
N2OCUV/N2 CO ð5:3Þ
N2OCOð1DÞ/NOCNO ð5:4Þ
The lesser pathway for N2O by equation (5.4) isnevertheless quite important because it is the majorsource of stratospheric NOX. The electronically excited
80
CC
I 3F (
pptv
)
70
60
50
40
30
20
40 40 60N Slatitude
20 200
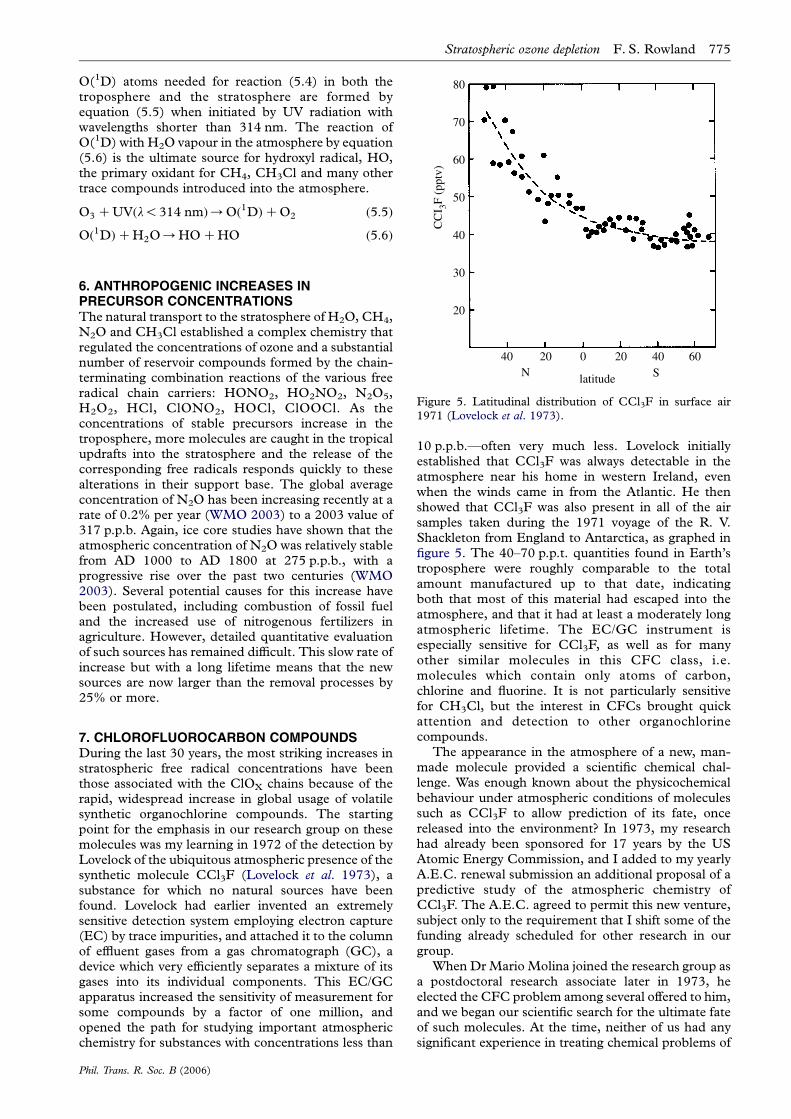
Figure 5. Latitudinal distribution of CCl3F in surface air1971 (Lovelock et al. 1973).
Stratospheric ozone depletion F. S. Rowland 775
O(1D) atoms needed for reaction (5.4) in both thetroposphere and the stratosphere are formed byequation (5.5) when initiated by UV radiation withwavelengths shorter than 314 nm. The reaction ofO(1D) with H2O vapour in the atmosphere by equation(5.6) is the ultimate source for hydroxyl radical, HO,the primary oxidant for CH4, CH3Cl and many othertrace compounds introduced into the atmosphere.
O3 CUVðl!314 nmÞ/Oð1DÞCO2 ð5:5Þ
Oð1DÞCH2O/HOCHO ð5:6Þ
6. ANTHROPOGENIC INCREASES INPRECURSOR CONCENTRATIONSThe natural transport to the stratosphere of H2O, CH4,N2O and CH3Cl established a complex chemistry thatregulated the concentrations of ozone and a substantialnumber of reservoir compounds formed by the chain-terminating combination reactions of the various freeradical chain carriers: HONO2, HO2NO2, N2O5,H2O2, HCl, ClONO2, HOCl, ClOOCl. As theconcentrations of stable precursors increase in thetroposphere, more molecules are caught in the tropicalupdrafts into the stratosphere and the release of thecorresponding free radicals responds quickly to thesealterations in their support base. The global averageconcentration of N2O has been increasing recently at arate of 0.2% per year (WMO 2003) to a 2003 value of317 p.p.b. Again, ice core studies have shown that theatmospheric concentration of N2O was relatively stablefrom AD 1000 to AD 1800 at 275 p.p.b., with aprogressive rise over the past two centuries (WMO2003). Several potential causes for this increase havebeen postulated, including combustion of fossil fueland the increased use of nitrogenous fertilizers inagriculture. However, detailed quantitative evaluationof such sources has remained difficult. This slow rate ofincrease but with a long lifetime means that the newsources are now larger than the removal processes by25% or more.
7. CHLOROFLUOROCARBON COMPOUNDSDuring the last 30 years, the most striking increases instratospheric free radical concentrations have beenthose associated with the ClOX chains because of therapid, widespread increase in global usage of volatilesynthetic organochlorine compounds. The startingpoint for the emphasis in our research group on thesemolecules was my learning in 1972 of the detection byLovelock of the ubiquitous atmospheric presence of thesynthetic molecule CCl3F (Lovelock et al. 1973), asubstance for which no natural sources have beenfound. Lovelock had earlier invented an extremelysensitive detection system employing electron capture(EC) by trace impurities, and attached it to the columnof effluent gases from a gas chromatograph (GC), adevice which very efficiently separates a mixture of itsgases into its individual components. This EC/GCapparatus increased the sensitivity of measurement forsome compounds by a factor of one million, andopened the path for studying important atmosphericchemistry for substances with concentrations less than
Phil. Trans. R. Soc. B (2006)
10 p.p.b.—often very much less. Lovelock initiallyestablished that CCl3F was always detectable in theatmosphere near his home in western Ireland, evenwhen the winds came in from the Atlantic. He thenshowed that CCl3F was also present in all of the airsamples taken during the 1971 voyage of the R. V.Shackleton from England to Antarctica, as graphed infigure 5. The 40–70 p.p.t. quantities found in Earth’stroposphere were roughly comparable to the totalamount manufactured up to that date, indicatingboth that most of this material had escaped into theatmosphere, and that it had at least a moderately longatmospheric lifetime. The EC/GC instrument isespecially sensitive for CCl3F, as well as for manyother similar molecules in this CFC class, i.e.molecules which contain only atoms of carbon,chlorine and fluorine. It is not particularly sensitivefor CH3Cl, but the interest in CFCs brought quickattention and detection to other organochlorinecompounds.
The appearance in the atmosphere of a new, man-made molecule provided a scientific chemical chal-lenge. Was enough known about the physicochemicalbehaviour under atmospheric conditions of moleculessuch as CCl3F to allow prediction of its fate, oncereleased into the environment? In 1973, my researchhad already been sponsored for 17 years by the USAtomic Energy Commission, and I added to my yearlyA.E.C. renewal submission an additional proposal of apredictive study of the atmospheric chemistry ofCCl3F. The A.E.C. agreed to permit this new venture,subject only to the requirement that I shift some of thefunding already scheduled for other research in ourgroup.
When Dr Mario Molina joined the research group asa postdoctoral research associate later in 1973, heelected the CFC problem among several offered to him,and we began our scientific search for the ultimate fateof such molecules. At the time, neither of us had anysignificant experience in treating chemical problems of

776 F. S. Rowland Stratospheric ozone depletion
the atmosphere, and each of us was now operating wellaway from our previous areas of expertise—his, laserchemistry, and mine, radioactivity.
Concern for the chemistry of the stratosphere hadbeen greatly boosted in the early 1970s by discussions ofthe potential release of NOX from supersonic aircraftsuch as the Concorde and the proposed Boeing SST, foreach of which a future market for as many as 500 aircraftwas contemplated if and when introduced commer-cially. In 1971 the US congress discontinued support forthe Boeing project, but mandated an intensive(1971–1974) Climatic Impact Assessment Programthrough the US Department of Transportation toexplore possible stratospheric consequences of super-sonic aircraft flight (CIAP 1975). The concerns aroseboth because of the great increase in speed—e.g. ‘sonicbooms’—and also because normal supersonic flight liesat much higher altitudes, 17–20 km, than used bycurrent commercial jet aircraft. This C.I.A.P. programprovided a very large increase in knowledge of thestratosphere, especially about the HOX and NOX chainreactions.
However, essentially none of the stratosphericchlorine chemistry described above for methyl chloridewas yet known—chlorinated chemicals had simply notbeen part of the global tropospheric or stratosphericdiscussion. The initial concerns for stratosphericchlorine chemistry entered the picture with consider-ation of the direct release in the stratosphere of HClduring very large volcanic eruptions (Stolarski &Cicerone 1974), and from the first stage rockets(fuelled with chlorine-containing compounds) sched-uled for the launches of the US Space Shuttle fleet.They identified the possibility of the ClOX chain ofreactions (4.5) and (4.6), and concluded that volcanoeswould not be a significant source of stratosphericchlorine. No stratospheric measurements of anychlorine-containing compound were yet available atthis time.
Our search for any removal process which mightaffect CCl3F did not start with the stratosphere,however, but began instead with the kinds of reactionswhich normally affect molecules released to theatmosphere at the surface of the Earth. Several classesexist of well-established tropospheric sinks—chemicaltransformation or physical removal processes—in thelower atmosphere. One or more of these are applicablefor most chemicals released at ground level, and areillustrated here with several chlorine-containingmaterials.
— Coloured species such as the green molecularchlorine, Cl2, absorb visible solar radiation, andphotodissociate afterward into individual atoms,requiring about an hour in sunlight;
— Highly polar molecules such as HCl are transpar-ent to solar radiation, but are water soluble anddissolve in raindrops to form hydrochloric acid,and are physically and irreversibly removed fromthe atmosphere when the drops actually fall,requiring a few months on the average; and
— Almost all compounds containing carbon-hydro-gen bonds, for example CH3Cl, can be oxidizedthroughout the oxygen-rich atmosphere, usually
Phil. Trans. R. Soc. B (2006)
by hydroxyl radical with the formation of water, asillustrated earlier in reaction (5.2).
However, CCl3F and the other CFCs such asCCl2F2 and CCl2FCClF2
4 are transparent to visiblesolar radiation and to those wavelengths of UV whichpenetrate to the lower atmosphere; are negligiblysoluble in water; and do not react with HO, O2, O3
or other oxidizing agents in the lower atmosphere.When none of these usual decomposition routes is
open, what happens to such long-lived molecules?All polyatomic compounds are capable of absorbing
some UV radiation if the wavelength is short enough.At the 50 km top of the stratosphere, the process is sorapid that a CFC molecule would last at most a fewweeks if directly released there. However, CFCmolecules in the lower atmosphere are protectedagainst this very energetic UV radiation by itsabsorption by prior reaction at higher altitudes withO2 or O3. The CCl3F molecule was known fromlaboratory studies to be able to absorb UV radiation atwavelengths !230 nm. But to encounter such solarradiation the molecule must first drift through theatmosphere to altitudes higher than most of the O2 andO3 molecules—to approximately 30 km altitude, withmore than 98% of the atmosphere lying below. In thisrarefied air, the CFC molecules are exposed to veryshort wavelength UV radiation and decompose withthe release of Cl atoms, as in equations (7.1) and (7.2).
CCl3FCUV/ClCCCl2F ð7:1Þ
CCl2F2 CUV/ClCCClF2 ð7:2Þ
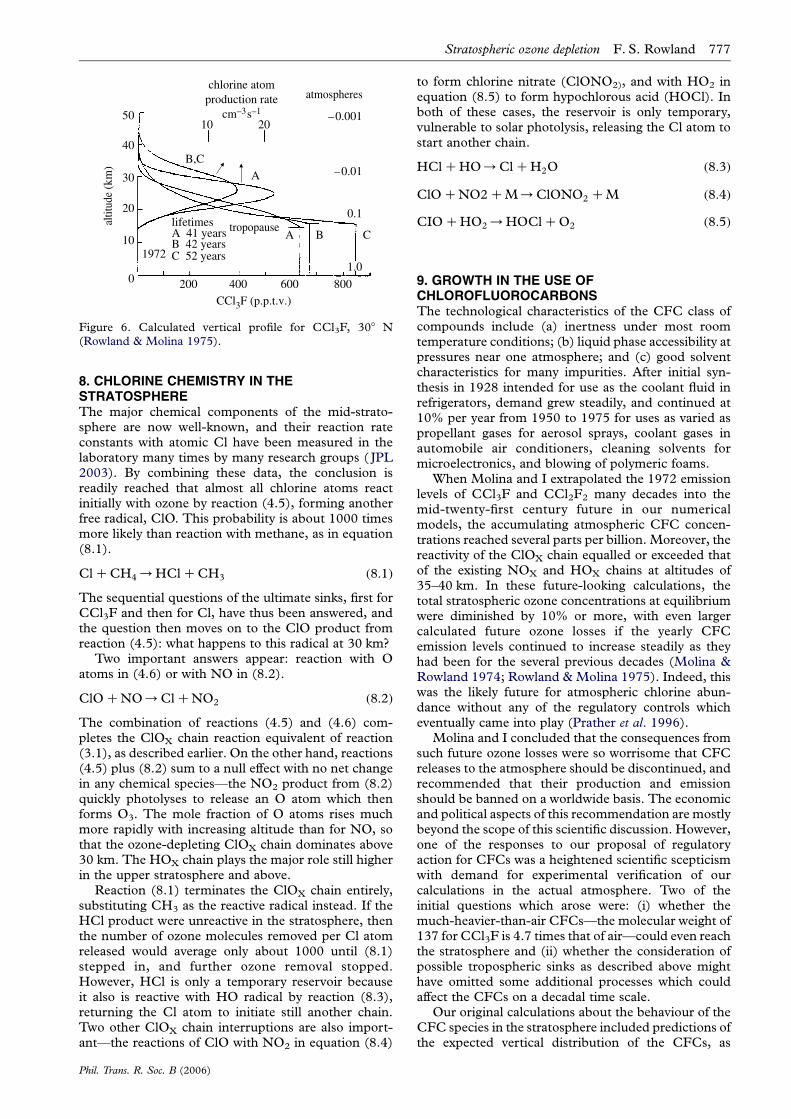
In 1974, Molina and I calculated the vertical profile ofthe mixing ratio to be expected for CCl3F in thestratosphere, using several different sets of eddydiffusion coefficients—the parameter used to simulatelatitudinally and longitudinally averaged verticalmotions in a one-dimensional (1D) atmosphericmodel of a three-dimensional world. (These eddydiffusion coefficients had been devised by othermodellers to simulate the rocket-observations of thevertical distributions of CH4 and other gases in middlelatitudes.) The resulting vertical profiles for CCl3F areall quite similar, as illustrated in figure 6, because thedecomposition rate for this molecule escalates veryrapidly with increasing altitude in the 20 to 30 kmrange. With each of these eddy parameters, ourestimated average lifetime for CCl3F in the atmospherewas in the range from 40 to 60 years. The lifetimescalculated for the weaker UV absorption of CCl2F2
varied from 75 to 150 years (Rowland & Molina 1975).The answer then to our original scientific question isthat the eventual fate of the CFC molecules isphotodissociation in the mid-stratosphere around analtitude of 30 km with the release of atomic chlorine,usually after many decades of wandering at loweraltitudes. The best current values for the atmosphericlifetimes of these gases still fall within these rangescalculated 30 years ago.
But what is the fate of these chlorine atoms at analtitude of 30 km?
atmospheres
1.0
0.1
–0.01
–0.001
1972
lifetimesA 41 yearsB 42 yearsC 52 years
tropopause
50
40
30
20
10
0 200 400 600 800
altit
ude
(km
)
chlorine atomproduction rate
cm–3s–1
10 20
CBA
CCl3F (p.p.t.v.)
B,CA
Figure 6. Calculated vertical profile for CCl3F, 308 N(Rowland & Molina 1975).
Stratospheric ozone depletion F. S. Rowland 777
8. CHLORINE CHEMISTRY IN THESTRATOSPHEREThe major chemical components of the mid-strato-sphere are now well-known, and their reaction rateconstants with atomic Cl have been measured in thelaboratory many times by many research groups ( JPL2003). By combining these data, the conclusion isreadily reached that almost all chlorine atoms reactinitially with ozone by reaction (4.5), forming anotherfree radical, ClO. This probability is about 1000 timesmore likely than reaction with methane, as in equation(8.1).
ClCCH4/HClCCH3 ð8:1Þ
The sequential questions of the ultimate sinks, first forCCl3F and then for Cl, have thus been answered, andthe question then moves on to the ClO product fromreaction (4.5): what happens to this radical at 30 km?
Two important answers appear: reaction with Oatoms in (4.6) or with NO in (8.2).
ClOCNO/ClCNO2 ð8:2Þ
The combination of reactions (4.5) and (4.6) com-pletes the ClOX chain reaction equivalent of reaction(3.1), as described earlier. On the other hand, reactions(4.5) plus (8.2) sum to a null effect with no net changein any chemical species—the NO2 product from (8.2)quickly photolyses to release an O atom which thenforms O3. The mole fraction of O atoms rises muchmore rapidly with increasing altitude than for NO, sothat the ozone-depleting ClOX chain dominates above30 km. The HOX chain plays the major role still higherin the upper stratosphere and above.
Reaction (8.1) terminates the ClOX chain entirely,substituting CH3 as the reactive radical instead. If theHCl product were unreactive in the stratosphere, thenthe number of ozone molecules removed per Cl atomreleased would average only about 1000 until (8.1)stepped in, and further ozone removal stopped.However, HCl is only a temporary reservoir becauseit also is reactive with HO radical by reaction (8.3),returning the Cl atom to initiate still another chain.Two other ClOX chain interruptions are also import-ant—the reactions of ClO with NO2 in equation (8.4)
Phil. Trans. R. Soc. B (2006)
to form chlorine nitrate (ClONO2), and with HO2 inequation (8.5) to form hypochlorous acid (HOCl). Inboth of these cases, the reservoir is only temporary,vulnerable to solar photolysis, releasing the Cl atom tostart another chain.
HClCHO/ClCH2O ð8:3Þ
ClOCNO2CM/ClONO2 CM ð8:4Þ
CIOCHO2/HOClCO2 ð8:5Þ
9. GROWTH IN THE USE OFCHLOROFLUOROCARBONSThe technological characteristics of the CFC class ofcompounds include (a) inertness under most roomtemperature conditions; (b) liquid phase accessibility atpressures near one atmosphere; and (c) good solventcharacteristics for many impurities. After initial syn-thesis in 1928 intended for use as the coolant fluid inrefrigerators, demand grew steadily, and continued at10% per year from 1950 to 1975 for uses as varied aspropellant gases for aerosol sprays, coolant gases inautomobile air conditioners, cleaning solvents formicroelectronics, and blowing of polymeric foams.
When Molina and I extrapolated the 1972 emissionlevels of CCl3F and CCl2F2 many decades into themid-twenty-first century future in our numericalmodels, the accumulating atmospheric CFC concen-trations reached several parts per billion. Moreover, thereactivity of the ClOX chain equalled or exceeded thatof the existing NOX and HOX chains at altitudes of35–40 km. In these future-looking calculations, thetotal stratospheric ozone concentrations at equilibriumwere diminished by 10% or more, with even largercalculated future ozone losses if the yearly CFCemission levels continued to increase steadily as theyhad been for the several previous decades (Molina &Rowland 1974; Rowland & Molina 1975). Indeed, thiswas the likely future for atmospheric chlorine abun-dance without any of the regulatory controls whicheventually came into play (Prather et al. 1996).
Molina and I concluded that the consequences fromsuch future ozone losses were so worrisome that CFCreleases to the atmosphere should be discontinued, andrecommended that their production and emissionshould be banned on a worldwide basis. The economicand political aspects of this recommendation are mostlybeyond the scope of this scientific discussion. However,one of the responses to our proposal of regulatoryaction for CFCs was a heightened scientific scepticismwith demand for experimental verification of ourcalculations in the actual atmosphere. Two of theinitial questions which arose were: (i) whether themuch-heavier-than-air CFCs—the molecular weight of137 for CCl3F is 4.7 times that of air—could even reachthe stratosphere and (ii) whether the consideration ofpossible tropospheric sinks as described above mighthave omitted some additional processes which couldaffect the CFCs on a decadal time scale.
Our original calculations about the behaviour of theCFC species in the stratosphere included predictions ofthe expected vertical distribution of the CFCs, as
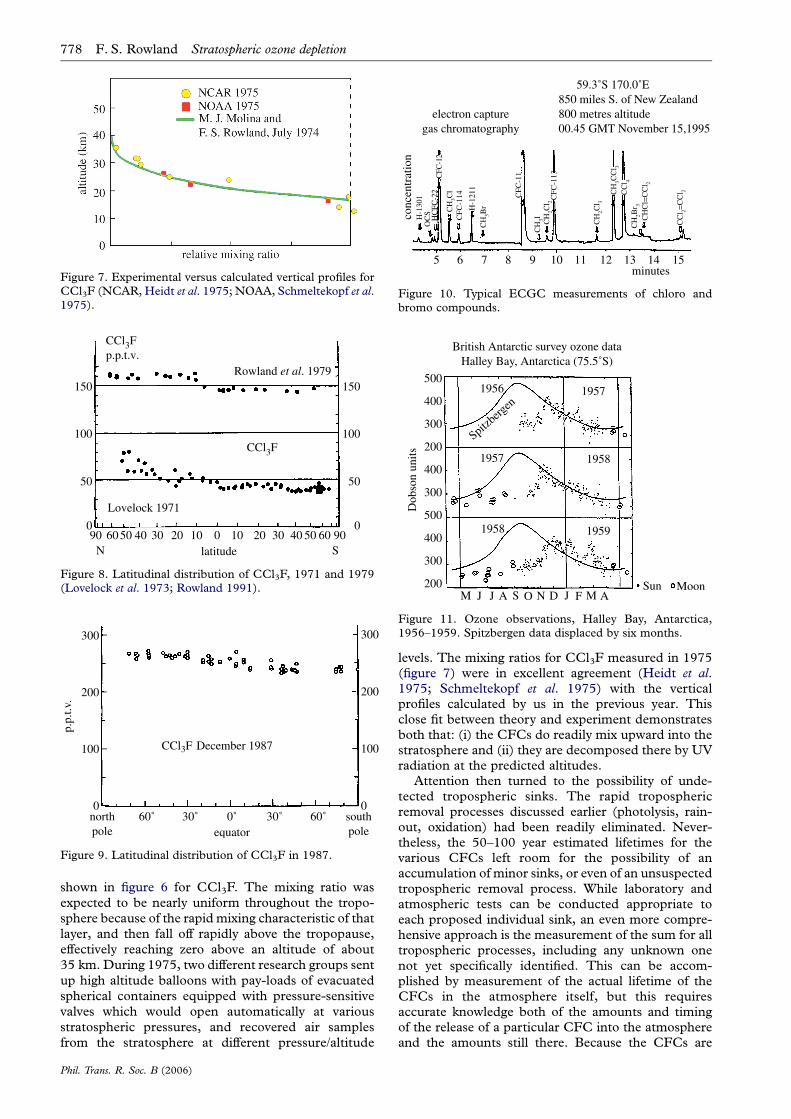
Figure 7. Experimental versus calculated vertical profiles forCCl3F (NCAR, Heidt et al. 1975; NOAA, Schmeltekopf et al.1975).
150
CCl3F p.p.t.v.
CCl3F
Lovelock 1971
Rowland et al. 1979
100
50
090 9060
N Slatitude6050 5040 4030 3020 2010 100
150
100
50
0
Figure 8. Latitudinal distribution of CCl3F, 1971 and 1979(Lovelock et al. 1973; Rowland 1991).
p.p.
t.v.
300
200
100
0
300
200
100
0northpole
southpole
60˚ 30˚ 30˚ 60˚0˚
CCl3F December 1987
equator
Figure 9. Latitudinal distribution of CCl3F in 1987.
5 6 7 8 9 10 11 12 13 14 15minutes
electron capturegas chromatography
59.3˚S 170.0˚E850 miles S. of New Zealand800 metres altitude00.45 GMT November 15,1995
conc
entr
atio
nH
-130
1
HC
FC-2
2
CH
3Cl
CH
3Br
CH
3I CH
2Cl 2
CH
2Cl 3
CH
2Br 3
CH
Cl=
CC
l 2
CC
l 2=C
Cl 2C
H3C
Cl 3
CC
l 4
CFC
-114
H-1
211
CFC
-12
CFC
-11
CFC
-113
OC
S
Figure 10. Typical ECGC measurements of chloro andbromo compounds.
500
400
300
200
400
300
500
400
300
200
British Antarctic survey ozone dataHalley Bay, Antarctica (75.5˚S)
1956 1957
1957 1958
1958 1959
Spitzberg
en
M J J A S O N D J F M A
Dob
son
units
Sun Moon
Figure 11. Ozone observations, Halley Bay, Antarctica,1956–1959. Spitzbergen data displaced by six months.
778 F. S. Rowland Stratospheric ozone depletion
shown in figure 6 for CCl3F. The mixing ratio was
expected to be nearly uniform throughout the tropo-
sphere because of the rapid mixing characteristic of that
layer, and then fall off rapidly above the tropopause,
effectively reaching zero above an altitude of about
35 km. During 1975, two different research groups sent
up high altitude balloons with pay-loads of evacuated
spherical containers equipped with pressure-sensitive
valves which would open automatically at various
stratospheric pressures, and recovered air samples
from the stratosphere at different pressure/altitude
Phil. Trans. R. Soc. B (2006)
levels. The mixing ratios for CCl3F measured in 1975(figure 7) were in excellent agreement (Heidt et al.1975; Schmeltekopf et al. 1975) with the verticalprofiles calculated by us in the previous year. Thisclose fit between theory and experiment demonstratesboth that: (i) the CFCs do readily mix upward into thestratosphere and (ii) they are decomposed there by UVradiation at the predicted altitudes.
Attention then turned to the possibility of unde-tected tropospheric sinks. The rapid troposphericremoval processes discussed earlier (photolysis, rain-out, oxidation) had been readily eliminated. Never-theless, the 50–100 year estimated lifetimes for thevarious CFCs left room for the possibility of anaccumulation of minor sinks, or even of an unsuspectedtropospheric removal process. While laboratory andatmospheric tests can be conducted appropriate toeach proposed individual sink, an even more compre-hensive approach is the measurement of the sum for alltropospheric processes, including any unknown onenot yet specifically identified. This can be accom-plished by measurement of the actual lifetime of theCFCs in the atmosphere itself, but this requiresaccurate knowledge both of the amounts and timingof the release of a particular CFC into the atmosphereand the amounts still there. Because the CFCs are
300
200
1960 1970year
1980
October
ozon
e (D
obso
n un
its)
ozone over Halley Bay,Antarctica (75.5˚S)
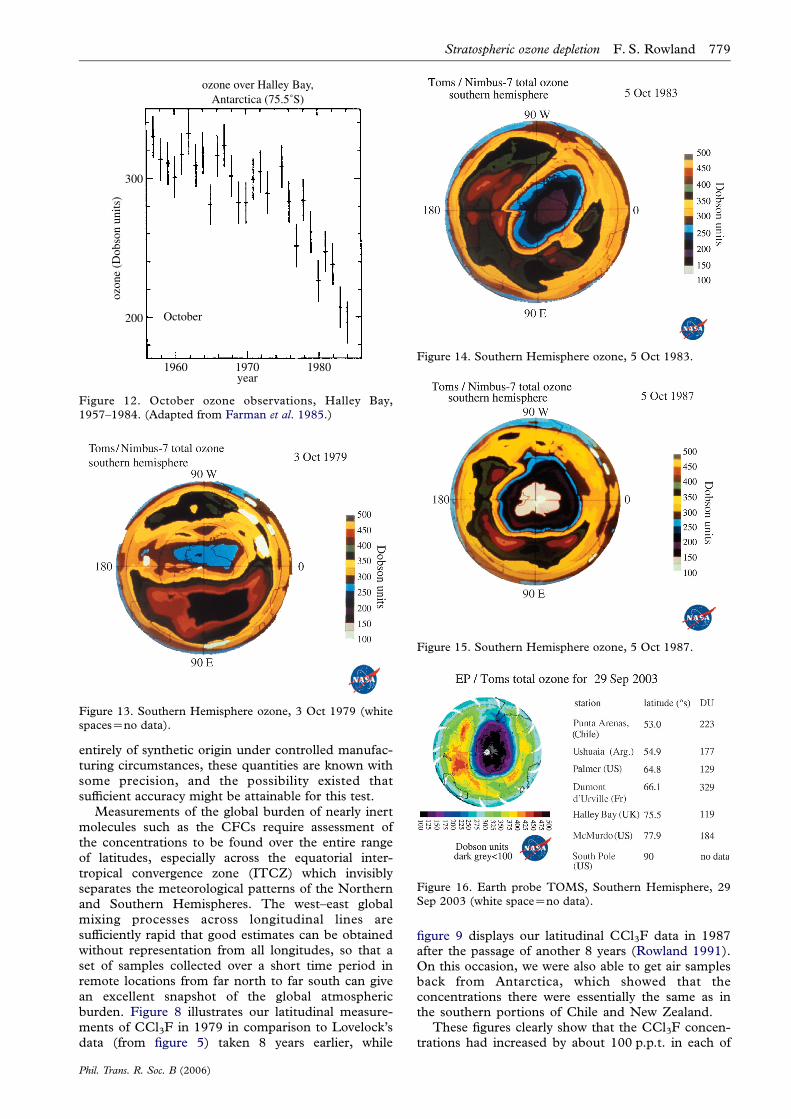
Figure 12. October ozone observations, Halley Bay,1957–1984. (Adapted from Farman et al. 1985.)
Figure 13. Southern Hemisphere ozone, 3 Oct 1979 (whitespacesZno data).
Figure 14. Southern Hemisphere ozone, 5 Oct 1983.
Figure 15. Southern Hemisphere ozone, 5 Oct 1987.
Figure 16. Earth probe TOMS, Southern Hemisphere, 29Sep 2003 (white spaceZno data).
Stratospheric ozone depletion F. S. Rowland 779
entirely of synthetic origin under controlled manufac-turing circumstances, these quantities are known withsome precision, and the possibility existed thatsufficient accuracy might be attainable for this test.
Measurements of the global burden of nearly inertmolecules such as the CFCs require assessment ofthe concentrations to be found over the entire rangeof latitudes, especially across the equatorial inter-tropical convergence zone (ITCZ) which invisiblyseparates the meteorological patterns of the Northernand Southern Hemispheres. The west–east globalmixing processes across longitudinal lines aresufficiently rapid that good estimates can be obtainedwithout representation from all longitudes, so that aset of samples collected over a short time period inremote locations from far north to far south can givean excellent snapshot of the global atmosphericburden. Figure 8 illustrates our latitudinal measure-ments of CCl3F in 1979 in comparison to Lovelock’sdata (from figure 5) taken 8 years earlier, while
Phil. Trans. R. Soc. B (2006)
figure 9 displays our latitudinal CCl3F data in 1987after the passage of another 8 years (Rowland 1991).On this occasion, we were also able to get air samplesback from Antarctica, which showed that theconcentrations there were essentially the same as inthe southern portions of Chile and New Zealand.
These figures clearly show that the CCl3F concen-trations had increased by about 100 p.p.t. in each of

780 F. S. Rowland Stratospheric ozone depletion
these 8 year intervals, accumulating rapidly, asexpected for molecules with long atmospheric life-times, and even more so because the yearly sourcesthemselves were also growing steadily. A very extensivedata set since 1978 with multiple daily automaticmeasurements at four locations, one in each latitudinalquadrant, has been used for progressively moreaccurate estimates of the atmospheric lifetimes, nowput at 45 years for CCl3F and 100 years for Cl2F2,respectively (Prinn et al. 1987; WMO 2003). Bothlifetime estimates are well within our estimated rangesmade 30 years ago.
No evidence for a tropospheric sink of even minorquantitative significance has been found for any of theCFCs; all of the related compounds with C–H bondsreact with HO in analogues to reaction (5.2) andconsequently have significantly shorter atmosphericlifetimes. The water solubility of the CFCs is very low,but not zero, and a very small fraction of the CFCs doesgo into the oceans. Whether these molecules areultimately destroyed there, or merely temporarilystored for a few decades is not yet certain. The fate ofthe CFC compounds really does lie in their solar UVphotolysis in the mid-stratosphere.
A typical measurement with our analytical systemfor the CFCs and other electron-capturing compoundsis shown in figure 10 for an air sample collectedthrough an external air intake on a C-130 Herculesaircraft 850 miles south of New Zealand in 1995. Evenin this remote location, at least 16 different lowmolecular weight compounds containing F, Cl or Bratoms—all much heavier than air—are readily detectedin a routine measurement.
10. SPRINGTIME LOSS OF OZONE IN THEANTARCTICThe greatest surprise in the CFC–ozone story wasrevealed in the spring of 1985, with the detection byFarman and his colleagues of massive springtime lossesof ozone over their British Antarctic Survey station atHalley Bay, Antarctica (75.58 South Latitude; Farmanet al. 1985). The B.A.S. established this station atHalley Bay in preparation for the InternationalGeophysical Year of 1957–1958, and equipped it witha standard Dobson UV spectrometer for the measure-ment of total ozone. The principle of this instrumentrelies on measuring the intensity ratio between twowavelengths of solar UV, one almost unaffected byozone, and the other at a shorter wavelength moder-ately absorbed. Although the UV absorbing character-istics of ozone vary continuously with wavelength, theUV region is often divided for convenience indescription into three arbitrary wavelength regions:UV-A, 400–315 nm, most of which reaches the Earth’ssurface; UV-B, 315–280 nm, some of which reachesthe surface; and UV-C, !280 nm, none of whichreaches the surface. (The wavelength borderlines arethemselves arbitrary, and 320 and 290 nm are oftenchosen in the definitions.) A typical Dobson measure-ment will depend upon one wavelength in the UV-Bregion versus one from UV-A, e.g. the frequently usedpair of 311.45 nm in the UV-B sector versus 332.4 nm
Phil. Trans. R. Soc. B (2006)
for UV-A. The more ozone in the stratosphere, thelarger the ratio of UV-A to UV-B.
With no significant prior information about Antarc-tic meteorology in 1956, Dobson anticipated finding amaximum over Halley Bay at the end of spring, similarto that previously observed at Spitzbergen, Norway.However, the stratospheric ozone content over theAntarctic station, instead of increasing steadily throughthe autumn and winter, as observed in the north,remained essentially constant through the autumn andwinter darkness, and into mid-spring. The concen-trations then increased sharply to a peak in mid-November, as illustrated in figure 11 for their first threeyears of observations during 1956–1959. The Dobsoninstrument can also be operated—but with muchpoorer precision—with the moon as the light source,as illustrated by the open circles in the winter infigure 11. Dobson recognized that the differences fromSpitzbergen were caused by a very strong blockingAntarctic polar vortex, which, until its break-down inmid-spring sunlight, prevented the arrival over thesouth polar region of ozone-richer stratospheric airfrom the temperate zone.
This pattern of level ozone values into mid-springwas observed over Halley Bay throughout the 1960sand early 1970s. However, in the late 1970s, theaverage October ozone concentrations over Halley Baybegan to decrease, dropping below 200 Dobson units(DU) in 1984 versus the 300–320 DU values of the1960s (figure 12). The loss of ozone begins soon afterthe end of the polar winter darkness, and proceeds veryrapidly for the next several weeks into mid-October.This totally unexpected phenomenon was first publiclyreported in May, 1985, together with the hypothesisthat the ozone decrease was correlated with theincreasing CFC concentrations in the atmosphere(Farman et al. 1985).
These observations of substantially less ozone overHalley Bay in October in the 1980s were quickly shownto be characteristic of the entire south polar region bythe measurements from the total ozone mappingspectrometer (TOMS) instrument on the Nimbus-7satellite (Stolarski et al. 1986). This instrument alsomeasures ozone from the ratio of two UV wavelengths,utilizing UV reflected back from the tropospherethrough the stratosphere to the satellite. More than100 000 daily TOMS ozone measurements taken overthe entire sunlit Southern Hemisphere are expressed incolour-coded Dobson unit contour plots in figures13–16 for a typical early October day each in 1979,1983, 1987 and 2003. In these TOMS displays, thelowest October ozone values fell rapidly from 250 DUin 1979 to 175 DU in 1983 and to 125 DU in 1987.The area with ozone readings below 220 DU, i.e. thesize of the ‘ozone hole’, now typically reaches amaximum of about 30 million square kilometres,about 6% of the Earth’s surface.
The data for figures 13–15 were all taken with theoriginal Nimbus-7 TOMS instrument, which lasted formore than 14 years, eventually failing in May 1993.TOMS instruments on other satellites have provided acomparable source for subsequent measurements,including one sending back data from the EarthProbe satellite since 1996. The indicated ozone loss

40–100 –90 –80 –70 –60 –50 –40 –30
30
20
10
0 5 10ozone partial pressure (mPa)
15 20 25
temperature (˚C)
south pole, 1999ozone sondes
temperature
O3, 7/28, DU255O3, 9/29DU 90
PSCs
altit
ude
(km
)
Figure 17. Vertical profiles, O3 and temperature, South Pole1999. PSC, polar stratospheric cloud.
Stratospheric ozone depletion F. S. Rowland 781
in 2003, 2004, and again in 2005, was generallycomparable to the typical loss observed from about1985 to the present.
The Antarctic ozone loss is often not symmetricalabout the South Pole, extending especially stronglytowards the Atlantic sector (figure 16). This canresult in extremely low ozone values for variousnational bases along the Antarctic peninsula and forthe cities of Ushuaia in Argentina and Punta Arenasin Chile, as listed in the figure. The years 1988 and2002 in this two-decade series exhibited substantiallydifferent patterns of ozone loss, with the latter‘ozone hole’ separating in two in mid-Novemberand rapidly disappearing. However, the subsequentyears have exhibited the more typical form of ‘ozonehole’ found for most of the period since 1985.
A totally different kind of ozone measurement,utilizing its chemical capability for oxidizing iodideion to elemental iodine, has been used on dailyballoon sondes, which report temperature andozone to altitudes of 30–35 km. The chemicalinstruments on the sondes, unlike the TOMSinstruments on the satellites do not require sunlightfor the measurement, and work just as well inmid-winter in the polar darkness. A July sonde(figure 17) shows the ozone maxima and tempera-ture minima lying between altitudes of 14 and22 km over the South Pole. During September theozone concentrations fall rapidly in this altituderange, with about six vertical kilometres nearlydevoid of ozone by the end of September, asshown for 1999 in figure 17. The dashed line atK78 8C represents a temperature cold enough forPSCs to form, as discussed below.
11. CHEMISTRY OF THE POLAR STRATOSPHERENumerous theories were suggested in explanation forthis new observation of heavy seasonal Antarcticozone loss and can generally be classified into threetypes: (i) natural change in the dynamics of theAntarctic stratosphere; (ii) change in the natural
Phil. Trans. R. Soc. B (2006)
chemistry of NOX in the stratosphere or (iii) chemicalchanges induced by mankind, especially through theintroduction of artificial chlorine-containing com-pounds such as the CFCs. A lowering of the springtimestratospheric temperatures was observed to accompanythe observations of ozone loss, and was brieflysuggested as a leading cause for its destruction (Angell1986; Chubachi & Kajawara 1986; Newman &Schoeberl 1986; Sekiguchi 1986; Singer 1989).However, regular balloon sonde measurements ofstratospheric temperatures and vertical ozone profileshad been measured by Farman and colleaguesthroughout the winter for decades prior to the onsetof this special ozone loss. The sonde temperaturevalues for August and September in the early 1980swere known to have fallen well within the rangeobserved from 1957 to 1975—that is, no unusualtemperature change as the winter cold settled in. Thedeviations towards lower stratospheric temperatures inthe 1980s began in October, and represented not acooling but instead a slower warm-up from thewintertime minimum. The depletion of ozone eachSeptember meant that much less ozone was presentwhen the sun reappeared as spring approached, andtherefore, less solar radiation was absorbed by ozone,and the temperature warmed up much more slowlythan it had during the 1957–1975 period.
While the decreases in average amounts of Antarcticozone are most marked in October, a steady erosion hastaken place in the ozone concentrations over HalleyBay throughout all of the sunlit months, as shown intable 1. With less ozone present, less UV radiation isintercepted, and less heat is released and a pattern oflower stratospheric temperatures over the Antarctic hasbeen established.
Three polar expeditions in 1986 and 1987 providedthe scientific basis for the conclusion that the ozonelosses over Antarctica were indeed the consequences ofchemical reactions driven by the much higher strato-spheric chlorine concentrations of the mid-1980sversus those of 1956–1975. Two of these expeditionswere ground-based at the US installation at McMurdo,Antarctica. In 1986, an unexpected second maximumwas detected (figure 18) in the vertical profile of thefree radical ClO, as measured by ground-basedmillimetre wave emission spectroscopy (deZafra et al.1987). The ClO radicals formed by reaction (4.5) arethe ‘smoking gun’ for ozone destruction by atomicchlorine, and the higher altitude maximum shown infigure 18 occurred at the altitudes expected for thehomogeneous gas phase reaction cycle of (4.5)and (4.6) (see page 772).
However, the larger and unexpected maximum inClO concentration was found in the lower stratosphere,and reached parts per billion concentrations coincidentwith the 15–21 altitude range of major ozone loss.
These results were then followed in 1987 by in situmeasurements of ClO and O3 within the polar vortexby instruments on the high-flying (18 km) ER-2aircraft (Anderson et al. 1989). These experimentswere carried out from a base in Punta Arenas, Chile(538 S latitude), and the ER-2 entered the polar vortexover the Antarctic peninsula. Anderson’s data(figure 19a) on the first successful flight on August 23
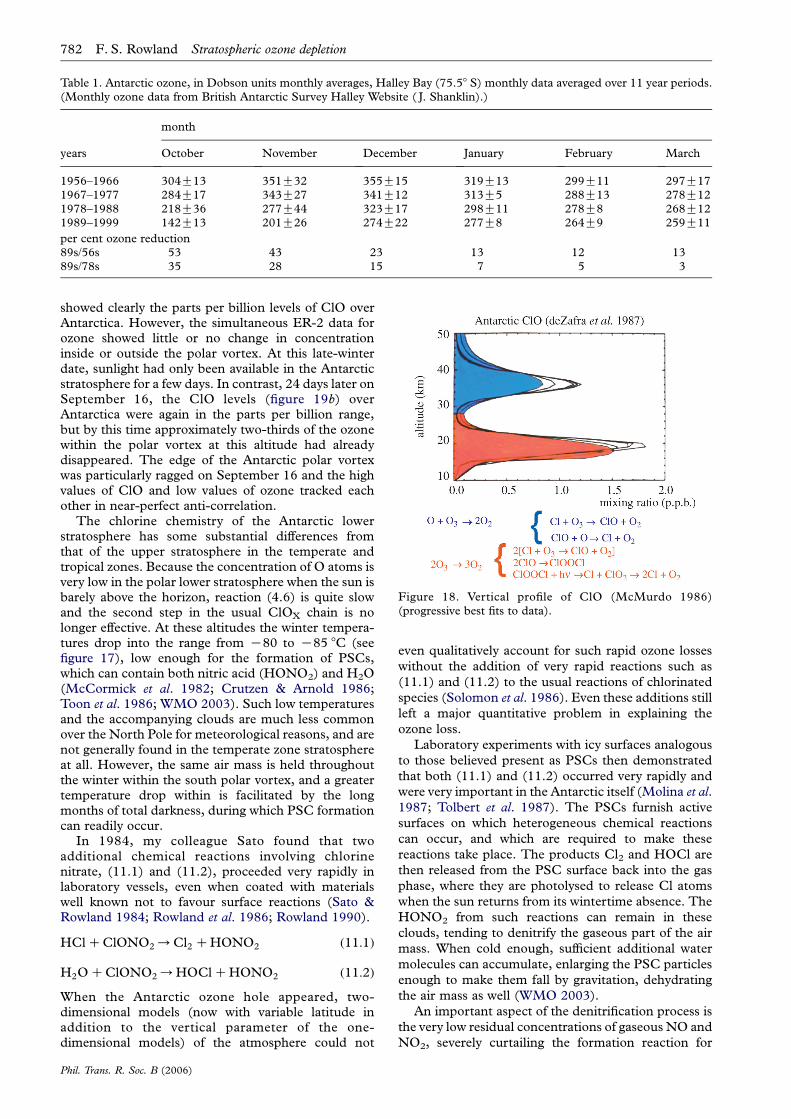
Table 1. Antarctic ozone, in Dobson units monthly averages, Halley Bay (75.58 S) monthly data averaged over 11 year periods.(Monthly ozone data from British Antarctic Survey Halley Website ( J. Shanklin).)
month
years October November December January February March
1956–1966 304G13 351G32 355G15 319G13 299G11 297G171967–1977 284G17 343G27 341G12 313G5 288G13 278G121978–1988 218G36 277G44 323G17 298G11 278G8 268G121989–1999 142G13 201G26 274G22 277G8 264G9 259G11
per cent ozone reduction89s/56s 53 43 23 13 12 1389s/78s 35 28 15 7 5 3
Figure 18. Vertical profile of ClO (McMurdo 1986)(progressive best fits to data).
782 F. S. Rowland Stratospheric ozone depletion
showed clearly the parts per billion levels of ClO overAntarctica. However, the simultaneous ER-2 data forozone showed little or no change in concentrationinside or outside the polar vortex. At this late-winterdate, sunlight had only been available in the Antarcticstratosphere for a few days. In contrast, 24 days later onSeptember 16, the ClO levels (figure 19b) overAntarctica were again in the parts per billion range,but by this time approximately two-thirds of the ozonewithin the polar vortex at this altitude had alreadydisappeared. The edge of the Antarctic polar vortexwas particularly ragged on September 16 and the highvalues of ClO and low values of ozone tracked eachother in near-perfect anti-correlation.
The chlorine chemistry of the Antarctic lowerstratosphere has some substantial differences fromthat of the upper stratosphere in the temperate andtropical zones. Because the concentration of O atoms isvery low in the polar lower stratosphere when the sun isbarely above the horizon, reaction (4.6) is quite slowand the second step in the usual ClOX chain is nolonger effective. At these altitudes the winter tempera-tures drop into the range from K80 to K85 8C (seefigure 17), low enough for the formation of PSCs,which can contain both nitric acid (HONO2) and H2O(McCormick et al. 1982; Crutzen & Arnold 1986;Toon et al. 1986; WMO 2003). Such low temperaturesand the accompanying clouds are much less commonover the North Pole for meteorological reasons, and arenot generally found in the temperate zone stratosphereat all. However, the same air mass is held throughoutthe winter within the south polar vortex, and a greatertemperature drop within is facilitated by the longmonths of total darkness, during which PSC formationcan readily occur.
In 1984, my colleague Sato found that twoadditional chemical reactions involving chlorinenitrate, (11.1) and (11.2), proceeded very rapidly inlaboratory vessels, even when coated with materialswell known not to favour surface reactions (Sato &Rowland 1984; Rowland et al. 1986; Rowland 1990).
HClCClONO2/Cl2 CHONO2 ð11:1Þ
H2OCClONO2/HOClCHONO2 ð11:2Þ
When the Antarctic ozone hole appeared, two-dimensional models (now with variable latitude inaddition to the vertical parameter of the one-dimensional models) of the atmosphere could not
Phil. Trans. R. Soc. B (2006)
even qualitatively account for such rapid ozone losses
without the addition of very rapid reactions such as
(11.1) and (11.2) to the usual reactions of chlorinated
species (Solomon et al. 1986). Even these additions still
left a major quantitative problem in explaining the
ozone loss.
Laboratory experiments with icy surfaces analogous
to those believed present as PSCs then demonstrated
that both (11.1) and (11.2) occurred very rapidly and
were very important in the Antarctic itself (Molina et al.1987; Tolbert et al. 1987). The PSCs furnish active
surfaces on which heterogeneous chemical reactions
can occur, and which are required to make these
reactions take place. The products Cl2 and HOCl are
then released from the PSC surface back into the gas
phase, where they are photolysed to release Cl atoms
when the sun returns from its wintertime absence. The
HONO2 from such reactions can remain in these
clouds, tending to denitrify the gaseous part of the air
mass. When cold enough, sufficient additional water
molecules can accumulate, enlarging the PSC particles
enough to make them fall by gravitation, dehydrating
the air mass as well (WMO 2003).
An important aspect of the denitrification process is
the very low residual concentrations of gaseous NO and
NO2, severely curtailing the formation reaction for

Figure 19. ER-2 measurements of ClO and O3, 1987 (Anderson 1989).
Stratospheric ozone depletion F. S. Rowland 783
chlorine nitrate by reaction (8.4). Without this removalprocess, the ClO concentrations rise to mixing ratios inthe parts per billion range, and begin to react insignificant numbers with other ClO radicals to form thedimer ClOOCl shown in equation (11.3). The chlorineoxide dimer, ClOOCl, can then be destroyed bysunlight in equation (11.4), releasing one Cl atomeach in (11.4) and (11.5). The sum of reaction (4.5)taken twice plus (11.3), (11.4) and (11.5) is shown inequation (11.6): two O3 molecules are transformed intothree O2 molecules without any need for the involve-ment of free O atoms (Molina & Molina 1987).
ClOCClOCM/ClOOClCM ð11:3Þ
ClOOClCUV/ClCClOO ð11:4Þ
ClOOCM/ClCO2 CM ð11:5Þ
O3 CO3/O2 CO2 CO2 ð11:6Þ
This dimer cycle is the key to rapid Antarctic ozoneloss. When O atoms or NO radicals do not quicklyattack ClO, the latter’s concentration builds up highenough to bring in the ClO dimer method of destroyingozone, which operates without needing the O atomswhich are critical to the higher altitude ozone lossmechanism and are essentially absent at low altitudes.
12. OTHER HALOGEN SPECIESThe fluorine atoms carried into the stratosphere by theCFCs are also reactive, and will attack ozone to form FOand O2 in direct analogy to the Cl attack in (4.5), and canbe returned to atomic F by reaction with O, in analogywith equation (4.6). However, the competing reactionof F atoms with CH4 to form HF is considerably fasterthan its Cl atom counterpart, and breaks up the FOX
Phil. Trans. R. Soc. B (2006)
chain after about 100 cycles. The biggest difference then
arises between the ClOX and FOX chains—HF is a very
stable molecule, and does not react with HO radical, or
anything else in the stratosphere. So the FOX chain
never gets restarted. The approximate chain reaction
yield per F atom released is about 100 molecules ofozone lost, negligible alongside the 100 000 ozone
molecules lost per Cl atom released.
Much smaller amounts of bromine are used
commercially, much of it for the manufacture of fire
prevention agents known as Halons (WMO 2003).
These include Halons 1301 (CBrF3), 1211 (CBrClF2)
and 2402 (CBrF2CBrF2), all of which have atmos-
pheric lifetimes of several decades. Each is now present
in the atmosphere in several parts per trillion
quantities. In addition, about half of the atmospheric
load of bromine comes from methyl bromide (CH3Br)
which has both natural and artificial sources. This
compound has a rather short atmospheric lifetime of
about eight months (WMO 2003). Of course, theshorter the observed lifetime, the larger the sources
needed to maintain a given concentration in the
atmosphere. A very large fraction of the bromine lost
from methyl bromide decomposition takes place in the
troposphere with no stratospheric consequences. How-
ever, a BrOX chain does exist in the stratosphere in
analogy with ClOX, but with few escape routes from the
chain because, unlike Cl and F, the reaction of Br with
CH4 is energetically quite unfavourable and does not
occur. As a consequence, Br atoms released in the
stratosphere tend to stay in the chain mode most of the
time. The most significant chain involving bromine
relies on the cross reaction of BrO with ClO, parallel to
the ClO dimer reaction, and ultimately releasing one Cl
atom and one Br atom. Atomic bromine, per atom, isabout 20–50 times as efficient as Cl in destroying ozone
5
0
dif
fere
nce
ozone change at Arosa1970–1988 minus 1931–1969
784 F. S. Rowland Stratospheric ozone depletion
under various stratospheric conditions. However, thetotal precursor Br concentration lies in the 20 p.p.t.range versus about 3000 p.p.t. for Cl sources (WMO2003). The Br chains are important but not thedominant contributor to stratospheric ozone lossunder most conditions.
J A S O N Dmonth
J F M MA J
–5
–10
perc
enta
ge o
f
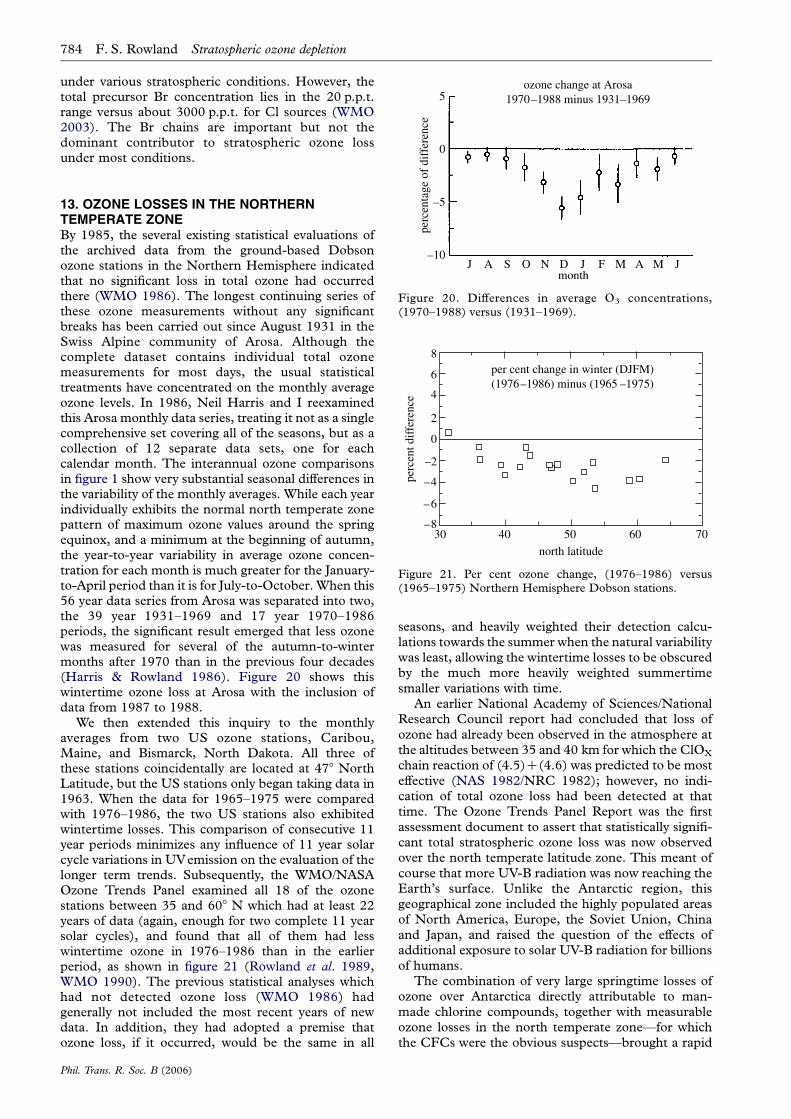
Figure 20. Differences in average O3 concentrations,(1970–1988) versus (1931–1969).
8
6
4
2
0
perc
ent d
iffe
renc
e
–2
–4
–6
–830 40 50 60 70
north latitude
per cent change in winter (DJFM)(1976–1986) minus (1965 –1975)
Figure 21. Per cent ozone change, (1976–1986) versus(1965–1975) Northern Hemisphere Dobson stations.
13. OZONE LOSSES IN THE NORTHERNTEMPERATE ZONEBy 1985, the several existing statistical evaluations ofthe archived data from the ground-based Dobsonozone stations in the Northern Hemisphere indicatedthat no significant loss in total ozone had occurredthere (WMO 1986). The longest continuing series ofthese ozone measurements without any significantbreaks has been carried out since August 1931 in theSwiss Alpine community of Arosa. Although thecomplete dataset contains individual total ozonemeasurements for most days, the usual statisticaltreatments have concentrated on the monthly averageozone levels. In 1986, Neil Harris and I reexaminedthis Arosa monthly data series, treating it not as a singlecomprehensive set covering all of the seasons, but as acollection of 12 separate data sets, one for eachcalendar month. The interannual ozone comparisonsin figure 1 show very substantial seasonal differences inthe variability of the monthly averages. While each yearindividually exhibits the normal north temperate zonepattern of maximum ozone values around the springequinox, and a minimum at the beginning of autumn,the year-to-year variability in average ozone concen-tration for each month is much greater for the January-to-April period than it is for July-to-October. When this56 year data series from Arosa was separated into two,the 39 year 1931–1969 and 17 year 1970–1986periods, the significant result emerged that less ozonewas measured for several of the autumn-to-wintermonths after 1970 than in the previous four decades(Harris & Rowland 1986). Figure 20 shows thiswintertime ozone loss at Arosa with the inclusion ofdata from 1987 to 1988.
We then extended this inquiry to the monthlyaverages from two US ozone stations, Caribou,Maine, and Bismarck, North Dakota. All three ofthese stations coincidentally are located at 478 NorthLatitude, but the US stations only began taking data in1963. When the data for 1965–1975 were comparedwith 1976–1986, the two US stations also exhibitedwintertime losses. This comparison of consecutive 11year periods minimizes any influence of 11 year solarcycle variations in UVemission on the evaluation of thelonger term trends. Subsequently, the WMO/NASAOzone Trends Panel examined all 18 of the ozonestations between 35 and 608 N which had at least 22years of data (again, enough for two complete 11 yearsolar cycles), and found that all of them had lesswintertime ozone in 1976–1986 than in the earlierperiod, as shown in figure 21 (Rowland et al. 1989,WMO 1990). The previous statistical analyses whichhad not detected ozone loss (WMO 1986) hadgenerally not included the most recent years of newdata. In addition, they had adopted a premise thatozone loss, if it occurred, would be the same in all
Phil. Trans. R. Soc. B (2006)
seasons, and heavily weighted their detection calcu-lations towards the summer when the natural variabilitywas least, allowing the wintertime losses to be obscuredby the much more heavily weighted summertimesmaller variations with time.
An earlier National Academy of Sciences/NationalResearch Council report had concluded that loss ofozone had already been observed in the atmosphere atthe altitudes between 35 and 40 km for which the ClOX
chain reaction of (4.5)C(4.6) was predicted to be mosteffective (NAS 1982/NRC 1982); however, no indi-cation of total ozone loss had been detected at thattime. The Ozone Trends Panel Report was the firstassessment document to assert that statistically signifi-cant total stratospheric ozone loss was now observedover the north temperate latitude zone. This meant ofcourse that more UV-B radiation was now reaching theEarth’s surface. Unlike the Antarctic region, thisgeographical zone included the highly populated areasof North America, Europe, the Soviet Union, Chinaand Japan, and raised the question of the effects ofadditional exposure to solar UV-B radiation for billionsof humans.
The combination of very large springtime losses ofozone over Antarctica directly attributable to man-made chlorine compounds, together with measurableozone losses in the north temperate zone—for whichthe CFCs were the obvious suspects—brought a rapid

Stratospheric ozone depletion F. S. Rowland 785
change in the attitudes of the CFC-producers andmany of the users. A complete phase-out of CFCproduction and uses became an announced, widelyaccepted goal.
14. THE MONTREAL PROTOCOL FORREGULATION OF CFCSRegulations for the control of CFC emissions had firstbeen enacted during the late 1970s for the use of CCl3Fand CCl2F2 as propellant gases for aerosol sprays, butonly in the United States, Canada, Sweden, andNorway. Because the US accounted for about half ofthe world CFC use at this time, with the majority of itas propellant gases, these bans accounted for aboutone-third of the current total global use. The UnitedNations agreed in March 1985 to the ‘ViennaConvention for the Protection of the Ozone Layer’,with the charge to ‘take appropriate measures inaccordance with the provisions of this convention.toprotect human health and the environment againstadverse effects resulting or likely to result from humanactivities which modify or are likely to modify the ozonelayer’ (Benedick 1998; Andersen & Sarma 2002).
Then, in September 1987, a further agreement,the ‘Montreal Protocol on Substances That Depletethe Ozone Layer’, called for scaled reductions on theproduction of CFCs, ending with a 50% cutback inCFC production averaged over the 12 monthsbeginning July 1, 1998. The terms of the MontrealProtocol called for periodic revisits to the regulations,and a meeting in London in 1990 changed therestricted production into an outright phase-out byJanuary 1, 2000. A further U.N. meeting in Copenha-gen in 1992 accelerated the deadline for the phaseoutof CFCs to January 1, 1996, for the major industrialcountries (with a 10 year delay for developingcountries), and also included regulations for com-pounds such as methylchloroform (CH3CCl3), carbontetrachloride (CCl4), and the bromine-containingHalons, i.e. CBrF3, CBrClF2 and CBrF2CBrF2
(Benedick 1998). Further minor adjustments weremade in Montreal in 1997 and Beijing in 1999(Andersen & Sarma 2002).
15. CHANGES IN ULTRAVIOLET FLUX ATEARTH’S SURFACEMost of the measurements of total ozone, including theDobson and TOMS data, actually depend upon theratio of two wavelengths of solar UV radiation, asdescribed earlier. A change in the amount of ozonealong the path of the UV radiation is inferred from achange in the wavelength intensities of the detectedradiation. In these cases, the existence of a correlationwith the same instrument between reported ozone andthe UV-B/UV-A dual wavelength ratio under clear skyconditions is essentially a tautology. Less reportedozone means either more UV-B or less UV-A or amixture of both. Because no mechanisms for significantchanges in the intensity of solar UV-A radiation havebeen put forward, an increase in the UV-B/UV-A ratiohas often been directly expressed as the correspondingdiminution in total ozone.
Phil. Trans. R. Soc. B (2006)
Nonetheless, after reports of a decrease in averageozone over the United States were reported based onthe Dobson technique, direct UV-B measurementsover the United States were also reported to showdecreasing amounts of radiation reaching the surface(Scotto et al. 1988) and were widely quoted for the nextdecade. These UV-B measurements were made with aRobertson–Berger meter, which, unlike the stronglycollimated Dobson instrument, has a flat surfaceaccepting solar radiation from all angles above thesurface, even after many scattering processes havecaused multiple changes in the direction of theradiation. When the goal is measurement of totalexposure to UV radiation, instruments accepting bothdirect and scattered solar radiation are much morepertinent because the latter is usually a very significantfraction of the total.
The R–B meter also is a broad-band instrumentcombining all wavelengths of UV-B into a single UVresponse, with no separate record of intensity at anyparticular wavelength. The detector itself has a built-inweighting factor designed to mimic the erythemal(sunburn) response of human skin. This logicalinconsistency in the data between the Dobson andthe R–B instrument records was finally settled bydemonstration that side-by-side measurements withtwo instruments showed an anti-correlation betweenozone concentration and UV-B intensity on an absolutescale (Kerr & McElroy 1993). Separately, the decade-long calibration records for the R–B meters were foundto have sufficient gaps and other problems to make thedataset completely unsatisfactory for the evaluation oflong-term trends in UV-B radiation (Weatherhead et al.1997).
This absence of well calibrated, precision absolutemeasurements of UV radiation over a decade or moreillustrated the weakness of the existing system for UV-Bmeasurements. As a consequence, spectrometerscapable of absolute measurements versus wavelengthacross the entire UV and visible spectrum weredeveloped and deployed in various locations, especiallyin the Southern Hemisphere, including three Antarcticstations—South Pole, McMurdo (788 S) and Palmer(648 S)—as well as Ushuaia, Argentina (558 S), andBarrow, Alaska (718 N). These instruments also are flatpanel detectors, accepting both direct and scatteredsolar radiation because the goal is assessment of totalUV-B exposure (Booth & Madronich 1994; Booth et al.2001) rather than measurement of stratospheric ozone.Multiple scattering is especially important underthe highly reflective surface conditions of polar iceand snow.
The Antarctic polar vortex, and the low ozoneconcentrations contained within it during recentOctobers mean that the possibility now exists formuch higher UV-B exposures in the southern latitudesthan in previous times. During October 2004, theozone hole varied in elongation, while rotating clock-wise when viewed from above, and on one occasionswept over the inhabited parts of the southern tip ofSouth America. As illustrated in figures 22 and 23 forOctober 7 and 12, 2004, the ozone overhead inUshuaia, Argentina, and Punta Arenas, Chile, droppedfrom more than 300 Dobson units to less than 200 DU

Figure 22. TOMS Southern Hemisphere ozone, PuntaArenas and Ushuaia outside the ‘hole’.
Figure 23. TOMS Southern Hemisphere ozone, PuntaArenas and Ushuaia in the ‘hole’.
Figure 24. UV-B intensities at surface on 4 different days.
Figure 25. UV index, 1991–2001, Barrow, Palmer and SanDiego.
786 F. S. Rowland Stratospheric ozone depletion
within 5 days. Meanwhile, the Halley Bay station and
the South Pole remained well below 200 DU for about
two months. The polar area with ozone readings less
than 200 DU currently reaches a typical maximum size
early in October of 25–30 million square kilometres.
Most concerns about UV effects on biology are
directed towards the UV-B range because none of the
UV-C radiation gets down to Earth’s surface, and UV-A
radiation at the surface is so intense that all species
exposed to sunlight without some internal mechanism
for dealing with UV-A would long since have become
extinct. The effects of UV-B on humans and many other
species are intimately connected with the UVabsorption
characteristics of DNA, which parallel that of ozone in
the rapid increase with shorter wavelengths. In the
295 nm region of UV, relatively little UV-B normally
makes it to the surface, and therefore, can be
substantially multiplied if the total ozone level is
depleted in a major way. At the same time, this
295 nm radiation is strongly absorbed by DNA,
enhancing the biological effectiveness of this absorption.
The intensity of UV radiation at the surface is
dependent upon the solar zenith angle and upon the
amount of ozone. When the ozone hole sweeps over
Ushuaia in southern Argentina the UV intensity at
295 nm can vary by a factor of 100 within a few days, as
illustrated in figure 24. The maximum daily intensity
observed over an entire year for the UV Index
Phil. Trans. R. Soc. B (2006)
(UV erythemally weightedZsunburn response ofhuman skin) at Palmer (648S) in the Antarctic peninsulanow exceeds that in San Diego (328N) by about 25%, asillustrated for the decade 1991–2001 in figure 25. TheUV Index for Barrow in northern Alaska reaches amaximum daily value about half of that in San Diego.
The biological effects of the Southern Hemisphericchange in maximum exposure intensity are thendependent on the nature of the biological response.For example, the incidences of basal and squamous cellskin cancer, the most common kinds, are generallyconsidered, because of the great increase in incidencewith age, to be the consequence of repeated cumulat-ive, exposures to UV-B radiation (deGruijl 1999;DeFabo 2000; DeFabo et al. 2004). In contrast,malignant melanoma is often attributed to a single,very intense exposure, which might well be much morelikely in the southern regions of Argentina and Chileduring the periods when the ozone hole has greatlyreduced the protective shield from overhead ozone.These increased exposures are less likely to affecthumans because they can take protective measures,but plants and animals receive much more UV-Bduring ozone hole episodes than was common a fewdecades ago.

Stratospheric ozone depletion F. S. Rowland 787
16. OZONE AND CFC CONCENTRATIONS AFTERTHE MONTREAL PROTOCOLThe passage of the Montreal Protocol had animmediate effect on the emissions of the regulatedgases, in most cases faster than actually required by theprotocol terms. The most striking effect has been therapid decrease in the CH3CCl3 concentrations inthe atmosphere. This compound has a short atmos-pheric lifetime of about 5 years because of its reactivitytowards HO radicals, and major releases to theatmosphere stopped early in the 1990s in response tothe scheduled ban. The CH3CCl3 concentrations hadreached about 140 p.p.t. by 1992, and have nowdecreased to about 22 p.p.t. in mid-2004. With threeatoms per molecule, this change alone has alreadyreduced the total organochlorine content in the tropo-sphere by about 350 p.p.t. However, with 85% ofCH3CCl3 already gone and no remaining importantshort-lived contributor to the total organochlorineburden left in the atmosphere, the rapid reduction intotal chlorine found for the past decade will cease.Instead, the reduction will proceed at the average of the2 and 1% per year rates, respectively, calculated forCCl3F and CCl2F2. For example, the total ban onCCl2F2 is expected to reduce its atmospheric burdenby only about 50 p.p.t. (out of 540 p.p.t.) in the nextdecade.
Figure 26. Change in surface concentrations of CCl3F andCCl2F2.
17. CHANGING OZONE AND CFCCONCENTRATIONS SINCE 1990Ozone concentrations in the stratosphere continued tofall in the early 1990s. The measured ozone overhead atthe South Pole was only 91 DU on October 12, 1993,and the vertical profile data from the correspondingballoon sonde indicated that all ozone had beenremoved from a 6 km altitude band between 15 and21 km, as shown earlier in figure 17.
The TOMS satellite registered many new recorddaily lows (compared to the same calendar day in allearlier years) in early 1992, and then for nearly 13months from mid-April, 1992, a new record daily lowglobal ozone value was measured every day; themeasurement series ended when the TOMS instru-ment finally failed on May 7, 1993, after more than 14years. The ozone data interpretations during thisperiod were complicated by the eruption of MountPinatubo in the Philippines in June 1991. This volcano,while not providing any significant amount of HCl tothe stratosphere, did introduce particulate surfaces onwhich reactions could occur similar to those takingplace on the PSC surfaces. The ozone measurementsduring the immediate post-Pinatubo years are usuallyinterpreted as including augmented losses from theadditional surfaces furnished by the volcanic eruption.By 1995, the north temperate zone total ozone lossesapproached 10% during winter and spring and 5% inthe summer and autumn (WMO 1995).
The most recent international report on the state ofthe stratospheric ozone layer (WMO 2003) indicatesnot much further change over the last few years, withan average ozone loss relative to the 1980 levels of 6%for the Southern Hemisphere mid-latitudes, and3% for the Northern Hemisphere mid-latitudes.
Phil. Trans. R. Soc. B (2006)
The tropics continue not to exhibit any significantchange in ozone levels, while both polar regions showextensive ozone loss—especially the Antarctic wherethe ozone hole remains a very prominent feature(WMO 2003).
In contrast, the measured tropospheric concen-trations of the various halocarbon gases deviated inthe 1990s in response to the restrictions of theMontreal Protocol from their earlier pattern of steadyincreases. The concentrations of the three major CFCs,which had risen almost linearly during the 1980s,markedly slowed this pace, and by 1995–1997 hadessentially levelled off, and are now decreasing forCCl3F (figure 26) and CCl2FCClF2, and almost levelfor CCl2F2 (also figure 26).
The situation at the end of 2004 remains a mixedone. The three most important CFC molecules haveatmospheric lifetimes measured from many decades toa century, with the consequence that there will besignificant quantities of these compounds present inthe atmosphere throughout the twenty-first century. Asan example, the mixing ratio of CCl2F2 is expected,with no further additions, still to be 200 p.p.t. in theyear 2100, 75 p.p.t. in 2200, and about 28 p.p.t. in theyear 2300. However, because the major contributors tothe ozone losses are the man-made chlorine andbromine compounds controlled by the MontrealProtocol, the amount of organochlorine in the tropo-sphere passed through a maximum around 1995.
The most recent WMO report has concluded (2003)‘over the time scale of the next 50 years, the strato-spheric ozone layer is expected to ‘recover’ from theeffects. However, because of other atmospheric
788 F. S. Rowland Stratospheric ozone depletion
changes, future ozone levels may differ from those inthe past’. They attributed the ozone losses near 40 kmaltitude to ‘purely gas phase chlorine chemistry’,the basic original prediction made by Molina andRowland 30 years earlier. The initially surprising lossesin the lower stratosphere in the polar regions weredescribed in this way: ‘heterogeneous chemistry in oron PSCs causes the conversion of stable chlorinereservoirs to more active forms. Ozone loss then occursthrough reactions involving chlorine and brominespecies’ (WMO 2003).
The major springtime losses in the Antarctic willprobably continue somewhat beyond the mid-twenty-first century. When the weighted effects of brominecompounds are added in, the peak in tropospherichalocarbon concentrations occurred a few years ago.With a delay time of 5–7 years for full equilibrationupward into the stratosphere, the ozone loss nowappears to be approximately at a balance point, andnormal year-to-year fluctuations will make it hard to becertain that ‘ozone recovery’ is actually underway foranother decade or more. During this half-century, theatmosphere will remain loaded with chlorine andbromine compounds, and a volcanic eruption—especially if much larger than Pinatubo in 1991,which was the largest in the past half century—mightcause increases in the particulate surface area in thestratosphere and cause for several years transitory largeozone decreases until the excess particulates settled outof the atmosphere.
Prominent among the ‘other changes in theatmosphere’ which might influence total ozonedepletion is the changing temperature structure of thestratosphere caused by the steady increase in green-house gases, especially carbon dioxide. One effect ofmore atmospheric carbon dioxide is to decreasetemperatures in the stratosphere, and this could leadto more extensive cloud formation, and more particu-late surface areas as well. The potential for substantialincreases in particulate surfaces, and consequentlymore extensive ozone depletion, is most likely to havean effect in the Arctic stratosphere where the tempera-tures are closer to the borderline for PSC formation.However, within the limitations just expressed aboutvolcanic or PSC surface areas, the threat of extensivefurther stratospheric ozone depletion during thetwenty-first century appears to be under control.
The present understanding of stratospheric chem-istry has made great forward strides in the past threedecades. Furthermore, the extensive atmosphericmonitoring programmes, which have now been insti-tuted around the world will continue to provideexperimental tests and verification of the validity ofour current understanding. The citation accompanyingthe 1995 Nobel Prize in chemistry used the phrase ‘oursalvation from a global environmental problem thatcould have catastrophic consequences’ in its descrip-tion of the scientific endeavours to that date concerningstratospheric ozone depletion. The succeeding decadeseems to have generally provided confirmatory datawithout big surprises on the ozone front, but thegreenhouse effect, global warming and abrupt climatechange are presenting much more forbidding scientific,economic and political challenges.
Phil. Trans. R. Soc. B (2006)
ENDNOTES1The troposphere extends from the surface to an altitude which
varies both with the latitude, reaching 17 km over the tropics and
6–10 km in polar regions, and the season, being slightly higher in
the summer months. The temperature decreases with increasing
altitude in the troposphere until it reaches the tropopause region
and then begins to increase at higher altitudes. This region of
rising temperature with increasing altitude is the stratosphere
which extends up to an altitude of 50 km. Ninety per cent of the
atmosphere is in the troposphere, with only 0.2% lying above the
stratosphere.2The measurement unit for atmospheric ozone has been named
the Dobson unit in his honour. The official definition is that one
DU is the thickness in units of hundredths of a millimetre that the
entire ozone column would occupy at standard temperature and
pressure (0 8C and one atmosphere). One DU represents about
2.69!1016 molecules cmK2 and is approximately one part in 109
of the molecules in the atmosphere. The global average ozone
content of the atmosphere is approximately 300 DU or 3!10K7
of the atmosphere.3Chemical notation frequently designates fractional composition
versus total weight, especially for liquids and solids. At other times
the fraction is compared to the total number of molecules,
expressed interchangeably as ‘mole fraction’ or ‘mixing ratio’.
Here, we use the mole fraction notation, and the US numbering
system: p.p.m., parts per million, 10K6; p.p.b., parts per billion,
10K9; p.p.t., parts per trillion, 10K12.4These three chlorofluorocarbons (CFCs) have been the major
formulations which have found extensive technical use. The CFCs
are often industrially identified by a numerical formula which gives
the number of F atoms in the units digit, number of H atoms plus
1 in the tens digit, and number of C atoms minus 1 in the
hundreds digit: CCl3F/CFC-11, dropping the 0 from 011;
CCl2F2/CFC-12, and CCl2FCClF2 / CFC-113. During the
past two decades, the hydrogen-containing species have been
distinguished from the fully halogenated CFCs by subdivision into
two new categories of HCFCs (e.g. CHClF2/HCFC-22) and
HFCs (e.g. CH2FCF3/HFC-134a, with the ‘a’ distinguishing
this molecule from its isomer HFC-134, CHF2CHF2. The new
description emphasizes the absence of Cl in the second case, and
their fairly rapid removal through tropospheric reaction with
HO—with less need for regulation—in both. Descriptions of the
CFCs in the technical and public literature often identify the
molecules only by these numerical designations. They are also
frequently described by the trademark names of the manufacturer,
of which the best known are the duPont ‘Freons’ such a Freon-12.
REFERENCESAdel, A. 1949 Selected topics in the infrared spectroscopy of
the solar system. In The atmospheres of the Earth and planets(ed. G. P. Kuiper), p. 269. Chicago, IL: University of
Chicago Press.Anderson, J. G. 1989 Free radicals in the Earth’s atmosphere:
measurement and interpretation. In Ozone depletion,greenhouse gases, and climate change, pp. 56–65. National
Research Council.Andersen, S. O. & Sarma, K. M. 2002 Protecting the ozone
layer. The United Nations History, United Nations
Environment Programme.
Anderson, J. G., Brune, W. H. & Proffitt, M. H. 1989 Ozone
destruction by chorine radicals within the Antarctic
vortex: the spatial and temporal evolution of ClO–O3
anticorrelation based on in situ ER-2 data. J. Geophys. Res.94, 11 465–11 479.
Angell, J. K. 1986 The close relationship between Antarctic
total ozone depletion and cooling of the Antarctic lower
stratosphere. Geophys. Res. Lett. 13, 1240–1243.Bates, D. R. & Nicolet, M. 1950 The photochemistry of
atmospheric water vapor. J. Geophys. Res. 55, 301–327.

Stratospheric ozone depletion F. S. Rowland 789
Bauer, E. 1979 A catalog of perturbing influences on
stratospheric ozone, 1955–1975. J. Geophys. Res. 84,
6929–6940.
Benedick, R. E. 1998 Ozone diplomacy. In New directions insafeguarding the planet, p. 449. Cambridge, MA: Harvard
University Press revised.
Blake, D. R. & Rowland, F. S. 1988 Continuing Worldwide
increase in tropospheric methane. Science 239,
1129–1131.
Booth, C. R. & Madronich, S. 1994 Radiation amplification
factors: improved formula accounts for large increases in
ultraviolet radiation associated with Antarctic ozone
depletion. In Antarctic research series (ed. C. S. Weiler &
P. A. Penhale), vol. 62, pp. 39–42. Washington, DC:
American Geophysical Union.
Booth, C. R., Bernhard, G., Ehramjian, J. C., Quang, V. V. &
Lynch, S. A. 2001 NSF polar programs UV spectro-
radiometer network 1999–2000 operations report., p. 219.
San Diego: Biospherical Instruments Inc..
Chang, J. S., Duewer, W. H. & Wuebbles, D. J. 1979 The
atmospheric nuclear tests of the 1950’s and 1960’s: a
possible test of ozone depletion theories. J. Geophys. Res.84, 1755–1765.
Chapman, S. 1930 A theory of upper atmospheric ozone.
Mem. R. Meteorol. Soc. 3, 103–125.
Chappellaz, J., Barnola, J. M., Raynaud, D., Krotkevich, Y. S.
& Lorius, C. 1990 Ice-core record of atmospheric
methane over the past 160,000 years. Nature 345,
127–131. (doi:10.1038/345127a0)
Chubachi, S. & Kajawara, R. 1986 Total ozone variations at
Syowa, Antarctica. Geophys. Res. Lett. 13, 1197–1198.
CIAP (Climatic Impacts Assessment Program) Monogr. 1,
1975. In The natural stratosphere of 1974 (ed. A. J.
Grobecker). Washington, DC: US Department of Trans-
portation, DOT-TST-75-51.
Cicerone, R. J. & Oremland, R. S. 1988 Biogeochemical
aspects of atmospheric methane. Global Biogeochem. Cycles2, 299–327.
Cornu, M.-A. 1879 Sur la limite ultra-violette du spectra
solaire. Compt. Rendus 88, 1101–1108.
Crutzen, P. J. 1970 The influence of nitrogen oxides on the
atmospheric ozone content. R. Meteorol. Soc. Q. J. 96,
320–325.
Crutzen, P. J. 1971 Ozone production rates in an oxygen–
hydrogen–nitrogen oxide atmosphere. J. Geophys. Res. 76,
7311–7327.
Crutzen, P. & Arnold, F. 1986 Nitric acid cloud formation in
the cold Antarctic stratosphere: a major cause for the
springtime “ozone hole”. Nature 324, 651–655. (doi:10.
1038/324651a0)
DeFabo, E. C. 2000 Ultraviolet-B radiation and stratospheric
ozone loss: potential impacts on human health in the
Arctic. Int. J. Circumpolar Health 59, 4–8.
DeFabo, E. C., Noonan, F. P., Fears, T. & Merlino, G. 2004
Ultraviolet B but not Ultraviolet A radiation initiates
melanoma. Cancer Research 64, 6372–6376. (doi:10.1158/
0008-5472.CAN-04-1454)
DeGruijl 1999 Skin cancer and solar UV radiation. Eur.J. Cancer 35, 2003–2009. (doi:10.1016/S0959-
8049(99)00283-X)
deZafra, R. L., Jaramillo, M., Parrish, A., Solomon, P. &
Barrett, J. 1987 High concentrations of chlorine monoxide
at low altitudes in the Antarctic spring stratosphere:
Diurnal variation. Nature 328, 408–411. (doi:10.1038/
328408a0)
Dlugokencky, E., Masarie, K., Lang, P. & Tans, P. 1998
Continuing decline in the growth rate of the atmospheric
methane burden. Nature 393, 447–450. (doi:10.1038/
30934)
Phil. Trans. R. Soc. B (2006)
Dutsch, H. U. 1970 Atmospheric ozone—a short review.J. Geophys. Res. 75, 1707–1712.
Etheridge, D., Steele, L., Francey, R. & Langenfelds, R. 1998Atmospheric methane between 1000 AD and the present:evidence of anthropogenic emissions and climatic varia-bility. J. Geophys. Res. 103, 15 979–15 993. (doi:10.1029/98JD00923)
Farman, J. C., Gardiner, B. G. & Shanklin, J. D. 1985 Largelosses of ozone in Antarctica reveal seasonal ClOx/NOxinteraction. Nature 315, 207–210. (doi:10.1038/315207a0)
Harris, N. R. P. & Rowland, F. S. 1986 Trends in total ozoneat Arosa. EOS 67, 875.
Hartley, W. N. 1881a On the absorption spectrum of ozone.J. Chem. Soc. 39, 57–61.
Hartley, W. N. 1881b On the absorption of solar rays byatmospheric ozone. J. Chem. Soc. 39, 111–128.
Heidt, L. E., Lueb, R., Pollock, W. & Ehhalt, D. H. 1975Stratospheric profiles of CCl3F and CCl2F2. Geophys. Res.Lett. 2, 445–447.
Homer 3000 BC (?) The Iliad. ‘As a huge oak goes downat a stroke from Father Zeus, ripped by the roots and agrim reek of sulphur bursts forth.’ Book 14, lines489–494 The Odyssey ‘Then, then in the same breathZeus hit the craft with a lightning bolt and thunder.Round, she spun, reeling under the impact, filled withreeking brimstone’ Book 12, lines 447–449 and Book14, lines 344–346 (duplicate passages) translations byRobert Fagles.
Johnston, H. S. 1971 Reduction of stratospheric ozone bynitrogen oxide catalysts from supersonic transportexhaust. Science 173, 517–522.
Jones, R. L., Pyle, J. A., Harries, J. E., Zavody, A. M., Russell,J. M. & Gille, J. C. 1986 The water vapor budget of thestratosphere studied using LIMS and SAMS satellite data.Q. J. R. Meterol. Soc. 112, 1127–1143. (doi:10.1256/smsqj.47411)
JPL (Jet Propulsion Laboratory) Publication 02-25 2003Chemical kinetics and photochemical data for use inatmospheric studies, Evaluation number 14.
Kerr, J. B. & McElroy, C. T. 1993 Evidence for large upwardtrends of ultraviolet-B radiation linked to ozone depletion.Science 262, 1032–1034.
Lovelock, J. E., Maggs, R. J. & Wade, R. J. 1973 Halogenatedhydrocarbons in and over the Atlantic. Nature 241,194–196. (doi:10.1038/241194a0)
McCormick, M. P., Steele, H. M., Hamill, P., Chu, W. P. &Swissler, T. J. 1982 Polar stratospheric cloud sightings bySAM II. J. Atmos. Sci. 3, 1387–1397. (doi:10.1175/1520-0469(1982)039!1387:PSCSBSO2.0.CO;2)
Migeotte, M. V. 1949 On the presence of CH4, N2O and NH3
in the Earth’s atmosphere. In The atmospheres of the Earthand planets (ed. G. P. Kuiper), p. 284. Chicago, IL:University of Chicago Press.
Molina, L. T. & Molina, M. J. 1987 Production of Cl2O2
from the self-reaction of the ClO radical. J. Phys. Chem.91, 433–436. (doi:10.1021/j100286a035)
Molina, M. J. & Rowland, F. S. 1974 Chlorine atom-catalysed destruction of ozone. Nature 249, 810–812.(doi:10.1038/249810a0)
Molina, M. J., Tso, T.-L., Molina, L. T. & Wang, F. C.-Y.1987 Antarctic stratospheric chemistry of chlorine nitrate,hydrogen chloride and ice. Release of active chlorine.Science 238, 1253–1260.
NAS (National Academy of Sciences) 1975 EnvironmentalImpact of stratospheric flight, biological and climatic effects ofaircraft emissions in the stratosphere. Washington, DC:Climatic Impact Committee.
NAS (National Academy of Sciences) 1982 causes and effectsof stratospheric ozone reduction: an update. Washington,

790 F. S. Rowland Stratospheric ozone depletion
DC, Commission on Chemistry & Physics. Ozonedepletion, Commission on Biology. Effects increasedsolar ultraviolet radiation. 339 pp.
Newman, P. & Schoeberl, M. 1986 October Antarctictemperature and total ozone trends from 1979–1985.Geophys. Res. Lett. 13, 1206–1209.
Nolte, P. 1999 Christian Friedrich Schonbein: Ein Leben furdie Chemie, Sonderreihe A der Metzinger Heimatblatter.Band 5, 312.
Prather, M., Midgley, P., Rowland, F. S. & Stolarski, R. 1996The ozone layer: the road not taken. Nature 381, 551–554.(doi:10.1038/381551a0)
Prinn, R., Cunnold, D., Rasmussen, R., Simmonds, P. K.,Alyea, F., Crawford, A., Fraser, P. & Rosen, R. 1987Atmospheric trends in methylchloroform and the globalaverage for the hydroxyl radical. Science 238, 945–950.
Rowland, F. S. 1990 Stratospheric ozone depletion bychlorofluorocarbons. Ambio 19, 281–292.
Rowland, F. S. 1991 Stratospheric ozone depletion. Annu.Rev. Phys. Chem. 42, 731–768. (doi:10.1146/annurev.pc.42.100191.003503)
Rowland, F. S. & Molina, M. J. 1975 Chlorofluoromethanesin the environment. Rev. Geophys. Space Phys. 13, 1–35.
Rowland, F. S., Sato, H., Khwaja, H. & Elliott, S. M. 1986The hydrolysis of chlorine nitrate and its possibleatmospheric significance. J. Phys. Chem. 90, 1985–1988.(doi:10.1021/j100401a001)
Rowland, F. S., Harris, N. R. P., Bojkov, R. D. & Bloomfield,P. 1989 Statistical error analyses of ozone trends: winterdepletion in the northern hemisphere. In Ozone in theAtmosphere (ed. R. D. Bojkov & P. Fabian), pp. 71–75.Hampton, VA: Deepak Publishing.
Sato, H. & Rowland, F. S. 1984 Paper presented at theInternational Meeting on Current Issues in our Under-standing of the Stratosphere and the Future of the OzoneLayer, Feldafing, West Germany.
Schmeltekopf, A. L. et al. 1975 Measurements of strato-spheric CFCl3, CF2Cl2 and N2O. Geophys. Res. Lett. 2,393–396.
Schutz, K., Junge, C., Beck, R. & Albrecht, B. 1970 Studiesof atmospheric N2O. J. Geophys. Res. 75, 2230–2246.
Scotto, J., Cotton, G., Urbach, F., Berger, D. & Fears, T.1988 Biologically effective ultraviolet radiation: surfacemeasurements in the United States, 1974 to 1985. Science239, 762–764.
Phil. Trans. R. Soc. B (2006)
Sekiguchi, Y. 1986 Antarctic temperature and total ozone
trends from 1979–1985. Geophys. Res. Lett. 13,
1206–1209.
Simpson, I., Blake, D. R., Rowland, F. S. & Chen, T.-Y. 2002
Implications of the recent fluctuations in the growth rate of
tropospheric methane. Geophys. Res. Lett. 29, 117-1–117-
4 plus supplementary data.
Singer, S. F. 1989 Stratospheric ozone: science and policy. In
Global climate change (ed. S. F. Singer), pp. 157–162. New
York: Paragon House.
Solomon, S., Garcia, R. R., Rowland, F. S. & Wuebbles, D. J.
1986 On the depletion of Antarctic ozone. Nature 321,
755–758. (doi:10.1038/321755a0)
Stolarski, R. & Cicerone, R. J. 1974 Stratospheric chlorine: a
possible sink for ozone. Can. J. Chem. 52, 1610–1615.
Stolarski, R. S., Krueger, A. J., Schoeberl, M. R., McPeters,
R. D., Newman, P. A. & Alpert, J. C. 1986 Nimbus 7
SBUV/TOMS measurements of the springtime Antarctic
ozone decrease. Nature 322, 808–811. (doi:10.1038/
322808a0)
Tolbert, M. A., Rossi, M. J., Malhotra, R. & Golden, D. M.
1987 Reaction of chlorine nitrate with hydrogen chloride
and water at Antarctic stratospheric temperatures. Science
238, 1258–1260.
Toon, O. B., Hamill, P., Turco, R. P. & Pinto, J. 1986
Condensation of HNO3 and HCl in the winter polar
stratosphere. Geophys. Res. Lett. 13, 1284–1287.
Weatherhead, E. C., Tiao, G. C., Reinsel, G. E., Frederick,
J. E., DeLuisi, J. J., Choi, D. S. & Tam, W. K. 1997
Analysis of long-term behavior of ultraviolet radiation
measured by Robertson–Berger meters at 14 sites in the
United States. J. Geophys. Res. 102, 8737–8754. (doi:10.
1029/96JD03590)
WMO (World Meteorological Organization) Report No. 16,
3 Volumes 1986, Atmospheric ozone 1985, Global ozone
research and monitoring project, 1150 p.
WMO (World Meteorological Organization) Report No. 18
Volume 1, 1990 Report of the International Ozone
Trends Panel, Chapter Four, ‘Trends in Total column
ozone measurements’, Rowland, F. S., Chair, pp.
181–382.
WMO (World Meteorological Organization) Report No. 47,
2003 Scientific assessment of ozone depletion: 2002,
Global research and monitoring project.