chapter 1 nmr relaxation in liquid...
TRANSCRIPT

Chapter 1
NMR RELAXATION IN LIQUIDCRYSTALS
Magnetic resonance spectroscopy probes the dynamics of condensed matter systems
in time scales ranging from 10"n sec to 10" * sec (corresponding to atomic dimensions
and to sizes of molecular aggregates respectively on the length scales). A typical
time domain magnetic relaxation spectroscopic experiment consists of stimulating
the system by external radiation to a known non equilibrium state and then moni-
toring the approach of the system ( i.e. the response of the system) to equilibrium
state. This process called relaxation, is characterized by the variation of one or more
macroscopic variables in time. The finite life time of fluctuations and hence of the
response function leads to a description of the dynamic properties like transport co-
efficients and responses for time dependent perturbations in terms of time dependent
correlation functions. In other words, the correlation functions result in a knowledge
of the details of instantaneous potential fields and hence of the dominant molecular
interactions, intensity and duration of forces (torques) etc. Thus relaxation theory
provides a link between the experiment performed at macroscopic time scales and
useful parameters characterizing the microscopic dynamics at molecular level. This
chapter gives a brief review of the relaxation mechanisms in liquid crystals. The basic
NMR relaxation theory is discussed briefly in the first section. The second section
discusses the relaxation due to various mechanisms in the different mesophases of a
1

liquid crystal. The theory connected with dipolar relaxation, which probes the slow
molecular motions is explained in the third section.
Section - 1
1.1 NMR relaxation theory
NMR deals with the interaction between nuclei having a magnetic moment, fl (spin
angular momentum, J and gyromagnetic ratio 7) and an external dc magnetic field
resulting in equally spaced energy levels. The presence of these energy levels
can be detected with a time dependent interaction causing transitions between these
levels. The macroscopic process which causes the evolution of the system from the
initial excited state (non equilibrium state) to the final equilibrium state through
energy exchange with the surroundings is termed as relaxation. Depending on the
agents of the energy exchange, the relaxation process can be spin-spin or spin-lattice
relaxation process. Spin-spin relaxation (with a time constant, T2) corresponds
to relaxation through redistribution of energies within the spin system and hence
no change in entropy of the system. On the other hand, spin-lattice relaxation
(with a time constant, T\) is the process of energy exchange between the perturbed
spin system and other degrees of freedom of the system (lattice or bath) through
fluctuations in the surrounding electromagnetic fields, resulting in a change of entropy
of the system. The lattice can be of many possible forms such as molecular rotations,
diffusion, lattice vibrations etc.
Thus, a measurement of T\ gives information about the time modulation of the
fluctuating local fields surrounding the spin system, B/oc(<). These local fields are the
dipolar fields arising due to interaction with the surrounding dipoles. The different
atomic or molecular interactions (leading to the fluctuating fields) can be described
by the appropriate time dependent correlation functions or the related Fourier inten-
sities (spectral densities). The characteristic time, rc associated with these motions
can be obtained by measuring the correlation functions over a time interval or the
related power spectrum over a frequency range. Thus a frequency dependent study
2

of NMR relaxation rate probes the power spectrum for possible information about
the fluctuating molecular dynamics i.e., the measurement of nuclear spin-lattice re-
laxation time, T\ yields the spectral density, J(u), which is the Fourier transform of
the autocorrelation function for the corresponding motions.
1.1.1 Spin lattice relaxation
Different approaches viz., quantum mechanical time dependent perturbation theory
(Bloombergen et al. 1948 ; Abragam, 1961), spin temperature concept (Goldman,
1970 ; Wolf, 1979), density matrix formalism (Wangsness and Bloch, 1953 ; Slichter,
1978) etc. lead to the following expression for the spectral density and hence the spin
lattice relaxation rate
(1.1)
Here Gm(r) qunatifies the correlation between the random functions B/oc(0 at times
t and t + T and is given by the ensemble average of the corresponding fluctuating
Hamiltonian as
Gm(r) =<B;oe(t)Bloe(t + r)>av (1.2)
Considering the fluctuations in Bioc(t) to be stationary and Markovian in time, the
correlation function can be written as
Gm(r) = <| J5/oc(0) |2> e-"'« (1.3)
where TC is the correlation time. The corresponding spectral density function is a
Lorentzian (i.e J(u>) oc rc/(l +U>2TC2). In the case of dipole dipole interaction between
two like spins separated by a distance r, the relaxation rate can be written as (Slichter,
1978)

The constant C in eqn. (1.4) depends on the geometery of the spin system and the
type of dynamics under consideration. Ji(u>) and J2(2u>) are the spectral densities at
frequencies u> and 2u> respectively. The subscripts 1 and 2 correspond to one spin flip
and two spin flips respectively.
By considering the additional non-secular broadening effect (Kubo and Tomita
1954 ; Solomon, 1955), the above equation can be modified as
7T1 = C\ {Mu>) + J2(2w)J (1.5)
If different molecular motions are present in a system (each one mediating the relax-
ation process with its own individual spectra] density function) which are independent
of each other, the total relaxation rate is obtained as a sum of individual relaxation
rates i.e.,
where A denotes the type of mechanism. Thus in any system, estimate of the to-
tal relaxation rate involves modelling different molecular motions and computing the
corresponding contribution from each mecihanism to the relaxation.
Section - 2
1.2 Spin lattice relaxation theory of liquid crystals
The anisotropic nature of liquid crystalline medium leads to partial averaging of the
different magnetic interactions. This results in a collection of different components of
the interaction Hamiltonian with dissimilar correlation times. Thus, the anisotropic
(1.6)
(1.4)
4

nature of the medium complicates the separation of the different dynamics occuring
in the medium and hence necessitates more experimental data to interpret the re-
sults in terms of the theoretical models when compared to either isortopic liquids or
solids. Investigation of molecular dynamics in these systems have revealed the pres-
ence of three major dynamic processes contributing to relaxation. The 7i profile of
liquid crystals is usually dominated by collective fluctuations at low frequencies (nor-
mally a few MHz or below), molecular self diffusion at high frequencies (of the order
of a few MHz and above) and molecular rotations about different axes in the high
frequency region (order of MHz). Further cross relaxation due to other nuclei like
nitrogen are also present at very low frequencies (< MHz). Apart from the above,
pretransitional phenomena like onset of orientational order at nematic-isotropic tran-
sition, the layer formation at the nematic-smectic A transition show profound effect
on the relaxation rate, close to the phase transition temperatures.
However, each of the mechanism described above has its own characteristic tem-
perature and frequency dependence. Hence these contributions can be separated
using an elaborate frequency and temperature depndent study of the relaxation rate
(relaxation spectroscopy). The details of these mechanisms that become dominant
at different temperature regions (as the liquid crystalline system is cooled from the
isotropic phase to solid phase) are given below.
1.2.1 Isotropic phase
Well inside the isotropic phase, there is neither positional nor orientational ordering
and all the dynamic processes except self diffusion are fast compared to normal NMR
time scales (thus leading to a temperature and frequency independent relaxation rate).
Torrey's theory (1953) for isotropic diffusion of liquids can be extended to the
anisotropic systems appropriately. The inter molecular dipole-dipole interactions are
modulated by the self diffusion process, which can be considered as a limiting case of
the random flights model (Chandrasekhar, 1943).
The correlation functions for the inter molecular dipolar interaction, modulated
by the diffusive motion of the molecule are given by
5

(1.7)
where < >Av(t) represents the time average. The functions F^{t) which are the space
part of the non-secular component of the dipolar interaction are given by (Slichter,
1978)
where P(r,ro,t)dr is the probability that the spin j located at r0 at t = 0 relative to
spin i, will lie at time t within the volume elememt dr located at r relative to the new
position of i. /(r0) is the initial spin density. Considering N to be the total number
of spins, N~1f(ro)dro is the probability that at time t = 0, spin j is located in dro at
r0 relative to spin i. The function P(r,ro,<) can be found from the theory of random
flights as follows (Chandrasekhar, 1943).
Assuming that every position of the spin is statistically equivalent i.e., at any
position the probability of the spins occupying a new position r in volume element
dr relative to the previous position (after a single flight) is the same (designated by
Pi(r)dr), Pn(r)dr after n flights is given by
(1.10)
6
(1.8a)
(1.86)
(1.9)
where r,j, 0tJ and faj are the spherical coordinates of spin j relative to spin i. In
evaluating the spectral density functions, the time averages in eqn. (1.7) are replaced
by the ensemble averages. Thus

Here the integration is over the entire q space and A(q) is the Fourier transform of
Pi (r) given by
(1.11)
The probability P(r,t)dr that a spin initially at the origin will be located at r in dv
after a time / is
(1.12)
where wn(t) is the probability that n flights take place in time <, for which a Poisson
distribution is assumed i.e.,
r bring the time between the flights. The summation in eqn. (1.12) includes the term
TI = 0, where Po(r) = S(r) and 6(r) is the three dimensional S function. Substituting
eqn. (1.13) and eqn. (1.10) in eqn. (1.12), the expression for P(r, t) and hence
/J(r, ro,<) can be calculated. Transforming to a relative centroidal coordinate system
with r = r, — r, and R = |(rj + rt) (where r, and r, are the position vectors of spins
i and j relative to a common origin) and finally integrating over all positions and
substituting for the correlation functions with appropriate initial spin density, /(r0),
the spectral density can be calculated.
For isotropic diffusion which corresponds to uniform spin density, the correlation
function A'! is given by
7
(1.13)
(1.14)

where 'a' is assumed to be the closest possible distance of approach of two nuclei. The
corresponding spectral density is given by
The possible choices of A(q) can be limited to three cases.
Case (i) : u>r > 1
Since r is assumed to vary with temperature as r = ToeEa^kT for a thermally
activated process, this case corresponds to the low temperature asymptote of 7\ i.e.
where n = /(r0) represents the uniform spin density. Expansion of c" i q r and eiqr°
in terms of Legendre and Bessel functions results in
(1.15)
(1.16)
(1.17)
(1.18)
(1.19)
K2(t) = AKl(t)
J2(w) = 4Ji(u;).
and
A similar calculation for K2{t) results in
Equation (1.14) can be simplified to

i.e., Ji(u>) oc (W'T)"1 . Thus
T, oc u,2r = u2roeE^kT (1.22)
Case (ii) : WT < 1
In this case, UJT = 0 and hence the spectral density is given by
Since the integral in the above equation always converges, the spin lattice relaxation
rate {T{1) is given by
Tf1 oc J^LJ) oc T (1.24a)
or
This case corresponds to a higher temperature asymptote for Tj which is just the
opposite of case (i). It is seen that whenever the frequency LJ is in between these two
cases, there exist a particular r for which the relaxation rate is maximum (and hence
T\ is minimum).
9
(1.246)
(1.23)
(1.21)
Hence 1 — A(q) <C 1 can be neglected and the spectral density can be simplified as
Case (iii) : < r2 » a2
This is a special case for which the mean flight path is long. The function [1 — A(q)]
vanishes for q = 0 and approaches unity for large q. The value of Pj{r) is very small
and hence
( 1 - 2 5 a )
Thus
The above two equations have the well known forms appropriate to an exponentially
decaying correlation function with a correlation time rc = T /2 and the T\ minimum
obtained from eqn. (1.25b) when u?r = >/2 is given by
(where D is the diffusion coefficient) corresponds to A(q) = [1 + Drq2]~l which is
mathematically the simplest form for ^4(q) satisfying all the conditions that can be
imposed for an acceptable form. Substituting in eqn. (1.23), the spectral density is
obtained as
where J is the Bessel function given by
10
(1.28)
(1.27)
(1.26)
Case (iv) :
Assuming special forms for P\{r) and A(q), say

Simplifying eqn. (1.28) (Torrey, 1953) results in
The function /(a,x) is given by
a = < r2 > /12a2 ; x = (ua2/2D)1/2 (1.326)
Hence the expression for the relaxation rate (in terms of J\(u>) and J2(2a;)) is given
by
(1.29)
(1.30)
(1.31)
(1.32a)
(1.33)
11
Let
Then, u and v can be expressed as
with u and v defined in terms of a and x as
and
where <}>(ot,x) = /(a, a:) + f(a,y/x). In the limit, wr > 1, the spectral density term
and hence the relaxtion rate reduces to the uT2 law. Similarly for LJT >• 1, it can be
shown that 2J"1 oc u;1'2, i.e.
(1.35)
where F and C are constants related to the diffusion coefficient D and are given by
(Harmon and Muller, 1969)
F = - 4.77 x 10"14 (1 + 6)D~3/2 (1.36a)
C oc ZT1 (1.366)
1.2.2 Near the Isotropic-nematic transition (TV/)
Not too far from the transition temperature (typically about 10 to 15Cabove TNI)
local nematic clusters start forming (Wade, 1977). The molecules are locally parallel
to each other along an average direction n, with a short range order described by
a coherence length £. These clusters are stable for short intervals of time. The
formation and breaking of the local nematic clusters gives rise to fluctuations in the
dipolar interaction of the nuclear spins (ordered fluctuations) resulting in a signifi-
cant contribution to the relaxation and hence pretransition phenomena (Luckhurst,
1988). If the short range order is long lived compared to the time scaleSof NMR
measurement (aT1), then the 7\ is not sensitive to these fluctuations. On the other
hand, if the order fluctuations are in the time scales of the Larmor frequency (~ u;"1),
then Ti is sensitive to these fluctuations.
The above explained nematic order can be quantified in terms of the microscopic
order parameter (de Gennes, 1974)
12
(1.34)
2J"1 = C - Fu?'2

(1.37)
i, j and k being the ortho normal unit vectors, a and /? are the indices refering to the
laboratory frame, the average is the ensemble average taken over all the molecules.
Sij and 6Qp represent the Kroneckar symbols. The symmetric nature of the liquid
crystalline molecules (de Gennes, 1974), then a suitable transformation into a digaon-
alized form and finally the imposition of the uniaxial nature of the molecules reduces
the order parameter into a simple scalar quantity given by
where 0 is the angle between the direction of the long molecular axes and the average
direction of the medium n, called the director. This definition of the order parameter
is compatible with the usual case of S = 0 for isotropic liquids and S = 1 for a solid.
The mean square amplitude of the fluctuations and the correlation times associ-
ated with these fluctuations can be obtained from Landau - de Gennes theory (de
Gennes, 1974), according to which free energy density, g(S,T) which can be expanded
in powers of order parameter, S = S(r,t) as
13
(1.38)
(1.39)
as
The presence of the cubic term ensures that the transition is first order and the
presence of ordered fluctuations are reflected in the gradient term where C is a positive
elastic constant of the medium. The coefficient A should be small below the transition
temperature and should diverge critically for T > T^j and hence is expected to vary
(1.40)
rq = T~lI[A{\ + q2£2)], where F"1 is average viscosity of the medium for long wave-
length fluctuations and Tq tends to oo as T —• TNI.
The spin lattice relaxation rate due to the modulation of intra molecular dipolar
interaction can be obtained from the corresponding correlation functions and hence
the spectral densities. The interaction Hamiltonian for the pair wise dipolar interac-
tion between two protons, Lft.protons of a benzene ring separated by a distance r is
given by
(1.44)
14
(1.42)
(1.43)
(1.41)
For A > 0 i.e. T > T/v/, the equilibrium value of S is zero. The nemalic order
parameter, S(r,t) can be written in terms of the Fourier components S(q,t) as
in order to explain the spatial dependence of the director. Replacing the summation
by integration to include the entire volume, the free energy can be written as F =
where £ = (jj is the coherence length and it measures the distance over which the
local nematic order persists in the isotropic phase. The characteristic time, rq for
the persistence of q modes is given from the Landau-Khalatnikov's equation (Landau
and Khalatnikov, 1954) as

Substituting eqn. (1.44) in the expression for the correlation function, J^{UJ) is ob-
tained as
The autocorrelation function and the spectral density function for the above Hamil-
tonian are written as
Using the equipartition theorem in equ. (1.42), the mean square fluctuations in the
order parameter are expressed as
Replacing the summation in eqn. (1.48) by an integration from 0 to an upper cutoff
15
where HL = 7^/r3 and the nematic director n is given in terms of the order parameter
S of the system as
and
(1.46)
(1.49)
(1.47)
(1.48)
(1.45)
Here, qm = n/I with / being the length of the molecule. The integral in the above
equation is solved separately and is given by
Here r = CT/£2 is the correlation frequency and xm = CTq^ is the upper cutoff
frequency. For temperatures T away from the transition, T^/ ,r <C £m and u; <C xm
and hence the upper limit can be taken as xm —* oo. Solving for Ii gives
16
wave vector, qm (which cannot be assumed to be oo due to the finite dimension of
the molecule) to include all the q modes results in
(1.50)
(1.51)
Thus T\ is strongly dependent on temperature but independent of frequency.
(1.53)
(1.52)
In this context, two limiting cases can be considered depending on the relative values
of Larrnor frequency and the cutoff frequencies.
and hence
Case (i) u; <C r = u>c

Case (ii) u> » r = UJC
Thus
(1.54)
In this case, Ty is proportional to the square root of frequency but is independent
of temperature. This situation is close to TNI where £ becomes large and hence r is
small (Blinc, 1976 ; Ghosh, 1976 ; Ghosh et al. 1980).
1.2.3 Nematic phase
The long axes of the molecules in the entire sample tend to align parallel to each other
along an average direction and any unit vector no along this preferred direction is
known as the nematic director, which may vary locally throughout the medium (Fig.
1.1). There is no long range correlation of molecular centers of mass and hence, the
molecules move freely i.e., the nematic phase is fluid like. Thus, the nematic phase is
characterized by long range orientational but no positional order. Due to the lack of
translational order, the molecules are not rigidly fixed and hence any distortion (either
due to external forces or boundary conditions) leads to simple rotation around the di-
rection of molecular axis resulting in smaller elastic energies compared to solids. This
small angle deformations from equilibrium postions are termed as curvature strains
and the restoring forces are termed as curvature stresses or torques. The cooperative
small angle rotations of the liquid crystalline molecules about their short axes, due
to thermal fluctuations, result in a special kind of collective motions called order di-
rector fluctuations (ODF). Due to the large number of molecules involved, a major
part of these fluctuations contribute to the relaxation at low frequencies compared
to the Larmor frequencies of conventional NMR. These coherent fluctuations along
17

Fig. 1.1 The arrangement of molecules in different mesophases of liquid crystals
(a) Nematic phase, with orientational order but no positional order(b) Smectic—A phase, with layer formation and nematic order in each layer
(c) Smectic — C phase, with tilted nematic order in each layer(d) Smectic —B phase, with layer stacking and correlation among moleculesin neighboring layers.
with reorientations and self diffusion form the dominant relaxation mechanisms in
this phase and the details are discussed below.
Order director fluctuations
The precise role of the collective (coherent) fluctuations in mediating the spin lat-
tice relaxation processes of nematic fluids continues to attract both theoretical and
experimental attention. Though several theories describing this mechanism are avail-
able in literature, fundamental limitations regarding the separation of these coherent
fluctuations from the individual molecular reorientations and the role of cutoff fre-
quencies in deciding the range of frequency over which these fluctuations occur still
exist.
The nematic director n(r, t) is considered to be aligned along the direction of
the magnetic field. The orientations of the molecule vary in space giving rise to
fluctuations of the director around the equlibrium direction i.e. an average direction
n0 parallel to the z-axis i.e.
(1.55)
6n = (6nT,6ny,0) is the fluctuation around n0 and is normal to no with | n |2 = 1.
Three distinct curvature strains can be defined in the nematic medium (Fig. 1.2)
and any arbitrary deformation can be considered as a combination of these basic
deformations (deGennes, 1974). Referring to a coordinate system x,y, z with the
-r-axis parallel to the director, the different possible components of curvature strains
are splay [fr,fr], bend [fc.fr] and twist [fc f-fc] (Fig. 1.2). Thus the freeenergy density of the medium associated with any deformation in the director can be
expanded in terms of these curvature strains as (Doane and Johnson, 1970 ; Blinc,
1976)
(1.56)
18

Fig. 1.2 The three types of deformations in nematic liquid crystals. The double arrows
emphasize the non-polar nature of nematics.
(a) Splay deformation with V.n ^0
(b) Twist deformation with n.(V x n) / 0
(c) Bend deformation with n x (V x n) ^ 0
The fluctuations are expressed in terms of a set of periodic distortion modes (though
this description is not reliable when the fluctuations are really large i.e., close to T^j)
so as to empahsize the spatial dependence of the orientations of the local director
(Blinc, 1976) as
(1.57a)
where V is the volume. The total deformational energy responsible for restoring the
instantaneous director to its equilibrium direction is then given by
Here q\ = q\ + gj. The transverse modes no(q,<) relax exponentially as na(q,t) =
no(q,0)exp(-</(ro(q)) with a damping time given by
where r^a = T~l is closely related to the appropriate viscosity coefficient. The fre-
quencies of the two transverse modes go to zero in the long wavelength limit (q —• 0)
19
(1.58)
(1.59)
(1.60)
(1.576)

in the nematic phase (l)oane and Johnson, 1970). The mean square amplitude of
each mode is obtained from the equipartition theorem as
The spectral densities as before are obtained from the correlation functions associ-
ated with these fluctuations leading to the modulation of the intramolecular dipolar
interactions. However, these correlation functions have to be transformed from the
magnetic field fixed frame (laboratory frame) to the director fixed frame and finally
to the molecular fixed frame through proper Wigner rotation matrix elements (Doane
and Johnson, 1970). Such a transformation results in
Here S = \ < 3 cos2 0 — 1 > is the nematic order parameter and the term A in the
function /(A) is the angle between the magnetic field and the director. The functions
/(A) are given by
Introducing the Fourier components of the director fluctuations of the nematic order
(eqn. (1.57)) the spectral density is given by
(1.61)
(1.63)
(1.64)
20
The corresponding spectral density is given by
(1.62a)
(1.626)

By considering the upper cutoff frequencies of the modes to be infinity, these theories
predicted a w"1^2 dependence for the relaxation rate due to colective fluctuations.
However, since the ODF modes should be restricted by a longest and shortest possible
wavelenghts, the existence of an upper and lower bound for frequencies is to be
considered. The limitations for short wavelength and hence upper
cutoff frequency come from the molecular dimensions, a"1 (a being the size of the
molecule). However, it is inconsistent to allow for cutoff wavevectors upto a"1 and
at the same time assume that molecules undergo free rotational diffusion about the
local director. By considering suitable high cutoff frequency LJC (Blinc et al. 1969 ;
Doane and Johnson, 1970 ; Lubensky, 1970), the expression for J\(u>) can be written
as
(1.676)
where Ac - (3kT)/(2n2K), u>c = (ql/rj) and the cutoff function U(uc/u) is given
by
21
Isotropic visco-elastic coefficients
Earlier theories (Pincus, 1969 ; Doane and Johnson, 1970, Doane et al. 1974 ;
Ukelejaet al. 1976) which considered the visco-elastic coefficients to be isotropic (i.e.,
A'i = A'2 = A'3 = A' and ^ = r\2 = 77), resulted in a simplified expression for the
lifetime of each mode as
(1.65)
(1.66)
(1.67a)

Neglecting the wave vector dependence of viscoelastic coefficients, the above equation
can be simplified for different limiting cases given below. The cutoff frequencies u>oc
and u)zc are given by
(1.70)
(1.68)
(1.69)
22
The high frequency cutoff uc is usually assumed to be determined by the length of
the molecule i.e., Ac = 2w/qc ~ 30A. For typical values of K ~ 0.1 to 1 /zdyne and
t] = 0.1 poise ; this corresponds to cutoff frequencies in the range of rf frequencies,
(1-200 MlhJ.
Anisotropic viscoelastic constants :
For nematics which have underlying smectic phases, the elastic constants are no
more isotropic (the bend (7\3) and twist (K2) elastic coefficients diverge critically as
the nematic - smectic-A transition is approached) (de Gennes, 1972 ; Brochard, 1973
; de Jeu et al. 1973). Hence the one constant approximation is no longer adequate in
evaluating the spectral density (Brochard, 1973 ; Blinc et al. 1975 ; Blinc, 1976)
Thus to include the anisotropic nature of the viscoelastic coefficients, the summa-
tion over the modes in eqn. (1.65) is replaced by integration over a cylindrical volume
from zero to the high cutoff frequencies (qzc = 7r//, q±c = n/a, I and a being of the or-
der of the molecular length and width respectively) instead of the originally assumed
spherical volume (Pincus, 1969). The resulting spectral density can be written as
This case is in general valid for normal range of Larmor frequencies (< 100 MHz)
and the spectral density (and hence relaxation rate) results in a square root depen-
dence of frequency i.e.
where C" = (fh(A)S2kT)/{2n2). In other words, the elastic continuum theory can
be used for the whole range of q values and the integration over q can be performed
from zero to oo in the nematic phase.
Case (ii) : ujac » a; >• u;2C
In this case
<«*>
and hence
(1.71)
(1.726)
(1.73)
and hence
23

case (iv) w,f > u> > u>oc
In this case(1.74)
i.e., the spectral density is independent of frequency.
Since the Blinc's expression (1976) does not reduce to the one constant approxi-
mation (Pincus, 1969), Void and Void (1988) modified Blinc's treatment given above
by integrating over a rotational ellipsoid instead of a cylindrical volume to obtain the
spectral density as .
The above equation differs from that of Blinc's expression (1976) in that the upper
limit of the integral over qx has been modified to represent an ellipsoidal volume,
whose cross section in the {qT,qy) plane is a circle of radius q± c and the maximum
excursions along qz axis are ±qzc. Integration of the above equation first with respect
to qj. yields
The final expression for J\(u) can be written as
24
Defining
(1.77a)

The expression for the one constant approximation can be recovered from the above
equation since the ellipsoid of integration reduces to a sphere and AQ —> Ba i.e., D —*
0 for the isotropic nature of elastic constants. The principle difference between this
expression and that of Blinc (1976) obtained with cylindrical volume of integration
is in the cutoff region (Void and Void, 19S8). The contribution from ellipsoidal
volume of integration is smaller than the Blinc's expression ; the maximum ratio (i.e.,
Ji(cylindrical)/t/i(ellipsoidal)) of 1.5 is obtained when B\ —» 0. This limit is rarely
reached in typical range of NMR frequencies. The frequency dependence of Ji(w) as
a function of the three elastic constants for different combinations is shown in Fig 1.3.
. Here a variation of A'3 between 1 xl2~1 0 and 1 x 10"2 dyne with other parameters
chosen as S = 1, T = 298.2 K, 77, = r/2 = 0.5 poise, Kx = K2 = 10~6 dyne and cutoff
wavelength, Xzc = 2*1 q2C and \±c = 27r/</Xc of 30 A resulted in a cutoff frequency of
140 MHz. The plot can be roughly divided into three regions (the region in between
the vertical lines is typically covered by conventional NMR experiments). The solid
line in the figure corresponds to the isotropic case A'i = K2 = A'3 and represents the
well known a;"1/2 behavior for frequency far below the cutoff frequency. For Larmor
frequency well above the cutoff frequency u;c, the absolute value of Jj is small and
drops off as a;"2. The different conditions for the frequency dependence of J\(UJ)
above and below the director mode cutoff frequencies, for different combinations of
the visco-elastic coefficients is given in Table. 1.1.
25

Fig. 1.3 Variation of spectral densities Ji(u>) with Larmor frequencies, for different
distortion coefficients Ku K2 and K3 (Void & VoldL, 1989). The region in
between the vertical lines is the region typically covered by conventional
NMR.

Table 1.1 : Frequency dependence of J (co) below and above the
director mode cutoff
Two distinct limiting cases can be observed from Fig. 1.3
Case (i) : u; < ue
In the region where w < w c the frequency dependence of J\ (u;) is seen to vary from
-1 to -1/2 as the value of A'3 changes from A'3 <C A'i, K2 to K3 >- A ' I , A"2 respectively.
This case is similar to the 2d case as invoked by Marquese et al. (1984) to explain
the frequency dependence of lipid bilayers.
Case (ii) : UJ ^> u>c
In this case, J](u;) varies from u~2 to u>~3/2 as K3 is varied from A'3 < h\,K2 to
A 3 ^> A i, A 2 •
The situation where A'3 <C K\% K% is equivalent to pseudo 2d systems in which the
bend elastic term, A'3 does not contribute to the free energy and hence the relaxation
mechanism for such systems results in a u;"1 dependence of J\{u) at low frequencies.
Thus depending on the particular combination of elastic constants and viscosities,
some what steeper frequency dependence than a;"1/2 can occur - especially as the
Larmor frequency approaches u>c.
Often the cutoff frequencies for nematic liquid crystals occur in a broadened fre-
quency range (1 - 100 MHz). Accordingly, the spectral density measured over a
limited frequency range may show a frequency dependence between u~ll2 and u;"1 or
^-3/2 This treatment though seems to be the most complete and recent, does not
take into account the possible coupling of the fluctuations and individualmolecular
reorientations (Freed, 1977 ; Zientara and Freed, 1983 ; Gertner and Lindenberg,
1991)
Self diffusion
The usual macroscopic description of diffusion through the random flights used for
isotropic liquids with an average diffusion coefficient (D = < r2 > /6r , where < r2 >
is the mean square flight distance of the molecule and r is the mean time between each
flight ) is not sufficient to describe the diffusion in liquid crystals since, the ordering
in these systems leads to anisotropy in diffusion coefficients, D|| (diffusion coefficient
along the director) and Di (diffusion coefficient along a direction perpendicular to
26

the director). Zumer and Vilfan (1978) have extended Torrey's theory for isotropic
liquids (discussed in section 1.2.1) to anisotropic medium by taking into account the
anisotropy of molecular diffusion, the cylindrical shape of the molecule and the specific
distribution of spins along the long molecular axis to obtain the relaxation rate for self
diffusion. Following the notation of Torrey, the random correlation functions which
on Fourier transform give the spectral densities are given by
where
(1.79)
Here D\\ and D± are the diffusion coefficients in the directions parallel and perpen-
dicular to the director, no-
27
Here £ = £, — £,, £,- and £, are the vectors from the molecular centers to the ]th and ith
spins. />, z and <f> are the cylindrical cordinates of r, the distance between the centres
of nearest neighbor molecules.
The anisotropic diffusion tensor, given by
can be written in terms of the components of D°, the diffusion coefficient of a perfectly
ordered mesophase (Blinc et al. 1974). The anisotropic diffusion constant describes
the solution of the diffusive motion i.e.,
(1.81)
(ISO)
(1.78)
A proper choice of ;>j(r) (explained in 1.2.1) is
where r is the mean time in between flights which gives the mean square jump length
< r2 ( 0 >= (4J5J + 2£>jj )t. The effective diffusion constants are given by
( L 8 4 6 )
Here D0^ and Djj are the macroscopic self diffusion constantsof the perfectly aligned
liquid crystalline phase. Substituting eq. (1.84) in eqn. (1.83), A(q) can be obtained.
Considering the static pair correlation function (which partly correlates the final
positions of the two molecules) to be of a simple square well function, (Zumer and
Vilfan, 1978) i.e.,
g ( p , z ) = 1 ; | z | < / and p > d or \ z \ > I (1.85)
= 0 ; p < d a n d \ z \ < l
and the spins to be distributed uniformly along the long molecular axis, the relaxation
rate can be obtained as (Zumer and Vilfan, 1978)
and the corresponding Fourier transform
and
28
(1.82)
(1.83)
(1.84a)

The function Q in the above equation is dimensionless and can be obtained numer-
ically. The variation of Q as a function of u) (in the frequency range UJT = 0 to
UJT = 10), when / = 2bX , d = 54, //d = 5 is given in Fig.1.4, for three different
values of < r j > /d? viz., 1, 0.1 and 0.01. The value of DpDl is taken from different
experimental data as two (Yun and Frederickson, 1970 ; Kruger and Spiesecke, 1973
; Zupancic et al. 1974) and does not differ much for different nematic compounds.
The main features observed are
(i) When UJT —> 0, the ratio < r\ > /<P increases from 0.01 to 1 and hence the
relaxation rate due to self diffusion increases.
(ii) For low values of UJT, Tf1 ex constant — (UJT)1/2 and in the high frequency limit,
7J"1 ex u)~2 andare similar to the isotropic case. This is also clear from the
Fig.1.5 , where the ratio R of T{^aoIT^niao is plotted as a function of UJT when
Diao = D^riao — d and r is equal in both the cases. It is observed that R
is equal to a constant (1.4) as the frequency is increased till UJT ~ 0.1. This
constant region is followed by a small increase in R until it reaches a marginally
higher contant value in the high frequency region. The change in the value of R
can be minimized to 5% by a suitable choice of D. Thus the Torrey's expression
of isotropic diffusion itself, reduced by a factor of 1.4, can explain the relaxation
due to SD in nematic phase in the frequency region of the present work i.e.,
where (Tj ^jorrey is given by eqn(1.34)
Reorientations :
At frequencies above 106 Hz which is in the range of conventional NMR frequency,
molecular rotations also form a major part of the relaxation spectrum and are to be
(1.86)
(1.87)
29

Fig. 1.4 Frequency dependence of Q oc (Ti 1)SD, for three different jump lengths inthe nematic phase (Zumer et al. 1978).

Fig. 1.5 Frequency dependence of the ratio R = (T1~1)iao/(J'f1)omao in the nematicphase (Zumer et al. 1978).

considered. The anisotropic nature of the molecules results in three different types
of rotational motions (Blinc et al., 1978) viz., (a) fast reorientations around long axis
(b) reorientations about short axis and (c) the reorientations of the end chains. Thus
the theory for Ti relaxation due to rotations should in principle include the effect of
all the above rotational reorientations i.e., relaxation by diffusion jumps of ellipsoid
like molecules about their long and short axes and relaxation by the reorientaions of
CH2 and C//3 groups.
The different correlation times of interest are T/ and r, for rotations of the en-
tire molecules about their long and short axes respectively and TCH2 &n^ rc//3 for
rotations of CH2 and CH3 groups. There are evidences from dielectric experiments
(Rondelz and Mircea-Roussel, 1974 ; Agarval and Price, 1974) and neutron scattering
experiments (Jatiik et al., 1973, 1974) that the molecules in nematic phase rotate
much faster about long axis with time scales well outside the normal NMR frequency
range and hence these rotations do not contribute to relaxation. In other words, only
ra is of major significance. Since the rotations of C#2 and C//3 occur in parallel with
fast rotations of molecules about long axis, it follows that even these do not effect
the relaxation rate. The relaxation rate for rotation about the short molecular axis
is written in the BPP form (Bloembergan et al. 1948) as
where t measures the anisotropy of local reorientations around short axis. The con-
stant C for a molecule consisting of aliphatic groups in the core and aromatic groups
in the end chains is given by
where Uk stands for the ratio of protons belonging to kth group to the total number
of protons in the molecules. /*s are cosinesof angle between internuclear vector r* of
kth group and the long axis.
30
(1.88)
(1.89)

1.2.4 Nematic - smectic-A transition (T > TAN)
The important feature of smectic phase which distinguishes it from nematic phase
is its stratification (Fig. 1.1). The molecules are arranged in layers with correlations
in their positions (and hence an additional ordering apart from the orientational or-
dering). Since the correlation between the molecules in each layer dominates the
correlation between adjacent layers, the layers are free to slide over each other. De-
pending on the degree of positional ordering and symmetry properties, smectics have
been classified into different categories. The molecular arrangement in different smec-
tic phases is explained below.
SA: This is an uniaxial phase, with molecules within each layer aligned perpendicular
to the layer normal but uncorrelated with respect to the centers of mass. The
thickness of each layer is of the order of molecular length (Fig. 1.1).
Se: This is an optically biaxial phase, with the molecules in each layer having a
uniform tilt with respect to the layer normal (de Gennes, 1974) and fluid like
within each layer (Fig. 1.1). Thus, the thickness of each layer is less than the
molecular length. Tilt angles up to 45° are observed.
S B : This phase in addition to the layered structure is characterized by a hexagonal
crystalline order within each layer (Fig. 1.1). The thickness of each layer is of
the order of molecular length (de Gennes, 1974-)-
Similarly, there are other ordered smectics like SD, SE, Sp, SQ etc., with varying
degrees of positional order of the molecules within the layers. Smectic-A being the
least ordered in all the smectics is the first mesophase to form (if present), as the
nematic phase is cooled.
As the smectic-A phase is approached from say a nematic phase, local smectic
clusters (cybotactic groups) form and breakup. This results in pretransitional smectic
fluctuations and hence exclusion of the bend and twist deformations. That is, the
elastic constants K2 and A'3 diverge as the system goes from nematic to smectic-A
phase (Brochard, 1973). Following de Gennes (1972, 1974) and McMillan (1971,1972
31
Here ( is the coherence length, q = 2w/d is the length of the smectic layers. The term
A.(T) is given by
32
(1.92a)
(1.926)
(1.93a)
(1.936)
(1.91)
(1.90)
and 1973) for a fixed orientation of the director, the free energy density near TAN can
be written in terms of the smectic order parameter, V' as
<t> is the phase factor which gives the position of the layers and | xj) | is the amplitude
of wave vector which denotes the degree of layering. Mj and Mv are the components
of mass tensors (Brochard, 1973). Symmetry conditions ensure the presence of terms
with even powers of ip only. The coefficient /? is always +ve and at a certain temper-
ature r*, which is a second order point, a = 0. The renormalised elastic coefficients
(due to the divergence of K2 and /\3) are given by
where 6K2 and 6K3 are the critical parts of the elastic constants given by (Brochard,
1973)

A,(T) = [T-TAN]" (1.94a)
where TAN is the nematic-Smectic A transition temperature. The increase in the
bend and twist elastic coefficients is only partly compensated by the increase in some
of the viscosity coefficients ; eqns. (1.93a) and (1.93b) together with eqn. (1.71)
thus predict a significant decrease in the contibutions to the relaxation rate from
nematic order fluctuations near N — SA transition. Hence smectic flucu tat ions alone
are responsible for any change in T\ at TAN-
i.e., Tf1 oc [T-TANT (1-946)
where n critically depends on the value of the exponent v.
1.2.5 ( T < TAN):
Deep inside the smectic phase, in addition to the order director fluctuations of the
nematic director, smectic wave undulations, fluctuations due to adjacent smectic C
phase and self diffusion mediate the relaxation processes (Blinc et al., 1975 ). Thus
the free energy of the system is written as a summation of the free energies due to all
the above contributions i.e.,
(1.95)
where Fa is the free energy due to smectic layering, Fn is the free energy due to
nematic ordering, Fc is the free energy due to the formation of adjasent Sc phase and
Fd is the free energy due to self diffusion (SD).
Order director fluctuations :
Due to the large increase in the twist and bend elastic constants, the contribution
to Tf * from 'nematic' order fluctuations reduces considerably in SA phase. Below
33
TAX, assuming the coherence length (amplitude of the smectic wave) to be constant,
and only the phase angle <f> to vary, the gradient in the expression for free energy can
be written as (de Gennes, 1972)
(1.96)
where Vy is the gradient operator in the plane of the layers. The term 6n stands for
the fluctuating part of the nematic director n. The total free energy due to collective
fluctuations is thus obtained as Fa + F n , where Fn is the total free energy due to
fluctuations in the nematic director given by eqn. (1.58). In SA phase, <| <j> |> =
if>0 = (—Q/^)1^2 . Assuming | %j> \ to be spatially uniform,
where B, = (il>lq,)/Mv = Ki/<P and D, = (il>20q
28)IMT represent the restoring forces
for fluctuations in the phase 0 and for fluctuations of the molecular orientation re-
spectively. V, the layer displacement is related to <j> as | <j> |2 = q2 \ u |2. Introducing
the Fourier transforms of 6n and using the equipartition theorem, as in the case of
nematic phase, the amplitude of mean square fluctuations of the director are obtained
as
34
(1.97)
(1.98)
(1.99a)
The gradient terms | * and | J represent the tilt of the layers with respect to the
director. In case the orientation of the director is not fixed, considering the relative
tilt between the layers and the director, the free energy can be written as

where q± = (g2. + ?J)1/2 and g, are the components of deformation wave vector q
in the directions p«*pend?cu.la»i and panaliel to the smectic layers respectively. The
corresponding dispersion relations for these collective modes in SA phase are given
by (Schaetzing and Uster, 1979)
Here rji and r/2 are two effective viscosity coefficients which are considered to be
independent of q. The elastic constant B, is about ten times larger than DB in the
smectic-A phase. As the nematic phase is approached, the disappearance of layered
structure results in Ba and Da tending to zero and hence the mean square amplitude
of fluctuations given by eqns. (1.99a) and (1.99b) result in the expression for mean
square amplitude for the nematic phase. Substituting the relavant parameters and
integrating over the q modes from zero to upper cutoff wave vector gmax = q8, which
is given by inverse dimension of one molecule, the spectral density is obtained as
(Vilfan et a]., 1987)
35
(1.1016)
(1.100a)
(1.1006)
(1.996)
where

Here w3a = Dt/rja (a = 1,2) are the characteristic upper cut off frequencies in the
directions perpendicular to the director. The relaxation rate due to ODF modes is
now obtained as
- » 9TWDF = WtfMu,) (1.102)
o
Since the contribution from •^(u) is insignificant, it is neglected (Pincus, 1969 ; Vilfan
et al. 1987 ; Void and Void, 1989).
The frequency and angular dependence of (T{~1)ODF depends on the relative values
of u;ai,u>,2 and u> ; and on the ratio of the elastic constants K3/K1 and D,/B,. The
contributions to the spectral density from the two normal modes, given by the term
containing Y(a = 1) and by the second term ( for a = 2) in eqn. (1.101) are plotted
in Fig. 1.6 for specific values of DJB, = 0.1,77, = r\2 and Kx — K2 = A3. Also
represented in the figure is the variation of the sum of the modes. Two limiting cases
may be discussed in this context.
Cased'}: LJ^>U)SI = ua2 = u>,,
The angular and frequency dependence of Ji(u;) is the same as in the nematic
phase i.e., J\(u) oc u r 1 / 2 . However, the value of 7\ should be much longer than in
the nematic phase in view of the increase in the elastic constants K2 and A3.
Case(ii):u> < wal = u>,2 = <*>* ;
In this case, the relaxation rate is effected by the smectic order fluctuations and
results in a levelling off of the dispersion curve (Vilfan et al. 1987), i.e., 7\ is
independent of frequency and proportional to the smectic order parameter | \j)0 \ .
The term due to the mode for a = 1, increases slightly with decreasing u while the
second term approaches a constant value. The transition from nematic like behavior
to the leveling off occurs close to o> ~ a;, depending on the value of K3/Ki and D,/B,
(Vilfan et al, 1987). For a typical smectic phase, the value of u>, is estimated to be
lO6^"1 indicating the region in which the change over occurs jsclose to about 1 MHz.
Thus not only the u>1/2 dispersion law but also the low frequency deviations from it
36

Fig. 1.6 Frequency dependence of the transverse modes of Ji(u>) (Q = 1,2) and their
sum (Vilfan et al. 1987) -for D/EL^ O'-i ) ^ir K2= ^ 3 = k & i^= TJ^s T? .

can be explained in principle by nemalic director fluctuations in the smectic phase
and the coupling between nematic and smectic order. Comparing the variation of
(TI1)ODF in SA phase with that of nematic phase (Zupancic et al. 1976), where the
summation over q includes terms with wave vectors larger than ?„,!„ ~ 27r/Amax and
the critical frequency o?c at which the levelling off occurs is given by (Kqlnin)/v =
(A'(27r)2)/7/Aj,ax is very interesting. From Fig. 1.7, it can be seen that though the
dispersion curves look similar, u>c is several orders of magnitude smaller than wt as
the ratio u;,/u;c - (X^Jd)2.
Considering the wave vector dependence of 772 (deGennes, 1974) the frequencyis
dispersion of J\(UJ) due to the mode a =2,̂ found to be the same for different values
of r/2 (Vilfan et al., 1987). However the problem of wave vector dependence of all the
viscosity coefficients in SA phase is still not solved completely. As explained earlier, a
modification of the above expression for spectral density by considering an ellipsoidal
volume of integration instead of cylindrical volume used by Blinc (1976) is done by
Void and Void (1985) to include the variation in the elastic and viscosity coefficients,
which is usually the case in the smectic phase due to the smectic fluctuations.
Smectic wave undulations
Another possible mechanism contributing to T\ in the smectic phase is the con-
tribution of the smectic wave undulations ( when the interlayer distance is constant
and the director is normal to the layers). The relation between the local displacement
of the layer in a direction normal to the layer {uz(x,y)) and the fluctuations in the
director (6n(r,/)) are given by
In addition, the modes which are restricted to the xy plane i.e., qz = 0 are purely
diffusive (Blinc et al. 1975) i.e.,
(1.104)
37
(1.103)
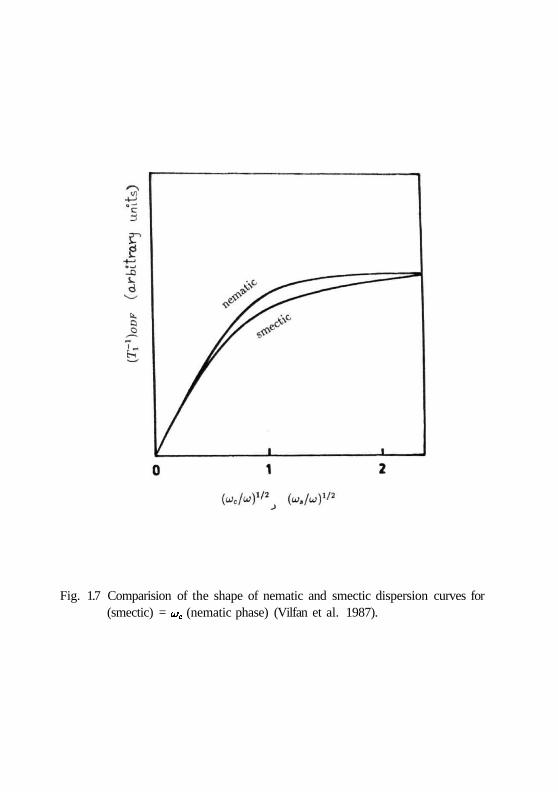
Fig. 1.7 Comparision of the shape of nematic and smectic dispersion curves for(smectic) = uc (nematic phase) (Vilfan et al. 1987).

Assuming the coherence length to be independent of q± and using the elastic contin-
uum theory, the expression for spectral density can be obtained as
(1.105)
where only the upper cutoff frequency is taken into account (Blinc et al. 1975)
Relaxation due to Sc fluctuations :
A considerable contribution to relaxation rate in the SA phase may arise from
Sc phase fluctuations, if there is an underlying Sc phase. In the smectic-C phase,
the preferred direction of the molecular alignment is tilted away from the normal to
the layer and hence large fluctuations are expected in the tilt angle near TCA* o n
approaching from the SA phase. The tilted state is specified by the magnitude of the
tilt angle 0 and the azimuthal direction of the molecular axes <j> with respect to the
smectic plane normals. The order parameter in Sc phase is thus a complex number
given by
The free energy density in the presence of Sc fluctuations can be written as (Blinc et
al., 1975)
38
But in a typical system, f = l/\q\ where A is a constant of the order of molecula:
length. Thus
(1.106)
(1.107)
(1.108)
which is related to the nematic director as
with AC{T) oc (T-TAC)V \ a n^ FA is the smectic-A free energy density in the absence
of smectic-C fluctuations. As in the earlier cases, introducing the Fourier components
of x*(r) and xv(r) with A'i = K2 = A'3 = A' (one constant approximation) and using
the equipartition theorem to find the mean square amplitude of thermal fluctuations
and the corresponding order parameter relaxation time r~l(q) = AC(T)(1 + q2£2)/ri
where f2 = K/AC(T), the spectral density is obtained as (Blinc et al. 1975)
(1.110)
Here r = (A'£2)/7/.The above equation is similar to the expression for spectral density
due to ODF in nematic phase. This shows that the angular dependence of 7\ due
to Sc fluctuations is the same as in the case of director fluctuations in the nematic
phase.
In the limiting case, w ^» r ; the frequency dependence of T\ also is the same
as in the nematic phase i.e., Ti oc y/u. However when u; < r,Ti is independent of
frequency, but critically dependent on the temperature i.e., T\ ex (T — TACY-
Diffusion assisted ODF
Lastly, another important mechanism aiding the relaxation in the smectic phases
is the modulation of intra molecular dipolar interactions due to translational self
diffusion wherein the long molecular axis is adjusted parallel to the director no(r,t)
which is space dependent (due to order fluctuations) during the process of diffusion.
In such a case, an additional factor, taking into account the change in the orientation
of a molecule due to diffusion i.e., diffusion assisted ODF is to be included in the auto
correlation function for the simple nematic case i.e.,
(1.109)
39

in expressions for Tc71(q);Tf1(q);72""1(q);T~1(q) for the wave vector dependent relax-
ation time r(q).
In the Isotropic approximation (A'l = A'2 = A3), £2/TJ is replaced by £2fr\ +
(D/AC{T)) where D = |(Z?(| + 2D±). Hence the the spectral density term can now
be obtained as
In case K3/K3 > Ka/K'Qy the above expression can be written as
which is the same as that obtained for the SA phase. When D\\ < D± and K3 >
Ko, (KsD±)l(KQD\\) > 1. Also when D± > Ka/rj i.e., smectic order parameter is
negligible, the spectral density is given by
40
(1.112)
(1.114)
Here D\\ and D± stand for the principal values of the diffusion tensor parallel and
perpendicular to the nematic director n0 respectively. Introduction of these additional
factors due to diffusion leads to the following substitutions for K\, K2 and K$ to
obtain the decay times of the modes i.e.,
(1.116)
Thus the diffusion assisted ODF mechanism gives the same angular and frequency
dependence to the relaxation rate Tf1 as ordinary ODF mechanism. On the other
hand, the temperature dependence of T\ is essentially determined by the temperature
dependence of diffusion coefficient. If the diffusion process is thermally activated, the
corresponding T\ has a Arrhenius type of temperature dependence.
Self diffusion :
The model for self diffusion in SA phase is different as compared to nematic phase,
due to the layered structure. The system is considered to be constituted by molecules
of length / and diameter d (d/l < 1), with the spins distributed along the long
molecular axis. This approximation is justified, when the rotations of molecules
around their long axes are fast. Vilfan and Zumer (1980), have given the theory of
T\ in 5,4 phases due to translational self diffusion. As the nematic order is close to 1
well inside the SA phase, it is assumed that the orientational order of the molecular
axes is perfect. Similar to the case of isotropic and nematic diffusion, a random,
fast, diffusive jump model where the time spent for a jump is much shorter than the
average time interval T± between two successive jumps, is considered to describe the
diffusion. Further the interlayer motion is also described by a thermally activated
random jump process, wherein the molecules are assumed to jump only to one of the
two adjacent layers, the jump length being equal to the interlayer distance. The time
spent for a jump is assumed to be much smaller than 7|j, the average time between
two successive inter layer jumps. Considering all the above factors, the spin lattice
relaxation rate can be written as (Vilfan and Zumer, 1980)
where A is the angle between the director within each layer and the field. As in
41
(1.116)
the nematic case the spectral density can be written as the Fourier transform of the
correlation function for intra molecular dipolar Hamiltonian as
where Sa(q,w) is the Fourier transform of the one particle auto correlation function
G,(r, t). The functions JF̂ (q) which are the auto correlation functions, are different
for the interlayer and the intra layer diffusion and are given by eqn. (1-79) (Zumer
and Vilfan, 1978 ; Harmon and Muller, 1969). Using the same notation as in the
isotropic case, the distribution function Pi(r), and the Fourier transform are given
by (Vilfan and Zumer, 1980)
The static pair correlation function has to be written as a product corresponding to
the long range and short range positional order i.e.,
g(r) = 9l(r)go(r) (1.119)
where gi{r) = g\{z) and <70(r) is of the form of a square well (as in the nematic case).
Finally, considering a distribution of spins to be uniform along the long molecular
axis, the expression for the relaxation rate due to SD is obtained as
where the function R is to be calculated for different parameters by numerically
integrating over q\\, q± and £. The frequency dependence of the relaxation rate for l/d
42
and
(1.118a)
(1.1186)
(1.117)
(1.120)
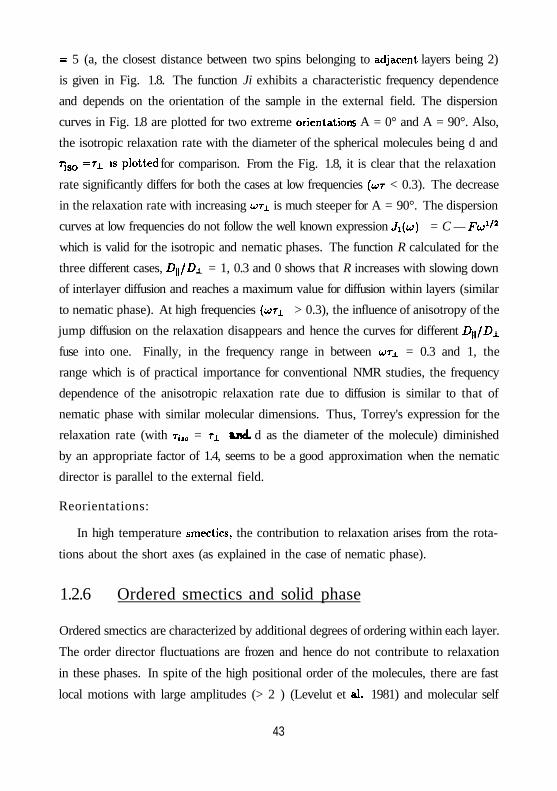
= 5 (a, the closest distance between two spins belonging to adjacent layers being 2)
is given in Fig. 1.8. The function Ji exhibits a characteristic frequency dependence
and depends on the orientation of the sample in the external field. The dispersion
curves in Fig. 1.8 are plotted for two extreme orientations A = 0° and A = 90°. Also,
the isotropic relaxation rate with the diameter of the spherical molecules being d andriso = rJ- *s plotted for comparison. From the Fig. 1.8, it is clear that the relaxation
rate significantly differs for both the cases at low frequencies (wr < 0.3). The decrease
in the relaxation rate with increasing UT± is much steeper for A = 90°. The dispersion
curves at low frequencies do not follow the well known expression Ji(u>) = C — Fa;1/2
which is valid for the isotropic and nematic phases. The function R calculated for the
three different cases, D\\/D± = 1, 0.3 and 0 shows that R increases with slowing down
of interlayer diffusion and reaches a maximum value for diffusion within layers (similar
to nematic phase). At high frequencies (u)T± > 0.3), the influence of anisotropy of the
jump diffusion on the relaxation disappears and hence the curves for different D^/D±
fuse into one. Finally, in the frequency range in between UT± = 0.3 and 1, the
range which is of practical importance for conventional NMR studies, the frequency
dependence of the anisotropic relaxation rate due to diffusion is similar to that of
nematic phase with similar molecular dimensions. Thus, Torrey's expression for the
relaxation rate (with r^0 = T± *JKL d as the diameter of the molecule) diminished
by an appropriate factor of 1.4, seems to be a good approximation when the nematic
director is parallel to the external field.
Reorientations:
In high temperature smectics, the contribution to relaxation arises from the rota-
tions about the short axes (as explained in the case of nematic phase).
1.2.6 Ordered smectics and solid phase
Ordered smectics are characterized by additional degrees of ordering within each layer.
The order director fluctuations are frozen and hence do not contribute to relaxation
in these phases. In spite of the high positional order of the molecules, there are fast
local motions with large amplitudes (> 2 ) (Levelut et al. 1981) and molecular self
43

Fig. 1.8 Frequency dependence of R oc (7\ 1)SD f°r three different ratios of D\\/D±
(0, 0.33, 1) for H || n and H X n (< r\ > /d2 = 1). Torrey's function is
diffusion (which is a slow jump process as in solids) with much weaker dynamical
correlations. Hence, self diffusion and reorientations alone mediate the relaxation in
these phases.
Self diffusion
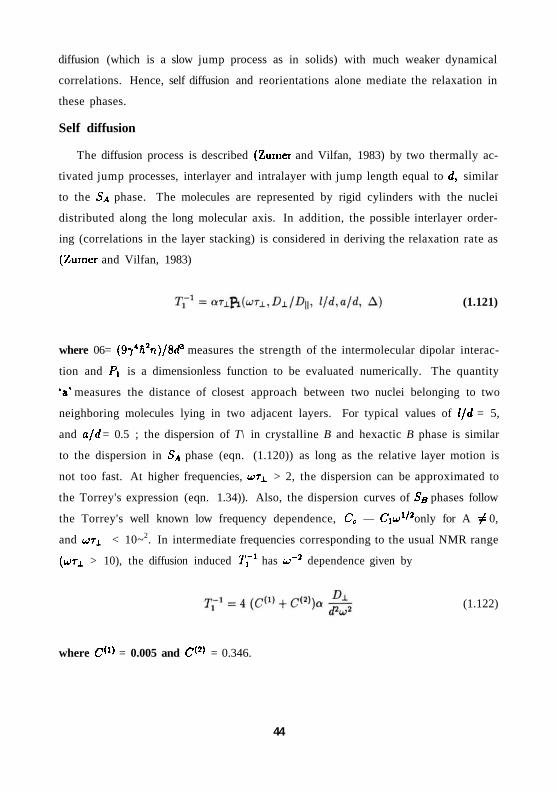
The diffusion process is described (Zumer and Vilfan, 1983) by two thermally ac-
tivated jump processes, interlayer and intralayer with jump length equal to d, similar
to the SA phase. The molecules are represented by rigid cylinders with the nuclei
distributed along the long molecular axis. In addition, the possible interlayer order-
ing (correlations in the layer stacking) is considered in deriving the relaxation rate as
(Zumer and Vilfan, 1983)
where 06= (974ft2n)/8<f3 measures the strength of the intermolecular dipolar interac-
tion and Pi is a dimensionless function to be evaluated numerically. The quantity
V measures the distance of closest approach between two nuclei belonging to two
neighboring molecules lying in two adjacent layers. For typical values of l/d = 5,
and a/d = 0.5 ; the dispersion of T\ in crystalline B and hexactic B phase is similar
to the dispersion in SA phase (eqn. (1.120)) as long as the relative layer motion is
not too fast. At higher frequencies, WTJ. > 2, the dispersion can be approximated to
the Torrey's expression (eqn. 1.34)). Also, the dispersion curves of SB phases follow
the Torrey's well known low frequency dependence, Co — C\ull2 only for A / 0,
and U>T± < 10~2. In intermediate frequencies corresponding to the usual NMR range
(U>7L > 10), the diffusion induced T{1 has uT2 dependence given by
44
(1.121)
(1.122)
where C™ = 0.005 and C<2> = 0.346.

Reorientations
In the low temperature smectic phases, the rotations around the long axes may
become important. In case the director n0 makes an angle A with the external field,
the relaxation rate is given in U;T/ <C 1 limit as
Here Uk stands for the relative weight of the proton belonging to the kth group and
/ for the cosine of the angle between the inter nuclear vector r* of the kth group and
the long molecular axis.
In ordered smectics, rotations around the short molecular axis are known to be
frozen (Seliger et al. 1977). The rotations about the long axis are still fast. The main
contribution to T{1 expected in these phases are the isotropic tumbling of the end
chains (Blinc et, al. 1978). The relaxation rate due to the isotropic tumbling of end
chains is given by a BPP type expression
Since all the relevant reorientational motions are taking place in the fast motion
limit- i.e., UTC <C 1 in these mesophases, no frequency dispersion is expected from the
reorientations, as far as T\ behavior in liquid crystals is concerned i.e., for UTCE < 1
; (Tf1) = 5C"TCE. However, strong temperature effects can be inferred, owing to the
dependence of 7\ on various rc's. For UJTC > 1
(1.124)
(1.125)
(1.127)
45
Here the constant C" represents the relative weights of end chain protons with respect
to the total number of protons. Thus T\ as a function of TCE shows a minimum at
UTCE 2* 0.616 and at the minimum relaxation rate is given by
(1.123)

Usually, Arrhenius type of temperature depedence is assumed for rc since the reori-
entations are thermally activated i.e.,
(1.128)
T0 is the precxponential factor (correlation time at TOO) and Ea is the activation
energy associated with the motional process (k is the Boltzmann constant). Thus,
a plot of In (T}) vs T will have two straight lines with slopes -Ea/k and Ea/k at
higher and lower temperatures respectively.
Thus, the relaxation rate in a liquid crystal in the various mesophases can be
written as
where the three terms have their own temperature and frequency dependences in var-
ious mesophases (as explained before). Thus, the data of relaxation times is fitted to
the above model numerically in various phases to obtain the contribution from each
of the mechanism and the dynamics parameters associated with them.
Section - 3
1.3 Dipolar relaxation time (T\D)
The dipolar spin lattice relaxation time (Tip) is mainly dominated by the spectral
components corresponding to the local fields (kHz region) and hence can probe slower
molecular motions. The time evolution of the local dipolar order plays a major
role in determining the relative importance of the intermolecular and intramolecular
contributions to the nuclear spin lattice relaxation process. In a typical magnetic
resonance experiment, the energy associated with the dipolar order arising from the
46
(1.129)

local fields is much smaller than the Zeeman energy associated with the coupling
of the spins to the external field and hence direct observation of dipolar order is
impossible. A typical scheme is to take advantage of the large Zeeman order and
transform it into observable dipolar order adiabatically. Since entropy of the system
does not change during an adiabatic process, the equilibrium magnetization in the
Zeeman order (Mo = CH0) now alligns along the local dipolar fields. This technique is
called Adiabatic demagnetization in the rotating frame, ADRF (Slichter and Holton,
1961). Here the magnetization is first locked to a rotating field, H\ which is reduced
to zero adiabatically, i.e., dHi/dt <C 7//?, because of which the Zeeman order is
now aligned along the dipolar fields. This dipolar order decays to equilibrium value
allowed by Curie's law (M = CHO/T) with an exponential time constant, TID, the
dipolar relaxation time. The other technique for measuring the dipolar relaxation
time is by the use of phase shifted pulse pair sequence (Jeener and Broekaert, 1967),
where the dipolar order is created by the application of two closely spaced pulses
separted by a time delay r (90° out of phase). This dipolar order is observed by
applying a third pulse (with an arbitrary phase) at a variable time.
The dipolar echo produced in an anisotropic system like liquid crystal is very
complicated, since there are different subsets of spins contributing to the NMR signal
i.e., spins associated with aromatic rings - giving rise to a pair of peaks at uio ± SLJ
- and spins associated with alkyl end chains which give rise to motionally averaged
central peak at the Larmor frequency, LJ0 in the proton NMR spectrum. The two
components of the free induction decay associated with the two spin subsystems have
different time derivatives. Since the efficiency of transforming Zeeman to dipolar
order is proportional to the derivative of the FID at time r, it is in principle possible
to selectively transfer the order associated with each subsystem, while suppressing
the transfer of order associated with the other subsystems, which results in probing
several interesting properties of liquid crystals (Dong and Sandmen, 1983).
The orientation dependence (Blinc et al. 1975 ; Dong and Sandmen, 1983) of
Tic is particularly useful to study the nature of collective fluctuations in SA and Sc
phases (since the contribution to the fluctuation spectrum at very low frequencies is
mainly from ODF). The relaxation rate in the fast motion limit (weak collison limit)
47

where A is the angle between the molecular axis in the mesophases and the external
field. In the weak collision limit, it can be seen from eqn. (1.130) that Tip ~ T\.
At the outset of motional narrowing i.e. T2 = rc (correlation time of the responsible
moleucar motion), T\D shows a minimum (Ailion, 1983).
The onset of ordered Smectic phases, SB, SG from high temperature smectics leads
to slowing down of ODF and self diffusion (Blinc et al. 1975). In this slow motional
regime, the mean time, rc between two successive molecular jumps is much longer
and the corresponding TXD becomes very small. In the strong collision limit (Slichter
and Ailion, 1964) i.e. rigid lattice limit, T\D can be obtained when Hx = 0. Then
48
is given by (Van Stecnwinkel, 19G9)
(1.130)
(1.131a)
(1.1316)
where
Co, C\ and C2 are of the same order of magnitude. The dimensionality in 7i and TID
can be accounted for by making C2 = 0 in eqn. (1.130) (Dong and Sandmen, 1983)
and the relaxation rate for two spins is approximately written as
(1.132)

From the value of T\D obtained from the experiments in the ordered smectic phase,
the corresponding correlation time, TC can be obtained from the above equation. The
constant, p is a geometric coefficient varying between 0 and 1. Since the precise value
of p is not known, only an upper bound, [r^m^ can be computed by taking p as 0
and the corresponding lower limit of diffusion coefficient Anjn can be calculated.
49