changes in arctic melt season and implications for sea … · changes in arctic melt season and...
TRANSCRIPT

©2014 American Geophysical Union. All rights reserved.
Changes in Arctic Melt Season and Implications for Sea Ice Loss
J. C. Stroeve1,2, T. Markus3, L. Boisvert4, J. Miller3,5 and A. Barrett1
1National Snow and Ice Data Center (NSIDC), Cooperative Institute for Research in
Environmental Sciences (CIRES), University of Colorado (CU), Boulder, CO 80309, USA
2Centre for Polar Observation and Modelling, University of College London, London,
WC1E6BT, United Kingdom.
3NASA Goddard Space Flight Center (GSFC), Cryospheric Sciences Laboratory, 615,
Greenbelt, MD 20771, USA
4Earth System Science Interdisciplinary Center (ESSIC), University of Maryland, College
Park, MD 20742, USA
5Wyle, Inc. 1290 Hercules Avenue, Houston TX 77058
Corresponding author: J. Stroeve, NSIDC, Boulder, CO 80309, USA. ([email protected]).
This article has been accepted for publication and undergone full peer review but has not been through the copyediting, typesetting, pagination and proofreading process which may lead to differences between this version and the Version of Record. Please cite this article as doi: 10.1002/2013GL058951
https://ntrs.nasa.gov/search.jsp?R=20140010778 2018-07-08T02:24:48+00:00Z

©2014 American Geophysical Union. All rights reserved.
Abstract
The Arctic-wide melt season has lengthened at a rate of 5 days dec-1 from 1979 to 2013,
dominated by later autumn freeze-up within the Kara, Laptev, East Siberian, Chukchi and
Beaufort seas between 6 and 11 days dec-1. While melt onset trends are generally smaller, the
timing of melt onset has a large influence on the total amount of solar energy absorbed during
summer. The additional heat stored in the upper ocean of approximately 752MJ m-2 during
the last decade, increases sea surface temperatures by 0.5 to 1.5oC and largely explains the
observed delays in autumn freeze-up within the Arctic Ocean’s adjacent seas. Cumulative
anomalies in total absorbed solar radiation from May through September for the most recent
pentad locally exceed 300-400 MJ m-2
in the Beaufort, Chukchi and East Siberian seas. This
extra solar energy is equivalent to melting 0.97 to 1.3 m of ice during the summer.
Index Terms: Sea ice, Remote sensing, Thermodynamics
� Lengthening of Arctic melt season
Key points
� Increasing sea surface temperatures delay autumn freeze-up � Increased solar absorption melts and extra 1 m of ice.

©2014 American Geophysical Union. All rights reserved.
1. Introduction
Arctic ice extent exhibits negative trends for all months, weakest in winter and strongest
for September, the end of the melt season. The downward September trend has accelerated
over the past decade. From 1979 through 2001, the linear trend in September ice extent over
the satellite record stood at -7.0% dec-1. Including 2013 it is twice as large at -14.0% dec-1
The decreased spatial extent of the ice cover has been accompanied by large reductions in
ice thickness [e.g. Kwok and Rothrock, 2009] that are primarily explained by changes in the
ocean’s coverage of multiyear ice (MYI) [e.g. Maslanik et al., 2011]. In the mid-1980s, MYI
accounted for 70% of total winter ice extent, whereas by the end of 2012 it had dropped to
less than 20%. As seasonal ice has replaced MYI as the dominant ice type, the Arctic Ocean
has become more vulnerable to a “kick” from natural climate variability, initiating feedbacks
that have the potential to promote a rapid transition towards a seasonally ice-free Artic state
[Holland et al., 2006].
and the seven lowest September extents have all occurred in the past seven years [e.g. Stroeve
et al., 2008; Comiso et al., 2008; Stroeve et al., 2012].
With the Arctic region becoming more accessible for longer periods of time, there is a
growing need for improved prediction of ice conditions on seasonal and longer timescales.
However, in order to meet this need, better understanding of the relative roles of sea ice
dynamics and thermodynamics to the observed ice loss is needed. Thermodynamic effects
occur principally via radiation, either directly to the upper ice surface or indirectly to the
underside of the ice [e.g. Maykut and Untersteiner, 1971; Perovich et al. 2008]. The transfer
of sensible heat from the atmosphere to the ice is considerably smaller [Lindsay, 1998]. Since
the timing of melt onset and freeze-up influence the surface albedo, it impacts the amount of

©2014 American Geophysical Union. All rights reserved.
ice melted each summer. Thus, changes in the length of the melt season are an important
piece of the puzzle in understanding current trends in Arctic sea ice.
In this study, we update assessments of changes in the Arctic melt season using passive
microwave-derived melt onset/freeze-up dates [Markus et al., 2009]. Results are evaluated
together with changes in sea surface temperatures (SSTs) and total amount of absorbed solar
radiation using data from the Advanced Very High Resolution (AVHRR) Extended Polar
Pathfinder Project (APP-X) [Key, 2001]. Finally, implications for sea ice loss are discussed.
2. Methodology
The melt onset and freeze-up algorithm is discussed in detail in Markus et al. [2009].
Briefly, the algorithm is based on the sensitivity of microwave brightness temperatures (Tbs)
to liquid water content in the snow pack. The algorithm takes advantage of temporal
variability in emissivity at 19 and 37 GHz vertical polarization, together with additional
constraints, including variations in sea ice concentration and the fraction of MYI and first-
year ice (FYI). The algorithm is applied to Tbs from the Nimbus-7 Scanning Multichannel
Microwave Radiometer (SMMR), the Special Sensor Microwave/Imager (SSM/I), and the
Special Sensor Microwave Imager and Sounder (SSMIS), spanning 1979 to present. Data are
available at a spatial resolution of 25 x 25 km in a polar stereographic grid. The algorithm is
applied with bias adjustments on the Tbs from F11 (1992-1998), F13 (1999-2008), F17 (2009
– present) to F08 (1987-1991).
Two different indicators for melt onset and freeze-up are given. For melt, both the first
day of melt (EMO) and the period of continuous melt onset (MO) are calculated. Similarly,
the algorithm calculates early freeze onset (EFO) and the very last day of melt, or the start of
continuous freeze (FO). The differences between EMO and MO, and EFO and FO are
indicative of the seasonal transition periods. Statistics are computed for the entire Arctic, and
for twelve individual regions defined in Figure S1.

©2014 American Geophysical Union. All rights reserved.
To remove erroneous pixels in the statistics, the homogeneity for each pixel is evaluated
using the standard deviation of a 5x5 spatial neighborhood. If the neighborhood is too
heterogeneous (i.e. too few pixels within one standard deviation) the pixel is rejected from
analysis. Linear trends per pixel and per region are calculated using the standard least-squares
approach, reported as days per decade. Statistical significance is evaluated against the null
hypothesis using t-test statistics at the 95 and 99% confidence levels.
SST data come from the NOAA Optimum Interpolation ¼ Degree Sea Surface
Temperature Analysis (http://www.ncdc.noaa.gov/oa/climate/research/sst/oi-daily-
information.php). Data from 1982-2012 was produced from Pathfinder AVHRR (1982-2005),
Operational AVHRR (2006-2012) and in situ observations from ships and buoys.
To assess changes in the total amount of solar energy absorbed by the ice/ocean system,
monthly surface albedo (�) and downwelling shortwave energy at the surface (Fr
Using APP-X estimates of � and F
) for the
months of May through September, spanning 1982 to 2011, are extracted from the APP-X
data set. Since the data is provided on a 25 x 25 km Equal-Area Scalable Earth Grid (EASE-
grid), regional statistics are calculated after regridding the ocean mask in Figure S1 to the
corresponding APP-X EASE-grid. In the figures, we present the AVHRR results in their
original grid.
r, the flux of solar heat input to the ice/ocean system
(Fin
F
) over time (t), can be written as:
in(t) = Fr(t)[1-�i
Total amount of energy absorbed by the ice/ocean system is then defined as:
(t)] (1)
Qtotal � Fr� (t)[1��(t)]�t (2)
where time is in monthly increments, averaged from May through September.

©2014 American Geophysical Union. All rights reserved.
3. Results
3.1 Changes in Arctic Melt Season
Figure 1 summarizes the long-term melt onset, freeze-up and melt season lengths from
1979 to 2013. Results are presented for both the early melt onset and freeze-up periods (EMO
and EFO), together with the continuous melt and freeze-up periods (MO and FO). The
“inner” and “outer” lengths of the melt season as also shown, defined as (EFO minus MO)
and (FO minus EMO), respectively. As expected, there is a strong latitudinal dependence in
the timing of both melt onset and freeze-up, with the southerly regions melting earlier and
freezing later. In general, EMO occurs about 2 weeks earlier than MO within the central
Arctic Ocean and its adjacent seas, and about 3 weeks earlier in the seasonal ice zones. The
EFO and FO generally occur within 2 weeks of each other, resulting in a melt season length
that may differ by as much as 1 month between the “inner” and “outer” melt season. In
general, the melt season length ranges between 5-7 months for the seasonal ice zones, 2 1/2
months in the central Arctic, and 3-5 months in the Beaufort, Chukchi, E. Siberian, Laptev
and Kara seas. Arctic wide, there is more than 3 weeks difference between the inner and outer
melt season lengths, which are on average 112.9+7.66 days and 138.0+6.87 days,
respectively .
The long-term means however mask large interannual variability. Regional mean time-
series in Figures S2-4 (legends differ between regions in order to highlight interannual
variability) show the timing of autumn freeze-up generally exhibits more interannual
variability than melt onset [see also Table S1]. Yet despite large variability, there are
statistically significant trends toward earlier melt onset and later freeze-up, and therefore a
lengthening of the melt season from both ends [Table 1]. Exceptions are the Sea of Okhotsk
and the Bering Sea, both of which exhibit small, but statistically insignificant trends towards
later melt onset. Additionally, the Sea of Okhotsk shows earlier freeze-up trends, leading to

©2014 American Geophysical Union. All rights reserved.
an overall shorter melt season. Positive melt onset trends in the Bering Sea are consistent
with positive sea ice concentration trends on the order of 20% ice concentration dec-1
Elsewhere, trends are towards earlier melt onset, though they are not statistically
significant in Baffin Bay and the Canadian Archipelago (CAA). The overall lengthening of
the melt season within the CAA is dominated by later autumn freeze-up. However, the melt
season trends found here of 3 days dec
from
January through May [Figure S5]. Variability of ice in this region is strongly tied to
atmospheric circulation, particularly the Aleutian Low and the Siberian High, which may act
to create a strong pressure gradient across the Bering Strait and enhance ice transport.
Another factor is increased ice mobility together with a weaker ice pack that is no longer able
to form ice arches across the Bering Strait and impede ice drift [Babb et al., 2013].
-1 is less than the 7 days dec-1
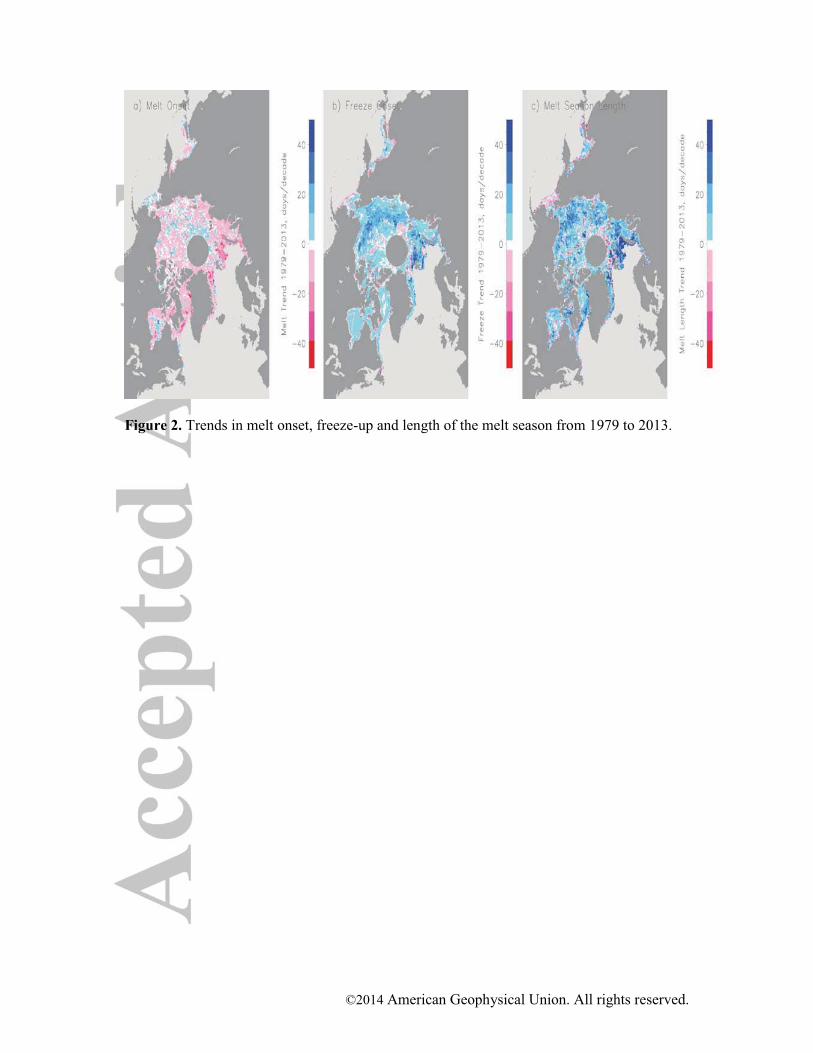
Within the Arctic Basin, later autumn freeze-up dominates statistically significant trends
towards a longer melt season, with the largest trends of 9 to 13 days dec
previously reported by
Howell et al. [2009] using data through 2008. This difference is a reflection of the large
interannual variability in the melt season, and thus the importance of the time-period used for
assessment of trends. Results further suggest that the length of the melt season has not been a
significant factor driving recent summers with anomalously low ice conditions within the
Northwest Passage routes, despite record low ice conditions in 2011 and 2012.
-1 in regions with
dramatic reductions in summer ice extent (e.g. Beaufort, Chukchi, E. Siberian, Laptev seas),
translating to a total lengthening of the melt season between 1 and 2 months over the data
record. A similar trend of 8 days dec-1 is observed in the E. Greenland and Barents seas,
though locally trends may reach 40 days dec-1 [Figure 2]. In these regions, the melt season
length is dominated by statistically significant trends towards earlier melt onset. For the
Arctic as a whole, the melt season has lengthened at a rate of 4 to 5 days dec-1, similar to
values previously reported by Markus et al. [2009].
©2014 American Geophysical Union. All rights reserved.
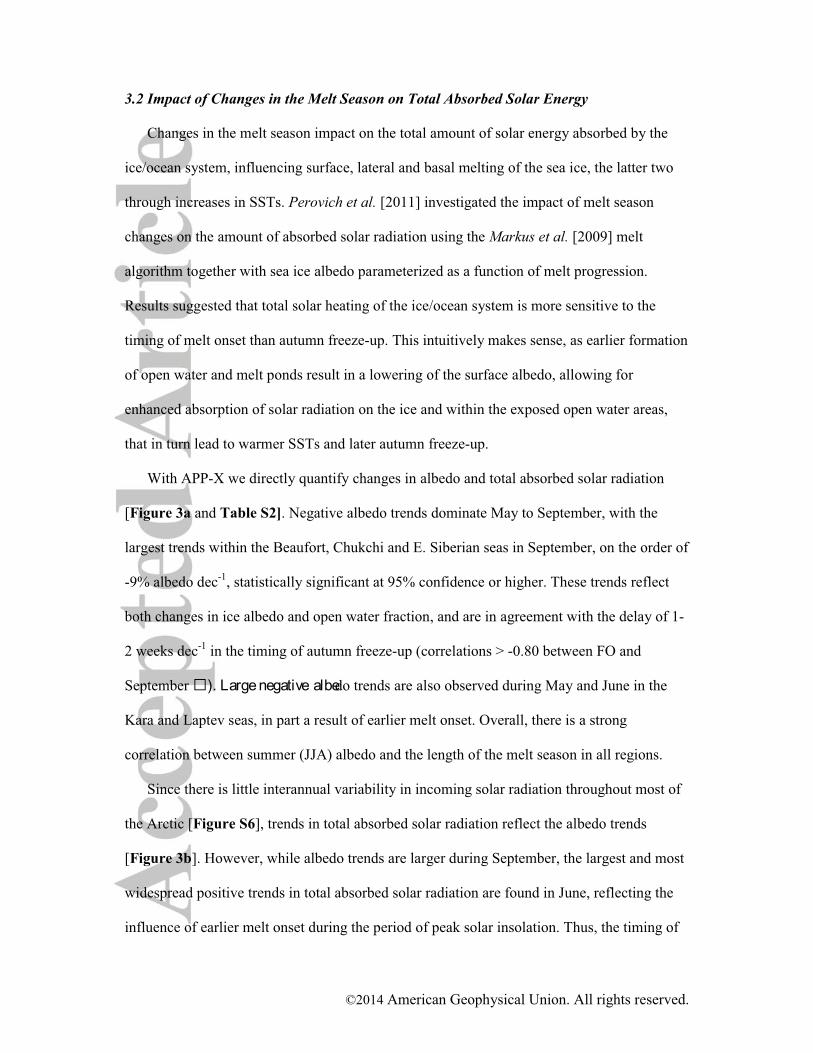
3.2 Impact of Changes in the Melt Season on Total Absorbed Solar Energy
Changes in the melt season impact on the total amount of solar energy absorbed by the
ice/ocean system, influencing surface, lateral and basal melting of the sea ice, the latter two
through increases in SSTs. Perovich et al. [2011] investigated the impact of melt season
changes on the amount of absorbed solar radiation using the Markus et al. [2009] melt
algorithm together with sea ice albedo parameterized as a function of melt progression.
Results suggested that total solar heating of the ice/ocean system is more sensitive to the
timing of melt onset than autumn freeze-up. This intuitively makes sense, as earlier formation
of open water and melt ponds result in a lowering of the surface albedo, allowing for
enhanced absorption of solar radiation on the ice and within the exposed open water areas,
that in turn lead to warmer SSTs and later autumn freeze-up.
With APP-X we directly quantify changes in albedo and total absorbed solar radiation
[Figure 3a and Table S2]. Negative albedo trends dominate May to September, with the
largest trends within the Beaufort, Chukchi and E. Siberian seas in September, on the order of
-9% albedo dec-1, statistically significant at 95% confidence or higher. These trends reflect
both changes in ice albedo and open water fraction, and are in agreement with the delay of 1-
2 weeks dec-1
Since there is little interannual variability in incoming solar radiation throughout most of
the Arctic [Figure S6], trends in total absorbed solar radiation reflect the albedo trends
[Figure 3b]. However, while albedo trends are larger during September, the largest and most
widespread positive trends in total absorbed solar radiation are found in June, reflecting the
influence of earlier melt onset during the period of peak solar insolation. Thus, the timing of
in the timing of autumn freeze-up (correlations > -0.80 between FO and
September do trends are also observed during May and June in the
Kara and Laptev seas, in part a result of earlier melt onset. Overall, there is a strong
correlation between summer (JJA) albedo and the length of the melt season in all regions.

©2014 American Geophysical Union. All rights reserved.
melt onset has a proportionally larger impact on the amount of solar energy absorbed than the
timing of autumn freeze-up, in agreement with Perovich et al. [2011]. Large positive trends
persist through July and August in the Beaufort, Chukchi and E. Siberian seas. Regionally,
trends are positive and statistically significant within the central Arctic, Beaufort, Chukchi
and E. Siberian seas during all summer months, and within the Laptev and Kara seas in May,
June and July.
Cumulative anomalies in total absorbed solar radiation, summed from May through
September for the last pentad (2007-2011) are shown in Figure 4a. Anomalies locally exceed
400 MJ m-2 in the Beaufort and Chukchi seas, resulting from decreased albedo through a
combination of increased surface melting and expanding open water areas. Over the adjacent
sea ice areas, anomalies are on the order of 300 to 400 MJ m-2. Assuming an ice density of
917 kg m-3, latent heat of fusion of 33.40 kJ kg-1, and further assuming no changes in net
longwave, latent and conductive heat fluxes from climatological conditions, this increase
represents an equivalent ice melt of 97 cm to 1.3 m. Cumulative solar radiation anomalies are
smaller in the central and eastern Arctic (100-200 MJ m-2
3.3 Relationship between Autumn Freeze-up and Sea Surface Temperatures
), or 32 to 65 cm of ice melt. In the
Barents and E. Greenland seas, anomalies are mostly negative. As these areas are mostly ice-
free in summer, this may be indicative of increased summer cloudiness in the region. Yet
Wang et al. [2012] found only slight increases in summer cloud fraction over the Canada
Basin and North Central Russia. Instead, there has been an increase in cloud liquid phase in
summer which may partly explain these changes. This needs to be investigated further.
Since 1982, Arctic Ocean SSTs have increased 1.4o
largest increases occur in August and September, with some areas showing an increase of 3
C between June and October. The
oC
over the entire time period [Figure S7]. The rate of SST increase has accelerated in the last
decade. From 2000 to 2012, SSTs increased at a rate of 0.58oC dec-1 in August, compared to

©2014 American Geophysical Union. All rights reserved.
a rate of 0.38oC dec-1 in 1982 to 1999 (not shown). Overall, the JJASO SST trends from 1982
to 2012 are statistically significant at the 95th percentile and support the link between earlier
melt onset, increased ice/ocean heat input, increased SSTs and a delay in autumn freeze-up.
This is further highlighted in Figure 4b, which shows the JJASO SST anomalies for 2007-
2011 relative to 1982-2011. Areas in the Chukchi/Beaufort and Laptev/E. Siberian seas have
seen the largest decreases in summer ice concentration, largest increases in cumulative
absorbed solar radiation, large increases in SSTs (about 1o
To quantify the relationship between increased summer SSTs and delays in autumn
freeze-up we follow Equation 2 in Steele et al. [2008]:
C warmer on average), and
subsequent delays in autumn freeze-up [e.g. Figure 2b].
mawawairair WTchcpOHCt
10���
(3)
where OHC is the upper ocean heat content in MJ m-2, air density �air = 1.3 kg m-3, air heat
capacity cpair = 103 J kg-1 °C-1, air water heat exchange coefficient chaw = 10-3, air-water
temperature difference ��aw= 5-10°C , 10m wind speed W10m= 5-10 m s-1
For the Arctic as a whole, the observed difference in freeze-up between 1982-1999 and
2000-2012 is about 6 days. In other words, freeze-up is occurring 6 days later during the last
13 years than in the previous 19 years when averaged over all sea ice regions. Using (3)
together with observed changes in SSTs, we find a delay in freeze-up of 5.34 to 21.35 days,
depending on the values forW
, and with the
assumption that ocean-ice advection is small. The range in SST differences between 2000-
2012 and 1982-1999 [Table S3, column 2] is used to estimate upper OHC, assuming a
summer mixed layer depth of 20m [Steele et al., 2008]. Using this equation, the delay in
freeze-up from 2000-2012 compared to 1982-1999 [Table S3, column 5] is estimated using
the corresponding changes in OHC and subsequently compared to the observed delay in
freeze-up (�t).
10m and ��aw. The observed freeze-up delay falls within this

©2014 American Geophysical Union. All rights reserved.
bound as long as the product of W10m���aw is close to 100oC ms-1. To see if the assumptions
used by Steele et al. [2008] for W10m and ��aw are reasonable, we evaluated air-ocean
temperature differences using SSTs from AVHRR and air temperatures from the
Atmospheric Infrared Sounder (AIRS) together with 10m wind speeds from ECMWF
reanalysis for September 2003-2011 (see Supplement). An average, ��aw of 14.13 oC and
W10m of 6.68 m s-1 was found, yielding W10m��aw = 94.32 mo
While this is representative of the Arctic as a whole, there are regional differences. In the
Chukchi, Beaufort, E. Siberian, Laptev, Kara and Barents seas, the observed freeze-up delay
falls within the estimated value [Table S3], suggesting the delay in autumn freeze-up is
largely driven by the observed increases in SSTs in these regions. These SST increases,
together with recent trends towards warmer air temperatures in September [Figure S8], result
in a small difference in the air-ocean temperature difference, limiting the amount of latent
heat released and a delay in sea ice formation.
C s-1 or ��= 5.66 days.
Regions outside of the Arctic basin do not appear to show this same relationship however
(i.e. Sea of Okhotsk, Bering, Hudson and Baffin Bay, E. Greenland Sea). Instead large
discrepancies between the observed changes in autumn freeze-up and that estimated based on
the change in SSTs are found, with the actual freeze-up occurring between one week and one
month earlier than estimated by (3). All these regions, except for Hudson Bay show earlier
freeze-up in 2000-2012 compared with that in 1982-1999, while SSTs have generally
warmed. Trends towards cooler September air temperatures [Figure S8] in these regions may
partly explain this discrepancy. While trends are towards warmer SSTs and higher OHC, the
air-ocean temperature difference is becoming larger, allowing for the sea surface to release
latent heat at a faster rate and for sublimation of sea ice to occur sooner. Ocean dynamics
could also be playing an important role in the amount of sea ice found, particularly in the E.
Greenland Sea.

©2014 American Geophysical Union. All rights reserved.
In summary, while these preliminary results look promising, a need remains for more
extensive research and better understanding of the processes affecting freeze-up on a regional
scale.
4.0 Discussion and Conclusions
The recent low September ice extents are in part a result of a suite of linked processes
that have helped to accelerate summer ice loss, including warmer air temperatures in all
months, earlier melt onset and development of open water that enhance the ice-albedo
feedback, increased solar energy absorbed by the ice/ocean system, increased SSTs, and a
delay in autumn freeze-up [see also Stroeve et al., 2012]. All these linked processes help to
thin the ice, making it more vulnerable to melting out each summer. Given our calculations,
recent changes in the melt season (lengthening by 1-2 wk dec-1) combined with albedo
changes on the order of -9% dec-1 have resulted in the ability to melt an additional 0.97 to 1.3
m of ice over large parts of the Arctic Ocean during the last pentad (2007-2011) compared to
the long-term mean (1982-2011). Another factor appears to be the loss of the Arctic’s store of
MYI itself. Perovich and Polashenski [2012] show that albedo differences between MYI and
FYI allows for a 342 MJ m-2
As the Arctic continues to warm the melt season is expected to lengthen further. These
changes combined with the shift towards more FYI makes the Arctic sea ice cover more
vulnerable to the effects of anomalous summer weather patterns, such that an anomalously
warm summer can rapidly melt out the thinner ice and result in large decreases in ice extent.
increase in solar heat absorption, equivalent to melting 1.0 m of
ice. Part of the MYI/FYI albedo difference is a result more extensive melt pond coverage
over FYI, which is further influenced by a longer melt season. Given that today FYI makes
up about 70% of the Arctic basin compared to 38% in the 1980s, one cannot ignore changes
in the ice cover itself, particularly within the central Arctic as another important factor
towards positive trends in solar heat input.
©2014 American Geophysical Union. All rights reserved.
Conversely, an anomalously cold summer can keep a thin layer of ice, leading to increased
sea ice extent variability. Summer 2013 provides clear evidence of the importance of natural
climate variability. Air temperatures were 1-4oC colder than in 2007 to 2012 and the
September extent was nearly 1.6 x 10⁶ km2
Thus, despite statistically significant trends in sea ice extent and timing of melt onset and
freeze-up, a large amount of interannual variability remains. This is important to consider for
regions with high industry stakeholder interest, such as the Chukchi and Beaufort seas, as
industry has an interest in pushing the dates of operation during the summer melt season.
While these regions show trends towards more open water in summer, and warmer SSTs,
which may provide some predictive ability in determining timing of autumn freeze-up, ice
conditions remain highly variable. Thus early ice formation in a particular year is likely and
may seriously interrupt activities in the region.
higher than the previous year.
Acknowledgements
This work was funded in part by NSF award #PLR-1304246 and by NASA’s Cryospheric
Sciences Program. The AVHRR extended Polar Pathfinder Data were provided courteously J.
Key.

©2014 American Geophysical Union. All rights reserved.
References
Babb, D.G., R.J. Galley, M.G. Asplin,J.V. Lukovich, and D.G. Barber, (2013), Multiyear sea
ice export through the Bering Strait during winter 2011–2012, J. Geophys. Res.-Oceans,
doi: 10.1002/jgrc.20383.
Comiso, J. C., C. L. Parkinson, R. Gersten, and L. Stock (2008), Accelerated decline in the
Arctic sea ice cover, Geophys. Res. Lett., 35, L01703, doi:10.1029/2007GL031972.
Holland, M.M., C.M. Bitz and B. Tremblay (2006), Future abrupt reductions in the summer
Arctic sea ice, Geophys. Res Lett., 33, L23503, doi:10.1029/2006GL028024.
Howell, S.E.L., C.R. Duguay, and T. Markus (2009), Sea ice conditions and melt season
duration variability within the Canadian Arctic Archipelago: 1979-2008, Geophys. Res.
Lett., doi:10.1029/2009GL037681.
Key, J. (2001), The Cloud and Surface Parameter Retrieval (CASPR) System for Polar
AVHRR Data User's Guide. Space Science and Engineering Center, University of
Wisconsin, Madison, WI, 62 pp.
Kwok, R., G. F. Cunningham, M. Wensnahan, I. Rigor, H. J. Zwally, and D. Yi (2009),
Thinning and volume loss of Arctic sea ice: 2003-2008, J. Geophys. Res.,
doi:10.1029/2009JC005312.
Lindsay, R. W. (1998), Temporal Variability of the Energy Balance of Thick Arctic Pack Ice.
J. Climate, 11, 313–333, doi: http://dx.doi.org/10.1175/1520-0442.
Markus, T., J. C. Stroeve, and J. Miller (2009), Recent changes in Arctic sea ice melt onset,
freeze-up, and melt season length, J. Geophys. Res., doi:10.1029/2009JC005436.
Maslanik, J., J. Stroeve, C. Fowler, and W. Emery (2011), Distribution and trends in Arctic
sea ice age through spring 2011, Geophys. Res. Lett., 38, L13502,
doi:10.1029/2011GL047735.

©2014 American Geophysical Union. All rights reserved.
Maykut, G.A and N. Untersteiner (1971), Some results from a time-dependent,
thermodynamic model of sea ice. Geophys. Res., 76, 1550-1575.
Perovich, D.K. and C. Polashenski (2012), Albedo evolution of seasonal Arctic sea ice,
Geophys. Res. Lett., 39, doi:101029/2012GL051432.
Perovich, D.K., K.F. Jones, B. Light, H. Eicken, T. Markus, J. Stroeve, R. Lindsay, (2011),
Solar partitioning in a changing Arctic sea-ice cover, Ann. Glaciol., 52(57), 192-196.
Perovich, D. K., J. A. Richter-Menge, K. F. Jones, and B. Light (2008), Sunlight, water, and
ice: Extreme Arctic sea ice melt during the summer of 2007, Geophys. Res. Lett., 35,
L11501, doi:10.1029/2008GL034007.
Stroeve, J.C., M.C. Serreze, J.E. Kay, M.M. Holland, W.N. Meier and A.P. Barrett (2012).
The Arctic’s rapidly shrinking sea ice cover: A research synthesis, Clim. Change, doi:
10.1007/s10584-011-0101-1.
Stroeve, J., M. Serreze, S. Drobot, S. Gearheard, M. Holland, J. Maslanik, W. Meier, and T.
Scambos (2008), Arctic sea ice extent plummets in 2007, EOS Trans., AGU, 89(2), 13-14.
Steele, M., Ermold, W. and J. Zhang, (2008), Arctic Ocean surface warming trends over the
past 100 years, Geophys. Res. Lett., 35, L02614, doi:10.1029/2007GL031651.
Wang, X., J. Key, Y. Liu, C. Fowler, J. Maslanik and M. Tschudi, (2012), Arctic climate
variability and trends from satellite observations, Adv. Meteorol.,
doi:10.1155/2012/505613.

©2014 American Geophysical Union. All rights reserved.
Table 1. Trends in melt onset, freeze-up and length in the melt season from 1979 to 2013, expressed as the number of days dec-1. + denotes statistical significance at 95%, ++
Region
at 99% confidence levels.
Early Melt
(EMO)
Melt
(MO)
Early Freeze (EFO)
Freeze
(FO)
“Inner” Melt Length
(EFO-MO)
”Outer” Melt
Length (FO-EMO)
All -1.9 -2.1++ 3.0++ 2.3++ 5.0++ 4.2++ ++ Sea of Okhotsk
1.9 1.7 -2.0 -3.8 -3.7 + -5.7+
Bering 1.4 0.4 3.0 1.1 2.6 - 0.1 Hudson Bay
-3.3 -3.1+ 3.4+ 2.3 + 6.5 5.6++ +
Baffin Bay -3.3 -4.6+ 1.3 ++ 0.8 5.9 4.2 ++ E. Greenland
-5.5 -6.1++ 2.4 ++ 2.2 8.5 7.7++ ++
Barents -7.1 -6.9++ 1.4 ++ 1.2 8.3 8.3++ ++ Kara -5.2 -4.8++ 7.0++ 7.1++ 11.8++ 12.4++ ++ Laptev -2.8 -2.7+ 5.9+ 5.2++ 8.6++ 8.0++ ++ E. Siberian -1.8 -1.3 8.4 8.1++ 9.7++ 9.9++ ++ Chukchi -1.6 -2.3 10.7+ 9.6++ 13.2++ 11.2++ ++ Beaufort -2.4 -2.7+ 6.5++ 6.4++ 9.2++ 8.7++ ++ Canadian Archipelago
-1.0 -1.0 2.2 2.2+ 3.2+ 3.3 +
Central Arctic
-2.5 -1.7++ 1.8+ 1.2 + 3.5 3.7++ ++

©2014 American Geophysical Union. All rights reserved.
Figure 1. Early melt onset (EMO), continuous melt onset (MO), early freeze-up (EFO),
continuous freeze-up (FO), and length of the inner (EFO-MO) and outer (FO-EMO) melt
season as averaged from 1979-2013.
©2014 American Geophysical Union. All rights reserved.
Figure 2. Trends in melt onset, freeze-up and length of the melt season from 1979 to 2013.

©2014 American Geophysical Union. All rights reserved.
Figure 3a. Trends in surface albedo from 1982 to 2011 based on the Advanced Very High
Resolution Radiometer (AVHRR) extended Polar Pathfinder (APP-x) data set.

©2014 American Geophysical Union. All rights reserved.
Figure 3b. Trends in total absorbed solar radiation from 1982 to 2011 based on the Advanced
Very High Resolution Radiometer (AVHRR) extended Polar Pathfinder (APP-x) data set.

©2014 American Geophysical Union. All rights reserved.
Figure 4a. Cumulative anomalies in total absorbed solar radiation from 2007 to 2011 relative
to 1982-2011. Cumulative solar radiation is summed from May through September based on
surface albedo and incoming solar radiation data from APP-x.
Figure 4b. June-October (JJASO) SST anomaly for 2007-2011 compared to the 1982-2011
average SST.