arctic natural gas impact & implications - northern gas pipelines
TRANSCRIPT

1.1
ARCTIC NATURAL GAS IMPACT & IMPLICATIONS
Roland R. GeorgePrincipalPurvin & Gertz, [email protected]
Arctic Gas SymposiumHouston, TX – November 30, 2001

2.2
Objective of the Presentation
“Provide Purvin & Gertz’ viewswith respect to the fit of Alaskan
gas given different market scenarios as well as discuss
market impacts and implications.”

3.3
Outline of the Presentation
Ø Objective of the Presentation
Ø Alaskan Gas Fit Given Different Market Views
Ø Market Impacts & Implications
Ø Summary and Conclusions

4.4
ALASKAN GAS FITGIVEN DIFFERENT MARKET VIEWS

5.5
Note: (1) Refers to Lower 48 and Western Canadian sources of gas supply
Balanced Markets
• Economic Growth• Large Resource• Gas Competitiveness• Technological Innovations• Arctic Gas
Supply Constrained
• Limited Economic Resources (1)
• Strong Price Signal• Develop Supply Alternatives• Cost is Key• More Arctic Gas
More Supply (1) Less Supply (1)
Scenario Logic

6.6
Balanced Markets - Scenario Logic
Ø A large resource base that can be developed economically keeps gas prices lower and competitive.
Ø Technological advances in the upstream sector mostly compensate for the impact of smaller supply targets in terms of cost but frontier gas (e.g. Alaska gas starts flowing in 2008) and LNG are still required.
Ø Competitive pricing (Henry Hub prices in the U.S. Gulf Coast below $3.00 U.S./MMBtu in constant 2001$) means that annual demand growth rates are in the 2% range and supply responds to this lower price track, i.e., we obtain “balanced markets” at these prices.
Ø The Balanced Markets Scenario represents Purvin & Gertz’most current market outlook.

7.7
U.S. Dollars per MMBtu
Henry Hub Natural Gas Pricing
0
1
2
3
4
5
6
7
1990 1995 2000 2005 2010 2015 2020
Current Constant 2001$

8.8
Lower 48 Natural Gas Consumption
0
5
10
15
20
25
30
35
1990 1995 2000 2005 2010 2015 2020
Industrial
Residential
UEG Power Generation
Commercial
Other
Trillion Cubic Feet

9.9
Lower 48 Natural Gas Supply Mostly from Domestic Lower 48 but Imports Capture Larger Share and Eventually Arctic Gas Flows….
Lower 48 Domestic
Imports
0
5
10
15
20
25
30
35
1990 1995 2000 2005 2010 2015 2020
Trillion Cubic Feet
Total Supply Alaska

10.10
Balanced Markets Scenario: Canada Gas Supply
0
2
4
6
8
10
12
1990 1995 2000 2005 2010 2015 2020
Trillion Cubic Feet
Alberta
British Columbia
Atlantic CanadaOther
Mackenzie Delta

11.11
Important Big Picture U.S. Interregional Gas Flow Changes Expected in the Future...
Ø Arctic gas flows will likely reach traditional markets for Western Canadian gas. Alaska gas starts in 2008 and Mackenzie Delta gasstarts in 2011. Not only economics but politics drive Arctic gas.
Ø Increasing Western Canadian gas flows to U.S. Midwest reduce potential flows from the Gulf Coast to that region.
Ø Flows of Mountain region gas mostly go to the increasing California market either directly or through West South Central;points further east are also reached mostly through West South Central.
Ø Incremental increases in Gulf Coast gas flow to Mexico, supply internal Gulf Coast growth, and flow up the Eastern Seaboard.
Ø Gulf Coast and Western Canadian flows to the U.S. Northeast are impacted by competition from Atlantic Canada.
Ø Increasing LNG but it remains a niche supply.

12.12
Lower 48 Natural Gas Flow Patterns: 2000 (estimate) BCF
1195
610
62
20
325
1083
36
245
8
59
64
103
1680
50914
4727
1355
25671668
340886
1438
2126
152
120299
7
19
333
20Pacific
Northwest Mountain I
California
Mountain II
West South Central
West North Central
East North Central
East South Central
New England
Middle Atlantic
South Atlantic
Florida
529

13.13
Lower 48 Natural Gas Flow Patterns: 2010 BCF
1366
712
0
60
430
1563
42
1018
238
177
71
330
1213
76960
5033
1765
37851156
482835
1511
2468
627
295106
31
20
368
27Pacific
Northwest Mountain I
California
Mountain II
West South Central
West North Central
East North Central
East South Central
New England
Middle Atlantic
South Atlantic
Florida
614
84
192
1460 (AK)

14.14
Supply Constrained - Scenario Logic
Ø The resource base in the Lower 48 and Western Canada is not as economic to develop and contribute less to overall gas supply (hence the term “supply constrained”).
Ø Incremental sources of supply are required; namely, more Arctic and other frontier gas as well as more LNG.
Ø Prices are higher (Henry Hub prices greater than $3.50 U.S. MMBtu in constant 2001$) to attract these new sources of supply but the higher prices reduce competitiveness and demand is lower. Arctic gas development can now support higher costs and fiscal concessions are not required.
Ø Purvin & Gertz has developed this less likely scenario to reflect the views of several industry participants who hold a more pessimistic outlook with respect to gas supply from existing producing basins.

15.15
The Resource Base is not as Economic to Develop and Gas Prices are Higher...
Ø Real prices rise substantially compared to 1990s average reaching over $3.50 U.S./MMBtu in constant 2001 $ at Henry Hub.
Ø As opposed to the Balanced Market Scenario, prices remain above $3.00 in the medium term.
Ø The “backstop” price for the continental natural gas market is LNG imports and clean-coal technologies.
Ø Arctic gas is more economic at these prices.
Ø Lower 48 gas production still represents the majority of the Lower 48 supply, but greater Alaska gas flows (6 BCF/D vs 4 BCF/D), higher LNG imports and Atlantic Canada gas are required compared to the Balanced Markets Scenario.

16.16
Balanced Markets vs Supply Constrained Scenarios: Henry Hub Pricing
0.00
1.00
2.00
3.00
4.00
5.00
1990 2000 2010 2020
Balanced MarketsSupply Constrained
Forecast in 2001 U.S. Dollars per MMBtu

17.17
Alternative Supply Economics
0.00
1.00
2.00
3.00
4.00
5.00
6.00
1990 1996 2002 2008 2014 2020
Constant Dollars per MMBtu
Alternative Supplies
Balanced Markets Scenario
Supply Constrained Scenario
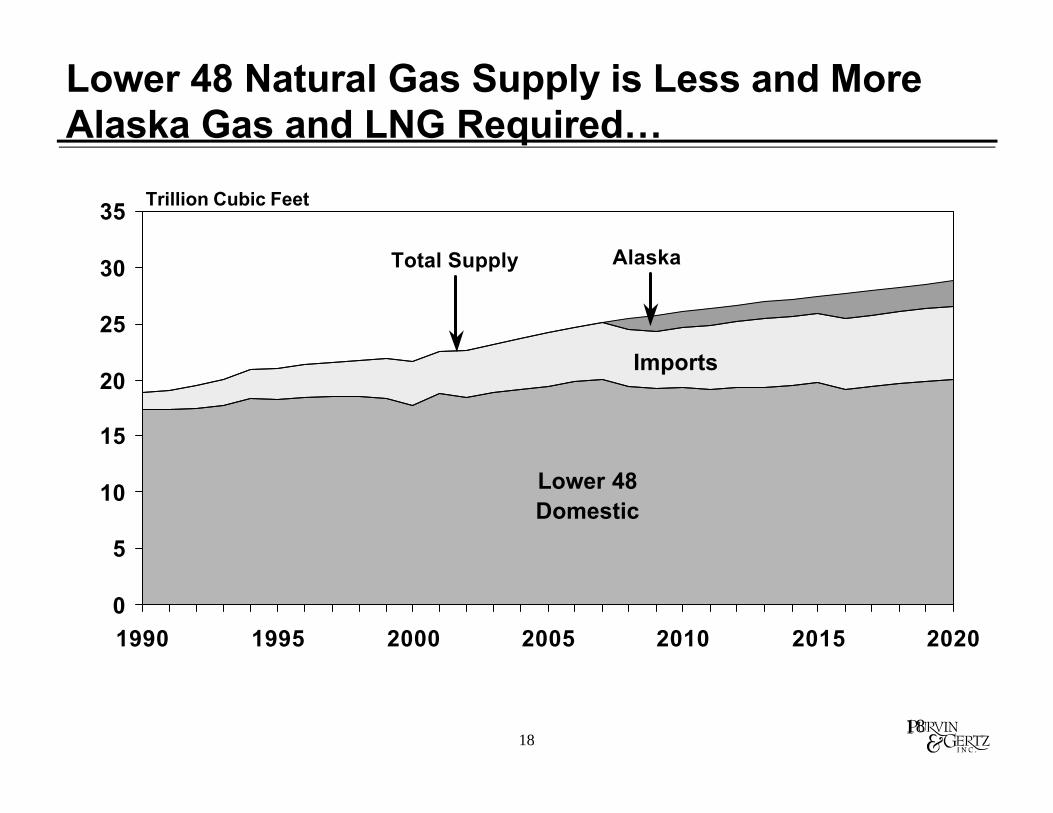
18.18
Lower 48 Domestic
Imports
0
5
10
15
20
25
30
35
1990 1995 2000 2005 2010 2015 2020
Lower 48 Natural Gas Supply is Less and More Alaska Gas and LNG Required…
Trillion Cubic Feet
Total Supply Alaska

19.19
Supply Constrained Scenario Lower 48 Natural Gas Flow Patterns: 2010 BCF
1284
662
0
60
403
1472
42
1096
238
300
71
363
1093
70764
4560
1659
3628955
336785
1421
2325
625
352204
31
19
368
25Pacific
Northwest Mountain I
California
Mountain II
West South Central
West North Central
East North Central
East South Central
New England
Middle Atlantic
South Atlantic
Florida
579
93
211
1460 (AK)

20.20
MARKET IMPACTS & IMPLICATIONS

21.21
Arctic Gas Implications for Stakeholders
Ø Market implications for industry participants from flowing a large new increment of natural gas from the Arctic into the North American gas grid are an important strategic consideration.
Ø For example, Arctic producer groups on both sides of the U.S./Canada border would definitely have an interest on the market impacts and infrastructure implications of an Alaska Highway or an Over-The-Top natural gas pipeline.
Ø Producers in other regions would also have an interest in the market impacts of the Arctic gas flows and take-away pipeline capacity out of Western Canada.
Ø Other commercial interests such as pipeline project developers and project suppliers of goods and services would have an interest.
Ø Large energy users would have an interest with respect to the cost and availability of feedstock and energy for their plants.

22.22
Arctic Gas Implications for Stakeholders (Cont’d)
Ø The U.S. Government and various state jurisdictions (e.g. Alaska) would have a strong interest in Arctic gas development.
Ø The Governments of Canada, Alberta, British Columbia, the Yukon and the Northwest Territories would also have an interest.
Ø Local northern communities, First Nations, regulatory bodies, environmental groups, landowners, small end-users are also stakeholders.
Ø The above are loosely defined as the stakeholders but we will focus on a producer perspective.

23.23
Producer Perspective
Ø Major producing companies in any given area rightfully believe that pipeline projects are driven by their upstream developments.
Ø Other producers in the area or along the likely pipeline corridor want to ensure that pipeline capacity built for the major area players will also allow for their production to reach market.
Ø Potential Arctic gas producers currently see gas demand growth, concern over future conventional natural gas supply, the promising Arctic gas resource potential, technology innovations and cost reductions for Arctic projects, and recent gas price strength as the principal drivers for development.

24.24
Producer Perspective (Cont’d)
Ø The primary objective of the major Prudhoe Bay producers on Alaska’s North Slope (ExxonMobil, BP, ConocoPhillips) is similar to the Mackenzie Delta producers, namely, economically and profitability develop the currently stranded gas assets in their region.
Ø The greatest economic risks for Arctic gas projects revolve around market price and project costs.
Ø One of the producers’ key indicators of the economics of an Arctic project is their netback calculation from the market price minus all the costs to the wellhead. The netback must then cover all of their wellhead costs including a reasonable return.

25.25
Producer Perspective (Cont’d)
Ø Arctic gas projects are competing for scarce corporate funds and the projects must be sufficiently economic to attract those funds. If project costs are too high or market prices are too low, then there won’t be project. No project means no benefits from Arctic gas development. Alaska politicians haven’t figured this out yet!
Ø Pipeline costs are an important component in the producer netback calculation, especially given the vast distances to market of these currently stranded gas assets. Hence producer interest in reducing these costs as much as possible.
Ø Arctic gas and non-Arctic gas producers will see major price impacts.
Ø For example, large Alaska gas flows in 2008 could temporarily depress prices, which would reduce drilling activities. Given natural decline rates, production would decrease. The markets would re-equilibrate, prices would increase and production levels would then be restored within a few years. It is to the advantage Arctic gas producers to improve the market fit to reduce impacts on their own non-Arctic assets.

26.26
Alaska Gas Flows in Context (Cont’d)
Relative Size of 4 BCF/D in 2008 Compared to Incremental Growth
Ø Equivalent to 3 years of demand growth in the Lower 48 (1.3 BCF/D each year)
Ø Or, equivalent to 7 years of demand growth in Canada’s traditional export markets (West Coast and Northern Tier states)
Ø Over 15 years worth of incremental production out of Western Canada over forecast period
Ø Represents nearly all incremental growth in Lower 48 gas imports over the next 20 years (4 versus 4.5 BCF/D)

27.27
Market Impacts – Alaska Gas Flows
Ø 4 BCF/D from Alaska has the potential to cause severe market dislocations
Ø Mitigating measures would likely by undertaken to encourage the development of major incremental markets
Ø Exact impacts depend more on market fit than sheer size
Ø Prices are reduced for a few years
Ø Activity is reduced in currently producing basins until new balance achieved

28.28
Market Impacts – Alaska Gas Flows (Cont’d)
ØAdditional pipeline capacity required within Western Canada as well as takeaway capacity toward Midwest, and/or California and/or U.S. Northeast and/or Central Canada
ØTemporary underutilization of existing intra-Western Canada pipeline capacity
ØLikely shippers will be producers, marketers, and electricity generators

29.29
Increasing the Market Fit
Ø Lack of integrated approach partly explains severity and multiple year impacts of Alaska Case
Ø Even more dramatic regional impacts if Arctic pipeline ends in WCSB
Ø Alignment with ex-basin take-away capacity somewhat alleviate impacts and improves overall market fit
Ø Creating incremental demand (electricity, transportation) improves market fit
Ø The volumes of a standalone development of the Mackenzie Delta have a much better market fit

30.30
SUMMARY AND CONCLUSIONS

31.31
Summary and Conclusions
Ø Strong gas demand growth will be satisfied by conventional and increasingly by frontier supply
Ø Arctic gas is the next major increment of supply and will require major upstream investments
Ø Arctic gas pipelines and takeaway capacity out of Western Canada represent major business and investment opportunities but major risks exist

32.32
Summary and Conclusions (cont’d)
Ø Major implications for stakeholders
Ø Price impacts of major Arctic gas flows must be taken into account
Ø Partnership between industry and government required to develop Arctic gas
Ø Current market conditions and politics have probably delayed Alaska gas

.INTERNATIONAL ENERGY CONSULTANTS
www.purvingertz.com
“Purvin & Gertz is an independent, employee owned, international energy consulting firm
providing sound and objective strategic, commercial,and technical advise to the energy sector.”

34.34
Ø This analysis has been prepared for the sole benefit of the client. Neither the analysis nor any part of the analysis shall be provided to third parties without the written consent of Purvin & Gertz. Any third party in possession of the analysis may not rely upon its conclusions without the written consent of Purvin & Gertz. Possession of the analysis does not carry with it the right of publication.
Ø Purvin & Gertz conducted this analysis utilizing reasonable care and skill in applying methods of analysis consistent with normal industry practice. All results are based on information available at the time of review. Changes in factors upon which the review is based could affect the results. Forecasts are inherently uncertain because of events orcombinations of events that cannot reasonably be foreseen including the actions of government, individuals, third parties and competitors. NO IMPLIED WARRANTY OF MERCHANTABILITY OR FITNESS FOR A PARTICULAR PURPOSE SHALL APPLY.
Ø Some of the information on which this analysis is based has beenprovided by others. Purvin & Gertz has utilized such information without verification unless specifically noted otherwise. Purvin & Gertz accepts no liability for errors or inaccuracies in information provided by others.