cfa emission models for the reinforced plastics industry · cfa emission models for the reinforced...
TRANSCRIPT
CFA Emission Modelsfor the
Reinforced Plastics Industries
by
______________________________
Robert A. Haberlein, Ph.D., QEPEngineering Environmental
Two Fisk Circle Annapolis, Maryland 21401
on behalf of the
Composites Fabricators Association
International Cast Polymer Association
Composites Institute
February 28, 1998
i
TABLE OF CONTENTS
Forward . . . . . . . . . . . . . . . . . . . . . . . . . . . . . . . . . . . . . . . . . . . . . . . . . . . . . . . . . . . . . . . . . iii
Acknowledgments . . . . . . . . . . . . . . . . . . . . . . . . . . . . . . . . . . . . . . . . . . . . . . . . . . . . . . . . . . iv
Executive Summary . . . . . . . . . . . . . . . . . . . . . . . . . . . . . . . . . . . . . . . . . . . . . . . . . . . . . . . . . . v
1 - Introduction . . . . . . . . . . . . . . . . . . . . . . . . . . . . . . . . . . . . . . . . . . . . . . . . . . . . . . . . . . . . 1
2 - Derivation of the CFA Emission Models . . . . . . . . . . . . . . . . . . . . . . . . . . . . . . . . . . . . . . . 22.1 - Background . . . . . . . . . . . . . . . . . . . . . . . . . . . . . . . . . . . . . . . . . . . . . . . . . . . . . 22.2 - CFA Emission Study . . . . . . . . . . . . . . . . . . . . . . . . . . . . . . . . . . . . . . . . . . . . . . 22.3 - Dow Filament Winding Emission Study . . . . . . . . . . . . . . . . . . . . . . . . . . . . . . . . 32.4 - Test Results . . . . . . . . . . . . . . . . . . . . . . . . . . . . . . . . . . . . . . . . . . . . . . . . . . . . . 32.5 - Linear Regressions and Emission Control Factors . . . . . . . . . . . . . . . . . . . . . . . . 5
2.5.1 - Manual Resin Application (Hand Lay-up) . . . . . . . . . . . . . . . . . . . . . . . 52.5.2 - Mechanical Resin Application (Spray Lay-up) . . . . . . . . . . . . . . . . . . . . 92.5.3 - Gelcoat Spraying . . . . . . . . . . . . . . . . . . . . . . . . . . . . . . . . . . . . . . . . . 132.5.4 - Filament Winding . . . . . . . . . . . . . . . . . . . . . . . . . . . . . . . . . . . . . . . . 16
2.6 - CFA Emission Models . . . . . . . . . . . . . . . . . . . . . . . . . . . . . . . . . . . . . . . . . . . . 192.6.1 - Manual Resin Application (Hand Lay-up) Model . . . . . . . . . . . . . . . . . 202.6.2 - Mechanical Resin Application (Spray Lay-up) Model . . . . . . . . . . . . . . 202.6.3 - Gelcoat Spraying Model . . . . . . . . . . . . . . . . . . . . . . . . . . . . . . . . . . . 212.6.4 - Filament Winding Model . . . . . . . . . . . . . . . . . . . . . . . . . . . . . . . . . . . 21
3 - Verification of CFA Emission Models . . . . . . . . . . . . . . . . . . . . . . . . . . . . . . . . . . . . . . . . 253.1 - Available Emissions Data . . . . . . . . . . . . . . . . . . . . . . . . . . . . . . . . . . . . . . . . . . 253.2 - EPA Emission Equations . . . . . . . . . . . . . . . . . . . . . . . . . . . . . . . . . . . . . . . . . . 253.3 - RTI Emissions Study . . . . . . . . . . . . . . . . . . . . . . . . . . . . . . . . . . . . . . . . . . . . . 32
4 - Appendices . . . . . . . . . . . . . . . . . . . . . . . . . . . . . . . . . . . . . . . . . . . . . . . . . . . . . . . . . . . . 34
ii
LIST OF FIGURES
2.1 - Plot of the CFA Emission Models for Non-Suppressed Resin . . . . . . . . . . . . . . . . . . . . 222.2 - Plot of the CFA Emission Models for Vapor-Suppressed Resin . . . . . . . . . . . . . . . . . . . 233.1 - Plots of the EPA’s Emission Equations (emissions vs % styrene) . . . . . . . . . . . . . . . . . . 273.2 - Plot of the EPA Equation versus the CFA Model for Manual (Hand Lay-up) . . . . . . . . . 283.3 - Plots of the EPA Equations vs the CFA Model for Spray Lay-up . . . . . . . . . . . . . . . . . . 293.4 - Plot of the EPA Equation vs the CFA Model for Filament Winding . . . . . . . . . . . . . . . . 30
LIST OF TABLES
2.1 - CFA Test Variable Contributions to Emissions (% resin/gelcoat) . . . . . . . . . . . . . . . . . . 42.2 - Four-Variable Linear Regression for Manual Application . . . . . . . . . . . . . . . . . . . . . . . . 62.3 - One-Variable (Styrene) Linear Regression for Manual Application . . . . . . . . . . . . . . . . 72.4 - Suppressant Control Factor for Manual Application . . . . . . . . . . . . . . . . . . . . . . . . . . . . 82.5 - Five-Variable Linear Regression for Mechanical Application . . . . . . . . . . . . . . . . . . . . 102.6 - One-Variable (Styrene) Linear Regression for Mechanical Application . . . . . . . . . . . . . 112.7 - Suppressant Control Factor for Spray Lay-up Emissions . . . . . . . . . . . . . . . . . . . . . . . 122.8 - Control Factor for Controlled Spraying of Spray Lay-up Emissions . . . . . . . . . . . . . . . 122.9 - Non-Spray Equipment Control Factor for Mechanical Application . . . . . . . . . . . . . . . . 132.10 - Five-Variable Linear Regression for Gelcoat Emissions . . . . . . . . . . . . . . . . . . . . . . . . 142.11 - One-Variable (Styrene) Linear Regression for Gelcoat Emissions . . . . . . . . . . . . . . . . 142.12 - Control Factor for Controlled Spraying of Gelcoat . . . . . . . . . . . . . . . . . . . . . . . . . . . 152.13 - Four-Variable Linear Regression for Filament Winding . . . . . . . . . . . . . . . . . . . . . . . . 172.14 - One-Variable (Styrene) Linear Regression for Filament Winding . . . . . . . . . . . . . . . . . 182.15 - Control Factor for Filament Winding with Suppressed Resin . . . . . . . . . . . . . . . . . . . . 182.16 - Emission Factors for the CFA Emission Models . . . . . . . . . . . . . . . . . . . . . . . . . . . . . . 243.1 - Linear Regression of the Composite Curve for Spray Lay-up . . . . . . . . . . . . . . . . . . . 313.2 - Comparisons of the EPA & CFA Control Factors . . . . . . . . . . . . . . . . . . . . . . . . . . . . 313.3 - Summary of RTI Test Results . . . . . . . . . . . . . . . . . . . . . . . . . . . . . . . . . . . . . . . . . . . 33
LIST OF APPENDICES
A - CFA Test Data (Phase I and Phase II) . . . . . . . . . . . . . . . . . . . . . . . . . . . . . . . . . . . . . 34B - Dow Filament Winding Test Data . . . . . . . . . . . . . . . . . . . . . . . . . . . . . . . . . . . . . . . . 37

Engineering Environmental Consulting Services
iii
Forward
An earlier version of this report was issued on September 18, 1997, and was originallyentitled “Derivation and Verification of the CFA Emission Models.” Many helpful comments andcorrections were offered by Environmental Protection Agency (EPA) staff and reinforced plasticsindustries (RPI) reviewers since the earlier version of this report was released. In order toincorporate these comments and corrections, two addenda to the original report were issued onOctober 8, 1997 and December 6, 1997. The first addendum amended the data set used toperform the manual resin application regression analysis. The second addendum revised theapproach used to estimate the vapor suppressant factor for manual resin application and correctedthe data set used to perform the mechanical resin application regression analysis.
The earlier version of this report was the first of two reports created as technical supportdocuments for the proposed Composites Fabricators Association (CFA) Maximum AchievableControl Technology (MACT) approach for existing open molding sources in the RPI. Theemission models discussed therein were essential to the proposed CFA MACT approach. Thesecond companion report was entitled “Analysis of the Open Molding Database.” This secondreport compared the CFA Emission Model estimates with the EPA emission estimates containedin the EPA’s April 1997 Open Molding database.
In late December 1997, the EPA Emissions Monitoring and Analysis Division, EmissionFactor and Inventory Group, requested reproducible copies of the original report and addenda aspart of a planned update to the AP-42 emission factors for the RPI. However, instead of merelyproviding the earlier version of the report and associated addenda, which focused on the MACTproposal for the RPI, this revised report was prepared to incorporate the comments andcorrections in one document and to provide a more general focus on the models.
The title of this revised report was also changed slightly to prevent confusion with theearlier version.
Engineering Environmental Consulting Services
iv
Acknowledgments
I wish to acknowledge the following individuals and organizations for their advice andassistance in the preparation of this analysis and report:
Perry Bennett, Molded Fiber Glass Products
Jeff Benz, Ershigs
Alice Boomhower, Amoco
Larry Craigie, Dow Chemical
Peter De la Cruz, Keller & Heckman
Nancy Dehmlow, GLS
Charles Elkins, Jellnek, Schwartz & Connolly
Bill Holtzclaw, Holtec, LTD
Bob Lacovara, Composite Fabricators Association
David Lipiro, McLaren Hart
Gordon Lowe, Lasco Bathware
Richard Martens, Reichhold
Steve McNally, Composite Fabricators Association
Neil Olsen, Xerxes Corporation
Craig Peterson, Xerxes Corporation
Ron Ryan, U.S. EPA, EMAD
John Schweitzer, Composites Institute

Engineering Environmental Consulting Services
v
Executive Summary
The Environmental Protection Agency (EPA) maintains an official set of predictiveemissions factors, known as the AP-42 emission factors. In the past, these factors were used bymost of the industry and state regulatory agencies to estimate the styrene emission rates from thevarious reinforced plastics lamination processes. However, several recent independent styrenesource tests indicated that the AP-42 emission factors may significantly under-predict styreneemissions from some reinforced plastics sources.
To investigate this indicated discrepancy, the Composites Fabricators Association (CFA)conducted an extensive two-phase study of the styrene emissions from the major laminationprocesses and the effects of the available control techniques. These processes and techniquesincluded hand lay-up, spray lay-up, gelcoat spraying. controlled spraying, non-atomized resinapplication (flow coating and pressure-fed rollers), and vapor suppressants.
This analysis derives simple mathematical expressions of the CFA test data for theseprocesses and techniques. These expressions are called CFA Models, and consist of linearequations based on the amount-of-resin-consumed and simple numerical control factors. Theamount-of-resin-consumed basis is selected because it results in the best statistical fit with thedata. This analysis also verifies the accuracy of the CFA Models by comparing the model outputsto the available EPA data on styrene emissions. The available data includes EPA emissionequations and a Research Triangle Institute (RTI) emission study.
The EPA developed several predictive equations and control factors for estimatingbaseline and reduced Maximum Achievable Control Technology (MACT) styrene emission rates. These equations appear in the EPA’s April 1997 Open Molding database for the reinforcedplastics industries (RPI). Although no supporting information was included with this database,these EPA equations are presumably based upon valid styrene emissions data. A comparison ofthe EPA equations with the CFA Models shows some differences and some similarities. The EPAequations are based upon the amount-of-available-styrene-consumed, which tends to overestimatethe effect of styrene content on emissions, especially at higher content levels. The EPA equationsalso differentiate between filled and unfilled resin emissions, which is not supported by the CFAstudy. In spite of these differences, the EPA equations generally agree with the CFA Models. Insome cases, the EPA equations are nearly identical to, or closely match, the corresponding CFAModel.
The RTI, an EPA technical consultant, also conducted styrene emission testing of thespray lay-up process. The RTI study also investigated the effects of controlled spraying, non-atomized resin application (flow coating and pressure-fed rollers), and vapor suppressants Acomparison of the results of this RTI study to the CFA Spray Lay-up Model shows a remarkable,near-perfect agreement between the RTI study and the CFA Model.

Engineering Environmental Consulting Services
1
Section 1 - Introduction
The purpose of this report is to derive styrene emission models from emission test data forthe open molding processes used by the reinforced plastics industry. This derivation consists ofthe following three steps:
1. Styrene emission data is obtained through extensive emission testing for thevarious lamination processes.
2. Simple linear emission equations are developed from this emission data usingstandard linear regression techniques.
3. A matrix of feasible control options, which are both significant and practicallyenforceable, is created from components of these emission models.
The matrix both describes and defines the CFA Models. The CFA Models discussed hereinrepresent the simplest expressions of the available CFA and Dow test data. However, thefollowing five cautions should be observed when applying these emission models to such a diverseindustry as the RPI:
Only styrene vapor emissions are modeled - styrene is the major VOC and HAP contained in theresin and gelcoat formulations used by the RPI, and was the only HAP tested by the CFA. However, other VOC or HAP constituents may be present in some resin or gelcoat formulations. The CFA Models only apply to styrene vapor emissions.
The range of tested monomer levels is limited - the CFA tested resin formulations with styrenecontents between 34% and 49%, and gelcoat formulations with styrene contents between 35%and 40%. Other resin and gelcoat formulations may be available with styrene contents above orbelow these tested ranges. The effect of styrene contents outside the tested ranges is not known,and will be investigated further by the CFA in 1998.
Some control technique combinations are not yet tested - some of the control techniquesinvestigated by the CFA have not been tested together in concert, and the effect of thesecombinations may be less than or greater than a simple linear combination of the individual controlfactors. The CFA is conducting further tests on these combinations, and the results of this testingshould be available by May 15, 1998.
Individual source emissions may deviate from the average - the CFA models predict averageemission rates and are not designed to predict an exact emission rate for each individual source.
Vapor-suppressant performance may be affected by filler loading or resin type - the CFA iscurrently developing a standard test methodology to measure and adjust the effect of vapor-suppressant for specific resin formulations (including filler loading). This test methodologyshould be available by May 15, 1998.

Engineering Environmental Consulting Services
2
Section 2 - Derivation of the CFA Emission Models
This section describes the derivation of four CFA Emission Models, one model for eachlamination process used in open molding, including manual resin application (hand lay-up),mechanical resin application (spray lay-up), gelcoat spraying and filament winding.
2.1 - Background The EPA maintains an official set of predictive emissions factors, known as the AP-42
emission factors. In the past, these factors were used by most of the industry and state regulatoryagencies to estimate the styrene emission rates from the various reinforced plastics laminationprocesses. However, several recent independent styrene source tests indicated that the AP-42emission factors may significantly under-predict styrene emissions from some reinforced plasticssources. To investigate this indicated discrepancy, the CFA conducted an extensive two-phasestudy of the styrene emissions from the major lamination processes and the effects of the availablecontrol techniques. This study is described below.
2.2 - CFA Emission Study
Phase I
The Phase I study consisted of a total of 60 experimental runs (including run replicates),which explored the effect of various process variables that may affect emissions. Theexperimental plans for both the mechanical resin application (spray lay-up) and gelcoat sprayingprocesses were blocked, five-variable, two-level, half factorial, “screening” designs for estimatingthe relative magnitude of each variable response. The experimental plan for the manual resinapplication (hand lay-up) process was a blocked, four-variable, two-level, full factorial,“screening” design.
The five experimental variables investigated in the CFA emission study of the mechanicalresin application process (spray lay-up) and gelcoat spraying process were:
Laminate thicknessStyrene content of resin Gel timeResin application rateAir flow
The manual resin application (hand lay-up) study did not include the resin application rate,because it was not applicable to manual application.

Engineering Environmental Consulting Services
3
Phase II
The Phase II study consisted of a total of 61 additional experimental runs. Phase IIfocused on the effect of the various emission control methods that could be applied to thelamination processes. For the mechanical resin application (spray lay-up) process, the followingemission control methods were explored:
Vapor suppressantNon-atomizing application equipment (pressure-fed rollers and flow coaters)Optimized sprayingBPO catalyst
Only optimized spraying was investigated for gelcoat spraying, because vapor suppressant andnon-atomizing application equipment are not feasible (or are extremely limited) for gelcoatapplication. Likewise, only vapor suppressant was considered for the manual resin application(hand lay-up) process, because spray application techniques are obviously not applicable.
2.3 - Dow Filament Winding Emission Study.
Dow conducted laboratory testing of the styrene emissions from the filament windingprocess. The Dow study consisted of a total of 20 individual experimental runs, and the test datafrom this study was provided by Dow in spreadsheet format [e-mail file transmittal from L.Craigie to R.
Haberlein, July 2, 1997]. The first ten runs investigated the effect of the following three experimentalvariables:
Styrene content of resin (% styrene by weight)Temperature (EF)Part size (square feet)
These variables were given two different values to assess their corresponding impact on thestyrene emission rate. The last ten runs investigated the effect of vapor suppressant combinedwith the prior experimental variables.
2.4 - Test Results
Compilations of all test data used in this analysis are provided in the appendices the end ofthis report. These compilations identify every test run, list the independent variable values, andexpress the associated styrene emission results as both a percentage of the available styreneweight and as a percentage of the neat resin weight. The CFA emission test data is listed inAppendix A and the Dow emission test data is listed in Appendix B.

Engineering Environmental Consulting Services
4
CFA Test Results
The contribution of each variable to the total response, or emission rate, was calculated bythe Dow researchers as the normalized F-ratio for each statistic. Assuming a styrene emissionrate based upon the total weight of neat resin or gelcoat consumed, the relative contributions ofthe open molding variables are listed in Table 2.1 below [from Craigie, L., Dow; phone communication
with R. Haberlein; 7/15/97]. The sum of the variable responses listed above deviated slightly from atotal of 100% due to some slight rounding errors.
Table 2.1 - CFA Test Variable Contributions to Emissions (% resin/gelcoat)
Manual resin application: Thickness 50% (hand lay-up) Styrene Content 39%
Gel Time 11%Air Flow 0%
Mechanical resin application: Styrene Content 88% (spray lay-up) Application Rate 10%
Thickness 1.3%Gel Time 0.3%Air Flow 0.1%
Gelcoat Spraying: Styrene Content 67%Thickness 29%Air Flow 1.5%Gel Time 1.3%Application Rate 0.23%
For the three processes investigated in the CFA testing, the filler content and air flow overthe wet surface had no significant effect. Therefore, these variables were not considered further inthe development of the CFA Emission Models. For manual resin application (hand lay-up), theapplied thickness and styrene monomer had the greatest effect. Gel time only had a minor effect. For spray lay-up, the styrene content was the predominate effect at 88%. The application ratevariable only had a minor effect (10% of total response), and the laminate thickness and gel timevariables had no significant effect. For gelcoat spraying, the styrene content was again thepredominate effect at 67%. The applied thickness was a minor effect (29% of total response),and the application rate and gel time variables had no significant effect.
Dow Test Results
According to the Dow researchers, the styrene content of the resin has the most significanteffect on the styrene emission rate from filament winding. Vapor suppressants also have asignificant effect, with more effect shown for high styrene contents resins than on low styrenecontent resins. Neither temperature nor mandrel size has a significant effect on emissions.

Engineering Environmental Consulting Services
5
2.5 - Linear Regressions and Emission Control Factors
In all of the following cases, the linear regression fits are significantly better when thestyrene emissions are expressed as a percentage of consumed resin instead of as a percentage ofavailable styrene monomer. For example, the r2 values for the different regression fits of thestyrene emissions as consumed resin and styrene emissions as percentage available styrenemonomer are:
r2 (as % resin) r2 (as % styrene)Manual Application (one variable) 0.5034 0.2035Mechanical Application (one variable) 0.7145 0.3983Gelcoat Spraying (one variable) 0.6539 0.3282Filament Winding (one variable) 0.7396 0.2026
The styrene emission estimates using the percentage-of-resin-consumed basis have significantly better fits, so the CFA emission factor equations are calculated using the percentage-of-resin-consumed basis instead of the percentage-of-available-styrene basis.
2.5.1 - Manual Resin Application (Hand Lay-up)
Emission Factor
The linear regression fit for all four of the Phase I variables (as a function of consumedresin) is shown in Table 2.2. The corresponding equation for estimating styrene emissions is:
emissions (as % resin) = - 0.46365 x thickness + 0.00265 x % styrene + 0.00068 x gel time + 0.00003 x air flow - 0.0320 [eq 1]
The overall fit is very good (r2 = 0.9697) and the standard error of the equation is only 0.0034. However, the coefficients for gel time and air flow have relatively large standard error values, andthe coefficient for air flow is nearly zero. This suggests that these variables are not gooddescriptors for the styrene emissions from manual resin application (hand lay-up).
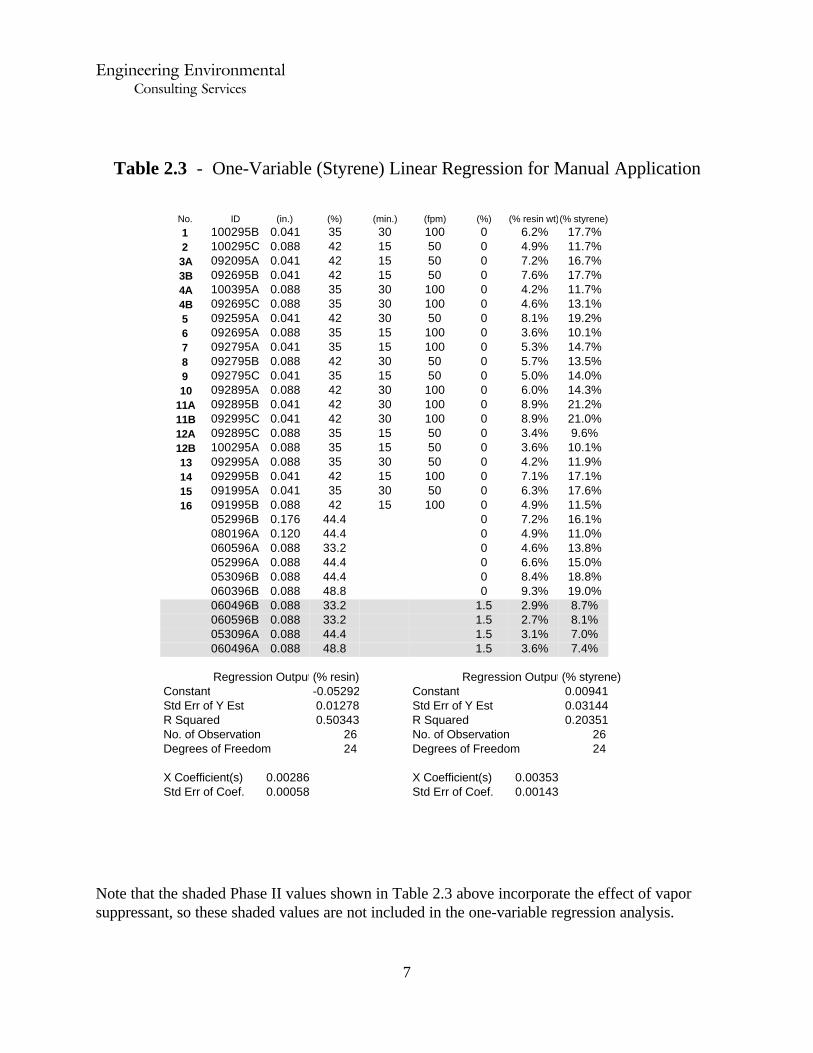
The linear regression fit for just the styrene content variable is shown in Table 2.3 below. The corresponding equation for estimating styrene emissions for manual resin application (handlay-up) is:
emissions (as % resin) = 0.00286 x % styrene - 0.0529 [eq 2]
The data for both Phase I and Phase II (30 data sets) is used. The overall fit is not as good as thefit for all four variables using just the Phase I data set (r2 = 0.50343), but the standard error of theequation is still only 0.01278, which is acceptable.

Engineering Environmental Consulting Services
6
(% styrene)(% resin wt)(%)(fpm)(min.)(%)(in.)IDNo.
17.7%6.2%010030350.041100295B111.7%4.9%05015420.088100295C216.7%7.2%05015420.041092095A3A17.7%7.6%05015420.041092695B3B11.7%4.2%010030350.088100395A4A13.1%4.6%010030350.088092695C4B19.2%8.1%05030420.041092595A510.1%3.6%010015350.088092695A614.7%5.3%010015350.041092795A713.5%5.7%05030420.088092795B814.0%5.0%05015350.041092795C914.3%6.0%010030420.088092895A1021.2%8.9%010030420.041092895B11A21.0%8.9%010030420.041092995C11B9.6%3.4%05015350.088092895C12A
10.1%3.6%05015350.088100295A12B11.9%4.2%05030350.088092995A1317.1%7.1%010015420.041092995B1417.6%6.3%05030350.041091995A1511.5%4.9%010015420.088091995B16
Phase I runs - emissions as % resinRegression Output:
-0.0320Constant0.0034Std Err of Y Est
0.969750R Squared20No. of Observations15Degrees of Freedom
(fpm)(min.)(%)(in.)3.333E-050.000680.00265-0.46365X Coefficient(s)3.078E-050.000100.000220.03274Std Err of Coef.
Table 2.2 - Four-Variable Linear Regression for Manual Application
Engineering Environmental Consulting Services
7
(% styrene)(% resin wt)(%)(fpm)(min.)(%)(in.)IDNo.17.7%6.2%010030350.041100295B111.7%4.9%05015420.088100295C216.7%7.2%05015420.041092095A3A17.7%7.6%05015420.041092695B3B11.7%4.2%010030350.088100395A4A13.1%4.6%010030350.088092695C4B19.2%8.1%05030420.041092595A510.1%3.6%010015350.088092695A614.7%5.3%010015350.041092795A713.5%5.7%05030420.088092795B814.0%5.0%05015350.041092795C914.3%6.0%010030420.088092895A1021.2%8.9%010030420.041092895B11A21.0%8.9%010030420.041092995C11B9.6%3.4%05015350.088092895C12A10.1%3.6%05015350.088100295A12B11.9%4.2%05030350.088092995A1317.1%7.1%010015420.041092995B1417.6%6.3%05030350.041091995A1511.5%4.9%010015420.088091995B1616.1%7.2%044.40.176052996B11.0%4.9%044.40.120080196A13.8%4.6%033.20.088060596A15.0%6.6%044.40.088052996A18.8%8.4%044.40.088053096B19.0%9.3%048.80.088060396B8.7%2.9%1.533.20.088060496B8.1%2.7%1.533.20.088060596B7.0%3.1%1.544.40.088053096A7.4%3.6%1.548.80.088060496A
(% styrene)Regression Output:(% resin)Regression Output:0.00941Constant-0.05292Constant0.03144Std Err of Y Est0.01278Std Err of Y Est0.20351R Squared0.50343R Squared
26No. of Observations26No. of Observations24Degrees of Freedom24Degrees of Freedom
0.00353X Coefficient(s)0.00286X Coefficient(s)0.00143Std Err of Coef.0.00058Std Err of Coef.
Table 2.3 - One-Variable (Styrene) Linear Regression for Manual Application
Note that the shaded Phase II values shown in Table 2.3 above incorporate the effect of vaporsuppressant, so these shaded values are not included in the one-variable regression analysis.
Engineering Environmental Consulting Services
8
suppressantstyrenestyrene emissionslevelcontentthicknessrun
(% styrene)(% resin)(% resin)(% resin)
8.7%2.9%1.533.20.088060496B8.1%2.7%1.533.20.088060596B7.0%3.1%1.544.40.088053096A7.4%3.6%1.548.80.088060496A
Regression Output:0.012892Constant0.001849Std Err of Y Est0.847151R Squared
4No. of Observations2Degrees of Freedom
0.0004476X Coefficient(s)0.0001344Std Err of Coef.
Suppressant Control Factor
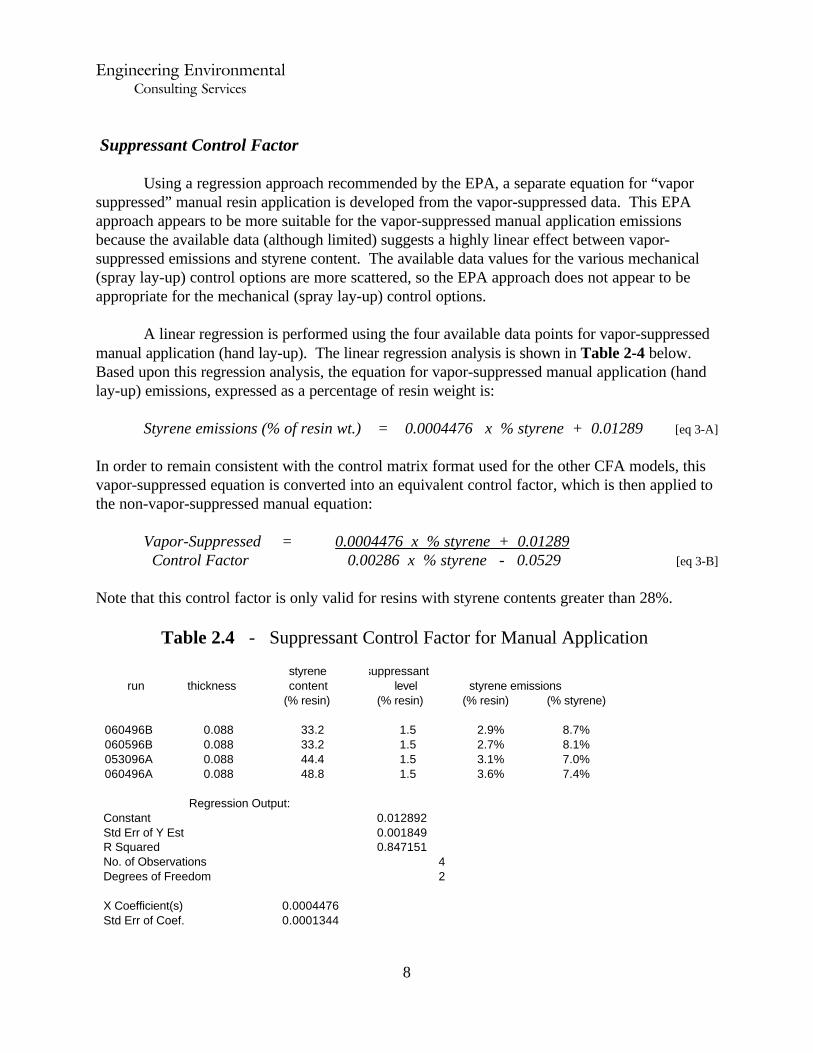
Using a regression approach recommended by the EPA, a separate equation for “vaporsuppressed” manual resin application is developed from the vapor-suppressed data. This EPAapproach appears to be more suitable for the vapor-suppressed manual application emissionsbecause the available data (although limited) suggests a highly linear effect between vapor-suppressed emissions and styrene content. The available data values for the various mechanical(spray lay-up) control options are more scattered, so the EPA approach does not appear to beappropriate for the mechanical (spray lay-up) control options.
A linear regression is performed using the four available data points for vapor-suppressedmanual application (hand lay-up). The linear regression analysis is shown in Table 2-4 below. Based upon this regression analysis, the equation for vapor-suppressed manual application (handlay-up) emissions, expressed as a percentage of resin weight is:
Styrene emissions (% of resin wt.) = 0.0004476 x % styrene + 0.01289 [eq 3-A]
In order to remain consistent with the control matrix format used for the other CFA models, thisvapor-suppressed equation is converted into an equivalent control factor, which is then applied tothe non-vapor-suppressed manual equation:
Vapor-Suppressed = 0.0004476 x % styrene + 0.01289 Control Factor 0.00286 x % styrene - 0.0529 [eq 3-B]
Note that this control factor is only valid for resins with styrene contents greater than 28%.
Table 2.4 - Suppressant Control Factor for Manual Application

Engineering Environmental Consulting Services
9
2.5.2 - Mechanical Resin Application (Spray Lay-up)
Emission Factor
The linear regression fit for all five of the Phase I variables (as a function of consumedresin) is shown in Table 2.5 below. The equation for estimating styrene emissions is:
emissions (as % resin) = - 0.19881 x thickness + 0.00827 x % styrene + 0.00038 x gel time - 0.00854 x resin flow + 0.00003 x air flow - 0.1941 [eq 4]
The overall fit is very good (r2 = 0.8698) and the standard error of the equation is only 0.0143. However, the coefficients for thickness, gel time, resin flow, and air flow have relatively largestandard error values, and the coefficients for the air flow and gel time are nearly zero. Thissuggests that these variables are not good descriptors for the styrene emissions from spray lay-up.
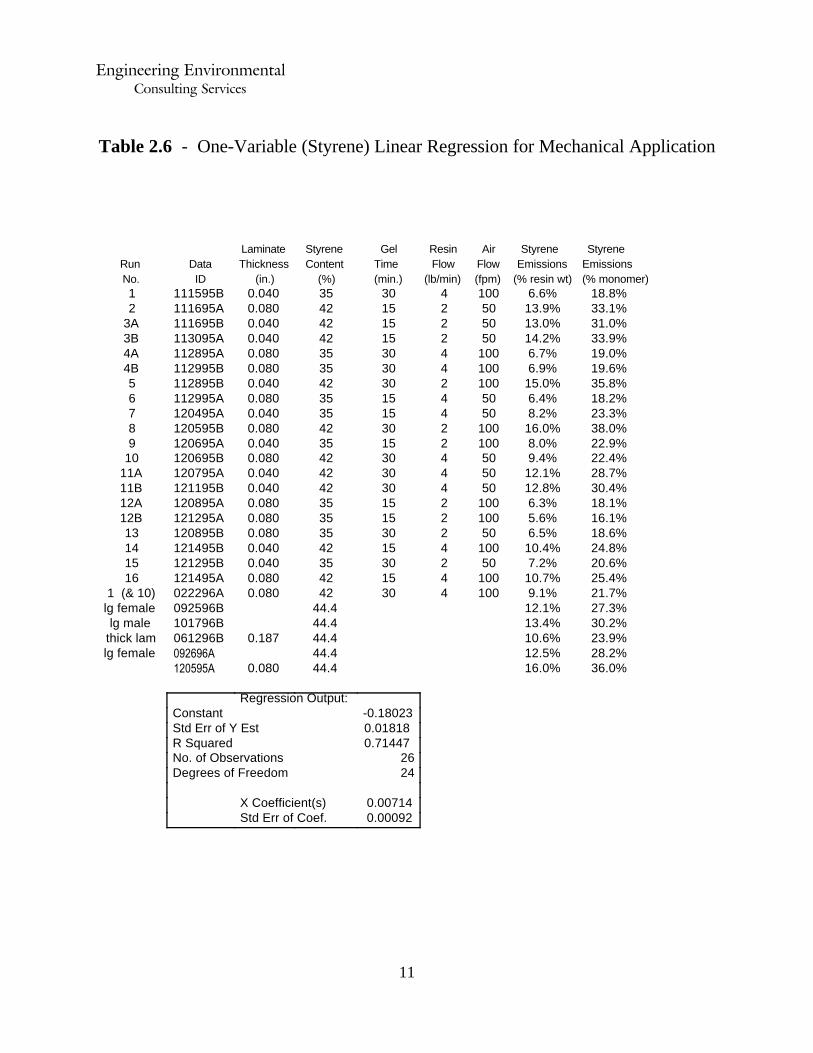
The linear regression fit for just the styrene monomer content variable is shown in Table2.6 below. The corresponding equation for estimating styrene emissions is:
emissions (as % resin) = 0.00714 x % styrene - 0.180 [eq 5]
The data for both Phase I and Phase II (26 data sets) is used. The overall fit is not as good as forall five variables using just the Phase I data set (r2 = 0.71447), but the standard error of theequation is still only 0.01818, which is acceptable.
Suppressant Control Factor
The calculation of the suppressant control factor, which is the emissions factor withsuppressant divided by the emissions factor without suppressant, is shown in Table 2.7 below. Thirteen data sets (including one Phase I data set) are compared to investigate the effect ofsuppressant on emissions at three different monomer content levels. No obvious relationshipbetween styrene monomer content and suppressant effect is observed for this data. Thesuppressant factor varies from 0.54 to 0.69, with an average value of 0.62. Controlled-Spraying Factor
The calculation of the controlled-spraying reduction factor, which is the emissions factorwith controlled-spraying divided by the emissions factor without controlled-spraying, is shown inTable 2.8 below. Twelve data sets are compared to investigate the effect of controlled-sprayingon emissions at two different monomer content levels. No obvious relationship between styrenemonomer content and controlled-spraying effect is observed for this data. The controlled-spraying factor varies from 0.64 to 0.83, with an average value of 0.77.

Engineering Environmental Consulting Services
10
Styrene Styrene SuppressantAirResinGelStyreneLaminate
EmissionsEmissionsContentFlowFlowTime ContentThicknessDataRun (% monomer)(% resin wt)(%)(fpm)(lb/min)(min.)(%)(in.)IDNo.
18.8%6.6%100430350.040111595B133.1%13.9%50215420.080111695A231.0%13.0%50215420.040111695B3A33.9%14.2%50215420.040113095A3B19.0%6.7%100430350.080112895A4A19.6%6.9%100430350.080112995B4B35.8%15.0%100230420.040112895B518.2%6.4%50415350.080112995A623.3%8.2%50415350.040120495A738.0%16.0%100230420.080120595B822.9%8.0%100215350.040120695A922.4%9.4%50430420.080120695B1028.7%12.1%50430420.040120795A11A30.4%12.8%50430420.040121195B11B18.1%6.3%100215350.080120895A12A16.1%5.6%100215350.080121295A12B18.6%6.5%50230350.080120895B1324.8%10.4%100415420.040121495B1420.6%7.2%50230350.040121295B1525.4%10.7%100415420.080121495A16
Phase I runs - emissions as % resin:Regression Output:
-0.1941Constant0.0143Std Err of Y Est0.8698R Squared
20No. of Observations14Degrees of Freedom
Air FlowResin FlowGel Time % StyreneThickness
0.00003-0.008540.000380.00827-0.19881X Coefficient(s)0.000130.003270.000440.000950.16587Std Err of Coef.
Table 2.5 - Five-Variable Linear Regression for Mechanical Application
Engineering Environmental Consulting Services
11
Styrene Styrene AirResinGelStyreneLaminateEmissionsEmissionsFlowFlowTime ContentThicknessDataRun (% monomer)(% resin wt)(fpm)(lb/min)(min.)(%)(in.)IDNo.
18.8%6.6%100430350.040111595B133.1%13.9%50215420.080111695A231.0%13.0%50215420.040111695B3A33.9%14.2%50215420.040113095A3B19.0%6.7%100430350.080112895A4A19.6%6.9%100430350.080112995B4B35.8%15.0%100230420.040112895B518.2%6.4%50415350.080112995A623.3%8.2%50415350.040120495A738.0%16.0%100230420.080120595B822.9%8.0%100215350.040120695A922.4%9.4%50430420.080120695B1028.7%12.1%50430420.040120795A11A30.4%12.8%50430420.040121195B11B18.1%6.3%100215350.080120895A12A16.1%5.6%100215350.080121295A12B18.6%6.5%50230350.080120895B1324.8%10.4%100415420.040121495B1420.6%7.2%50230350.040121295B1525.4%10.7%100415420.080121495A1621.7%9.1%100430420.080022296A1 (& 10)27.3%12.1%44.4092596Blg female30.2%13.4%44.4101796Blg male23.9%10.6%44.40.187061296Bthick lam28.2%12.5%44.4092696Alg female36.0%16.0%44.40.080120595A
Regression Output:-0.18023Constant0.01818Std Err of Y Est0.71447R Squared
26No. of Observations24Degrees of Freedom
0.00714X Coefficient(s)0.00092Std Err of Coef.
Table 2.6 - One-Variable (Styrene) Linear Regression for Mechanical Application

Engineering Environmental Consulting Services
12
suppressantresinstyrenestyrene emissionslevelflowcontentrun
(% styrene)(% resin)(% resin)(% resin)24.6%8.3%0233.8080896A
24.2%25.0%8.4%0433.8080896B23.3%7.9%0433.8081296B29.5%13.1%0244.4080696A22.3%9.9%0444.4061396A31.8%15.5%0248.8081596A25.7%12.6%0448.8081696A18.6%6.3%1.5233.8081396B12.4%4.2%1.5433.8081396A22.9%10.1%1.5244.4080796A13.2%5.8%1.5444.4061396B18.9%9.2%1.5248.8082796A12.4%6.0%1.5448.8081696B
controlcontrolfactorfactorflow% styrene0.6400.759233.8
0.515433.80.6910.771244.4
0.586444.40.5410.594248.8
0.476448.80.617average
styrene emissionsFlowFlowTime ContentThicknessData
(% styrene)(% resin)(fpm)(lb/min)(min.)(%)(in.)ID22.4%9.4%50430420.080120695B21.7%9.1%100430420.080022296A17.4%7.3%Controlled100430420.080022196A17.6%7.4%Controlled100430420.080022196B
0.78917.1%7.2%Controlled100430420.080022196C23.9%10.6%44.40.187061296B17.0%7.5%Controlled44.40.187061296A
0.64213.8%6.1%Controlled44.40.187080196B27.3%12.1%44.4092596B
0.82622.5%10.0%Controlled44.4092596A30.2%13.4%44.4101796B
0.81324.6%10.9%Controlled44.4101796A
0.768average
Table 2.7 - Suppressant Control Factor for Spray Lay-up Emissions
Table 2.8 - Control Factor for Controlled Spraying of Spray Lay-up Emissions

Engineering Environmental Consulting Services
13
ResinStyrenestyrene emissionsFlowContentData
(% styrene)(% resin)(lb/min)(%)ID
29.5%13.1%0% suppressant244.4080696A22.3%9.9%0% suppressant444.4061396A17.9%7.9%44.4022697B11.4%5.0%flow coater44.4022797A11.6%5.1%flow coater44.4022797B12.9%5.7%pressure-fed roller44.4022797C
0.511average
Non-Atomized Application Factor
The calculation of the non-atomized application reduction factor, which is the emissionfactor with non-atomized application equipment divided by the emissions factor with typical sprayapplication equipment, is shown in Table 2.9 below. Six data sets are compared to investigatethe effect of non-atomized application equipment on emissions at one monomer content (44.4%styrene). The average control factor for non-atomized application equipment is 0.51.
Table 2.9 - Non-Spray Equipment Control Factor for Mechanical Application
2.5.3 - Gelcoat Spraying
Emission Factor
The linear regression fit for all five of the Phase I experimental variables (as a function ofconsumed resin) is shown in Table 2.10 below. The corresponding equation for estimatingstyrene emissions is:
emissions (% resin) = - 5.34119 x thickness + 0.00897 x % styrene + 0.00083 x gel time - 0.00018 x resin flow + 0.00004 x air flow - 0.0476 [eq 6]
The overall fit is relatively good (r2 = 0.8999) and the standard error of the equation is only 0.012. However, the coefficients for gel time, resin flow, and air flow have relatively large standard errorvalues, and the coefficients for the gelcoat resin flow and air flow are nearly zero. This suggeststhat these variables are not good descriptors for the styrene emissions from gelcoat spraying. Furthermore, the gelcoat thickness, gel time, resin flow and air flow variables would be practicallyimpossible to effectively regulate as part of any plant permit.
The linear regression fit for just the styrene content factor is shown in Table 2.11 below. The corresponding equation for estimating styrene emissions is:
emissions (as % resin) = 0.01036 x % styrene - 0.1950 [eq 7]

Engineering Environmental Consulting Services
14
(% resin wt)(fpm)(lb/min)(min.)(%)(in.)IDRun #
18.8%100420350.018101195A118.3%50210400.024101195B221.3%50210400.018101295A3A23.2%50210400.018101695B3B15.9%100420350.024101295B4A14.6%100420350.024101695A4B19.6%100220400.024101395A515.2%50410350.024101395B617.7%50410350.018101695C724.3%100220400.018101795A820.3%100210350.018101795B921.0%50420400.024101895A1024.7%50420400.018101895B11A24.8%50420400.018102395A11B15.9%100210350.024101995A12A15.7%100210350.024102395B12B15.9%50220350.024101995B1322.4%100410400.018101995C1417.5%50220350.018102495A1520.5%100410400.024102495B1621.1%100410400.018030596A1 (& 14)
Phase I runs - emissions as % resin:Regression Output:
-0.0476Constant0.0120Std Err of Y Est0.8999R Squared
21No. of Observations15Degrees of Freedom
(fpm)(lb/min)(min.)(%)(in.)
4.3E-050.000180.000830.00897-5.34119X Coefficient(s)0.000110.002650.000530.001090.90498Std Err of Coef.
Phase I runs - emissions as % resin weight:Regression Output:
-0.1950Constant0.0198Std Err of Y Est0.6539R Squared
21No. of Observations19Degrees of Freedom
0.01036X Coefficient(s)0.00173Std Err of Coef.
Table 2.10 - Five-Variable Linear Regression for Gelcoat Emissions
Table 2.11 - One-Variable (Styrene) Linear Regression for Gelcoat Emissions
Engineering Environmental Consulting Services
15
AirResinGelStyreneLaminatestyrene emissionsFlowFlowTime ContentThicknessData
(% styrene)(% resin)(fpm)(lb/min)(min.)(%)(in.)ID
56.0%22.4%100410400.018101995C1452.7%21.1%100410400.018030596A131.9%12.7%Controlled100410400.018030796A231.7%12.7%Controlled100410400.018030796B4A
0.58131.3%12.5%Controlled100410400.018030796D4B37.4%13.0%35091796Alg female
0.83131.0%10.8%Controlled35091896Alg female52.8%18.5%35101596Alg male
0.77341.6%14.3%Controlled35101696Alg male0.728average
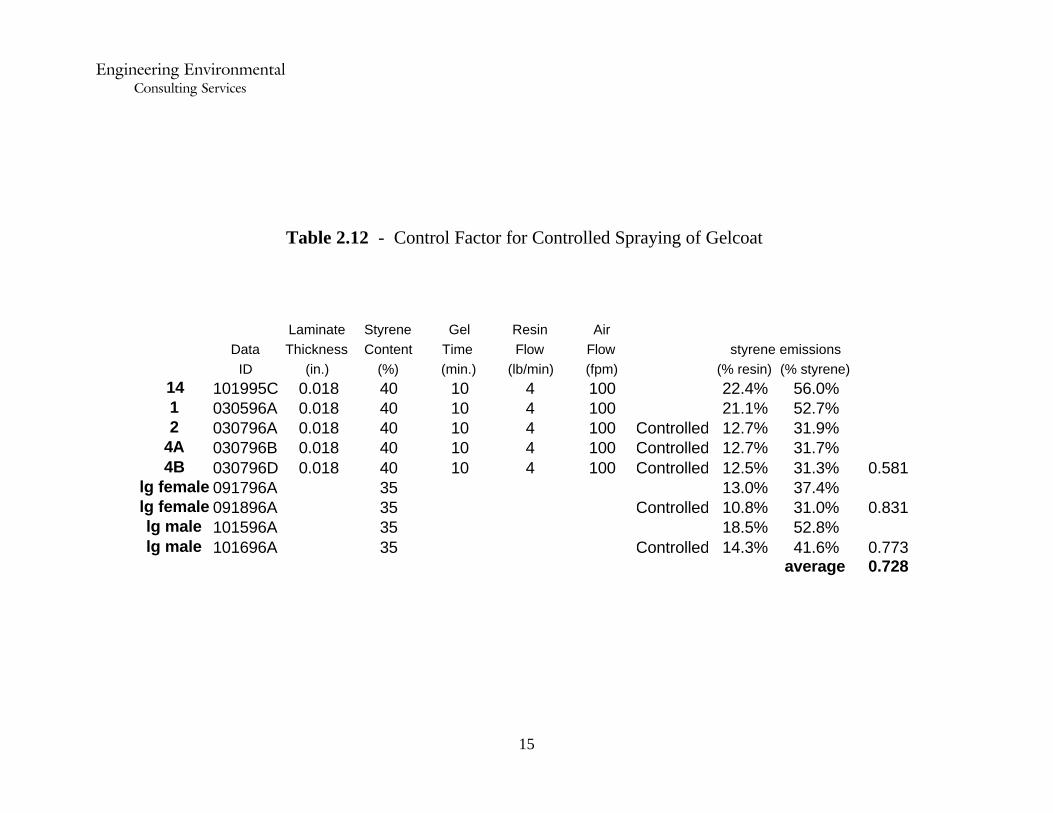
Table 2.12 - Control Factor for Controlled Spraying of Gelcoat
Engineering Environmental Consulting Services
16
The data for both Phase I and Phase II (21 data sets) is used. The overall fit is not as good as forall five factors using just the Phase I data set (r2 = 0.6539), but the standard error of the equationis still only 0.0198, which is acceptable.
Controlled-Spraying Factor
The calculation of the controlled-spraying reduction factor for gelcoat spraying, which isthe emissions factor for controlled-spraying divided by the emissions factor for conventionalspraying, is shown in Table 2.12 below. Nine data sets are compared to investigate the effect ofcontrolled-spraying on gelcoat emissions at two different monomer content levels. A possiblerelationship between styrene monomer content and controlled-spraying effect is observed for thisdata - the factor is less at the higher styrene content level. The controlled-spraying factor forgelcoat spraying varies from 0.58 to 0.83, with an average value of 0.73.
2.5.4 - Filament Winding
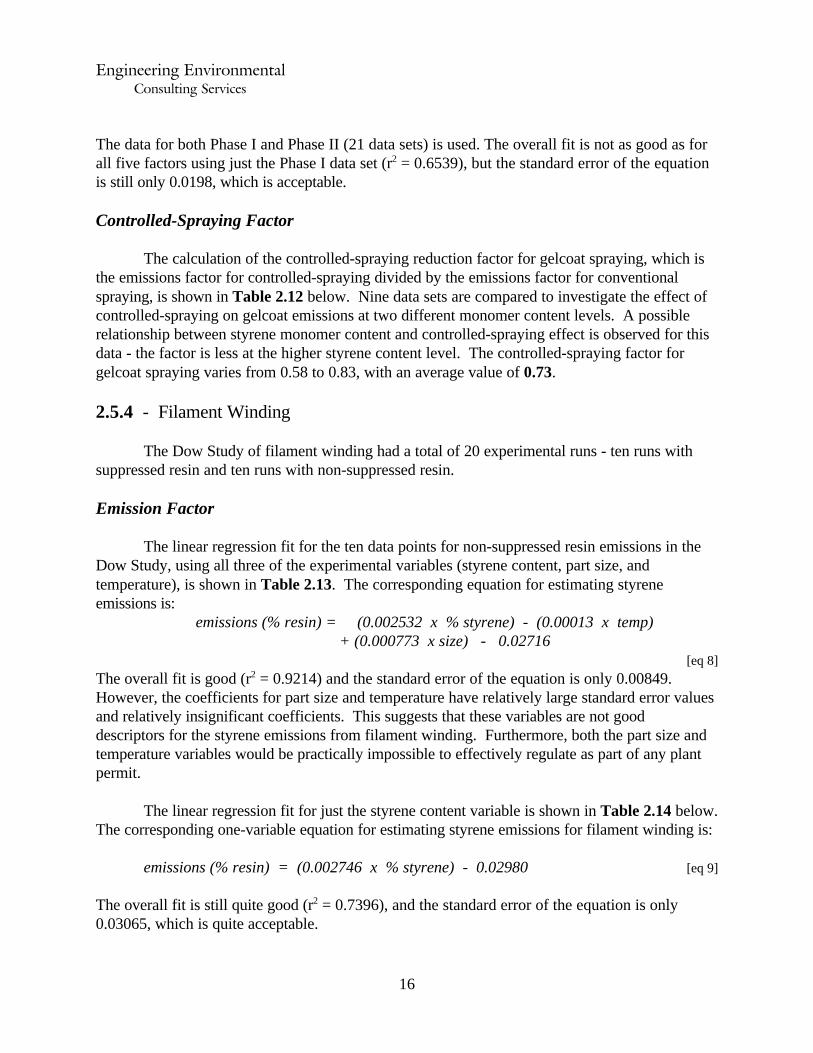
The Dow Study of filament winding had a total of 20 experimental runs - ten runs withsuppressed resin and ten runs with non-suppressed resin. Emission Factor
The linear regression fit for the ten data points for non-suppressed resin emissions in theDow Study, using all three of the experimental variables (styrene content, part size, andtemperature), is shown in Table 2.13. The corresponding equation for estimating styreneemissions is:
emissions (% resin) = (0.002532 x % styrene) - (0.00013 x temp) + (0.000773 x size) - 0.02716
[eq 8]
The overall fit is good (r2 = 0.9214) and the standard error of the equation is only 0.00849. However, the coefficients for part size and temperature have relatively large standard error valuesand relatively insignificant coefficients. This suggests that these variables are not gooddescriptors for the styrene emissions from filament winding. Furthermore, both the part size andtemperature variables would be practically impossible to effectively regulate as part of any plantpermit.
The linear regression fit for just the styrene content variable is shown in Table 2.14 below. The corresponding one-variable equation for estimating styrene emissions for filament winding is:
emissions (% resin) = (0.002746 x % styrene) - 0.02980 [eq 9]
The overall fit is still quite good (r2 = 0.7396), and the standard error of the equation is only0.03065, which is quite acceptable.

Engineering Environmental Consulting Services
17
EmissionsEmissionsEmissionsFilament Winding testsBased onBased onBased on
% Resin wt% Styrene% ResinSizeTempSupp%StyRun5.9%17.9%5.96850339
11.8%24.5%11.8337304876.3%19.1%6.33385033168.3%17.4%8.3673048137.2%21.8%7.2337303314
10.3%21.4%10.33385048610.3%21.4%10.33385048198.6%17.9%8.66850482
12.0%24.9%12.03385048184.9%14.9%4.967303315.0%10.3%5.033851.548153.7%11.2%3.76731.533173.7%11.2%3.76731.533205.4%16.5%5.46851.53354.8%14.4%4.833731.53344.0%8.4%4.033851.54834.9%10.3%4.96731.54884.6%9.6%4.633731.548126.6%13.8%6.66851.548113.9%11.8%3.96731.53310
Regression Output:-0.02716Constant0.008491Std Err of Y Est0.921438R Squared
10No. of Observations6Degrees of Freedom
SizeTemp%Sty0.000773-0.000130.002532X Coefficient(s)0.0002080.0004680.000374Std Err of Coef.
Table 2.13 - Four-Variable Linear Regression for Filament Winding

Engineering Environmental Consulting Services
18
EmissionsEmissionsEmissionsFilament Winding TestsBased onBased onBased onNon-Suppressed Only% Resin% Styrene% ResinSizeTempSupp%StyRun7.2%21.8%7.213373033144.9%14.9%4.9367303316.3%19.1%6.293385033165.9%17.9%5.968503398.6%17.9%8.586850482
12.0%24.9%11.9633850481810.3%21.4%10.283385048198.3%17.4%8.3467304813
11.8%24.5%11.773373048710.3%21.4%10.2833850486
% ResinRegression Output:-0.02980Constant0.01339Std Err of Y Est0.73963R Squared
10No. of Observations8Degrees of Freedom
%Sty0.002746X Coefficient(s)0.000576Std Err of Coef.
0.001443 x %StyNon-Suppressed versus Suppressed Resin Factor% Resin wt% Styrene% ResinSizeTempSupp%StyRun
Small Part4.9%14.9%4.9367303315.9%17.9%5.968503398.3%17.4%8.34673048138.6%17.9%8.5868504823.7%11.2%3.686731.53317
0.763.7%3.7%11.2%3.686731.533203.9%11.8%3.886731.53310
0.925.4%16.5%5.446851.53350.594.9%10.3%4.926731.54880.776.6%13.8%6.66851.548110.76Small Part AVG:Large Part
6.8%7.2%21.8%7.213373033146.3%19.1%6.29338503316
11.8%24.5%11.773373048710.3%21.4%10.2833850486
10.8%12.0%24.9%11.9633850481810.3%21.4%10.28338504819
0.704.8%14.4%4.753373/851.53340.394.6%9.6%4.6233731.548120.414.5%5.0%10.3%4.9533851.54815
4.0%8.4%4.0333851.54830.50Large Part AVG:
0.65Overall AVG:0.62CFA Predicted:
Table 2.14 - One-Variable (Styrene) Linear Regression for Filament Winding
Table 2.15 - Control Factor for Filament Winding with Suppressed Resin

Engineering Environmental Consulting Services
19
Suppressant Control Factor
The calculation of the suppressant control factor for filament winding, which is theemission factor for resin with suppressant divided by the emission factor for resin withoutsuppressant, is shown in Table 2.15 on the previous page. Ten data sets (suppressed and non-suppressed) are compared to investigate the effect of suppressant on emissions at two differentstyrene monomer content. No obvious relationship is observed between the styrene monomercontent and suppressant effect for this data. The suppressant factor varies widely from 0.39 to0.92, with an average value of 0.65.
2.6 - CFA Emission Models
The results of the CFA emission testing discussed in the previous sections are nowconverted into algebraic expressions, henceforth referred to as “Emission Models.” A separateCFA Emission Model is developed for manual resin application (hand lay-up), mechanical resinapplication (spray lay-up), and gelcoat spraying. Each Emission Model estimates the styreneemission rate for the corresponding process. The manual resin application (hand lay-up),mechanical resin application (spray lay-up) and gelcoat spraying models are based upon theresponses to the chief process variables measured in the Phase I CFA testing and the effects of theemission reduction techniques measured in the Phase II CFA testing. No distinction between theemission rates from filled and unfilled resin systems was observed during the CFA testing, so theeffect of filler was not incorporated into any model. Resin fillers appear to merely extend theamount of resin used to manufacture a part, and do not significantly affect an emission rate basedupon the consumption of neat (unfilled) resin or available styrene monomer.
The results of the Dow study of filament winding emissions also discussed in the previoussection are converted into an algebraic expression, henceforth referred to as the “FilamentWinding Model.” This model is based upon the experimental responses to the chief processvariables and the effects of resin suppressant measured in the Dow testing.
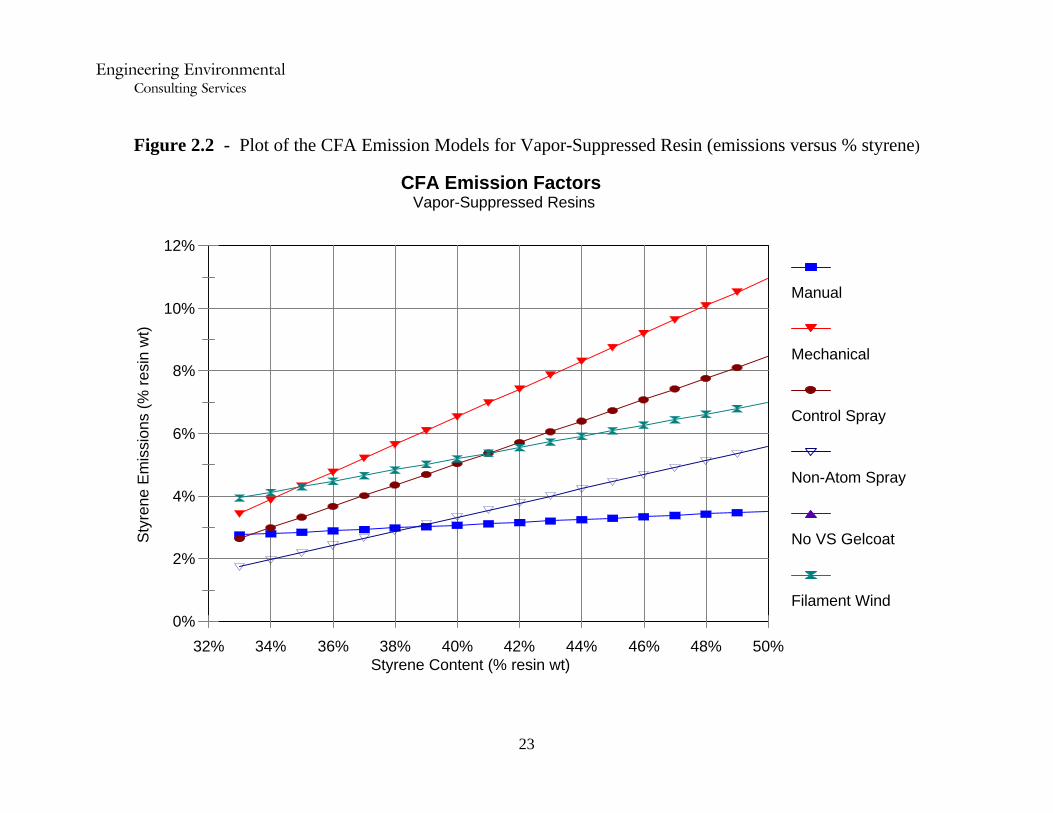
Both the multi-variable and the single variable models are presented below forcompleteness. As discussed earlier, the multi-variable models are not suitable for regulatorypurposes. However, the one-variable (styrene content) models are suitable and have acceptablescatter for the purpose of characterizing styrene emissions across an entire industry such asreinforced plastics. The CFA Emission Models for non-suppressed resins and gel coat areplotted in Figure 2.1 at the end of this section. The CFA Emission Models for vapor-suppressedresins are shown in Figure 2.2. The emission factors are also listed in a handy tabular format inTable 2.16.

Engineering Environmental Consulting Services
20
2.6.1 - Manual Resin Application (Hand Lay-up) Model
The general emission model for manual resin application (hand lay-up) is:
Emission Rate = Resin Usage x Emission Factor x Suppressant Factor [eq 10]
The four-variable emission model is:
Emission Rate = Resin Usage x (-0.46365 x thickness + 0.00265 x %styrene + 0.00068 x gel time + 0.00003 x air flow - 0.0320) [eq 11]
And the one-variable emission model, which is also one of the CFA matrix elements, is:
Emission Rate = Resin Usage x (0.00286 x % styrene - 0.0529)
x [1.00 <or> 0.0004476 x % styrene + 0.01289 ] 0.00286 x % styrene - 0.0529 [eq 12]
2.6.2 - Mechanical Resin Application (Spray Lay-up) Model
The general emission model for mechanical resin application (spray lay-up) for both filled andunfilled resins is:
Emission Rate = Resin Usage x Emission Factor x Suppressant Factor x [Controlled Spray Factor <or> Non-Spray Factor] [eq 13]
The five-variable emission model is:
Emission Rate = Resin Usage x (-0.19881 x thickness + 0.00827 x % styrene + 0.00038 x gel time - 0.00854 x resin flow + 0.00003 x air flow - 0.1941) x [1.00 <or> 0.62]
x [1.00 <or> 0.77] <or> [1.00 <or> 0.51] [eq 14]
And the one-variable emission model, which is also one of the CFA matrix elements, is:
Emission Rate = Resin Usage x (0.00714 x % styrene - 0.180) x [1.00 <or> 0.62] x [1.00 <or> 0.77] <or> [1.00 <or> 0.51] [eq 15]

Engineering Environmental Consulting Services
21
2.6.3 - Gelcoat Spraying Model
The general emission model for gelcoat spraying is:
Emission Rate = Resin Usage x Emission Factor x Controlled Spray Factor [eq 16]
The five-variable emission model is:
Emission Rate = Resin Usage x (-5.34119 x thickness + 0.00897 x % styrene + 0.00083 x gel time - 0.00018 x resin flow + 0.00004 x air flow - 0.0476) x [1.00 <or> 0.73] [eq 17]
And the one-variable emission model, which is also one of the CFA matrix elements, is:
Emission Rate = Resin Usage x (0.01036 x % styrene - 0.1950) x [1.00 <or> 0.73] [eq 18]
2.6.4 - Filament Winding Model
The general emission model for filament winding is:
Emission Rate = Resin Usage x Emission Factor x Suppressant Factor [eq 19]
The four-variable emission model (including suppressant as a variable) is:
Emission Rate = Resin Usage x ((0.002532 x % styrene) - (0.00013 x temp) + (0.000773 x size) - 0.02716 )) x [1.00 <or> 0.65] [eq 20]
And the one-variable emission model, which is also one of the CFA matrix elements, is:
Emission Rate = Resin Usage x ((0.002746 x % styrene) - 0.02980 ) x [1.00 <or> 0.65] [eq 21]

Engineering Environmental Consulting Services
22
0%
5%
10%
15%
20%
25%
30%
35%
Sty
rene
Em
issi
ons
(% r
esin
wt)
32% 34% 36% 38% 40% 42% 44% 46% 48% 50%Styrene Content (% resin wt)
Manual
Mechanical
Control Spray
Non-Atom Spray
Gelcoat
Filament Wind
CFA Emission FactorsNon-Vapor-Suppressed Resins
Figure 2.1 - Plot of the CFA Emission Models for Non-Suppressed Resin (emissions versus % styrene)
Engineering Environmental Consulting Services
23
0%
2%
4%
6%
8%
10%
12%
Sty
rene
Em
issi
ons
(% r
esin
wt)
32% 34% 36% 38% 40% 42% 44% 46% 48% 50%Styrene Content (% resin wt)
Manual
Mechanical
Control Spray
Non-Atom Spray
No VS Gelcoat
Filament Wind
CFA Emission FactorsVapor-Suppressed Resins
Figure 2.2 - Plot of the CFA Emission Models for Vapor-Suppressed Resin (emissions versus % styrene)

Engineering Environmental Consulting Services
24
CFA EMISSION FACTORS(Styrene Emission Rates listed as % of Neat Resin Weight as applied)
FilamentGelcoatMechanicalManualWindingApplicationResin ApplicationResin Application
ControlledUncontrolledNon-AtomizedControlledUncontrolledBucket & ToolSpraySprayApplicationSpraySprayStyrene
Vapor-Non-VaporVapor-Non-VaporVapor-Non-VaporVapor-Non-VaporVapor-Non-VaporContent
SuppressedSuppressedSuppressedSuppressedSuppressedSuppressedSuppressedSuppressedSuppressedSuppressed% wt
4.0%6.1%10.7%14.7%****4.3%3.4%5.6%2.8%4.1%33%
4.1%6.4%11.5%15.7%****4.8%3.9%6.3%2.8%4.4%34%
4.3%6.6%12.2%16.8%****5.4%4.3%7.0%2.9%4.7%35%
4.5%6.9%13.0%17.8%****5.9%4.8%7.7%2.9%5.0%36%
4.7%7.2%13.7%18.8%****6.5%5.2%8.4%2.9%5.3%37%
4.8%7.5%14.5%19.9%to**to7.0%5.7%9.1%3.0%5.6%38%
5.0%7.7%15.3%20.9%be**be7.6%6.1%9.8%3.0%5.9%39%
5.2%8.0%16.0%21.9%determined**determined8.1%6.5%10.6%3.1%6.2%40%
5.4%8.3%16.8%23.0%by**by8.7%7.0%11.3%3.1%6.4%41%
5.6%8.6%17.5%24.0%05/15/986.1%05/15/989.2%7.4%12.0%3.2%6.7%42%
5.7%8.8%18.3%25.0%*6.5%*9.8%7.9%12.7%3.2%7.0%43%
5.9%9.1%19.0%26.1%*6.8%*10.3%8.3%13.4%3.3%7.3%44%
6.1%9.4%19.8%27.1%*7.2%*10.9%8.8%14.1%3.3%7.6%45%
6.3%9.7%20.6%28.2%*7.6%*11.4%9.2%14.8%3.3%7.9%46%
6.5%9.9%21.3%29.2%****12.0%9.6%15.6%3.4%8.2%47%
6.6%10.2%22.1%30.2%****12.5%10.1%16.3%3.4%8.4%48%
6.8%10.5%22.8%31.3%****13.1%10.5%17.0%3.5%8.7%49%
7.0%10.8%23.6%32.3%****13.6%11.0%17.7%3.5%9.0%50%
prepared on 1/15/98 - emission rates based on revised 12/8/97 CFA Matrix Models** outside the tested range
Table 2.16 - Emission Factors for the CFA Emission Models
Engineering Environmental Consulting Services
25
Section 3 - Verification of CFA Emission Models
3.1 - Available Emissions Data
The following two sources of existing available data for estimating the styrene emissionsfrom the reinforced plastics industry have been provided by the EPA:
EPA April 1997 Open Molding Database styrene emission equationsRTI Emissions Study
Discussions of each source of data, and comparisons of the emission data to the RTI EmissionModels, are provided in the next two sections. The purpose of these comparisons is to gauge therelative agreement between the CFA Emission Models and the existing EPA emissions data.
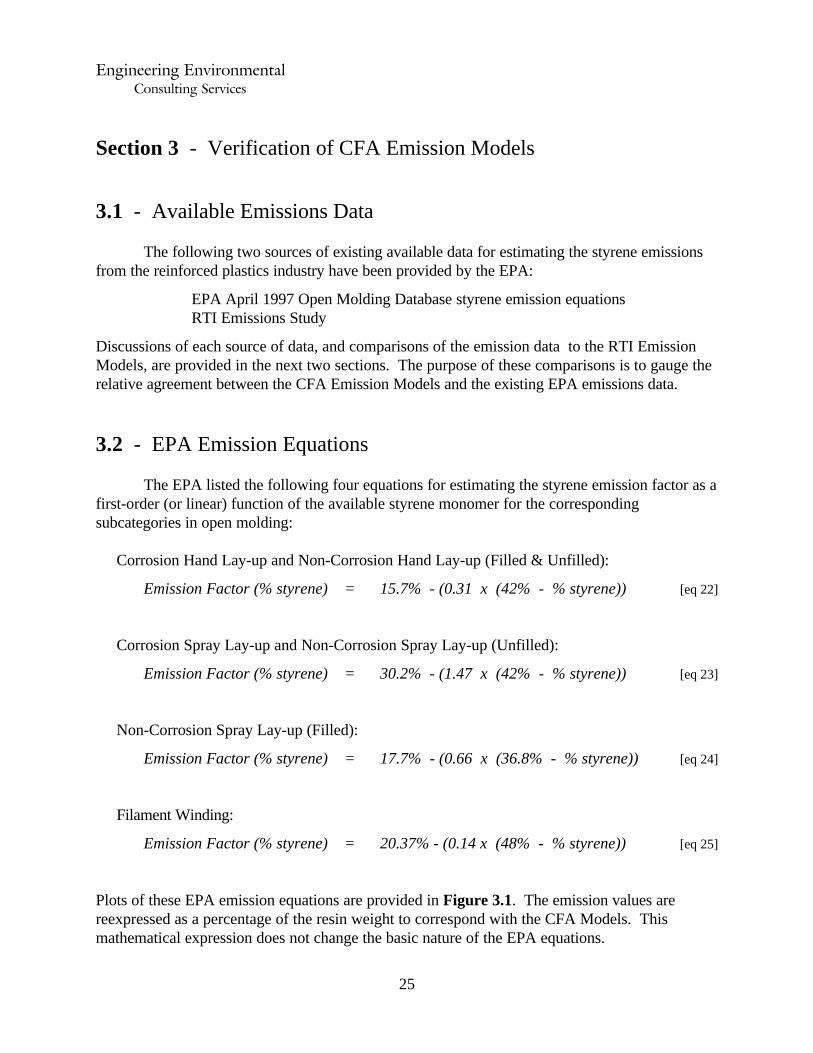
3.2 - EPA Emission Equations
The EPA listed the following four equations for estimating the styrene emission factor as afirst-order (or linear) function of the available styrene monomer for the correspondingsubcategories in open molding:
Corrosion Hand Lay-up and Non-Corrosion Hand Lay-up (Filled & Unfilled):
Emission Factor (% styrene) = 15.7% - (0.31 x (42% - % styrene)) [eq 22]
Corrosion Spray Lay-up and Non-Corrosion Spray Lay-up (Unfilled):
Emission Factor (% styrene) = 30.2% - (1.47 x (42% - % styrene)) [eq 23]
Non-Corrosion Spray Lay-up (Filled):
Emission Factor (% styrene) = 17.7% - (0.66 x (36.8% - % styrene)) [eq 24]
Filament Winding:
Emission Factor (% styrene) = 20.37% - (0.14 x (48% - % styrene)) [eq 25]
Plots of these EPA emission equations are provided in Figure 3.1. The emission values arereexpressed as a percentage of the resin weight to correspond with the CFA Models. Thismathematical expression does not change the basic nature of the EPA equations.

Engineering Environmental Consulting Services
26
The EPA emission equations are not actual data sets, because the data values used by theEPA to establish these relationships were not included with the Open Molding Database. Presumably, the EPA based these emission equations upon valid emission data, so the equationsare included as representative of an, as yet unrevealed, set of emission data.
An equation for gelcoat spraying was not provided by the EPA, so no comparison can bemade with the CFA Gelcoat Model. Moreover, the Open Molding database does not include anydata on gelcoat styrene monomer content for non-corrosion sources, and only limited data forsome corrosion sources. Therefore, any gelcoat equation considered by the EPA would not havethe necessary input data to be useful. This fundamental problem is discussed in detail in thecompanion report entitled the “Analysis of the Open Molding Database.”
The EPA also listed the following styrene emission control factors, which were used toadjust the styrene emissions for the different emission control techniques reported by thereinforced plastics sources in the Open Molding Database:
vapor suppressed resin, unfilled - 40% reduction 60% control factorvapor suppressed resin, filled - 13% reduction 87% control factorvacuum bagging - 45% reduction 55% control factorthermal oxidation - 95% reduction 5% control factor
Again, the EPA control factors are not reported with supporting data, but are merely listed in theOpen Molding database. As above, the EPA presumably based these styrene emission controlfactors upon valid emission test data, so the controls factors are included as representative of an,as yet unrevealed, set of emission data.
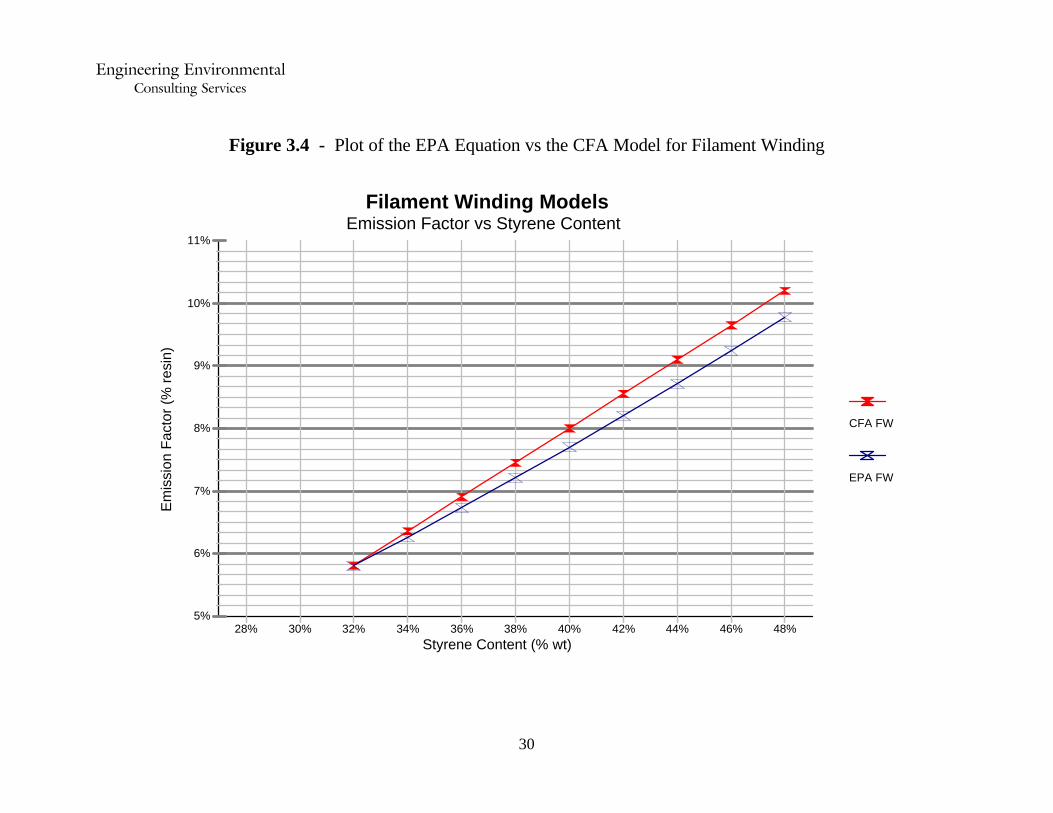
The EPA equations are compared with the CFA Emission Models across a full range ofstyrene monomer contents. As shown in Figure 3.2, the EPA hand lay-up equation closely agreeswith the CFA Manual Resin Application (Hand Lay-up) Model, although the equation slightlyover-estimates the effect of styrene emissions at higher styrene monomer contents. The curve forthe CFA Mechanical Resin Application (Spray Lay-up) Model lies between the EPA spray lay-upequations for unfilled and filled resins, as shown in Figure 3.3. However, the CFA MechanicalResin Application (Spray Lay-up) Model closely agrees with the merged, aggregate curve formedby merging the data points for the EPA equations for filled and unfilled resin with thecorresponding data points for the CFA Mechanical Resin Application (Spray Lay-up) Model. Theaggregate curve is developed by creating an equally-weighted, merged data set including the filledequation data points (weighted once), the unfilled equation data points (weighted once), and theCFA model data points (weighted twice to represent both filled and unfilled resins). A plot of theCFA Filament Winding Model is compared to the EPA equation in Figure 3.4.
A linear regression of the merged data point set, shown in Table 3.1, determines the slopeand intercept of the aggregate spray lay-up curve. A comparison of the EPA control factors andCFA Model control factors is also listed in Table 3.2.

Engineering Environmental Consulting Services
27
0%
5%
10%
15%
20%
25%
Em
issi
on F
acto
r (%
res
in)
28% 30% 32% 34% 36% 38% 40% 42% 44% 46% 48% 50%
Styrene Content (% wt)
Hand
Unfilled
Filled
FWind
EPA Emission EquationsEmission Factor vs Styrene Content
Figure 3.1 - Plots of the EPA’s Emission Equations (emissions vs % styrene)

Engineering Environmental Consulting Services
28
2%
3%
4%
5%
6%
7%
8%
9%
10%
Em
issi
on F
acto
r (%
res
in)
28% 30% 32% 34% 36% 38% 40% 42% 44% 46% 48% 50%
Styrene Content (% wt)
EPA hand
CFA hand
Manual (Hand Lay-up)Emission Factor versus Styrene Content
Figure 3.2 - Plot of the EPA Equation versus the CFA Model for Manual (Hand Lay-up)

Engineering Environmental Consulting Services
29
0%
5%
10%
15%
20%
25%
Em
issi
on F
acto
r (%
res
in)
28% 30% 32% 34% 36% 38% 40% 42% 44% 46% 48% 50%Monomer Content (% wt)
Composite
EPA unfilled
EPA filled
CFA (resin)
Spray Lay-upEmission Factor versus Monomer Content
Figure 3.3 - Plots of the EPA Equations vs the CFA Model for Spray Lay-up
Engineering Environmental Consulting Services
30
5%
6%
7%
8%
9%
10%
11%
Em
issi
on F
acto
r (%
res
in)
28% 30% 32% 34% 36% 38% 40% 42% 44% 46% 48%Styrene Content (% wt)
CFA FW
EPA FW
Filament Winding ModelsEmission Factor vs Styrene Content
Figure 3.4 - Plot of the EPA Equation vs the CFA Model for Filament Winding

Engineering Environmental Consulting Services
31
PercentageAbsoluteCFA RTIEPA DatabaseDifferenceDifferenceControlControlControlCFA vs RTICFA vs RTIFactorFactorFactor
0.0%0.000.620.620.60Vapor Suppressant
10.0%0.070.770.70not listedControlled Spraying
4.1%0.020.510.49not listedNon-Atomizing Applicationaverage(flow coater & pressure-fed roller)
(CFA x 2 + EPA filled x 1+ EPA unfilled x1)
EPA unfilledEPA filledCFA Resin (filled & unfilled)% resin% sty% resin% sty% resin% sty% resin% sty
3.3%28%2.7%28%2.0%28%2.0%28%4.0%30%3.8%30%3.4%30%3.4%30%4.7%32%5.0%32%4.8%32%4.8%32%5.4%34%6.3%34%6.3%34%6.3%34%6.2%36%7.7%36%7.7%36%7.7%36%7.0%38%9.2%38%9.1%38%9.1%38%7.9%40%10.9%40%10.6%40%10.6%40%8.9%42%12.7%42%12.0%42%12.0%42%9.9%44%14.6%44%13.4%44%13.4%44%
10.9%46%16.6%46%14.8%46%14.8%46%12.0%48%18.7%48%16.3%48%16.3%48%13.2%50%21.0%50%17.7%50%17.7%50%
Regression Output:-0.16846Constant0.015289Std Err of Y Est0.907003R Squared
48No. of Observations46Degrees of Freedom
0.67703X Coefficient(s)0.031964Std Err of Coef.
Table 3.1 - Linear Regression of the Composite Curve for Spray Lay-up
Table 3.2 - Comparisons of the EPA & CFA Control Factors

Engineering Environmental Consulting Services
32
3.3 - RTI Emissions Study
The summary of the test results for the RTI Emission Study are listed in Table 3.3. Based upon this summary, the RTI test results are compared to the CFA Emission Models formechanical resin application (spray lay-up) and gelcoat spraying, with the following observations:
Near-perfect agreement with the emission factor for spray application of gelcoat (21.7%versus CFA’s factor of 20.2% for 38.7% styrene content gelcoat).
Close agreement with the uncontrolled emission factor for spray lay-up application of resin(a more conservative 10.4% versus CFA’s factor of 9.35% for 38.3% monomer).
Near-perfect agreement (a more generous 48% versus CFA’s factor of 51%) with thereduced emission factor for non-atomizing application of resin (i.e., pressure-fed rollersand flow coating).
Perfect agreement (62.0% versus CFA’s factor of 62%) with the reduced emission factorfor spray application of vapor-suppressed resin.
Close agreement (a more generous 70% versus CFA’s factor of 77%) with the reducedemission factor for controlled spray application of resin.
The results of the RTI Emission Study strongly verify the accuracy of the CFA Emission Models. It is remarkable that two independent test programs, conducted by different personnel at differenttimes and places using different testing protocols would result in such near-perfect agreement.

Engineering Environmental Consulting Services
33
Emission Results, Sept 1995 draft - pages 36 & 4455 Test Runs
StyreneStyreneEmissionEmissionStyreneResinTest
FactorFactorContentFormulaRunsDescription% resin/gel% styrenelb/lb
GELCOAT
21.7%56.0%38.7%GF-19Regular13.8%54.2%25.4%GF-29Low-VOC
RESIN
10.4%27.1%38.3%RF-12Low-profile (normal spray)6.7%17.5%38.3%RF-15Low-profile (controlled spray)6.1%17.3%35.3%RF-23Low-styrene4.6%10.6%43.5%RF-3 sup3Styrene-suppressed4.6%10.6%43.3%RF-6 sup3Styrene-suppressed + wax
11.2%26.2%42.6%RF-4 BPO2Neat BPO9.1%21.3%42.6%RF-4 BPO2BPO + thickener
REDUCED EMISSION FACTORS
Sept 1995 draft - page 60Reduced emissions expressed in g/m2EmissionEmissionStyrene
FactorReductionContentDescription%%lb/lb
100.0%0.0%38.3%Baseline - Normal Spray70.1%29.9%Controlled Spray48.0%52.0%Flowcoater47.0%53.0%Pressure-fed Roller62.0%38.0%Suppressed Resin (w and w/o wax)89.0%11.0%35.3%Lower Monomer
Table 3.3 - Summary of RTI Test Results

Engineering Environmental Consulting Services
34
Hand Lay-up Test DataStyrene Styrene SupressantAirGelResinLaminate
EmissionsEmissionsContentFlowTime StyreneThicknessDataRun
(% monomer)(% resin wt)(% wt)(fpm)(min)(%)(in)IDNo.
17.7%6.2%010030350.041100295B111.7%4.9%05015420.088100295C216.7%7.2%05015420.041092095A3A17.7%7.6%05015420.041092695B3B11.7%4.2%010030350.088100395A4A13.1%4.6%010030350.088092695C4B19.2%8.1%05030420.041092595A510.1%3.6%010015350.088092695A614.7%5.3%010015350.041092795A713.5%5.7%05030420.088092795B814.0%5.0%05015350.041092795C914.3%6.0%010030420.088092895A1021.2%8.9%010030420.041092895B11A21.0%8.9%010030420.041092995C11B9.6%3.4%05015350.088092895C12A10.1%3.6%05015350.088100295A12B11.9%4.2%05030350.088092995A1317.1%7.1%010015420.041092995B1417.6%6.3%05030350.041091995A1511.5%4.9%010015420.088091995B1616.1%7.2%044.40.176052996Bthick lam11.0%4.9%044.40.120080196Athick lam13.8%4.6%033.20.088060596Asuppress19.0%9.3%048.80.088060396Bsuppress8.7%2.9%1.533.20.088060496Bsuppress7.4%3.6%1.548.80.088060496Asuppress8.1%2.7%1.533.20.088060596Bsuppress15.0%6.6%044.40.088052996Asuppress18.8%8.4%044.40.088053096Bsuppress7.0%3.1%1.544.40.088053096Asuppress
Section 4 - Appendices
Appendix A - CFA Test Data (Phase I and Phase II)

Engineering Environmental Consulting Services
35
Spray Lay-up Test DataStyrene Styrene AirResinGelStyreneLaminate
EmissionsEmissionsFlowFlowTime ContentThicknessDataRun
(% monomer)(% resin wt)(fpm)(lb/min)(min.)(%)(in.)IDNo.
18.8%6.6%100430350.040111595B133.1%13.9%50215420.080111695A231.0%13.0%50215420.040111695B3A33.9%14.2%50215420.040113095A3B19.0%6.7%100430350.080112895A4A19.6%6.9%100430350.080112995B4B35.8%15.0%100230420.040112895B518.2%6.4%50415350.080112995A623.3%8.2%50415350.040120495A738.0%16.0%100230420.080120595B822.9%8.0%100215350.040120695A922.4%9.4%50430420.080120695B1028.7%12.1%50430420.040120795A11A30.4%12.8%50430420.040121195B11B18.1%6.3%100215350.080120895A12A16.1%5.6%100215350.080121295A12B18.6%6.5%50230350.080120895B1324.8%10.4%100415420.040121495B1420.6%7.2%50230350.040121295B1525.4%10.7%100415420.080121495A1621.7%9.1%100430420.080022296A1 (& 10)17.4%7.3%Controlled100430420.080022196A220.0%8.4%Optimized100430420.080022296B317.6%7.4%C & O100430420.080022196B4A17.1%7.2%C & O100430420.080022196C4B20.1%9.2%unfilled45.7090596Afiller test23.9%10.6%44.40.187061296Bthick lam17.0%7.5%Controlled44.40.187061296Athick lam13.8%6.1%Controlled44.40.187080196Bthick lam13.3%5.4%Controlled40103096Abpo 2%14.3%5.8%Controlled40103096Bbpo 2%12.6%5.1%Controlled40110696Abpo 2.75%13.7%5.5%Controlled40103096Cmekp 2%13.7%5.5%Controlled40103196Amekp 2%14.3%5.7%Controlled40103196Bmekp 1.25%22.5%10.0%Controlled44.4092596Alg female27.3%12.1%44.4092596Blg female24.6%10.9%Controlled44.4101796Alg male30.2%13.4%44.4101796Blg male29.5%13.1%0244.4080696Asuppress22.9%10.1%1.5244.4080796Asuppress22.3%9.9%0444.4061396Asuppress13.2%5.8%1.5444.4061396Bsuppress24.6%8.3%0233.8080896Asuppress18.6%6.3%1.5233.8081396Bsuppress25.0%8.4%0433.8080896Bsuppress23.3%7.9%0433.8081296Bsuppress12.4%4.2%1.5433.8081396Asuppress31.8%15.5%0248.8081596Asuppress18.9%9.2%1.5248.8082796Asuppress25.7%12.6%0448.8081696Asuppress12.4%6.0%1.5448.8081696Bsuppress9.9%4.3%hand lay44.4022697Anon-spray
17.9%7.9%spray lay44.4022697Bnon-spray11.4%5.0%flow coat44.4022797Anon-spray11.6%5.1%flow coat44.4022797Bnon-spray12.9%5.7%pressroller44.4022797Cnon-spray

Engineering Environmental Consulting Services
36
Gelcoat Spraying Test DataStyrene Styrene AirGCGelGCGC Film
EmissionsEmissionsFlowFlowTime StyreneThicknessDataRun
(% monomer)(% resin wt)(fpm)(lb/min)(min.)%(in.)IDNo.
53.8%18.8%100420350.018101195A145.8%18.3%50210400.024101195B253.2%21.3%50210400.018101295A3A57.9%23.2%50210400.018101695B3B45.3%15.9%100420350.024101295B4A41.8%14.6%100420350.024101695A4B49.0%19.6%100220400.024101395A543.5%15.2%50410350.024101395B650.5%17.7%50410350.018101695C760.7%24.3%100220400.018101795A858.0%20.3%100210350.018101795B952.4%21.0%50420400.024101895A1061.8%24.7%50420400.018101895B11A62.0%24.8%50420400.018102395A11B45.4%15.9%100210350.024101995A12A44.8%15.7%100210350.024102395B12B45.4%15.9%50220350.024101995B1356.0%22.4%100410400.018101995C1449.9%17.5%50220350.018102495A1551.3%20.5%100410400.024102495B1652.7%21.1%100410400.018030596A1 (& 14)31.9%12.7%Controlled100410400.018030796A243.0%17.2%Optimized100410400.018030596B331.7%12.7%C & O100410400.018030796B4A31.3%12.5%C & O100410400.018030796D4B31.0%10.8%Controlled35091896Alg female37.4%13.0%35091796Alg female41.6%14.3%Controlled35101696Alg male52.8%18.5%35101596Alg male
Filled Resin Test DataStyrene Styrene StyreneStyrene
EmissionsEmissionsContentContentDataRun
(% monomer)(% resin wt)(%)(%)IDNo.
includ. fillerneat resininclud. filler
20.1%9.2%0.0%45.8%45.8%090596Anon filled18.9%6.2%13.0%45.8%32.8%090496Blow filled21.5%4.2%26.2%45.8%19.5%082996Ahigh filled17.4%3.4%26.2%45.8%19.5%090496Ahigh filled17.6%3.4%26.2%45.8%19.5%090596Bhigh filled

Engineering Environmental Consulting Services
37
EmissionsEmissionsEmissionsFilament Winding testsBased onBased onBased on
% Resin wt% Styrene% ResinSizeTempSupp%StyRun5.9%17.9%5.96850339
11.8%24.5%11.8337304876.3%19.1%6.33385033168.3%17.4%8.3673048137.2%21.8%7.2337303314
10.3%21.4%10.33385048610.3%21.4%10.33385048198.6%17.9%8.66850482
12.0%24.9%12.03385048184.9%14.9%4.967303315.0%10.3%5.033851.548153.7%11.2%3.76731.533173.7%11.2%3.76731.533205.4%16.5%5.46851.53354.8%14.4%4.833731.53344.0%8.4%4.033851.54834.9%10.3%4.96731.54884.6%9.6%4.633731.548126.6%13.8%6.66851.548113.9%11.8%3.96731.53310
Appendix B - Dow Filament Winding Test Data

CFA Emission Model for the Reinforced Plastics Industries - 1 Variable28-Feb-98
Current New Vapor Controlled Non-Atom Add-on % of Current New NewMonomer Monomer Monomer Suppressant Spraying Equipment Control Add-on Emission Emission EmissionContent Content Factor Factor Factor or Factor Factor Control Factor Factor Factor
(%) (%) (%) (%) (%) (%) (%) (%) (lb/ton) (lb/ton) (% resin)APPLICATIONMETHOD
Manual Resin 44.0% 44.0% 100.0% n 100% n/a n/a 95% 0% 146 146 7.3%
Mechanical Resin 44.0% 44.0% 100.0% n 100% n 100% n 100% 95% 0% 268 268 13.4%
Gelcoat Spray 44.0% 44.0% 100.0% n/a n 100% n/a 95% 0% 522 522 26.1%
Filament Resin 44.0% 44.0% 100.0% n 100% n/a n/a 95% 0% 182 182 9.1%