adhesion and toughness in carbon-fibre reinforced plastics · adhesion and toughness in...
TRANSCRIPT

Loughborough UniversityInstitutional Repository
Adhesion and toughness incarbon-fibre reinforced
plastics
This item was submitted to Loughborough University's Institutional Repositoryby the/an author.
Additional Information:
• A Doctoral Thesis. Submitted in partial fulfilment of the requirementsfor the award of Doctor of Philosophy of Loughborough University.
Metadata Record: https://dspace.lboro.ac.uk/2134/13537
Publisher: c© J.A. Enever
Please cite the published version.

This item was submitted to Loughborough University as a PhD thesis by the author and is made available in the Institutional Repository
(https://dspace.lboro.ac.uk/) under the following Creative Commons Licence conditions.
For the full text of this licence, please go to: http://creativecommons.org/licenses/by-nc-nd/2.5/

LOUGHBOROUGH
UNIVERSITY OF TECHNOLOGY
LIBRARY
AUTHOR I
""""""""""""""",£HE;V~"""""",::;r.:""H"",,,,,,,,,,,,,,,,,,,,,,,,,,,,,,,,,,,,,"""''''''''! i
, COpy NO. 02..'1 :;62 I Q t i ,"""'"''''''''''''''''''''''''''''''''''''''''''''''''''''''''''''''''''''''''''''''''"""""""""""""''''''''''''''''''''1
I • VOL NO. CLASS MARK I
ONLY
I
I I I I
i I , ! I
, , ,

•
I
ADHESION AND TOUGHNESS
CARBON-FIBRE REINFORCED PLASTICS
•
by
.'. J. A. ENEVER, B.Sc. M.Sc.,
A Doctoral Thesis submitted in partial fulfilment
of the requirements for the award of Ph.D. of the Loughborough
University of Tec!1.nology - September 1973
Supervisors: Dr. R. R. Smith B. J. Hawthorne, Esq.,
C by J. A. Enever, 1973

LoughbcrO~9:' Un.iVN5itY! of T cchno'c"'Y ) ".' "-'!.;
c". 2 0 DEC 1973
ACKNOWLEDGEMENTS
The author-would like to acknowledge the help and guidance
df Dr. R. R. Smith and Mr. B. J. Hawthorne ; the Science
Research Council and British Railways Board for supporting
the project; the assistance of the staff of the Institute of
Polymer Technology, and the companies which supplied
materials and information.
· .
SUMMARY
A literature survey of adhesion was undertaken with special emphasis
on plastics, glass fibres and existing methods of measuring adhesion
and comparing phys~cal properties. the effectiveness of adhesion in
carbon-fibre reinforced plastics has hitherto been determined by
inter-Iaminar shear strength testing, although the true meaning of this
test may still be obscure. The present work set out to measure
adhesion between single carbon fibres and polymers, (a) by pulling
single carbon fibres from solidified drops of plastic (a technique not
previously reported in the literature) and (b) by stressing clear
thermoset resins in which single fibres were embedded. By these means
the constituent aspects of adhesion between plastics and carbon fibres
were identified and evaluated, and their relative importance determined.
Relevant features were the surface nature and area of the carbon fibres,
contact angles between liquid polymer systems and carbon fibres, and
surface .tension and viscosity of the liquid polymers. The surface
area was measured by using a modification of the iodine adsorption test
not previously found successful with carbon fibres. The contact angles
were measured with an apparatus by which liquid drops could be placed
on carbon fibres, held at temperatures up to 3000C in an inert
atmosphere and then photomicrographed to give the contact angles.
While much of the reported work with carbon fibres has dealt \vith surface
treatments and measurement of inter-Iaminar shear strengths based on glass
fibre technology there have been moves to measure adhesion more accurately
between single fibres and resin, and to assess surface treatments
introduced to improve adhesion and toughness of the composites. However,
work with carbon fibres has largely ignored toughness measurement, even
though this is one of the major problems with the derived composites. The
literature indicated possibilities of improving the toughness of carbon
fibre composites as well as adhesion, and some of the treatments arising
from this literature study were investigated)introducing modifications

where necessary.
Diethylene Triamine (DETA) which can be used to cure'epoxies and
polyurethanes adheres well to carbon fibres. Polyurethane prepolymers
sized onto carbon fibres and cured with DETA can provide a flexible
interfac,e to blunt cracks and improve toughness. Epoxy resin composites ,
have been prepared with these sized fibres. Compared with previous
systems there was a change in the flexural behaviour, the composite
failing in a more ductile manner; and more energy was absorbed in breaking.
However high speedilCharpy type,l impact showed few differences.
Measurements made on composites indicated that toughening was likely to
result if a softer matrix was used, this allowing the fibres to pull out,
not by debonding, but by plastic deformation of the matrix. Blends of
polyurethane prepolymer and epoxy resin were therefore investigated to
extend the information. These composites gave up to a 300% improvement
in 'ICharpy type i impact and up to 600% improvement in energy to break.
However besides significant decreases of 20% in flexural modulus and 40% ,
in shear' strength the composite was particularly difficult to mould and
had a very short 'Ipot-life l • Other possible methods of improving
toughness were also considered: model systems, different matrices
including elastomers and epoxy curing agents.
Existing methods of measuring toughness are not completely reliable and
may be confusing when considering whether a material is ductile or brittle.
Recent fracture-toughness studies on metals have given valuable information
on the brittle nature of these materials and work was undertaken to obtain
a more accurate picture of toughness in the carbon fibre composites
produced.
4
CONTENTS
SYMBOlS USED
EQUATIONS USED
1.
2.
3.
4.
5.
6.
7.
INTRODUCTION
CARBON FIBRES
COMPOSITES
ADHESION
PART I
PART II
4.1 The Role of Adhesion in Composites
4.2 Short-Fibre Composites
4.3 Long-Fibre Reinforced Composites
THEORY OF ADHESION
DISCUSSION FOR EXPERIMENTAL PROCEDURE
EXPERIMENTAL PROCEDURE AND RESULTS
7.1 Contact Angle Measurements
Page No.
1
3
7
11
11
14
14
19
24
25
25
7.1.1 Apparatus 25
7.1.2 Results of Contact Angle given as tOs'& 28
7.2 Surface Roughness
7.3 Kinetics of Wetting
7.3.1 Viscosity
7.3.2 Surface Tension
7.3.3 Wetting Rate
30
34
34
38
39
7 • EXPEll]}IENT AL PllOCEDUllE AND llESULTS (cont)
7.4 Adhesion Heasurements
7.4.1 Shaped Cast llesin Samples
7.4.2 Fibre Pull-Out Specimens
7.4.3 Embedded Fibres
8. DISCUSSION OF llESULTS
PAllT III
9. TOUGHNESS
9.1 Introduction
9.2 Fibre Surface Treatments
9.3 Toughened Matrices
9.4 The Role of the Fibre
10. TOUGHENED COHPOSITES BY FIBRE SUllFACE TllEATHENT
10.1 Materials Selection
10.2 Prepreg Preparation and Moulding
10.3 Results
10.4 Falling 1veight Impact Test Results
10.4.1 Uniaxial Or ientated HT-S Fibres in DX231/DX125
10.4.2 4% P.U. Coated HT-S Fibres Uniaxially Orientated in DX231/DX125
10.4.3 Biaxially Orientated HT-S Fibres in DX231/DX125
10.4.4 4% P.U. Coated HT-S Fibres Bia.xially Orientated in DX231/DX125.
10.5 System Investigation
10.6 Discussion
11. TOUGHENED MATRICES FOR TOUGHENED COMPOSITES
11.1 Haterials Section
11.2 Composite Preparation and Houlding
Page No.
40
41
43
46
50
62
62
62
68
74
78
78
79
80
81
82
82
83
84
86
90
104
104
106

I Pap~.
11. TOUGHENED MATRICES FOR TOUGHENED COHPOSITES (cont)
11.3 Results
11.4 Falling Weight Impact Tests
11.5 Discussion
12. TOUGHENED COMPOSITES BY A THEORETICAL APPROACH
12.1 Introduction
12.2 Materials Selection
12.3 Results
12.4 Discussion
13. CONCLUSIONS ON TOUGHNESS
PART IV
14. FRACTURE TOUGHNESS TESTING
14.1 Conventional Test Methods
14. 2 Fracture Mechanics
14.3 Fracture Mechanics versus Conventional Toughness Testing (Charpy Type)
108
110
112
120
120
122
124
127
131
131
134
139
14.4 Estimation of Fracture Toughness in Composites . 141
15. FURTHER IVCRK 152
CARBON FIBRE COHPOSITES
REFERENCES
APPENDIX I
APPENDIX 2

I
SYMIlOLS USED
Main Letters
·a
A
b
B
C
d
D
e
E
F
F
G
G1
H
k
K1
L
M
P
pph
r
ra
S
t
T
V
w
crack length
area
weight of polyurethane in blend
spreading coefficients
constant
diameter
bending stiffness
epoxide equivalent
tensile or Young1s modulus
Load on a specimen
free energy
shear modulus
work done at crack tip on crack initiation or crack arrest (A)
surface entropy
volume fraction of unbonded fibres
stress intensity factor of on crack initiation (1) o~
crack arrest (A)
length
molecular weight of curing agent
load supported
parts per hundred
radius
polar co-ordinate
width of crack
time
Temperature
volume fraction
weight of epoxy resin in the blend '

W Work of adhesion
Work to debond fibres from matrix
Work to pull fibres from and shear matrix
Greek Sumbols
~ngular direction
cpmpliance
tensile stress
y - shear stress
f tensile strain
y surface energy
'l. viscosity
y Poisson1s ratio
Suffixes
all the digits, x, y and z are used as constant digits
b bonded fibres
c critical
e composite
f fibres
i interface
L liquid
m - matrix
R resin
S solid
u unbonded fibres
V vapour

Abbreviated Capitals
CFRP carbon fibre reinforced plastic
CTBN
DIM
DETA
ILSS
MOCA
. PAN
carboxyl terminated, liquid butadiene-acrylonitrile rubber
4,4' diaminodiphenyl methane
diethylene triamine
inter-laminar shear strength
4,4' methylene bis 2-chloroaniline
polyacryloni trile
Other symbols and abbreviations are for registered trade products. These
products will be found in Appendix 1. Additional symbols correspond to
those used in S.!. units.
EQUATIONS USED
1
2
3·
4
5
6
7
8
9
10
11
12
14
. 15
16
1= ~ c fntax
G = ""2 (..:;~,-+.,......'1)
KI = if Irr. a
1 , KI r = Tf' e"Z
. y
17 K1C = I E<):C

PART I
1. INTRODUCTION
A M.Sc Course project carried out by the author at the RaihlaY Technical
Centre, Derby, provided the starting point for this research. In
connection with the evaluation of reinforced plastic gearvheels, the
poor wear characteristics of carbon fibre 'reinforced plastic
geanlheels were noted and microscopy revealed poor I{etting of the
carbon fibres by the matrix. The project then centred on an
investigation of the wcttillg of carbon fibres by liquid polymer
systems, and has nOl, been taken further in work described in the
present thesis.
The results of the H.Sc project explained \,hy the carbon fibres did not
appear to adhere effectively to the plastic' in tile geal~,eels.
I!ol{cvcr there I{ere p::oblems still to be solved arising from tile need
to explain the discrepancies in the H.Sc results. This H.Sc project
I{as necessarily a restricted investigation. The follo~ling research
first of all sought to explain these discrepancies and at the same
time to reviel{ the field of ailllesion. This I{as intended to give a
better understanding of the mechanism by which carbon fibres adhere to
plastics in composites. Ailllesion'is a large field but adhesion in CFRP
has been little studied and in the first section of the thesis the actual
,york carried out 'vas considered and s elected by a novel, extension of the
apparatus and expertise available, the time and resourC1lS endOlved to the
project, and tile discussions which looked at tile feasibility of different
parts of tile project.
In tile second part of tile thesis toughness of carbon-fibre composites
was investigated. l~lile stUdying ailllesion betl{een carbon fibres and
liquid polymers, several ideas arose which it 'vas hoped l;ould improve
the toughness of carbon-fibre composite. The carbon fibre composites
being produced ,;ere brittle and failed catastrophically under a 101{
energy level of impact. The existing procedure to toughen a carbon-fibre
•
1
composite, had been to use a fibre with poor adhesion to the matrix.
This in addition had the effect of reducing the composites fleJ..'Ural
prop er ties •
The problem was to investigate 'vays of :ilnproving toughness of carbon
fibre composites, and at the same t:iJnc carefully monitor the physical
properties of the composite. In the second part of the thesis this
. was achieved by considering the composite matrix, fibre and interfacc
in turn Witil tilC a:iJn of :iJnproving toughness.
Lastly while studying and measuring the toughness of composites it
was apparent that the existing standard test methods "ere inadequate
in assessing real-life behaviour. Techniques. were employed in order
to test the composites, which more accurately indicated their toughness.
Fracture toughness parameters as specified for mctals have also been
considered for composites. Some of the problems apparent with measuring
these parameters in composites are discussed and solved and tile direction
. indicated in which further useful research could be carried out.
2

2. CARBON FI IlRES
In engineering cOl1structiol1 th",r", is a continuing need for materials with
a higher specific stiffness and strel1gth. This demand usually starts in
the aerospace industry, but as it develops, these materials are often
adopted by designers in other fields.
In the last decade metals and alloys have been rapidly reaching their
ultimate in p",rformance, at a reasonable cost. Much research has been
carried out in the area of fibres and .>hiskers vlith a vieli to improving
on the properties of metals as engineering materials. This use of fibres
and Hhiskers, embedded in su.itable matrices, held the key to the continued
and future development of superior materials. The matrices chosen for
such fibres can be metals, ceramics or plastics and must fnlfil various
functions according to what is required of the composite. HOliever
plastics arc generally chosen for Uleir ease of fabrication.
Glass fibres have paved the \,ay for reinforcement of composites and have
achieved a high degree of acceptance by engineers. Their chief advantages
are high strength, low density, established properties and, most
improtant of all, low cost. Their chief disadvantage is their low
stiffness. There has been much research directed at producing a
similar fibre of higher modulus.
Much of this research has been directed towards producing carbon fibres,
from cellulose and polyacryloni trile.
slovlly. It has been reported by Gill
This research had progressed
(1) tilat Shindo (2) carried out
the first work which gave significant improvements in mechanical
properties of carbon fibres from syntiletic polymer fibres. He
introduced an oxidation stage in the production of carbon fibres from
3
polyacrylonitrile (PAN) before carbonising the fibre. Further
important worlc by Il'att, Phillips and J ol1nson (3) introduced the
concept of holding the fibre under tension whilst oxidation took
place and this first achieved a trulY,high-strength and high-modulus
carbon fibre.
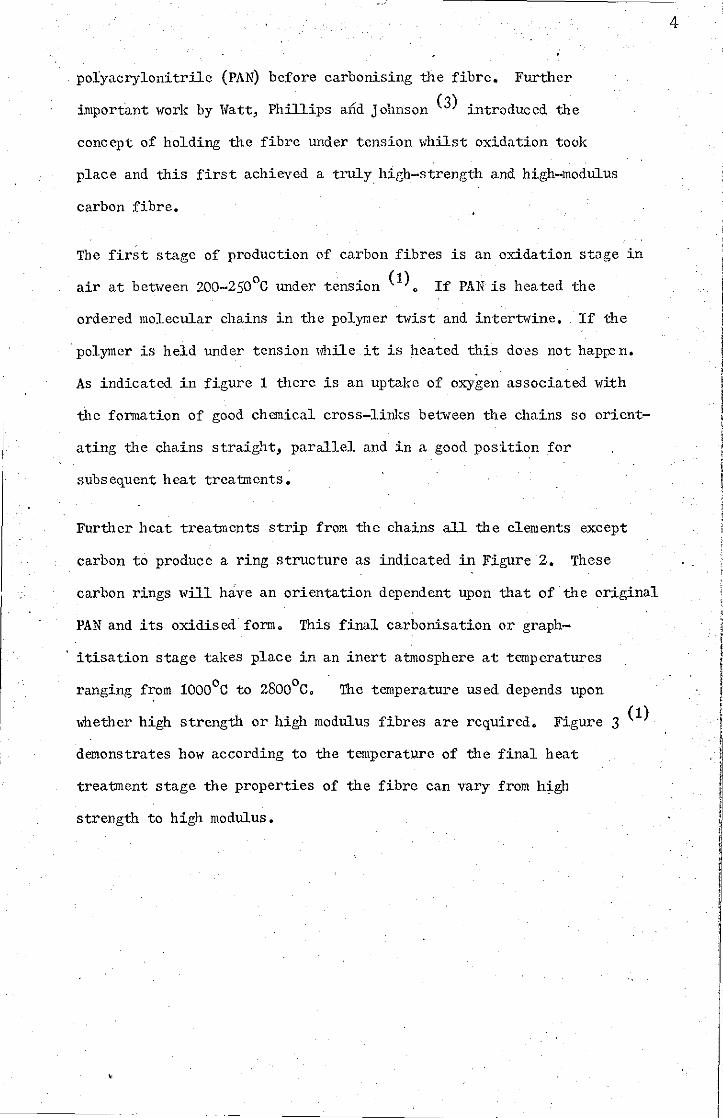
The first stage of production of carhon fibres is an oxidation stage in
air at between 200-2500 C under tension (1). If PAN is heated the
ordered molecular chains in the polymer twist and i.ntertwine. If the
polymer is held under tension while it is heated this do'cs not hap~ n.
As indicated in figure 1 therc is an uptake of oxygen associated with
the formation of good chemical cross-liw,s between the chains so orient-
ating the chains straight, parallel and in a good position for
subsequent heat treatments.
Further heat treatments strip from the chains all the elements except
carbon to produce a ring structure as indicated i.n Figure 2. These
carbon rings "ill hive an orientation dependent upon that of the original
PAN and its oxidised form. This final carbonisation or graph-
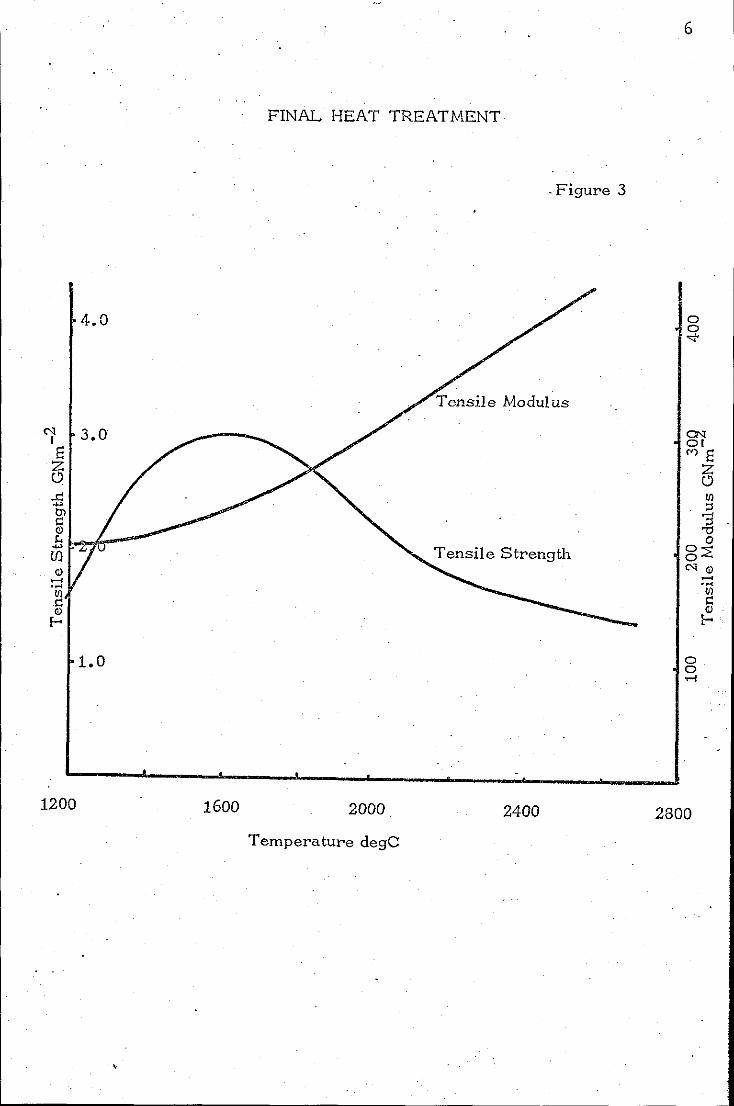
itisation stage talces place in an inert atmosphere at temperatures
The temperature used depends upon
whether high strength or high modulus fibres are required. Figure 3 (1)
demonstrates how according to the temperature of the final heat
treatment stage the properties of the fibre can vary from high
strength to high modulus.
4

I.
HEATING P .A.N.
( ... " ........ ~.. .",l::l )
+°2 --~
::.: 11°
-2HCN
:~\ .::- .;'
", .'
~. ". 1.' .
Figure 1
Figure 2
1I C
'- /~ /
'r '~ /~/ "'" C
1\ .
5
4.0
<'l 3.0 I E! z
t) ..c: .., tll s:: Cl k ..,
U)
0 -'M
III s:: Cl
£-0
1.0
1200 1600
,
FINAL HEAT TREATMENT
< Figure 3
Tensile Modulus
2000 2400
Temperature degC
6
o o 'i'
ON 01 f')E!
z 0 III ;:l -;:l
'"0 0
g~ <'lCl -'M
Vl s:: Cl
£-0
10 0 T-i
2800
3. C(}IPOSITES
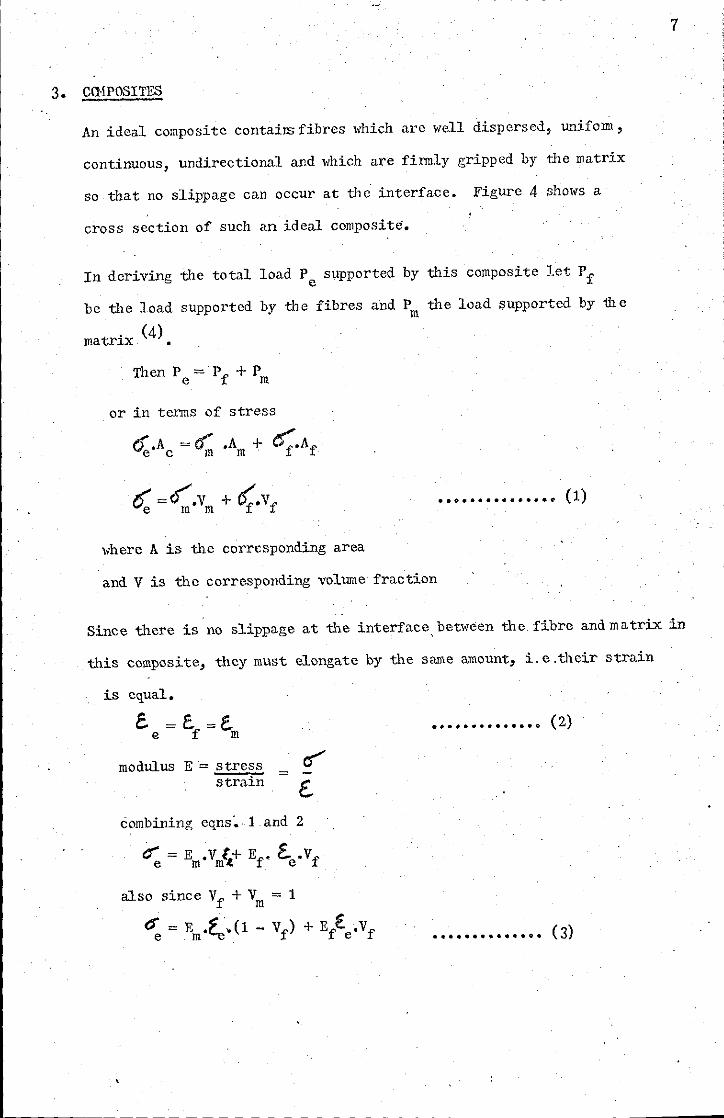
An ideal composite contailS fibres which are well dispersed, unifolJll,
continuous, undirectional and which are firmly gripped by the matrix
so that no slippage can occur at thc' interface. Figure 4 8hol.S a
cross section of such an ideal composite.
In deriving the total load Pe supported by this composite let Pf
be the load
matrix (4) •
supported by the fibres and P tile load supported by ~le III
Then P = Pf + P e m
or in terms of stress
Q.A = cr' .A + er:f.Af e c III m
•• o •••••• ~ ••••• (1)
where A is the corrl,sponding area
and V is the corresponding volume fraction
7
Since there is no slippage at the interface, bet\veen the fibre and ma trix in
this composite, they must elongate by the same amount, i. e .tileir strain
is equal.
c.=e..=e. e f m
modulus E = stress strain
combining eqns~ 1 and 2
a: = Em,Vm~+ Er C-e'Vf
also since Vf + Vm = 1
~ = Em·~ .. (l - Vf ) + El-e,Vf
••••••••••••• 0 (2)
•••••••••••• 0. (3)

,
p m
AN IDEAL COMPOSITE
p ~:----e
P f - Load Supported by Fibres Pm - Load Supported by MatriJ' P - Total Load Supported' e '
8
I
Figure 4
The ratio of the load carricd by the reinforcement, to the load
carried by the matrix is:-
re-arranging eqn. 3
E f •
(1 - V ) m
E m
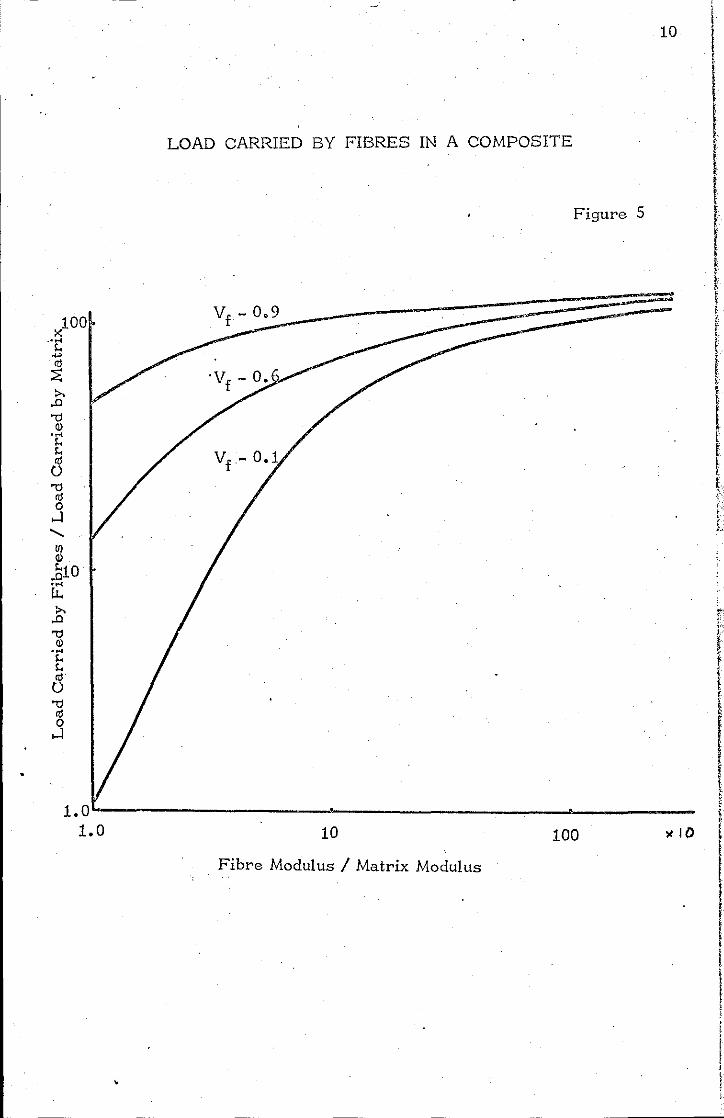
This equation sho\Vs ho" very strong fibres or "hiskers, when incorporated
in a matrix and the "hole composite strained, carry the majority of
the load, according to their high modulus. It is for tllis reason that
composites are being developed, to. improve on existing materials.
Figure 5 (4) exemplifies tilese points. If carbon fibres are in a
matrix such as epoxy, "hose modulus. is 100 times smaller than carbon
and the fibres oCCUpy 60% of tile composite volume, then the carbon
fibres carry the majority of the load imposed on the composite. Even
. if glass fibres are incorporated in a matrix such as nylon l>ith a
modulus only ten times less than the glass, and occupy only 10% by
volume, the glass still carries approx 50% of tile load.
" This explains why composites have been developed in recent years to
utilise high strength,. high modulus fibres and whiskers. By incorp- '
orating fibres and whiskers in plastics, the physical properties of
·the plastics can be greatly improved. The high performance fibres and
whiskers can also, "hen in a compOSite, give materials wit-l, superior
properties by carrying tile majority of the load.
"
9
LOAD CARRIED BY FIBRES IN A COMPOSITE
Figure 5
10\
t I f
t
I ~ ,.
:= ! I
1.0~----------------~----------------~---------1.0 10 100 lIlO
. Fibre Modulus / Matrix Modulus
I ,
1 ,
11

I
I
PART II
4. ADHESION TO CARBON FIBRES
4.1 The Role of Adhesion in Composites
An aralysis of short and long fibre reinforced composit.es will
elucidate the role of adhesion in bonding the fibres to the matrix
in a composite. Long fibres are thos e in general over about 10 llnll
in length. Short fibres are those whose length is near the cl'itical
length 1. whose meaning is explained below. Composites are only c
prepared Ivith short fibres, if the processing conditions do not allow
long fibres to be used, e.g.Injection moulding.
4.2 Short Fibre Composites
Short fibre reinforced composites will not support their theoretical
maximum load as derived in tile equations mentioned in the last section.
This is because the average load supported by each fibre is less than
11
the ultimate fibre strengm. Figure 6 illustrates this point, me graph
representing me stress 0'-; along a fibre, falling to zero at the 'ends (4).
Let me lengm over which the stress falls to zero be IC/2' In short
fibres le' me tlVO ends can be a significant proportion of tile fibre
length and in extreme cases can be greater man me fibre lengm. In
mese cases me average stress supported by the fibre is less than me
amount it could support if it Ivere stressed to its maximum ~f along max
its total lengm. Consequently me load supported by a composite re-
inforced by short fibres does not reach the theoretical level if lc is
a significant proportion of the fibre length.
Consider Figure 7 in which a small section ~;J' of a short fibre is
represented. The shear stress1:m arises from the difference betlVeen
the moduli of tile matrix and fibre when stressed and enables the stress
applied to a composite to be carried by the fibres.

Stress in Fibpe
• • I
I
Figure 6
-1 _ <.- re _)-
.-,
.~ zc f-(--'i~2~--------lf --------_---",
FiguP87
~<--- dX -----~)
12
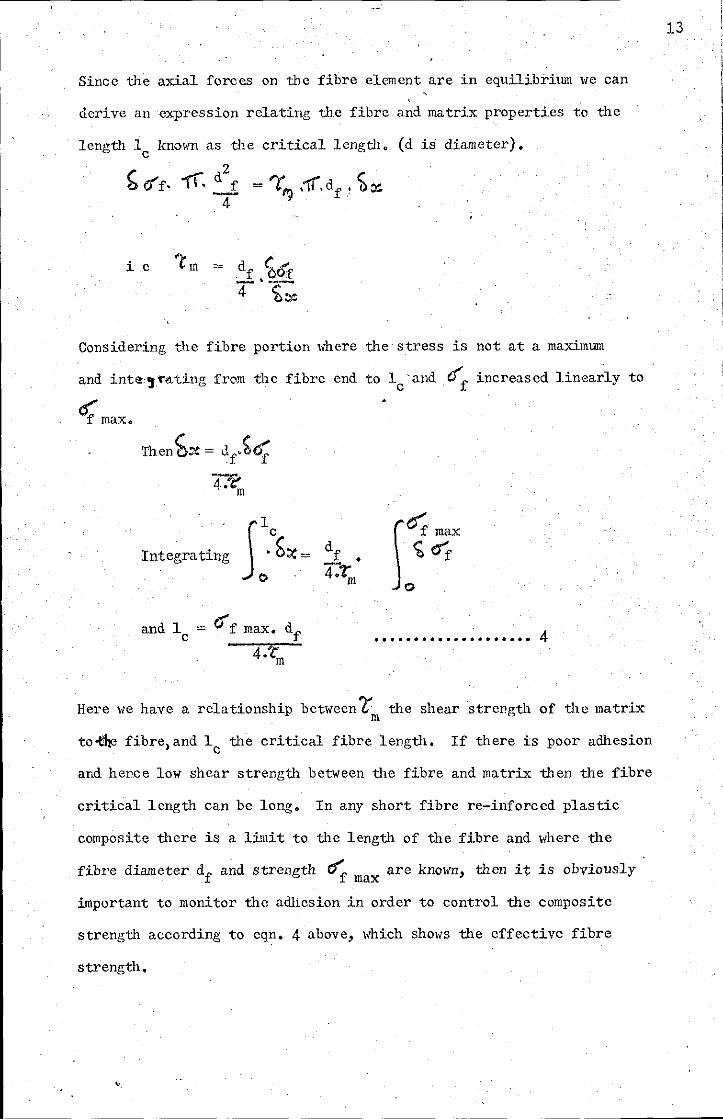
Since the axial forces on the fibre element are in equilibrium I<e can
derive an expression relating the fibre and matrix properties to the
length 1 known as the critical length. (d is diameter). c
b et f. 1'\. d2
f = '1"", ,11'". df) b ~ 4- '1
i e I: m =
Considering the fibre portion where the stress is not at a maximum
and inte,1"ltting from the fibre end to lc 'and crf increased linearly to
~ f max.
. ' .. Jl Integra ting ,c~::( =
(;> .
and lc = er f max. df 4.tm
Ja-; max
<ea'f
o
• • • • • • • • • • • • • • • • • • •• 4
Here we have a relationship between?: the shear 'strength of the matrix m
to-dte fibre. and le the critical fibre length. If there is poor adhesion
and hel'ce low shear strength between the fibre and matrix then the fibre
critical length can be long. In any short fibre re-inforced plastic
composite there is a limit to the length of the fibre and where the
fibre diameter df
and strength t1'.f are known, then it is obviously max
important to monitor tile ailllcsion in order to control the composite
strength according to eqn. 4 above, which shows the effective fibre
strength,
13
,4.3 Long - Fibre Reinforced Composites
A long fibre is generally \,here its length is much greater than lc.
The'role of adhesion in long fibres is complicated but important.
In general the effect of poor adbesion is easily eJ..'Plained, As the
composite is stressed towards its breill<ing point, certain fibres in
the cemposite will fail before the composite fail~. This arises
because of the variable strength of the fibres. The composite does
not immediately fail because the surrounding fibres are stronger
and the stress is thrOlVl1 on these fibres. The extent to which the
stress is transferred to other surrounding fibres depends on the
interface betl{cen the fibre and matrix. Better adbesion at the inter-
face enables the stress from broken fibres to be more efficiently trans-.
ferred to unbroken fibres.
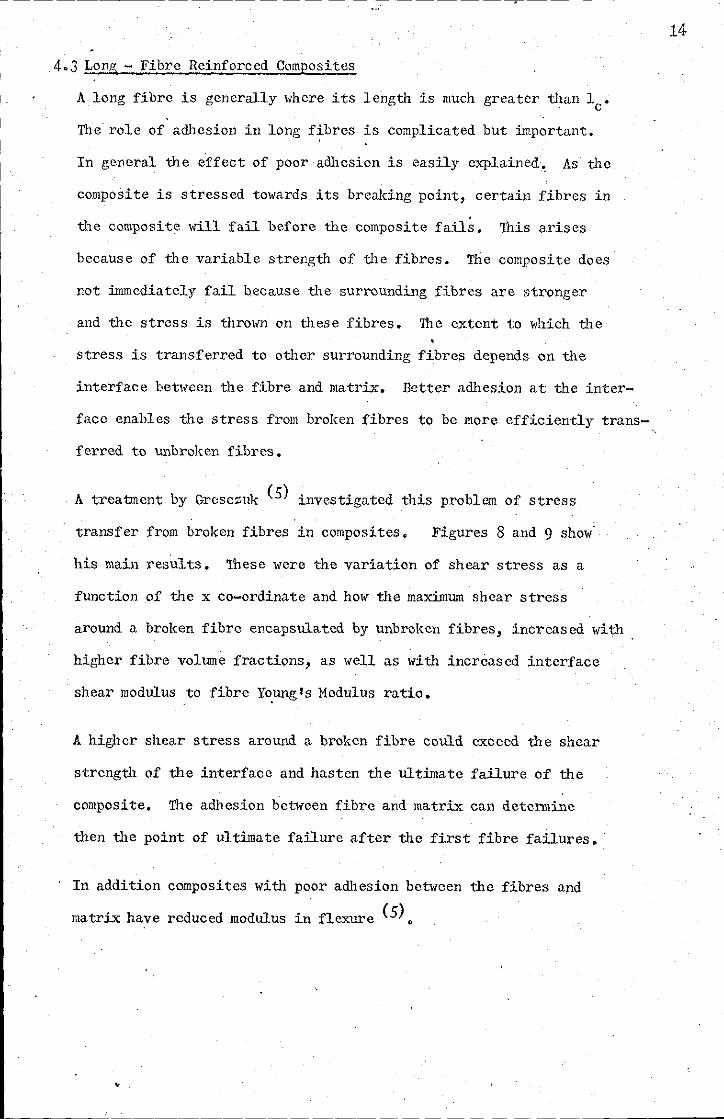
A treatment by GrCSCZ1~ (5) investigated this problem of stress
transfer from broken fibres in composites. Figures 8 and 9 show'
his main results. These were the variation of shear stress as a
fUnction of the x co-ordinate and how the maximum shear stress
around a broken fibre encapsulated by unbroken fibres, increased with
higher fibre volume fractions, as well as with increased interface
shear modulus to fibre Yoyng1s Modulus ratio.
A higher shear stress around a broken fibre could exceed the shear
strength of the interface and hasten the ultimate failure of the
composite. '!he adhesion between fibre and matrix ean determine
then the point of ultimate failure after the first fibre failures. '
In addition composites with poor adhesion beu,een the fibres and
matrix have reduced modulus in flexure (5) •
14
SHEAR STRESS VARIATION AROUND BROKEN FIBRES
0.08
0.06
1:' Ocr 0.04
0.02
0
15
10
o
~-30"
. 0
, , -
0.3
Variation of 'r with <'9
5 ,
" IS. r,
10
0.4 0.5
Figure 8
2r
I-------~----~&~
15
1: -Shear Stress er" - Direct Stress r - Fibre Radius
0.015
'.;, .,
'-,..
20
Figure 9 . - Interface Shear Modulus
-1 E f - Fibre Young1s Modulus
0.005
0.001
0.6 0.7 Fibre Volume Fraction
15
i I I ! ~ I l l
I , •

\
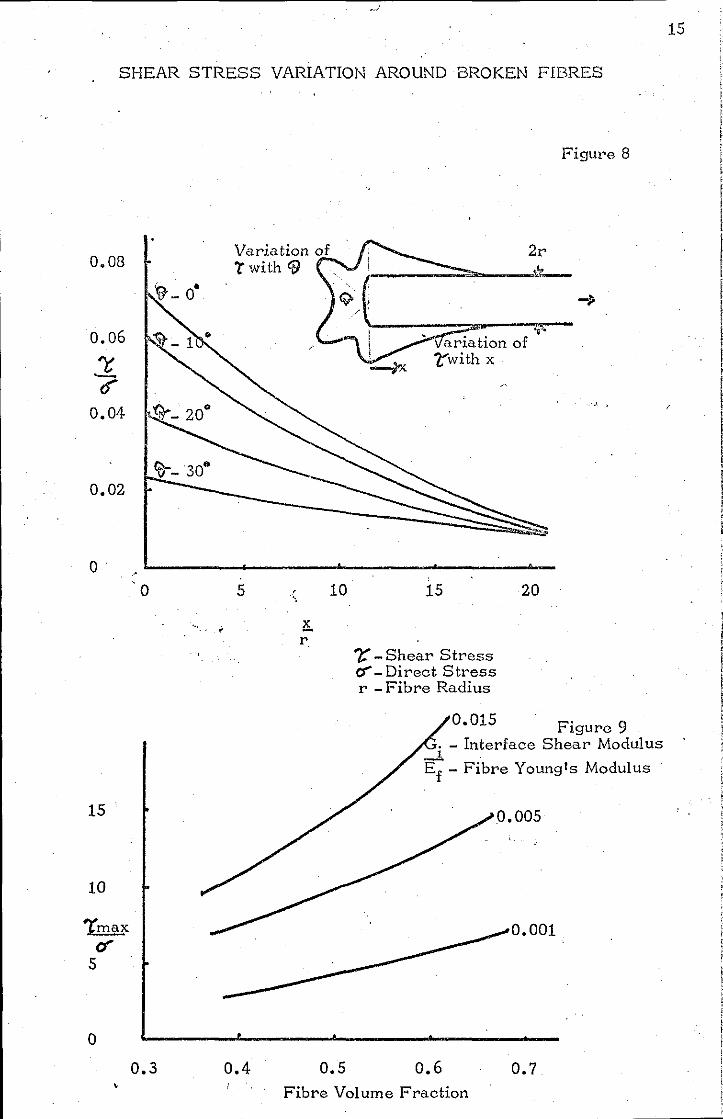
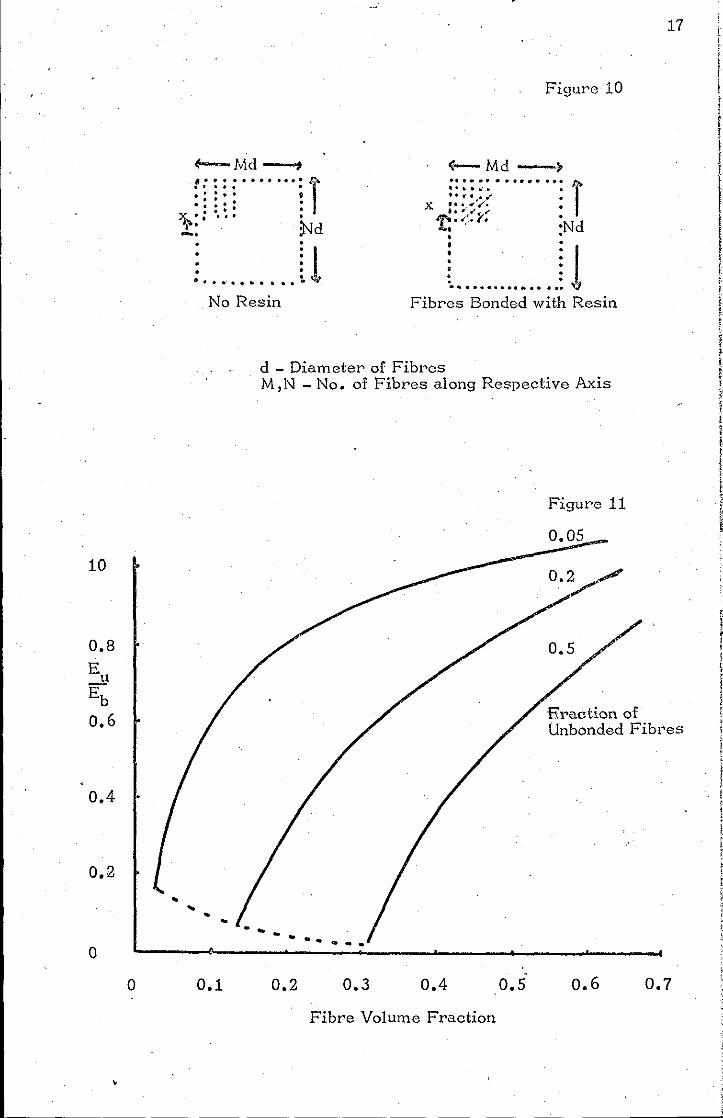
Comparison of the tvo systems in figure 10 of bonded and unbonded fibres
gives the respective bonding stiffness where, 1.4
TheLmoment of :i :a~~Q.:t I of a single fibre is·
4 I =IT·d f
04-
For unbonded fibres the bending stiffness Du is
Du = 11.N.Ef
.1T.df4
64 in I,hich the effect of the resin is ignored.
For the case with the bonded fibres the bending stiffness is Db
b - bonded fibres
3' 4 M.N -\ d - f .12
Simplifying by ignoring the term Em (1 = :r) Db =.1. NZ
••••••••• ~ •• o ••• (5) Du 3
HoV/ever for most composites, the flexural modulus lies between Db and
Du'
For Young1s Modulus E the following equation relates the effect of
unbonded fibres (5)
• k
k - volume fraction of unbonded fibres
Ef - young I s Modulus of fibres
- ,
16
I ,-r " !i
11 I
i
11
10
0.4
0.2 ..
0
0
Figure 10
4-Md -) , ...................... AI .. , . .. .. .. .. : : .. .. t
':::: : ~:. .... . _. Nd
........................ " .. T · ......... .. ... 11' .... ...
x '.0,"'/' ... .. ..... ... .. 'r,' <;. 1". :Nd
• : 11 • • • • .. • ' .............. t.
: : I • • · . ' ........................... : «J
No Resin Fibres Bonded with Resin
d - Diameter of Fibres M,N - No. of Fibres along Respective Axis
Figure 11
0.05
Eraction of Unbonded Fibl'es
.. .. .. .. .... .. .. .. .
0.1 0.2 0.3 0.4 0.5 0.6 0.7
Fibre Volume Fraction
t I 1. t
18 t i I i t , " l
F:igurc U sholVs the effect of unbonded fibres on the Young I s Hodulus. ~ ,
i I It is only really apparent with low fibre volume fraction composites ~
! I
I "
such as \,lth reinforced thermoplastics. For example a ten per cent I , , i,
volume fraction composite,' with only five per cent of its fibres
!
l' unbonded" 110uld have only fifty per cent of its modulus if there were
, , no unbonded fibres. ; \ c ~ ,
i !
Finally for composites that have goed adhesion, the fracture behaviour
is a well defined break. In contrast con~osites ~uth poor adhesion
l
I progressively fracture, giving bond faj~ure, ~~trix failure, fibre , f
t' failure and ultimately composite failure. , r , \
Having explained the role of adhesion it is apparent that an investigation \ c f into the adhesion betlVeen those materials used in composites I,ill lead ~. , '" to a better understanding of composite technology. t
;j
, "
• , ,~ , " to ;; , I' £, ~,
.;,
.' i: ',' ~,
• ~, , , , ~;
~ ii r, ! .~ ~ ;
1 i i , ,
! i 1 I ! I I , j
, I ! I
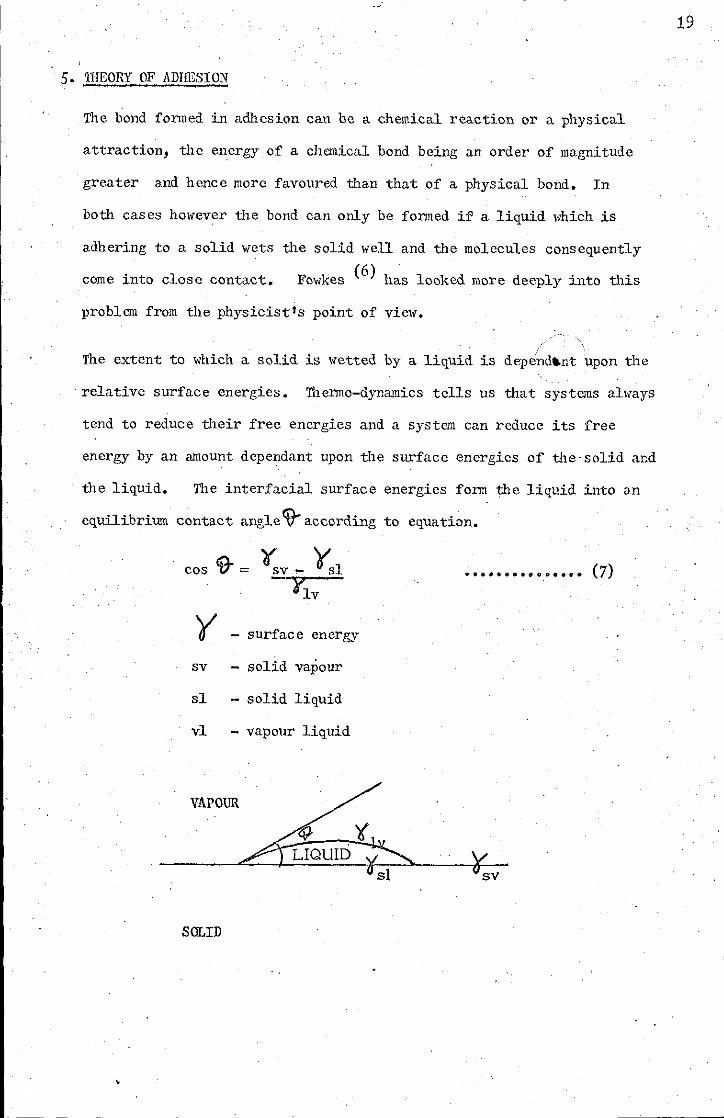
5. 'IHEORY OF ADlmSION
The bond formed in a&lesion can be a chemical reaction or a physical
attraction, the energy of a chemical bond being an order of magnitude
greater and hence more favoured than that of a physical bond. In
both cases however the bond can only be formed if' a liquid Ivhich is
a&lering to a solid wets the solid I,eil and the molecules consequently
come into close contact. Fowkes (6) has looked more deeply into this
problem from the physicist's point of viel".
The extent to which a solid is wetted by a liquid is depend~nt upon the
. relative surface energies. Ihermo-dynamics tells us that systems ahrays
tend to reduce their free energies and a system can reduce its free
energy by an amount dependant upon tile surface energies of ~he solid and
the liquid. The interfacial surface energies form the liqUid into a.n
equilibrium contact angle ~ according to equation.
y surface energy
sv solid vapour
sl solid liquid
vl - vapour liquid
VAPOUR
SOLID
19
I
High melting point materials and hard materials terd to have high
surface energies, whereas liquids and polymers have 101, surface energies.
These hard materials are wet completelY,by polymers and liquids and sho'w
zero contact angles
.' Carbon fibres are reported (7) to have low surface energies (?tc of 44-48
MN/m). This compares ~Iith all commonly used polymers which have fa values
from 20-100 }IN/m) tc is a parameter derived by Zisman which essentially
is the surface tension of a hypothetical liquid which just gives a ~ero
contact angle on the solid (8,9). According to Zisman a liquid or m.-lt), '
::" ::: ,vill completely ,,,et another solid, as long as the solid has a high
~c. Carbon fibres then 'vill not necessarily be perfectly 'vetted out by
all polymers.
The contact angle expressed in equation 7 above gives a useful inverse
measure of the 1fettability of the solid by the liquid (8). Poor
wetting will reduce the adhesion bet;;een a solid and liquid whether the
adhesive forces are physical or chemical in nature because it results in a
high contact angle 9-.
There are several conflicting opinions on the roles of wetting, surface
energies and energy equilibriums, and of their effects on adhesion.
Harford and White (10) and Wu (11) among others; look at the equations
below and concluded that in order
Work of adhesion
Contact angle of 1 on 2
Spreading co-efficient for 1 on 2 = D12
(- surface tension
)l12-interfacial tension
20
! I I
I I I
i
r I I 1
-, 1
! ; I
I b I
;1 !

to· study adhesion it was
tension of polymers.
necessary to knOlv accurate values for surface
Wu (11) applied the. values he had measured to
known adhesive strengths to give theoretical values for contact angles,
work of adhesion and the spreading co-efficients.
Brcwis (12) and Huntsberger (13) looked at Zisman1s Yc and at contact
angle Ineasurements. Huntsberger particularly criticised most published
IVork on wetting, and shOlved theoretically that even high contact angles
could give complete IVetting. He quoted the follolVing thermodynamically
21
.1
derived equation. I;
Free Energy 6F = Asv._Y'sl - [As~ '(sv + Alv, o;.v J ASV _ actual area of solid - vapour interface
Alv _ actual area of liquid vapour. interface
recalling equation. 7 mentioned above,
~F = - ¥lv (1 +(~) .cos<if)
i.e. unless (:~:) .cos<i) is - ve then thermodynamic equilib;ium corresponds
to a IVetted state and this is possible even if 'It is> 900 (so discounting
surface energy and contact angle measurements as a guide to adhesion).
HOIvever although this discounts surface energy ,in assessing IVetting
Huntsberger changed his mind and stated that contact angles IVould sI101-/
positions of metastable equilibrium and were an important factor in
assessing adhesion. BreIVis took up Huntsbergeris point about contact
angles greater tilan 900 not necessarily leading to·poor wetting, but
noted that other kinetic factors and surface geometry factors were
involved. BreIVis also introduced the effect of the different components
in adhesion, that is chemical bonds and physical bonds, and stated that
in measuring surface tension it was necessary to separate these. 'I'u
also mentioned these components in surface t:ension ~Ihich further
complicated their measurement and aSSessment.
The temperature dependence of adhesion has been approached in different
ways. Zisman (8) has derived the follOl;ing equation showing a
relation betvleen contact angle and temperature T.
• ..• ~ ........ (8)
Cl, C2, C3 and C4
are positive constants
. Wu (14) has also e:>"llressed a relation bet1.;een temperature and contact
angle.
22
[ ,:,<tJ]' ["2 -", {'H) 1 ............ (9)
where H2 and Hl are surface entropies given by -(~)and Cs is a constant.
Here lVtfi s equation 9 shows a different temp. dependence than Zisman'is 8.
His eqn. 8 shmfs a variation only positively proportional to temperature,
Wu shows 9- can be proportional negatively or positively to temperature.
However Brewis produced results showing no variation in contact angle ,rith
temperature. Harford and White in measuring the temperature variation of
surface tension ShOl, like Zisman a linear variation with temperature.
Huntsberger (15) looked into the temperature variation most precisely,
using t1io different techniques for measurement and presented data for
several polymers. He hypothosised that the extent of wetting controls
the adhesion, and that temperature affects this inasmuch as it affects
the time to reach equilibrium, viscosity variation, visco-elastic respon3e
and interfacial stress concentrations, which all affect the extent of
wetting.
'!he way in which surface roughness affects adhesion was discussed by Baier
et alia (16) and Brewis (12). They mentioned that rougher surfaces give
better keying and mechanical adhesion. Broughton and Krok (4) looking
at adhesion via contact angles showed hOIf a roughened surface will reduce
the contact angle and promote more intimate contact, and hence better
adhesion. They give the following equation relating an increase of Cs (20,21) in sUrfaee area, to the eontact angle
Then increased surface area
cos cg.. (increased area)
= Cs cos9 (original)
Little. mention in the above discussion has been made of the kinetic
effects on ailllesion, although several of the authors sited (4, 6, 9, 10, ·11, 12, 13, 15, 16) , have. used the time dependence of adhesion to explain
spurious effects, or have mentioned only in passing how it can affect
adhesion. Cherry et alia (17) rightly investigated the kinetics of
adhesion as if its importance were equal to contact angle or surface
tension measurements. For obviously in any real situation, as a liquid
is wetting a solid it is solidifying, ar,d any voids left at the interface,
23
because the liquid sets in a finite time, will affect the adhesive strength.
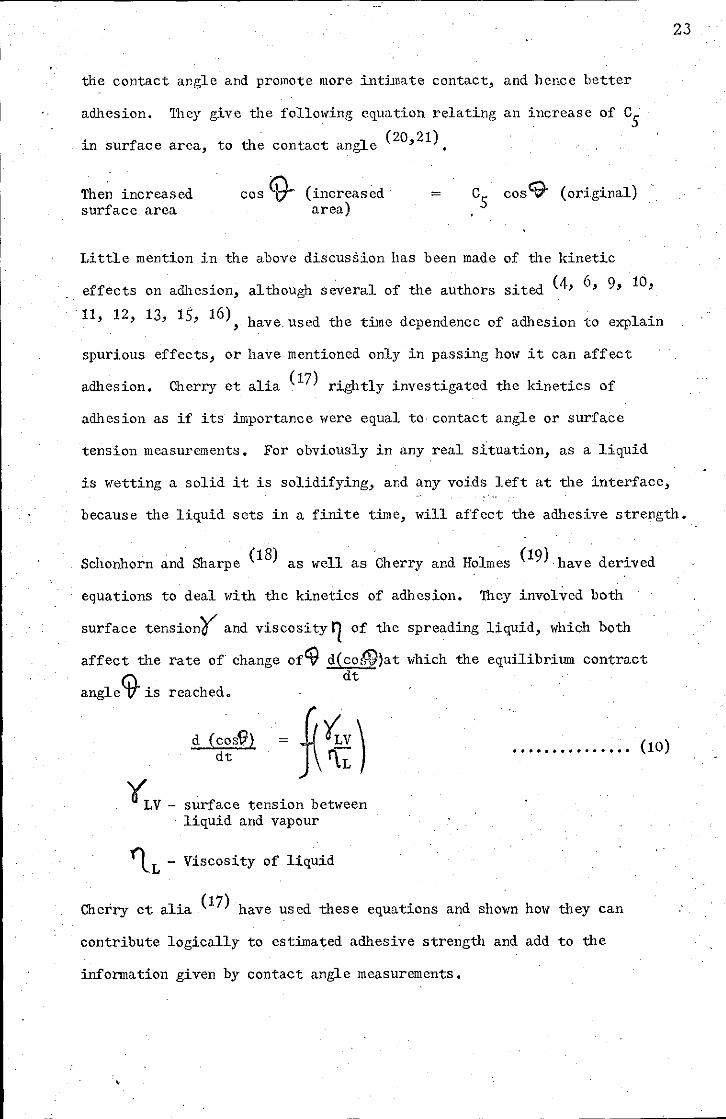
Schonhorn and Sharpe (18) as well as Cherry and Holmes (19) have derived
equations to deal with the kinetics of adhesion. They involved both
surface tension¥' and viscosity ~ of the spreading liquid, which both
affect the rate of change ofCii d(co~lat which the equilibrium contract
angle <if is reached.
d (cos~) dt
dt
surface tension between liquid and vapour
rtL - Viscosity of liquid
• • • • • • • • • . . • • •• (10)
Cherry et alia (17) have used these equations and shown how they can
contribute logically to estimated adhesive strengtil and add to the
information given by contact angle measurements.

24
6. DISCUSSION FOR EXPERll1],NTAL PROCEDUR.'C
In section 5 it was shown that to assess adhesion bet\,een a solid and a
liquid, either contact angles or surface tension can be measured. 1bese
measurements although only strictly 'a step towards assessing adhesion,
have in the past been selected as the most important parameters in this
assessment.
( 10 11 12) Thos e workers ' , who have assessed adhesion from a theoretical
point of viel, and derived and discussed equations for the adhesive
parameters have rather naturally decided that surface tension measurements
being exact parameters of materials are the correct approach.
Ho,fever from a technological point of view surface tension measurements
can only be a gUide in giving thcoretical contact angles, \York of adhesion
and spreading parameters. None of these parameters can be said to be an
exact guide to adhesion. This is borne out by the lack of comparative
figures beuveen these parameters and adhesion for those authors(8, 9, 10, 11)
using surface tension measurements as a guide. Another disadvantage in
using surface tension to assess adhesion beuveen carbon fibres and liquid
polymers, is that the surface tension of carbon fibres can only be m\,asured
by a contact angle method. Obviously in this example contact angle
measurements could \VeIl be used to assess adhesion directly. Ho\Yever
surface tension measurements could be valuable \Yhen looking at the
possible adhesion bet\Veen two materials as opposed to the actual adhesion.
It was decided in the follOl;ing \York to measure the contact angles of
the liquid polymers.
i
7. EXPEIIDIENrAL PROCEDURE AND RESULTS
7.1 Contact Angle Measurement
7.1.1 Apparatus
.. Techniques for measuring contact angles of liquids on surfaces are \~ell
established including quite sophisticated null methods (22, 23, 24).
!lOl,ever few methods have been developed for measuring the contact angles
of liquids on fibres and some of these require elaborate equipment and
(25, 26) techniques • Grindstaff (27) developed a simple apparatus
for measuring the contact angles of liquids on synthetic fibres which
was constructed fairly easily. His technique was extensively developed
25
·in order that the contact angles of liquid polymers on carbon fibres could
be measured. Liquid polymers require to be heated to an accurately
known temperature and care taken to S top their degradation. The
carbon fibres used were very brittle and only just visible with the
naked eye.
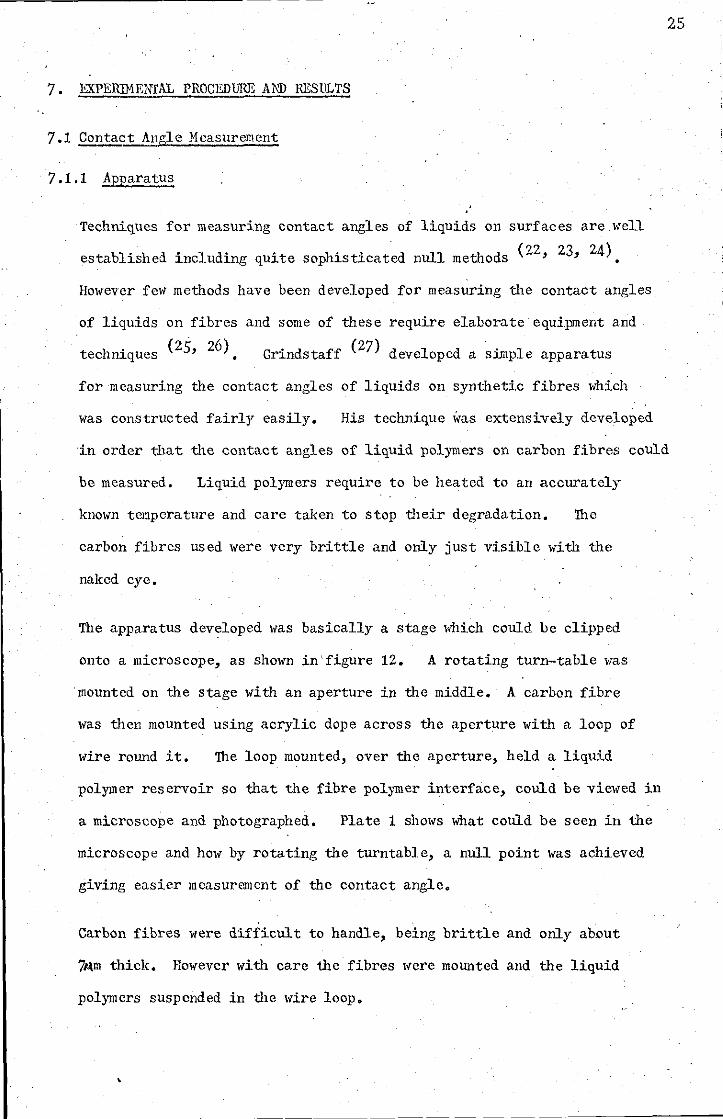
The apparatus developed was basically a stage which could be clipped
onto a microscope, as shown in figure 12. A rotating turn-table was
·mounted on the stage with an aperture in the middle. A carbon fibre
was then mounted using acrylic dope across the aperture with a loep of
wire round it. nle loop mounted, over the aperture, held a liquid
polymer reservoir so that the fibre polymer interface, could be viewed in
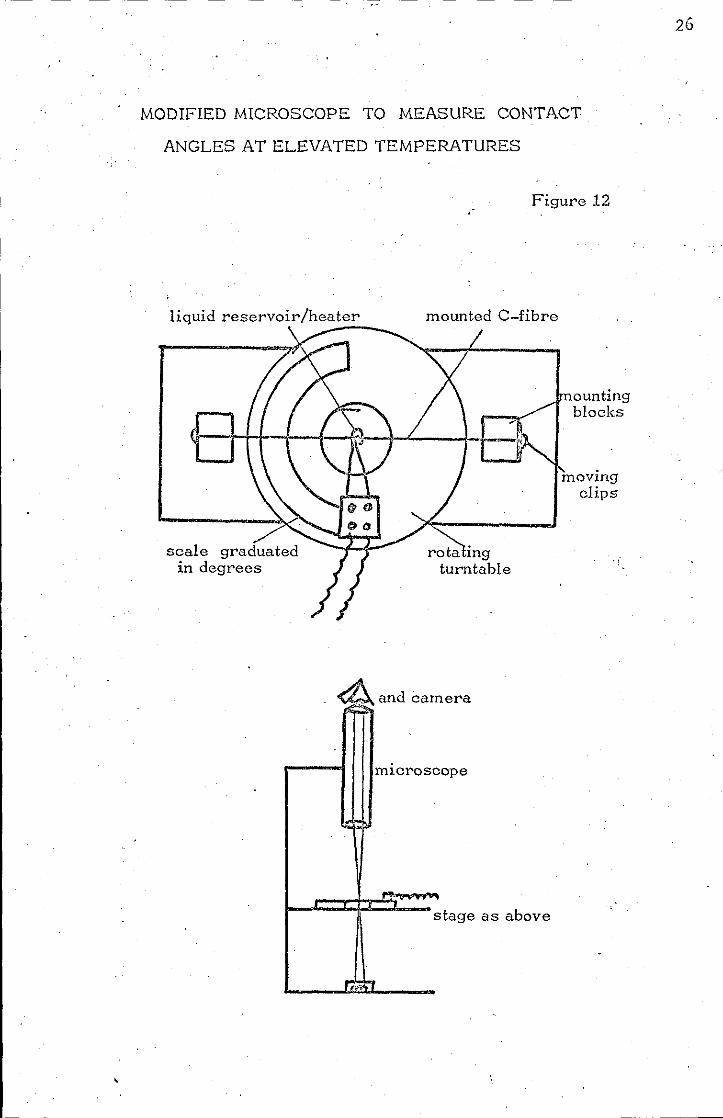
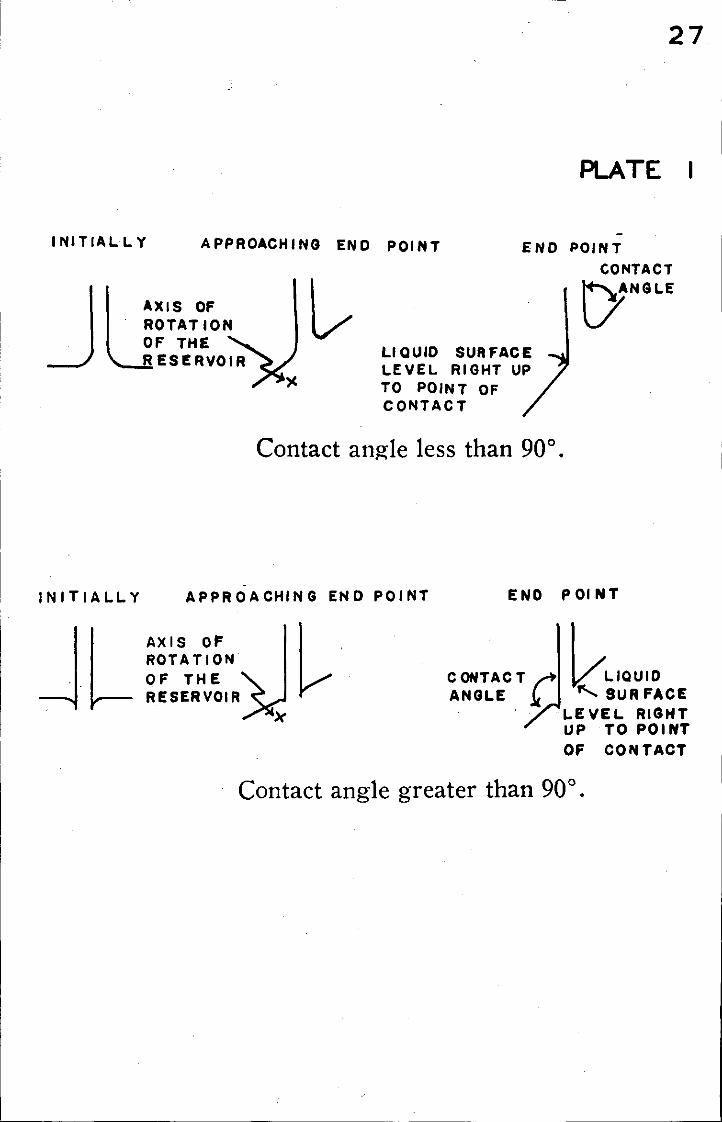
a microscope and photographed. Plate 1 shows what could be seen in the
microscope and how by rotating the turntable, a null point was achieved
giving easier measurement of the contact angle.
Carbon fibres were difficult to handle, being brittle and only about
7Am thick. However with care the fibres lVere mounted and the liquid
polymers suspended in the lVire loop.
~- - - _. - ---'---------
MODIFIED MICROSCOPE TO MEASURE CONTACT
ANGLES AT ELEVATED TEMPERATURES
liquid reservoir/heater
scale graduated in degrees
Figure 12
mounted C-fibre
rota ing turntable
ounting blocks
~and camera
microscope
stage as above
26
27
J
PLATE
INITIALLY APPROACHING END POINT END POINT CONTACT
AXIS OF ROTAT ION OF THE
~NGLE
'--...!lR ESERVOIR LIQUID SURFACE LEVEL RIGHT UP TO POINT OF
INITIALLY
CONTACT
Contact angle less than 90°.
-APPROACHING END POINT END POINT
AXIS of ROTATION OF THE RESERVOIR
C ONTAC T ,. ~LIQUID ANGLE .\( _ "SUR FACE
LEVEL RIGHT UP TO POINT OF CO 1\1 TACT
Contact angle greater than 90° .

Under its first stage of development the apparatus was used to measure
the contact angles of epoxy and polyester resins at room temperature
(23 ± 2°0). The next stage in its development was to replace the wire
loop by a thermocouple wire loop. An electronic circuit was constructed
using tile technique of Glasser and Miller (28) which enabled the thermo-
couple to become an alternating heater and thermocouple or 'thermocouple
micro-furnace I. The microscope stage \,as also enclosed in a stream of
nitrogen. By this technique a small drop of molten thermoplastic could
be held round a carbon fibre at any accurately known temperature up
to 3000
0 in a stream of nitrogen to retard tile polymer degradation. _ lhis
technique to measure contact angles was developed in the M.Sc. course
project carried out at the Railway Technical Oentre in 1970.
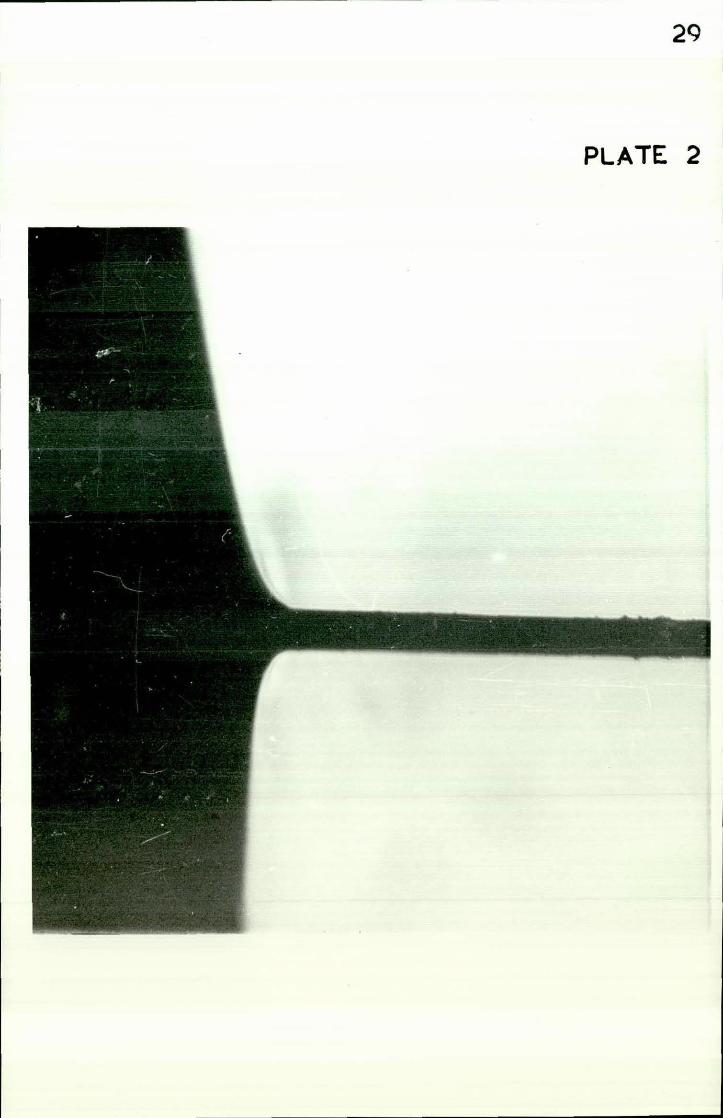
Plate 2 shot,s a typical contact angle of a thermoplastic on a carbon fibre
as photographed through the microscope. From this photograph the contact
angle (~) could be measured or the turntable on the stage rotated to give
a null-point and hence 1iJ:
28
The carbon fibres used for the investigation were all those grades which "ere
then available from Oourtaulds. The thermoset resins used in the invest-
igation were both poly.ester and epoxy resins. Crades in common usage
(BXL SR 17449 and $lell Epikote 816/Epikure TET), grades specially
recommended as being sui table for carbon fibres -(Scott Bad er IS Orystic 272 -I
and Oiba IS Araldi te MY 778/HY 956) and an experimental high performance
grade (BXL ERLA 4617). The selection of thermoplastics covered most
of the common types which could have been reinforced by short carbon fibres.
Although tile angles were measured in the M.Sc. course tile results were
not tilen appreciated and analysed.
7.1.2 Results of Contact Angle given as cos~
111e grades of thermoplastic used \;ere :-
High Density Polyethylene BRP,Ltd Rigidex Rl01
29
PLATE 2
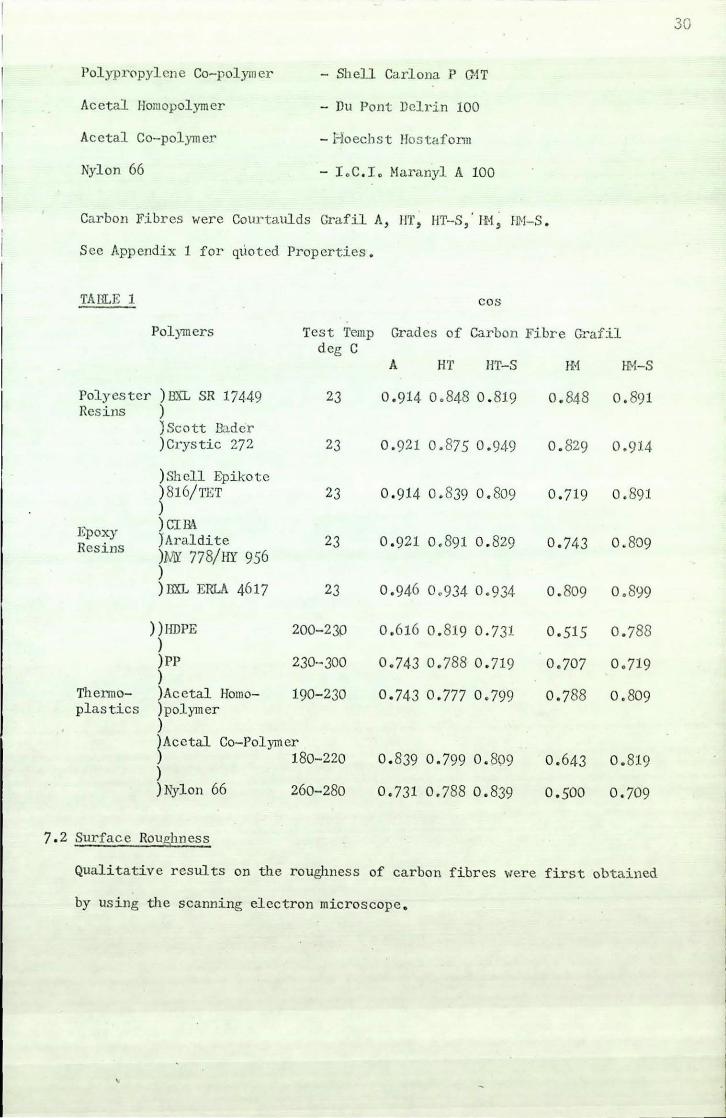
Polypr0pylene Co-polymer - Shell Carlona P (}IT
Acctal Homopolymer - Du Pont llelrin 100
Acetal Co-polymer - Hoechst Hos taform
Nylon 66 - I.C . I. Hamnyl A 100
Carbon Fibres were Courtaulds Grafil A, HT, HT-S" I'N, HH-S.
Sce Appendix 1 for qtioted Properties.
TAIlLE 1 cos
Polymers Test Temp Grades of Carbon Fibre Grafil deg C
Polyester ) I3XL SR 17449 23 Res ins )
) Scott Bader )Crystic 272 23
)Shcll Epikote ) 816/TET 23 )
Epoxy ) cr &\. )Araldite 23 Resins )Nii 778/HY 956 ) ) I3XL ERLA 4617 23
) )HDPE 200-230 ) )1'1' 230--300 )
Thermo- )Acetal Homo- 190-230 plastics )polymer
) )Acetal Co-Polymer ) 180-220 ) ) 1\1ylon 66 260-280
7.2 Surface Roughness
A HT HT-S
0.914 0.848 0.819
0.921 0. 875 0.949
0.914 0.839 0.809
0.921 0.891 0.829
0.946 0 .934 0.934
0.616 0.819 0.731
0.743 0.788 0.719
0.743 0.777 0.799
0. 839 0.799 0. 809
0. 731 0.788 0.839
H·j Hl-I-S
0. 848 0.891
0.829 0.914
0.719 0.891
0.743 0. 809
0.809 0.899
0.515 0.788
0.707 0.719
0.788 0. 809
0.643 0.819
0.500 0.709
Qualitative results on the roughness of carbon fibres v/ere first obtained
by using the scanning electron microscope.
30
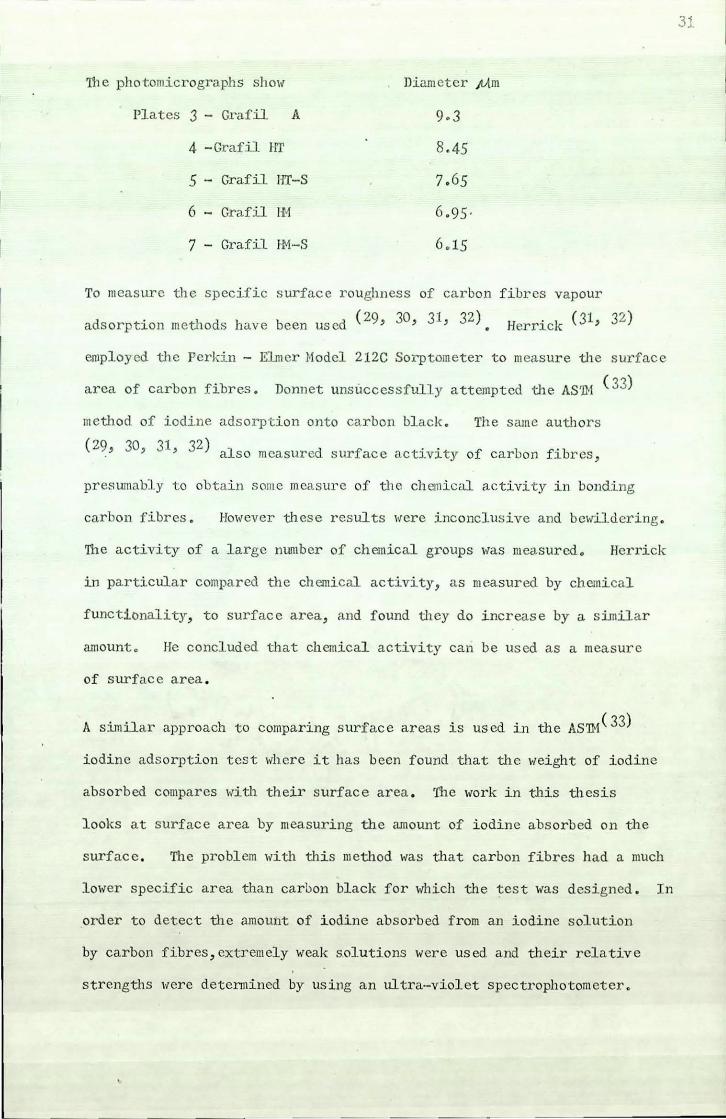
'Ih e photomicrographs ShOl1 Diam eter Mm
Plates 3 - Grafil A 9.3
4 -Grafil fIT 8.45
5 - Grafil Iff-S 7.65
6 - Grafil 111 6.95·
7 - Grafil fN-S 6.15
To measure the specific surface roughness of carbon
d . th d I b d ( 29, 30, 31, 32 ) a sorptlon me 0 Slave een us e
fibres vapour
Herrick (31, 32)
employed the Perkin - Elm er Hodel 212C Sorptometer to measure the s urface
area of carbon fibres. Donnet unsilccessfully attempted the AS 'm ( 33)
method of iodine adsorption onto carbon black . The same authors
( 29, 30, 31, 32) 1 d f . , f b f' b a so measure sur ace actJ.Vl. ty 0 car on ). res,
preswnably to obtain some measure of the ch em i cal activity in bonding
carbon fibres. However these r esults were inconclus ive and bCldldering .
'!he activity of a large number of chemical groups was measured. Herrick
in particula r compared the chemical activity, as measured by chemical
functionality, to surface area, and found tlley do increase by a similar
amount. He concluded that chemical activity can be us ed as a measur e
of surface area.
A similar approach to comparing surfaee areas is us ed in the ASll/ 33)
iodine ads orption test 11here it has been found that the weight of iodine
absorbed compares 1·,itl1 their surface area. '1'he work in this thesis
looks at surface area by measuring the amount of iodine absorbed on the
surface. The problem Witll this method 11as that carbon fibres had a much
1011er specific area than carbon black for which the tes t was designed. In
order to detect the amount of iodine absorbed from an iodine s olution
by carbon fibres, extremely weak s.olutions were us ed and their rcla tive
strengths 11ere determined by using an ultra·-violet spectrophotometer.
31
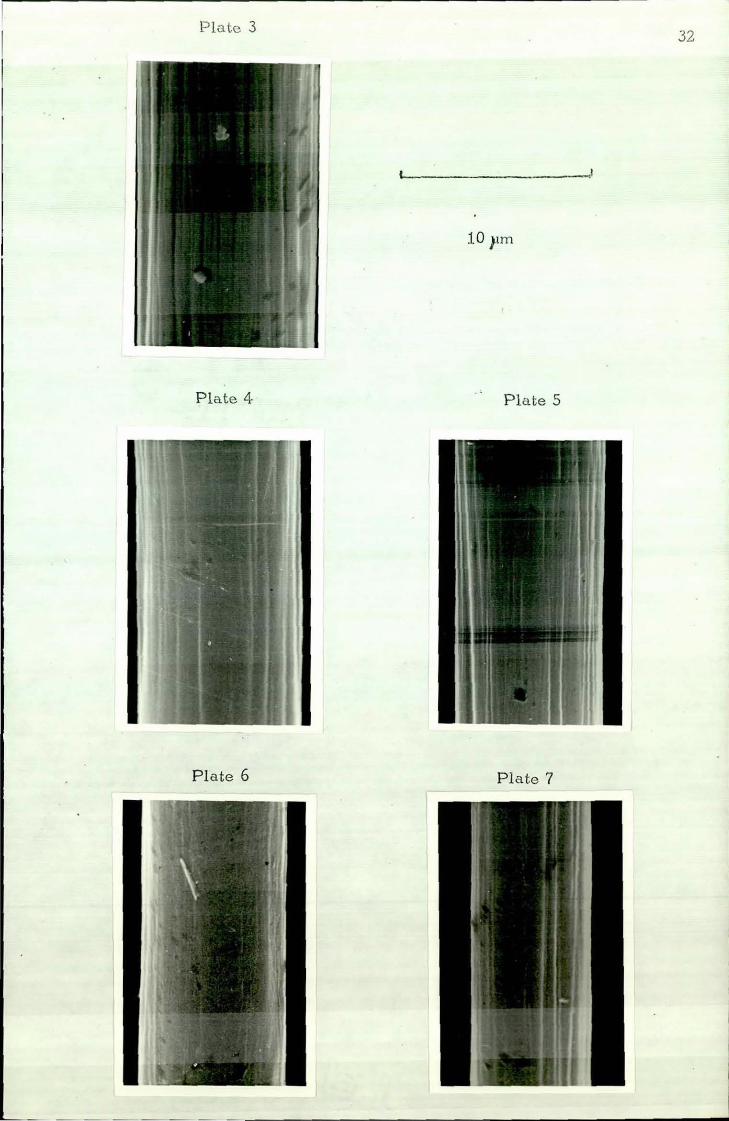
Plate 3 32
Plate 4· Plate 5
Pla te 6 Plate 7

This new technique which was extremely simple and quick to carry out,
gave reproducible results but had not previously been reported in the
literature.
'Ihe AS'!}r tes't is D 1510
ASTM D 1510-65 for Iodine Adsorption of Carbon Black
In this test specification carbon fibre was substituted for the carbon
black of the original ,test.
This stated that :-
A'dried sample, approx half a gram accurately weighed of carbon fibre
is placed in a glass vial and 250 ml of standard iodine solution is
added. The mixture is shaken vigorously for a minute. The iodine
solution is then decanted from the carbon and titrated against a
standard sodium thiosulphate solution, using starch as an ind'icator.
From this the amount of iodine absorbed can be calculated.
For carbon fibres solutions were used, an order of magnitude more , '
'dilute than for the original carbon black specification (0.005 N iodine
and 0.004 tl sodium thiosulphate). At this concentration titrations are
virtually impossible and so tile concentration of the iodine solution
before and after shaking with' carbon fibres was determined by using
spectrophotometry (as mentioned above) to determine the solution
concentrations and hence the iodine absorbed from the carbon fibres.
Results,
The amount of iodine absorbed on each grade of carbon was:- mg/gm
Grafil A HT HT-S IN HM-S
1.8 1.63 1.15
.".".
33 ,
!
,
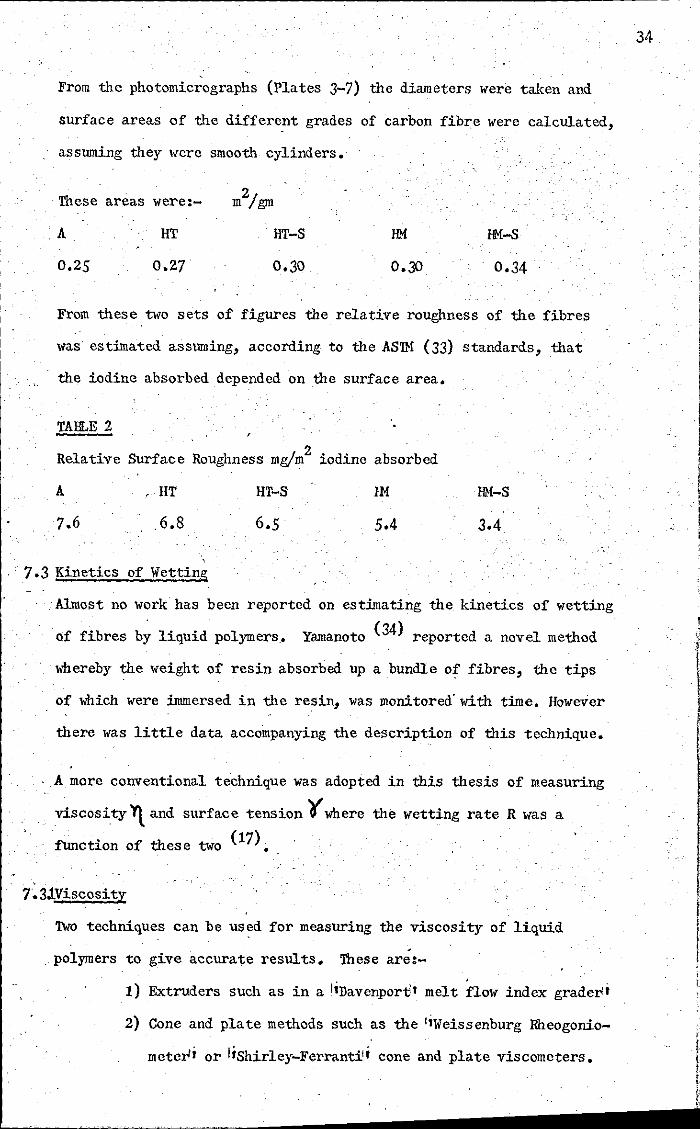
From the photomicrographs (Plates 3-7) the diameters were taken and
surface areas of the different grades of carbon fibre were calculated,
assuming they were smooth cylinders.
These areas were:-
.A
0.25
HT
0.27
2 m/{!}ll
HT-S
0.30
HM HM-8
0.30 0.34
From these two sets of figures the relative roughness of the fibres
"as estimated assuming, according to the AS1M (33) standards, that
the iodine absorbed depended on the surface area.
TABLE 2
Relative Surface Roughness mg/m2 iodine absorbed
A HT HT-S IN HM-S
7.6 .6.8 6.5 5.4
7.3 Kinetics of Wetting
;Almost no work has been reported on estimating the kinetics of wetting
cif fibres by liquid polymers. Yamanoto (34) reported a novel method
. whereby the weight of resin absorbed up a bundle of fibres, the tips
of which were immersed in the resin, was monitored" with time. However
there was little data accompanying the description of this technique.
A more conventional technique was adopted in this thesis of measuring
viscosity yt and surface tension '(where the wetting rate R was a
function of these two (17).
7.3.1.Viscosity
Two techniques can be used for measuring the viscosity of liquid
. polymers to give accurate results. These are:-
1) Extruders such as in a liDavenport l melt flow index grader'
2) Cone and plate methods such as the liWeissenburg Rheogonio
meteri' or I;Shirley-Ferrant:il i cone and plate viscometers.
34
l !
I .1 :1
I I I
I I

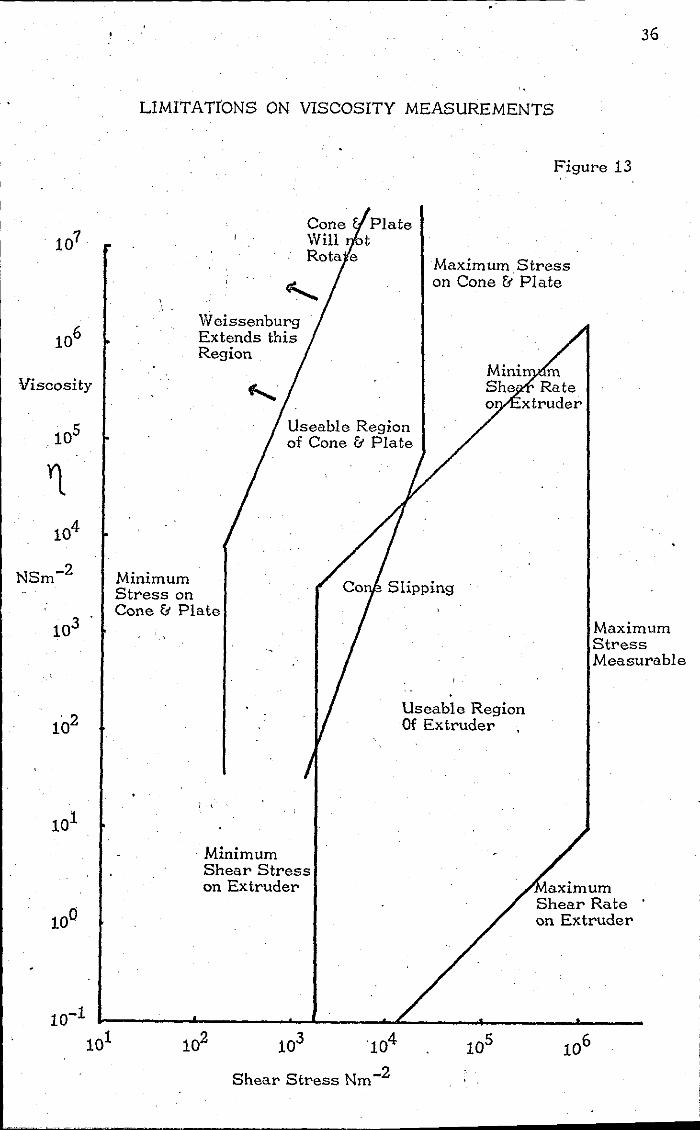
Figure 13 (35) shows the limitations for liquid polymers of the two
types of viscometer on viscosity measurements. In any real situation
where fibres are being wetted by liquid polymers, the polymers would
be under low shear and hence the cone and plate type viscometers
would be more useful in measuring viscosity in this area •
. The Weissenburg Ifueogoniometer is more accurate over the range of
interest than the Shirley-Ferranti instrument, and since it was
available for the authorl1s use, all the viscosity measurements for
liquid thermoset·,: polymers were taken on this instrument. Appendix
2 describes this instruwent and the way in which viscosities can be
measured over.a range of shear stresses.
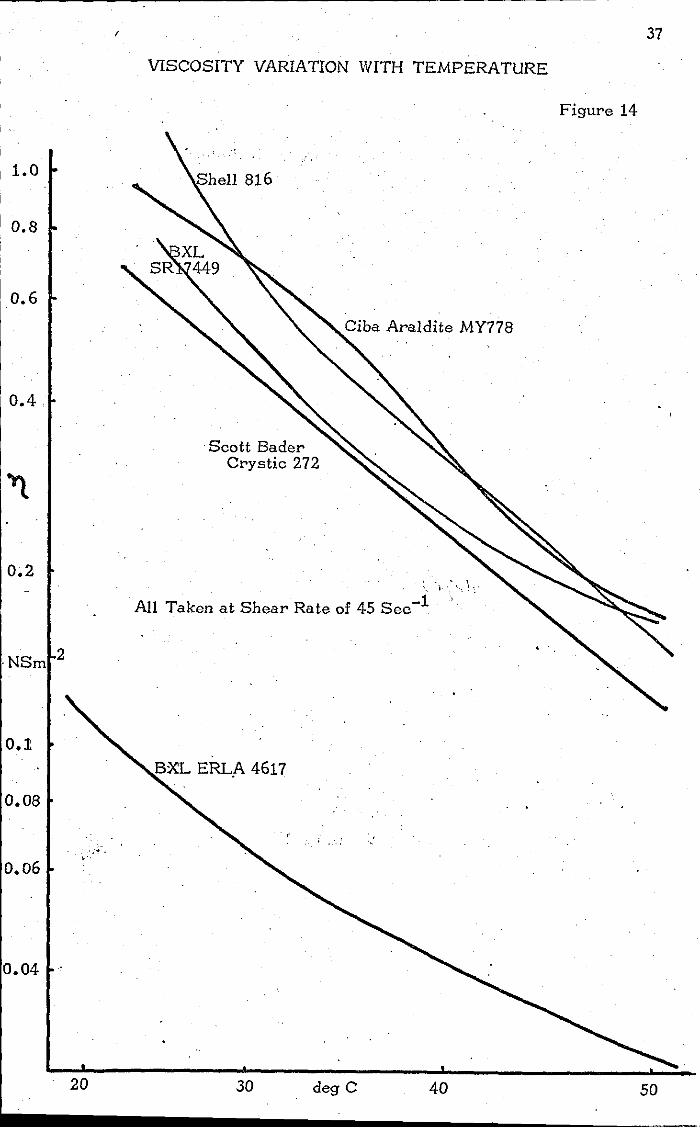
The temperature of thermoset resins affects their viscosity, IJlich
o 6 0 therefore was measured from 23 C to 0 C. 1.his was the temperature
range of the instrument used. . Figure 14 shows this variation. A
comparison between polymers was made at room temperature. A shear
-1 rate of 45 sec was selected, corresponding to the lowest shear
rate consistent with.reproducible results for all the thermoset polymers .
. for the comparison. A standard shear rate was necessary because the
polymers!i viscositiesvaried with shear rate by d~ffl:ring amounts.
Results
Resin
Araldite MY 778/HY 956 Epoxy
Shell 816/TET Epoxy
BXL ERLA 4617 Epoxy
BXL·SR 17449 Polyester
Scott Bader Crystic 272 Polyester
Viscosity NS/m2 at Room Tem~ (230 C) (at a shear rate of 45 sec- )
1.00
0.85
0.075
0.65
0.55
, .
35
Viscosity
NSm-2
.' 36
LIMITATrONS ON VISCOSITY MEASUREMENTS
Weissenburg Extends this Region
Plate Will t Rota e
Useable Region of Cone <1 Plate
Minimum Stress on Cone <1 Plate
Figure 13
Maximum Stress on Cone <1 Plate
Mini She Rate
xtruder
Maximum Stress Measurable
Useable Region Of Extruder
; ,
Minimum Shear Stress on Extruder
Shear Stress Nm-2
aximum Shear Rate on Extruder
I 1.0
0.8
I 0.6
0.4
0.2
2 ·NSm
0.1
0.08
0.06
0.04
I
VISCOSITY VARIATION WITH TEMPERATURE
Ciba Araldite MY778
. Scott BadeI' Crystic 272
. , \ \- . I,. ~,.
All Taken at Shear Rate of 45 Sec-1
deg C 40
37
Figure 14
50
, .
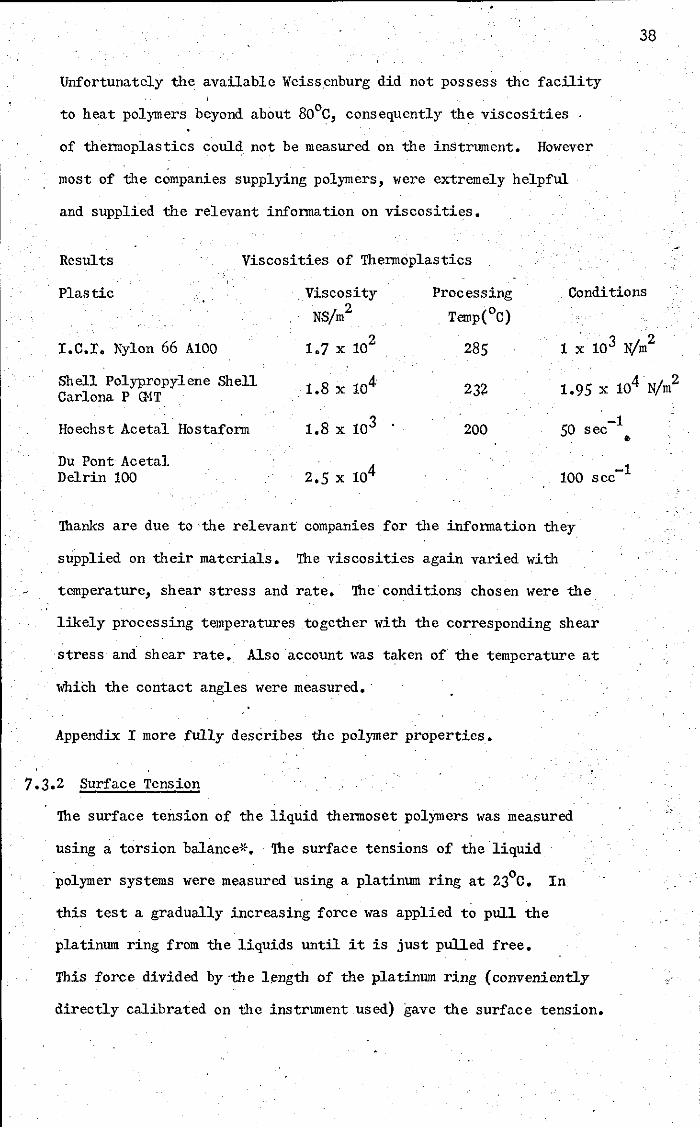
Unfortunately the available Weissenburg did not possess the facility
to heat polymers beyond about 80oC, consequently the viscosities '
of thermoplastics could not be measured on the inStrument. However
most of the companies supplying polymers, were extremely helpful
and supplied the relevant information on viscosities.
Results Viscosities of Thermoplastics
38
Plastic , Viscosity Processing Conditions
NS/m2 Temp(oC)
2 285 1 103 N/m2
1.7 x 10 x I.c.r. Nylon 66 Al00
Shell Polypropylene Shell Carlona P (}IT 1.8 x 10⁴ 232 1.95 x 10⁴ N/m
2
1.8 x 10³ 200 50 -1 sec • Hoechst Acetal Hostaform
Du Pont Acetal Delrin 100 2.5 x 10⁴ 100 -1
'!hanks are due to the relevant companies for the information they
supplied on their materials. The viscosities again varied with
temperature, shear stress and rate. '!he'conditions chosen were the
sec
likely processing temperatures together with the corresponding shear
stress and shear rate. Also account was taken of the temperature at
whiCh the contact angles were measured. '
Appendix I more fully describes the polymer properties.
7.3.2 Surface Tension
'!he surface tension of the liquid thermoset polymers was measured
using a torsion balance*. The surface tensions of the liquid
polymer systems were measured using a platinum ring at 230 C. In
this test a gradually increasing force was applied to pull the
platinum ring from the liquids until it is just pulled free.
This force divided by 'the length of the platinum ring (conveniently
directly calibrated on the instrument used) gave the surface tension.
I I
I

I
For the thermoplastics, again no 'suitable equipment was available
for measuring their surface tension at elevated temperatures. However
from manufacturers' manuals a·certain amount
Results
Polymers
Crystic 272
IlXL SR 17449
Shell 816/TET
Ciba MY 778/HY 956
IlXL ERLA 4617
I.C.I. Nylon 66
Sh~ll Polypropylene
Surface Tension N/m
0.0370
0.0390
·0.0400
0.0397
0.0462
0.0354
0.0202
of information was
Temperature
23
23
23
23
23
285
222
gained.
°c
. *White Electrical Instrument Ltd Direct Reading Torsion Balance.
7.3.3 Wetting Rate
The wett,ing rate R of the polymers was then found from the equation
(17) •
R=C(. •.••••..••••. (10)
However four of the tilermoset polymers cure at room temperature, and
the time during which they could flow after mixing the components
together was measured (Pot· Life). This was carried out by noting
the temperature with time of a fixed amount (1 ml) of the curing
polymer insulated from the environment. Generally when the temperature
climbed to a maximum, the polymer would'no longer flow. Although
this is not directly relevant to the wetting rate, a short pot life
might hinder the wetting out of the fibres.
39
40
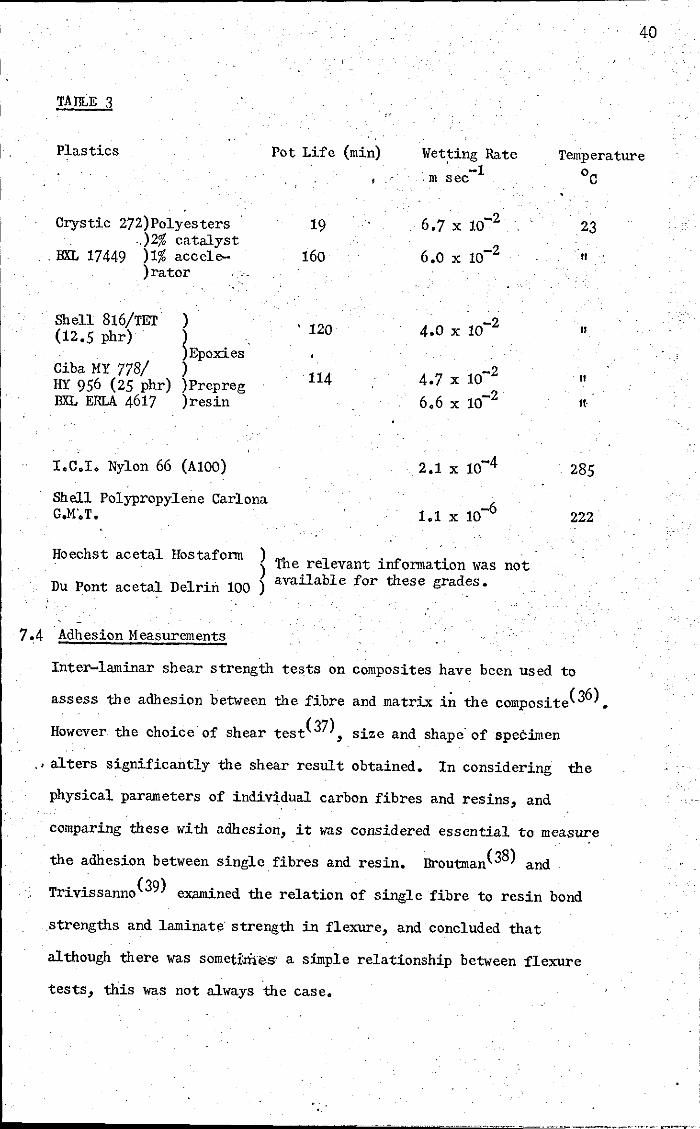
TAIlLE 3
Plastics Pot Life (min) Wet~ing Rate Temperature -1 ,m sec
Crystic 272) Polyesters 19 6' -2 .7 x 10 ,.)2% catalyst
6 -2 . BXL 17449 )1% accele- 160 .0 x 10 )rator
Shell 816/TET ) 120
' -2 (12.5 phr) ) 4.0 x 10
Ciba MY 778/ ) Epoxies )
114 -2 Hr 956 (25 phr) )Prepreg 4.7 x 10 BXL ERLA 4617 )resin 6.6 x 10⁻²
I.C.I. Nylon 66 (AI00)
Shell Polypropylene Carlona G.M'.T. 1 1 10-6 • x
Hoechst acetal Hostaform
Du Pont acetal Delrin 100
7 ~4 'Adhesion Measurements
) The relevant information was not ~ available for these grades.
°c
23
"
"
" ft·
285
222
Inter-laminar shear strength tests on composites have been used to
assess the adhesion between the fibre and matrix in the composite(36).
However the choice of shear test(37), size and shape'of specimen
.' alters significantly the shear result obtained. In considering the
physical parameters of individual carbon fibres and resins, and
, comparing these with adhesion, it was considered essential to measuz:e
the adhesion between single fibres and resin. Broutman(38) and
Trivissanno(39) examined the relation of single fibre to resin bond
strengths and laminate' strength in flexure, and concluded that
although there was sometimes' a simple relationship between flexure
tests, this was not always the case.
I.. _______________ ~~~"'.""' .. , ... ,-.... -,
!
i
"-I
I
I
I
•
The measurement of single carbon fibre to plastic adhesion was difficult
because of their small fibre diameter, brittle nature and opacity.
there has been no published work on'measurements of the adhesion between
single carbon fibres and plastics, because of which the author applied
the established techniques for glass fibres, to carbon fibres. these
techniques include pulling single fibres out of resin discs; and
embedding single fibres in specially shaped resin blocks which are then
compressed.
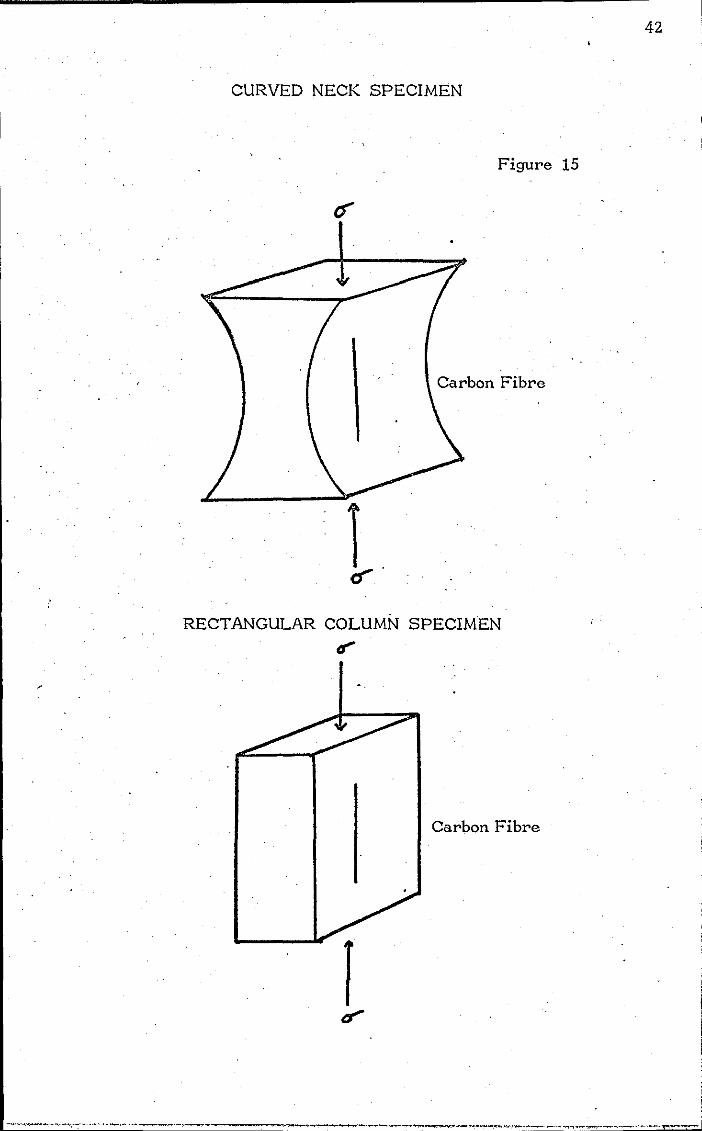
7.4.1 Shaped Cast Resin Specimens
Figure 15 shows the curved neck and rectangular column resin block
specimens in which the single fibres were embedded for compression
tests to give adhesion valves. For glass fibres a single fibre is
embedded in a block of resin, the faces are polished and the block
compressed in-the manner shown in the diagram. Since glass fibres
are transparent nothing can be seen in the resin block. When the
interface between fibre and resin fails the fibre can be readily seen.
Bond strength tests to fail the interface in shear, adopt the
rectangular block specimen with the fibre embedded in the leng'th of \
_ \.. the block. A curved neck specimen can fail,\the i~terface in a
tensile manner. The shear bond strength 1: generally quoted in adhesion
work can be estimated, knowing the average axial '-tre".~;'t () in
the resin block when the fibre interface fails.
0. , 2.5 er"
Broutman(38) quotes the 2.5 figure and referred to Edelmanfi s work(40)
shOldng the stress concentrations round embedded fibres.
Unfortunately with carbon fibres the technique was found not to work.
Carbon fibres are opaque and can be seen even when bonded to the
resin. Broutman acknowledges the difficulty with opaque fibres and
41
CURVED NECK SPECIMEN
Figure 15
Carbon Fibre
RECTANGULAR COLUMN SPECIMEN (J'
Carbon Fibre
42
suggests illuminating the fibres lvith a microscope lamp. Broutmarlis
work with boron fibres revealed highly reflective regions when the
interface failed. However with carbon fibres these were not apparent
in polarised or unpolarised light. Although exhaustively tested, this
technique did not seem to be suitable for measuring the adhesion between
carbon fibres and plastics.
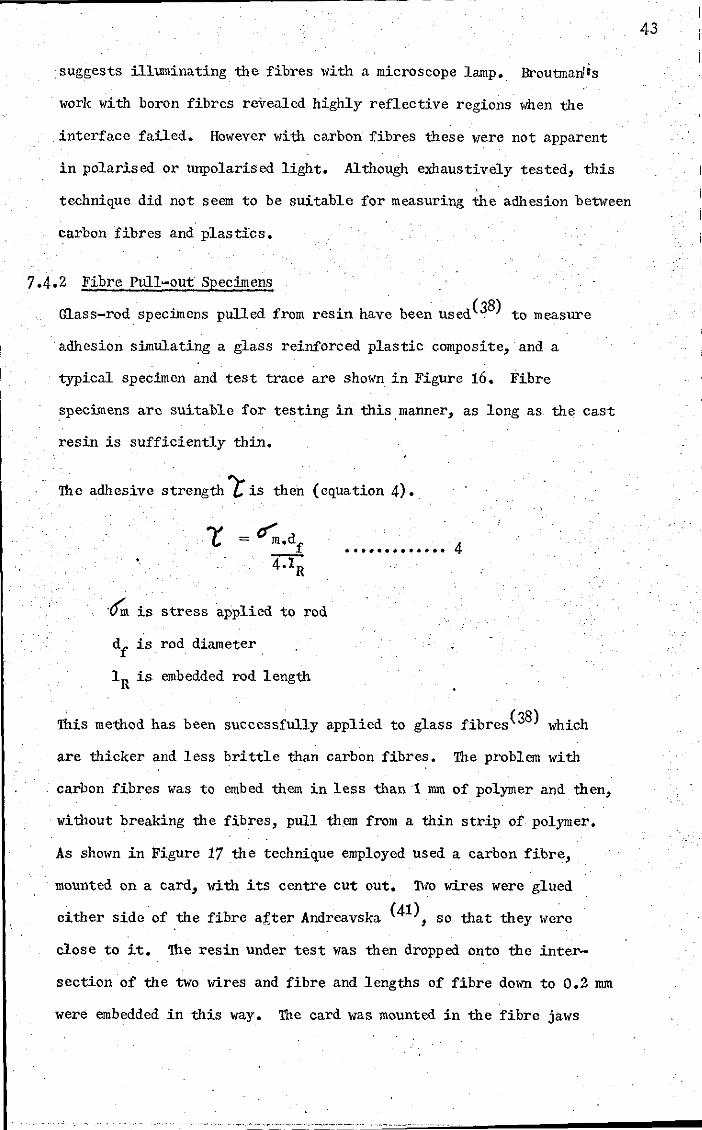
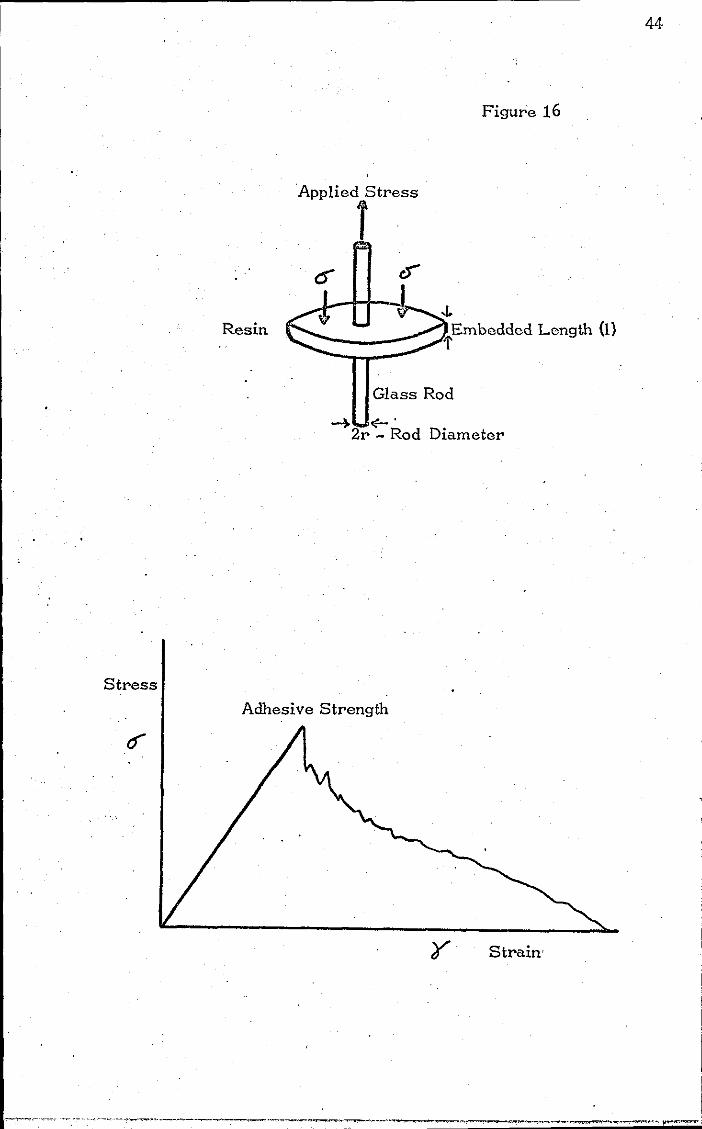
7.4.2 Fibre Pull-out· Specimens
Glass-rod specimens pulled from resin have been used(38) to measure
adhesion simulating a glass reinforced plastic composite, and a
typical specimen and test trace are shown in Figure 16. Fibre
specimens are suitable for testing in this manner, as long as the cast . . resin is sufficiently thin.
'!he adhesive strength 1: is then (equation 4) •.
= ~.d f • • •••• •• • • • •• 4
4. IR
·cfnt is stress applied to rod
df is rod diameter
lR is embedded rod length
'!his method has been successfully applied to glass fibres(38) which
are thicker and less brittle than carbon fibres. '!he problem with
carbon fibres was to embed them in less than ·1 mm of polymer and then,
without breaking the fibres, pull th.em from a thin strip of polymer.
As shOlm in Figure 17 the technique employed used a carbon fibre,
mounted on a card, with its centre cut out. 1\,0 wires were glued
either side·of the fibre after Andreavska (41), so that they were
close to it. 'lhe resin under test was then dropped onto the inter-
section of the two wires and fibre and lengths of fibre down to 0.2 mm
were embedded in this way. '!he card was mounted in the fibre jaws
43
-- _. ---" .................. ,. "-'===~------........
Stress
Resin
Applied Stress
1
Figure 16
-J. Embedded Length (l)
-'I'
Glass Rod
-4 <r' 2r - Rod Diameter
Adhesive Strength
Strain'
44

~ ~- ~-------------------:-----------
45
CARD MOUNTED CARBON FIBRE FOR ADHESION TEST
Figure 17
Glue i
L-_+-rCarbon Fibre
'8
esin Under Test
Wires
Cad
I ,_=--~.,....._L~,..., .... ,~ ..... ,"~~~...".""_ ... ~,~ .. .,,.,_ .. ~..,..,..-.t>.. !
of an Instron, the fibre broken at A, the card cut at D and tested
in the Instron Tensile Testing Machine~ giving a graph as shmffi
in Figure 16. The load at which the fibre pulled out was taken
from the' graph and knowing the embedded length,thebond strength
of the fibres could be calculated in the resin under test.
Results , ,
All five grades of Grafil (A~~ HT;' IIT-S, lM;' flM-S) were tested, with
BXLSR 17449 polyester resin; however only lM type fibre would
pull-out from the resin., The other fibres were either not strong
enough or were embedded in too thick a strip of resin to give a
lipull-out!i test.
The variation in measured values was ± 50%, so about ten samples
were tested with each resin to lM fibre, yielding the following results:-
TAIlLE 4
46
BXL Scott Bader Crystic 272
Shell Ciba Araldite SR J7449 Epikote 816/TET M778/HY 956
Bond Strength to lM Fibre 2
3.69 Mn/m
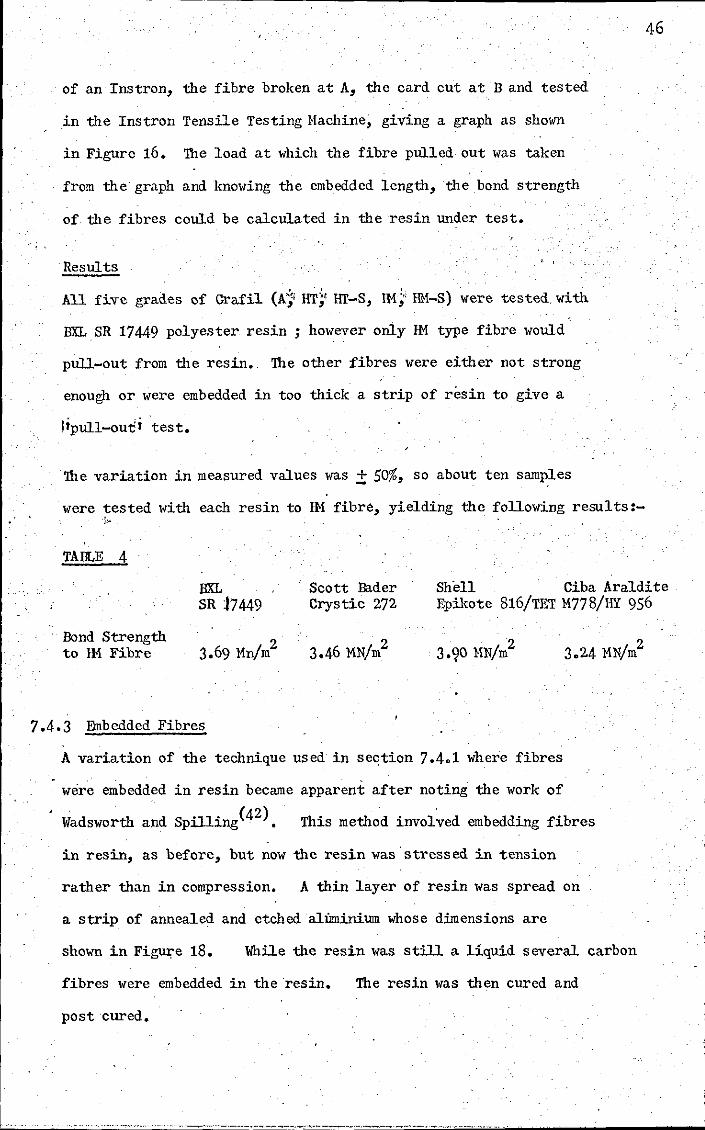
7.4.3 Embedded Fibres
2 3.46 MN/m 2 3.90 MN/m
2 3.24 MN/m
A variation of the technique used in section 7.4.1 where fibres
were embedded in resin became apparent after noting the work of
Wadsworth and Spilling(42). This method involved embedding fibres
in resin, as before, but now the resin was 'stressed in tension
rather than in compression. A thin layer of resin was spread on
a strip of annealed and etchedalliminium whose dimensions are
shown in Figure 18. lI'hile the resin was still a liquid several carbon
fibres Ivere embedded in the 'resin. The resin was then cured and
post cured.
, , i
I
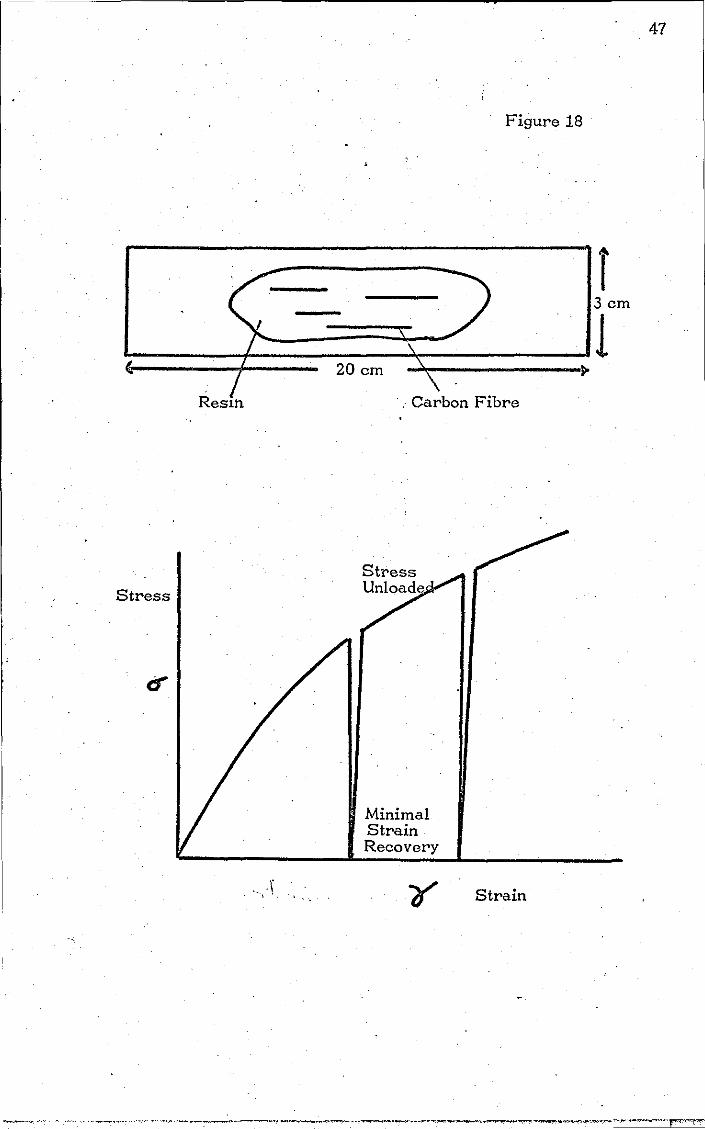
Figure 18
r 3cm
~==t::.===-:2~O cm~======:.l ResIh
Stress
.. Carbon Fibre
Minimal Strain Recovery
Strain
47
Rolled aluminium sheet approximately 2 mm thick annealed for
2 hours at 500oC, provided a material which would extend plastically
with little elastic recovery after straining according to the graph
in Figure 18. With such a material a strain was imposed, on the layer
of resin and the embedded fibres by an !iInstroni tensile testing
machine. The resin fibre composite which adhered to the aluminium
strip was strained and inspected under a microscope to observe the
failure and debonding behaviour of the composite. The extension
of the strip was noted using a travelling microscope on scribed marks.
In practice the ,Ycom~tites'l on the aluminium were extended in
0.1% strain stages and the carbon fibresri ~nds observed in the
, microscope at each stage to see when they debonded from the resin.'
When the fibres debonded, knowing the extension of the resin
adhesive at failure, Younglis Modulus of resin and hence tensile
stress in the resin, the stress at which the fibre debonded could
be calculated. The failure extension was taken when some part, of
I , every fibre embedded in the resin had debonded. Generally this
occurred in every fibre at the same incremental extension of
the resin. The debonding axial stress in the resin was taken as
the adhesive strength, of the resin to the fibre.
The average of three aluminium strips with between 3 and 6 fibres
per strip gave reasonably consistent results. It should be noted
that the preparation and testing of the strips was a time-consuming
process and any further effort to reduce the error would have
lengthened unnecessarily the testing time. The results obtained
showed significant differences, sufficient for the comparison
to physical parameters of the resin and fibre.
48

49
TAIlLE 5
Adhesion as· measured in MN/m2
Carbon Fibre A HT-S HT IM-S HM
Resin
BXL SR 17449 26.9 24.0 16.3 15.2 11.7
Crystic 272 58.6 31.3 21.0 24.5 12.1
Shell Epikote 816/TET 2~.4 25.5 22.0 13.8 10.9
Ciba Araldi te MY 778/HY 956 32.7 31.5 25.6 18.7 10.1
8. DISCUSSION OF RESULTS
In discussing the 1;ork only those polymers whose adhesion, contact angle
and wetting rate were measured will be initially introduced. The other
polymers, notably the thermoplastics will be introduced towards the end
of the section and their possible adhesion discussed.
50
The property of the ~arbon fibres measured was surface area/surface activity
as in the ASTM test method D1S10-6S. This was correlated to the scanning
electron microscope photographs of the fibres. These photographs showed
that A grade fibres were the roughest, HT and HT-S next and BM and BM-S
the smoothest. Figure 19 completes the picture in comparing surface
roughness with adhesion. Both tests Sh01; how the additional heat treatment
BM grade fibres receive, compared to HT fibres and HT fibres compared to A
fibres smoothes their surface. This smoothing phenomena corresponds
with a steady" decline in the adhesive strength of carbon fibres to
polymers, and,a steady decline in the variation in adhesive strength between ·it
polymers to a specific grade of carbon fibres.
The iodine absorption test revealed some interesting phenomena concerning
the effects of surface treatments and the resulting adhesion to the carbon
fibres. The surface treatment on BM grade fibres is far more effective
than on HT grade fibres as is also indicated in the Courtaulds Grafil
Data (Appendix"1). These treatments correspond toa greatly reduced
surface area, the greater the reduction the more the improvement in
adhesion. These treatments are believed to be a wet oxidation brought
about by a sodium hypochlorite solution(43,44). This thesis
demonstrates that the surface treatment gives the fibres not only the"
expected etching(43,44) but also a surface cleaning effect as shown by
the reduced surface area. Gill(1) also enquires whether these surfaces
treatments, do in fact, clean as well as etch the surface.

! I i I j
I
0.8.
0.7
Surface Roughness.
0.6 mg Iodine Absorbed 2 Area in.m
0.5
0.4
0.3
I I Range of Adhesion between Resins_.and a Grade of Carbon Fibres
HM Grade le f
10
t HT Grade
e
HM-S Grade I o.
HT-S Grade o . «. t
20 230 Adhesive Strength MNm-
< :» ~ :» o-'J .... 0 Z
0 'TJ (fl C ;:0 'TJ :»
J 0 [Tl
;:0' 0 C <;) ::r: z [Tl (fl (fl
::E >-< o-'J ::r: :» Cl ::r: [Tl (fl .... 0
'TJ Z .... to C ~ CD
I-' \D en
40 I-'
The surface of a solid in an adhesive joint could have t,,,o conflicting
effects, a rough surface would be eXpected to key in \Yell to an adhesive,
and bond well, but if the rough asperities are too sharp, then they will
act as stress concentrators and fail the bond through crack propagation.
These effects are apparent in carbon fibres ~lere as the overall surface
is smoothed by heat treatment and the fibre surface looses its ability
52
to key with the resin, the adhesion falls,-off. However a surface treatment
on any fibre improves the adhesion by removing the surface debris which
can initiate a crack and cause premature failure. This surface debris
presumably arises as a result of the heat treatment on the fibres. More
debris arises with the heat treatment used on the IM grade, giving an "
opportunity for greater improvement in adhesion.
The most interesting phenomenum measured was the decreasing contact
angles between carbon fibres and liqUid polymers resulting in improved adhesion.
On 'Figure 20 contact angles have been plotted as cos~, where increasing
co~ corresponds to decreaSing contact angles and improved wetting.
If accurate and appropriate contact angle values can be obtained then it
could be possible to establish a quality control test on carbon fibres to
estimate the likely adhesion of a particular grade, as well as the effect-
iveness of any treatments used to improve adhesion.
In considering Figure 20 there are obvious inconsistent data: note H-M-S
fibre with the Araldite resin and HT fibre with the Sh,ell resin. However
it can be deduced from the graph that a larger cos~ (smaller'9") of a resin
on a fibre will give better adhesion. The variation in contact angle on a,
fibre seems more critically to reflect adhesion for carbon fibres which
have poor adhesion to polymers. There is a good correlation between
adhesion and contact angles for one type of polymer (e g polyester resins)
and one'grade of carbon fibre.

1 1 I
I 1
1
I
Cos 9--0.9
x. - HM Grade Fibre t:::.. - HM-S 11 11
+ - HT 11 11
t:I - HT -S 11 11 O-A 11 !I
A - Ciba Resin S - Shell 11
0.8
C· - Scott Bader Resi B - BXL Resin
0.7
, , I
~
Et ,)( ,
, )( , I
A Xs
"" X""
"
10
-. ,.. ,.. S B ... ... 4 $' -~ ,. ,
A A
'" , , ~
",.
;'
~ ,
- - ----_ ... -~~ -.. -.. -... -.. .... -- - A C .. S ,.. C B iJ ... 9 , 4 .. G ... -... --A .. , ...
+ ,-... .. ... ,. , ... ,. ,. C , , Q
-... ",.
",. ,.
20 ~O Adhesive Strength MNm-
40
,~-.-----.....;~~---------~----------------------------------------
"
Measurement of contact angles was difficult and time-consuming and
the photographs obtained could be interpreted to give a, range of contact
angle values. Yanlamoto (34) has measured contact angles of polymers on
carbon fibres, but the photographs he produces clearly give contact
54
angles considerably smaller than the values he attributed to the photographs.
It is important to realise, as did Yarnarnoto, the difficulty in measuring
and recording sensible and appropriate contact angle values. However
dispite this critical look at contact angles, it was thought that the
results obtained were sensible partly, because of the critical approach.
Yamamoto gives results relating contact angles tointer-Iaminear shear
strength which only very roughly correlate. However, as explained
previously, there is not a good correlation between adhesion and inter
lamin<l.1" shear strength and there is no scientific basis to expect 'contact
angles to directly relate to inter-Iaminar shear strength.
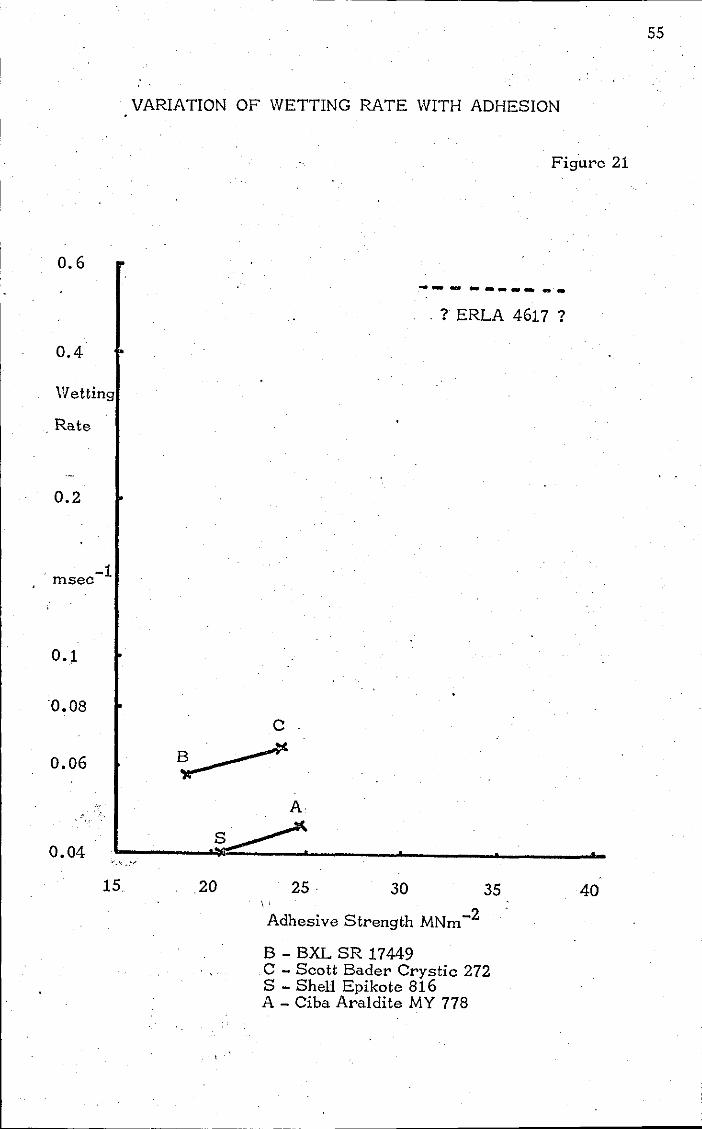
Figure 21 depicts the wetting rate of the polymers, against carbon fibre
adhesion to those polymers, these being an average for all the carbon
fibre grades. The \,etting rate goes some way tOl,ards explaining the
variation between different grades of the same polymers, (polyester or
epoxy resins). A comparison of Figure 20 showing wetting rate variation
against adhesiony with Figure 19 showing contact angle variation against
adhesion explains the variation of adhesion between similar polymers
. as detected by the contact angles, according to the wetting rate of the
polymer.
For Exrunple
The better adhesion of polyester resin C, over B, cor~elates well with
polyester resinC's faster wetting rate: Similarly for the epoxy resins.
However although the polyester resins tested had'a faster wetting rate,
than the epoxy resins, the adhesion was no better. This reflects the ,
different nature of the two polymers and the way in which they bond to
the fibres.
0.6
0.4
Wetting
. Rate
0.2
. -1 msee
0.08
VARIATION OF WETTING RATE WITH ADHESION
Figure 21
.----------. ? ERLA 4617 ?
35 40
\ ~dhesive Strength MNm-2
B - BXL SR 17449 C - Seott Bader Crystie 272 S - Shell Epikote 816 A - Ciba Araldite MY 778
55

56
The adhesion values measured by the two different lnethods showed large
differences for RH·fibre. The test m~thod with the embedded fibre gave .' a bond strength about 3.8 times that measured by pulling the HM fibre
from the resin. This partly was expected, and found by L.J.Broutman(37).
An. explanation for this is that the length of fibre which adhesivelY.fails
in the fibre pull-out ~ethod of adhesion test(7.4. 2) was 50 times the length
which adhesively fails in the embedded fibres adhesion test (7.4.3).
The failed length here is the short section at the end of the I"hole
embedded ;fibre which visibly debonds. A .'smaller area of adhesion under
test, will generally give pigher bond strenths because in a large area,
as~one point in the bond fails the stress in the rest of the bond increases,
leading to more bond failures and even greater stress on the remaining bonded
area. Obviously a larger bonded area is more subject to premature failure
because of this effect.
The important point about the two sets of results is that they agree with
'!M",type fibre having a similar bond strength to all the resins. This . , '.' reinforces the case for stating that the technique of measuring adhesion
by stressing aluminium (with carbon fibres bonded to polymers on the
aiuminium) is a relevant single fibre to polymer adhesion test, for
comparative work.
The results indicate that epoxy resin adhered no better .to carbon fibres
than polyester resin. This was not the case with glass fibres (45) where
epoxy bonded better than polyester, tested by fibre pull-out or embedding
of fibres in resin. The reason for this is not clear, but probably reflects
that neither bond particularly well to carbon' fibres. The IInstronl trace .. of the fibre pull-out test from epoxy resin as in ¥!gu~e-16 showed a sharp
drop of about 30% of the peaK load, and then a residual load due to
friction as RH carbon fibre was pulled from epoxy resin. With polyester
resin there lVas no sharp fall in load when the bond failed. Instead, the
! t ~ t i
I I
f c··= .. _=--·=-·· =-.. .cc" ~===-~ ... ~ ... =--="'='--c .. ~ ... ~ .. ,.=-.. =-.= ... =-...... _"'_ ....... ~ .. ~. ~~ ____________________ -'-J
57
load on the trace gradually dropped as the fibre was pulled from the resin.
, .. ' This indicates that a significant co~tribution to the adhesion between
: carbon fibres and epoxy resin is due to phYSical/chemical bonding. With
polyester resins the adheSon to carbon fibres is almost entirely due to
friction. Polyester resins shrink up to 7% by volume on curing, which
gives their frictional adhesion, .whereas epoxy resins shrink only 1% on
curing.
In a composite where the fibre volume is about 60% the resin is not
encapsulating the fibres, but just filling the spaces in between them.
'As polyester resin cures in a high fibre volume fraction composite, it
would shrink away from the fibres.giving rise to poor adhesion. Epoxy
resin however in a similar high volume fraction composite would not
shrink away from the fibres, but give composit;s with fibres well-bonded
to the matrix. This different behaviour explains why, although polyester
. and epoxy resins have similar bond strengths to carbon fibres, as found
in this thesis, do not give composites with similar properties. Work
on glass fibres by Vasta and zronar(46) also discussed this phenomenum
and devised some interesting tests to high-light it. In these tests they
:compared the bond strengths of glass rods pulled from cast resin and
glass tubes with resin rods bonded inside them. In the former the resin
shrank onto the glass rod, and in the latter the resin would shrink away , . . .
from the glass tube. They then identified the relative proportion of the
adhesive strengths of glass to polyester and epoxy which could be attributed
. to friction and physical/chemical forces.
Not mentioned in the above discussion was ERLA 4617: This resin was a
prepreg resin involving a long cure cycle at elevated temperatures and
ther~fore could not easily be compared with the other room temperature
curing thermoset resin polymers. However knowing its wetting rate and
", ~contact angles on carbon fibres enables ari estimate of likely adheSohto - ,
be made.
I
I
I
I
I
I .. ". __ .. __ . ____ . ___ ~. ___ ._ .. ," .. ____ .. _____ . ________________ ,_-" ____ . . ..--"1" 1
58
The wetting ra.te of ERLA 4617 was = order of magnitude greater than
the other epoxy resins (see tigure 21). It is unlikely that the adhesion
of this resin to fibres is an order of magnitude greater, but it should
be considerably greater. The adhesion to carbon fibres assessed by contact . J ,'. ' .
a.ngles is shown in figure 22. Together the information indicates that
adhesion to HT-S, HT and A grade carbon fibres might well be greater than
with other thermoset polymers. However the adhesion of this resin to HM .
a.nd HM-S grade fibres should be of a similar order compared to the other
resins.
The contact angle variation of the thermoplastics with the various grades
of ~arbon fibres is shown :in Figure 23'. The gr~ph indicates that nylon 66
a.nd high density polyethylene do not wet carbon fibres easily. Polyacetals
wet carbon fibres much better, and polypropylene is intermediate. IDI
grade and A show the most variation of contact.angles with the thermoplastics.
The wetting rates of the thermoplastics indicate that nylon 66 could
. compensate its high contact angles with faster wetting, especiallY on
the A, HT, HT-S and HM-S fibres where the contact angles are not excessively
high •. Polypropylene has a slow wetting rate a.nd this would reduce its
adhesion below that indicated by contact angles alon~. The polyacetals
pave intermediate viscosities, probablY leading to intermediate wetting
rates, however this will not alter the likely adhesion performance of
polyacetals as'assessed by contact angles. In general it might be expected ,
that pOlyacetals would bond best of the tested thermoplastics to carbon
fibres, especially to the HM ,and HM-S grades of fibre which are generally
difficult to adhere to. This is because polyacetals have neither a high
contact angle nor poor wetting rate with carbon fibres.
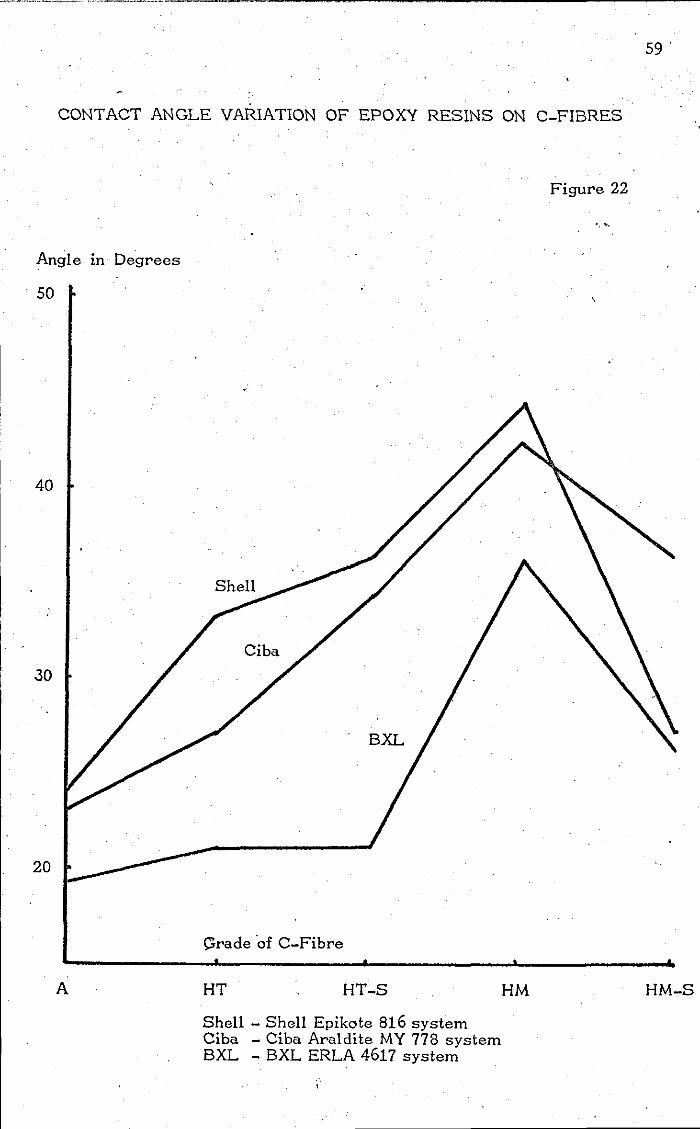
CONTACT ANGLE VARIATION OF EPOXY RESINS ON C-FIBRES
Angle in Degrees
50
40
30
20
A
Crade 'of C-Fibre
HT HT-S
Shell - Shell Epikote 816 system Ciba - Ciba Araldite MY 778 system BXL - BXL ERLA 4617 system
Figure 22
" '1',
HM
59 .
HM-S
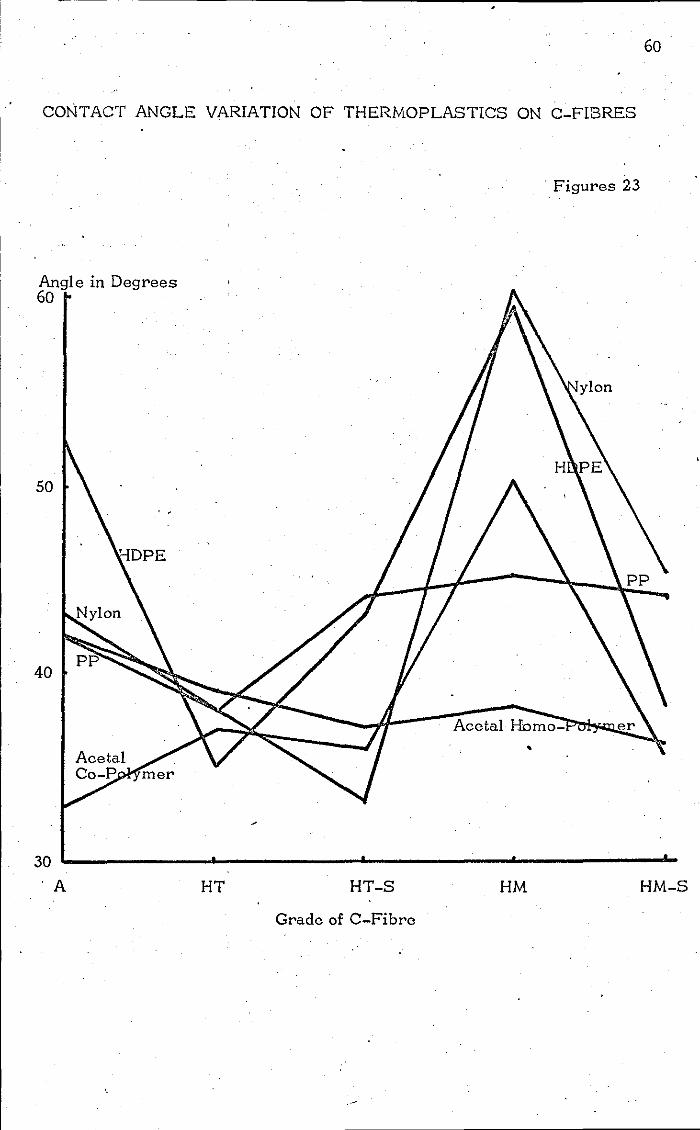
60
CONTACT ANGLE VARIATION OF THERMOPLASTICS ON C-FISRES
.! . Figures 23
Angle in Degrees 60
50
40
30 L-__________ ~ ________ ~ __________ ~ __________ ~
"A HT HT-S HM HM-S
Grade of C-Fihre
--------.:;-::-
The original work on contact angles was in support of an investigation
at British Railfs Plastic Development Unit of adhesion to carbon fibres
when they :.r~force thermoplastics. It was expected that those combi-
nations which appeared to. adhere best would perform in a superior manner.
This was predicted by the contact angle measurements mentioned above, I
and later confirmed. It was found that acetal plastics reinforced by
61
carbon' fibres demonstrated sup'erior wear properties, as predicted by ~bove.
, .
, ! , ,
! i 1 j
I ! . t' I: i
I , I
:i
i.
PART III
9. TOUGHNESS
9.1 Introduction
The effect of adhesion on the toughness of carbon fibre composites
has been discussed briefly in Section 4.3. Although little work
had at the time been conducted on the effect of adhesion on toughness,
Harris et alia (47) had 'discussed its connection with inter-laminar
shear strength (~d adhesion).
Many,authors who had been investigating adhesion in carbon-fibre
composites did not measure the toughness of their modified composites.
Their work is reviewed in the next section but it should be realised
that toughness 'vas not considered to be a problem ",hen the carbon
fibres were first being produced. Consequently for this thesis a
study was made of the treatments ',hich had been expected to improve
adhesion of resins to carbon fibres with a view to selecting and
assessing their suitability for improving tnughness. In addition a
revievl \Vas undertaken, of those improvements in toughness '"hich had
been achieved in glass-fibre reinforced-plastic technology; again
with the purpose of assessing the successful techniques and adapting
them to carbon fibre composites. I'lork on toughness in all materials
was considered in order to plana coherent investigation of toughness
in carbon fibre composites.
Toughness testing is currently being developed from simple pendulum
tests to fracture toughness techniques which give accurate, and.
applicable results. A separate section in this thesis is devoted
to a revie,,, of fracture toughness testing, applied to carbon-fibre
composites, as they are relatively new materials for which testing
techniques are only just being developed.
9.2 Fibre Surface Treatments
The follo\Ving survey selected from the literature the relevant
information ",·hich could be significant in research on the toughness
• of carbon-fibre composites.
62
Goan and Prosen (36 ) theorised that carboxyl and phenolic groups
on the surface of oxidised carbon fibres should be able to react
with isocyanate groups in a urethane prepolymer coating on a carbon
fibre. Other isocyanate groups in the coating should be
able to couple with the resin matrix. The polyisocyanates \,ould act
as bridging or coupling agents between the polymer and the resin.
When composites \"ere made by Goan IUld Prosen to investigate this theory
the composites e~libited no significant improvements over composites
made from fibres, which had not been treated with polyurethane
prepolymer. The significant improvements expected were in inter-
laminar shear strength. They also investigated other fibre
coatings in anticipation of improved inter-laminar shear strength
(I.L.S.S) • These coatings were nylon, which gave no improvement
in I.L.S.S., and the glass size A-llOO silane (gamma-aminopropyl
triethoxysila!,e) which gave a slightly improved I .L. S.S.
Herrick(31) hOliever treated oxidiSed carbon fibres with AlIOO silane
and found no improvement in I.L.S.S. of the resulting composite.
Herrick also tried other fibre treatments both· for adhesion and
improvement in I.L.S.S. of the resultant composites. Out of a.
series of ~mines investigated by him only ~ethylenet!iamine (DETA)
gave any evidence of adhesion to carbon fibres. .
-Broutman(4S) listed the roles of coatings which have been applied to
glass fibres:-
(a) Coupling agents which increase the adhesive strength of the
glass-polymer interface.
(b) Coupling agents which provide low modulus, flexible layers
at the interface.
(c) Coupling agents which promote better wetting between the
polymer matrix and the reinforcement surface.
63.
W.]. Eill,ins (48) indicated'the concepts to be understood when
developing an effective treatment with lqhich to toughen carbon
fibre composites. He visualised a small crack forming in a composite
under stress, at a void orinclusion. The crack advances towards
and perpendicular to a fibre surface. If it is assumed that there
is no energy spreading mechanism and that the resin is bonded to
the fibre surface, then the full force of the spreading of the crack
surfaces as it advances ia concentrated at the crack tip. Any
work mechanism distorting or aligning the resin tliat may have been
possible in the region be~yeen the fibres caunot t~e place at the
interface because of the restraining influence of the bond to the
fibres. The crack impacts the fibre and penetrates it. A brittle
fracture is the result. Consider' tough laminates of glass-
reinforced plastics, they are asswned to have faiied lqhen the fibres
are visible, or the cracks round them are visible. Since all
cracks and delaminations greater than O.SPm would be visible, the
energy absorption mechanism in these laminates must be efficient and
it is this sort of efficiency that must be developed in carbon
composites .,.
If the resin is bonded to the fibres not securely; but in a random
fashion, then the interface would either not yield or would
completely fail, depending on the area of the interface. TIns
behaviour is the energy absorption mechanism found in high
quality glass laminates. However, if the bonds to the fibre are
concentrated in g~oups, then the interface could fail in jerks,
rather like tearing a textile weave. Both these bonding arrangements
will absorb energy. However the second one lQould be more effective
at restraining further debonding. What \Qe want in an ideal surface
treatment is a bond which will bre~ progressively, when it is needed
64
,. to stop cracks propagating, but will absorb a 'c'onsiderable amount
of energy in doing so, and stop the crack propagating without
any tendency for them to start again.
Consideration of the brittle failure mechanism outlined by Eakins
'leads to an investigation of ways in which a crack can be blunted
at the fibre-polymer interface, and the interface made to absorb
energy as it is pulled alqay from the fibre. According to
Broutman (45) "CO~Pling agents can provide flexible, lw modulus
layers at the interface" and. a coupling agent with sufficient strength.
could fail in the manner described by Eakins. Such material
properties are supplied by polyurethane rubbers, I,hich were
investigated by Goan and Prosen(36) as a surface treatment for carbon
fibres. The polyurethane tried by GOa!1 and Pros en neither increased
nor decreased the adhesion to carbon fibres. However using DETA
to cure the polyurethane (recall work by Herrick\r3~) could possibly
improve the ailllesion to carbon fibres. The polyuretha!1e bonds
to the epoxy resin, according to Goan; in addition it is compatible
with epoxy resin and the two should, under the right conditions,
form a graded and intermixed interface.
lIIerrick et alia (31), discussed a flexible coating on carbon fibresto
overcome brittle fracture of composites. " lllrrick coated carbon
fibres in his work with nylon 8, but after discussing possible
toughness improvements, quoted only I.L.S.S. results, which were
uncha!1ged. Other coatings on carbon fibre were investigated by
fferrick, but none of the resulting composites were tested for impact
strength.
Trivisanno(39) IVhile investigating the effect of flexible coatings
on glass fibres in glass-reinforced plastics found"significant
. increases in fibre-resin bond strength and flexural strength .;;,
but they did not achieve a complete improvement in properties".
65 I
! !
I I I
I ,
1
!
I 1
- - ----------~-----------
His coatings were compatible "synthetic rubbers •• or polyvinyl-
butyrate" \lnlike those tried by Herrick. In this work it had
, already been decided that compatible fibre coatings would show
most promise in improving toughness.
These are the reasons why the surface treatments were developed
in the present research work, and just what its expectations were.
The blocked polyurethane rubber Adiprene IlL-16 should bond well to
the carbon fibre extended by the DETA, and to the epoxy resin by a
compatible graded matrix. Using this system,' a flexible low modulus
coating was placed at the interface to blunt cracks. It should
debond from the carbon fibres only with difficulty due to the good
adhesion, but absorb energy under deformation.
It has been mentioned how the energy absorbed at fracture is greater
when the fibres debond and pull out, rather than break. It is
useful at this stage to relate the work of Kelly(49) Il"ho shows, by
comparing,possible fracture models, just where the energy is absorbed.
Kelly compares the, fracture modes discussed by Cooper and Kelly(SO) ,
and 'Outwater and Murph/Sl). This thesis compares -,_ in addition,
the relevant work of Harris(47) and Piggott(S2) who have more recently
investigated this problem.
Cooper and !Cell/SO) state that the major amount,of work of fracture
is absorbed during fibre pull-out and matrix shear. The remainder
being derived from the elastic energy stored in the fibres, together
with the fracvure energies of the fibre and matrix.
The work to pull the fibr,es out of the matrix \1, ~s _ " i
Wp - 1., 'tm • T1". 9.[" 1 f • • •• 11 2 . '
where 'Tm is the stress resisting fibre pull out
If is the embedded fibre length
df is the fibre diameter.
66

--------------------------- -
67
Outll'ater and Murphy suggested that the major portion of the work
involved in fracture is due to debonding of the fibre. If one can
imagine the stress-strain curve of a fibre being pulled from 'a matrix,
then the area under this curve is equal to the energy absorbed by the
fibre and stored as elastic energy after bond failure. \fuen a fibre
debonds from the matrix the strain energy contributing to the fracture
toughness over a length Lf is Hn
0-;. max ..... ultimate tensile strength
. cr-fmax - 12 Ef - fibre modulus.
Cooper and Kelly then compared wp and Wn and assumed
'I:: m = Of max·df .•. 4 4 • Lf
Then ~ 1 1:' 2 2' m,IT,df Lf =
, ,
Wn 2 <5""f2 ir;df max 24 Ef
3 Ef
= "fmax
where Ef/clfmax is at least of the order of 100 : 1,
as is usual with carbon fibres in composites, then at least 300 times
as much energy can be absorbed by pulling the fibres out of the
composite and shearing the matrix than debonding the fibres from the
matrix.
- ._- -----------------------
Piggott (52) in discussing possible methods of :toughening composites
suggests rather arbitrarily that a low shear stress material at the
interface between. the fibre and matrix would seem worth lllvestigating. \-.
He came to this conclusion by theoretically analysing composites in
an attempt to correlate the fracture toughness parameter K~ with
other physical properties of the composite. Although the model is
not practical, nor is it usually possible to equate Kc with other
physical parar.teter/53), his work defines most of the important
parameters upon which toughness is considered to depend. These
are high fibre strength, large fibre diameter and a high volume
fraction of fibreS in the composite.
Harri/47) concluded th~t fracture energy in composites was greatest
for those with a weak interface, I,here a large area of fibres were
pulling from the matrix.
The analysis of Cooper and Kelly, Outwater and Hurphy, Piggott and
Harris give additional support to the decided course of the present
research programme undertaken. A weak, flexible, low modulus surface
coating I,ell bonded to the carbon fibre and compatible with the epoxy
matrix, fulfills most of criteria and suggestions of the many authors
rev.i.ewed. This system should blunt cracks at the interface, allOl,
fibres to pull-out from the matrix without initially debonding, and
being well bonded to matrix and fibre should not seriously degrade the
other composite properties.'
9.3 Toughened Matrices
68
The development of the 'Ideall matrix for carbon fibres has been discussed(54).
The ideal matrix, however, does not necessarily give the best toughness,
if toughness is required, but rather the best average values for all
the various properties.
The use of thermosetting resins as structural materials or as matrices
for fibre reinforced composites is often limited by brittleness and
a tendency to catastrophic failure. McGarry and his co-workers(5S)
have investigated ways in which elastomeric inclusions could be used to
increase the resistance of thermoset resins to fracture and cracking.
The successful work to date has centred largely on the use of Hycar
CTBN, a carboxyl-terminated, liquid butadiene-acrylonitrile copolymer.
Hycar CTBN has been used to toughen epoxy resin by an in-situ formation
of small rubber particles ,in a glassyresin. The liquid rubber was added
at low levels (as low as 2.5 )ili~) and small particles of rubber were,
precipitated during gelation of the resin. The elastomer polymer
chain has reactive sites which form bonds in the resin beween areas of
high rubber concentration and the cross-licl,ed cured epoxy resin.
69
HCGarry(56) and Sultan have' sholm that Hycar CTm blended with epoxy resins
gave a ten-fold improvement in fracture energy of the epoxy resin.
Burhans and soldatas (57) have sholvu that a Hycar C~BN modified
cycloaliphatic epoxy resin (ERL-4221) improved its tensile strength
and elongation from 7,500 psi (51.6 MNm-2) and 1.9% to 12,000 psi
(82.6 MNm~2) and 5% together with a drop of only 7% in modulus.
However there are problems
et alia(58), investigating
with using Hycar CTBN. A paper by Drake
th'e use -of-liquid rubbers to toughen thermoset
resins, indicated, the elaborate mixing procedure necessary and the
problems which arise in casting the resin. Phillips and Rogers(59) in
discussing the use of Hycar aTBN state that, although the matrix material
is toughened, the behaviour of the compoSite is complex and the modified
'composite gives disappointing resillts •. In these materials they recall the
strain to failure is limited by the reinforcement, and it is the way in
which the fracture energy is absorbed at the crack tip which is
important. The disappointing results are not surprising since it
seems that the toughening is not being placed where it is required,
on the fibres, .. ",··,' ",'-,.,-.
The cycloaliphatic epoxy resin BXL ERLA 4617 already mentioned in the
work on adhesion, gives properties which are unusual. It has a high
modulus and high elongation. Ivork by Rogers et alia (60) on the
ballistic impact resistance of treated carbon fibre composites, where
the matrix \vas ERLA 4.6l7, yielded some interesting results. . An eight-
fold improvement over a conventional epoxy novolac resin with untreated
fibres was quoted. Wnat is important here is that by increasing the
elongation of the resin, treated fibres can have good impact resistance
with good bonding to the resin. However ERLA 4617.·is a difficult
resin to handle, the cure cycle is very complicated and has poor
resistance to water immersion.
Conventional'.epoxy .. :resins have been toughened or made less brittle
by using 101, modulus curing agents, such as in polyamide extended
epoxy resins. In this research Ivork more flexible epoxy resins were
formulated and used as matrices in composites; for it was considered
that conventional flexibilisers for epoxy resins had not increased . (61)
the impact strength sufficiently. Owen and Rose . in their work also
concluded that the fracture toughness of epoxy was not significantly
improved, using conventional flexibilisers.
Polyurethane rubbers can be used to improve the impact and flexibility
70
of epoxy resins to a greater extent than with conventional flexibilisers.
Du Pont issue a bulletin(62) on this subject and reveal that a range of
properties in bet\,een those of epm .. -y resin and polyurethane rubber can
be achieved, since they are completely compatible.
Kelly(49) suggested a mechanism to improve toughness, by allowing
fibres to pull out from the matrix and deform_. : the matrix as discussed
in section 9.2 'Toughening by Fibre Surface Treatmen~s. HI' showed
that the work absorbed in fracture was maximised(Figu:;'e 24), \{hen the
actual fibre length pulled out from the matrix equalled the fibre
critical length.

·71
VARIATION OF FIBRE STRENGTH \VITH FIBRE LENGTH
4
Strength
3
GNm-2 ·
2
1
o
R.A.E.HM
•
SOum SOOum Smm SOmm
Work
Of
Fracture
Length
MAXIMUM WORK OF FRACTURE
1 Fibre Length c
Figure 24
SOOmm

The w'ork of fracture absorbed by the composite if it fails
according to the mechanism described by Kelly is Wp \;here ,)
1 ' ,
.... '" '{Z' I' Wp = 2" '·.r f' "m -;Lf ' i
rf = fibre radius
tm = matrix shear strength
If = fibre pull-out length
For maximum work of fracture the fibre pull-out length should equal
the fibre critical length lc where
4
d't'max - ultimate fibre strength
df - fibre diameter
'I:' m - matrix shear strength
The problem then with this mechanism is whether the length of fibre
pulled from the matrix is the fibre critical length.
The \;ork in this section of the thesis involved finding the composite
requirements for maximum work of 'fracture assuming a mechanism as
discussed above. WadSworth and Spilling(42) noted in a composite
that the f~bres break down into smaller lengths as the stress on the
composite is increased. This is obviously necessary, if to absorb
energy at fracture fibres are to pull out from the matrix. The
lengths into \~hich they break should equal the critical lengths of the
fibre for maximum IVork of fracture. The lengths into IVhich the fibres
break depend on .., .
their strength, see figure 24 according to ~ladsworth and
S 'llin (42) p~ g • They give the change in fibre strength IVith fibre
length, for RAE HM fibre and assuming a similar behaviour for Courtaulds
72
HT-S fibre the change in fibre strength for length is shown for this fibre.
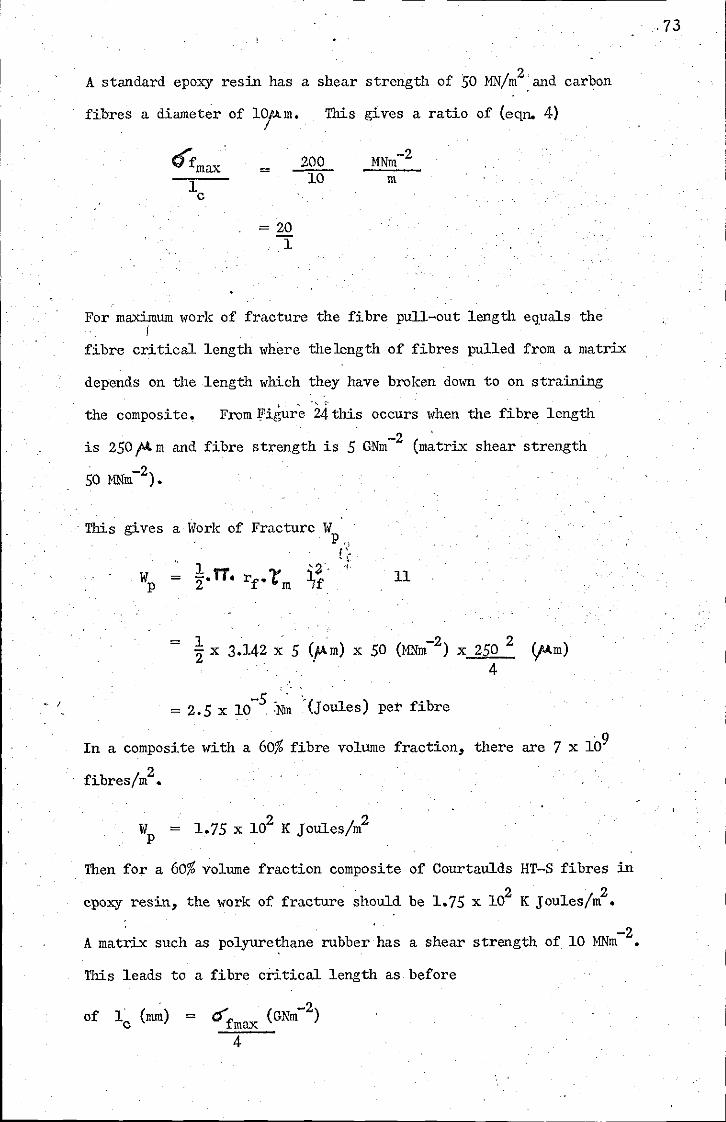
". I
A standard epoxy resin has a shear strength of 50 MN/m2
,and carbon
fibres a diameter of 10/Am. /
This gives a ratio of (eqn. 4)
=
= 20
200 10
1
For maximum lVork of fracture the fibre pull-out length equals the I
fibre critical length "here thelength of fibres pulled from a matrix
depends on the length IVhich they have broken dolVU to on straining -~ ','
the composite. From l!'igure 24 this occurs ",hen the fibre length
is 250JAm and fibre strength is 5 GNm-2 (m~trix shear strength . 2
50 MNm- ).
. This gives
Wp
a Work of Fracture W p"
I':.
= ~. TT. rf' 1.' m ~f .. t.
11
= ! x 3.142; 5 (fAm) x 50 (MNm-2
) x 250 2 (,Mm) 4
= 2.5 x 10⁻⁵ }''i~ "(Joules) per fibre
In a composite lVith a 60% fibre volume fraction, there are 7 x 10⁹
fibres/m2
•
Wp = 1.75 x 10²
K Joules/m2
Then for a 60% volume fraction composite of Courtaulds HT-S fibres in
epoxy resin, the work of fracture should be 1.75 x 10²
K Joules/m2
•
-2 A matrix such as polyurethane rubber has a shear strength of 10 MNm •
This leads to a fibre critical length as before
of lc (mm) = c:(fmax (GNm-2
)
4
,73
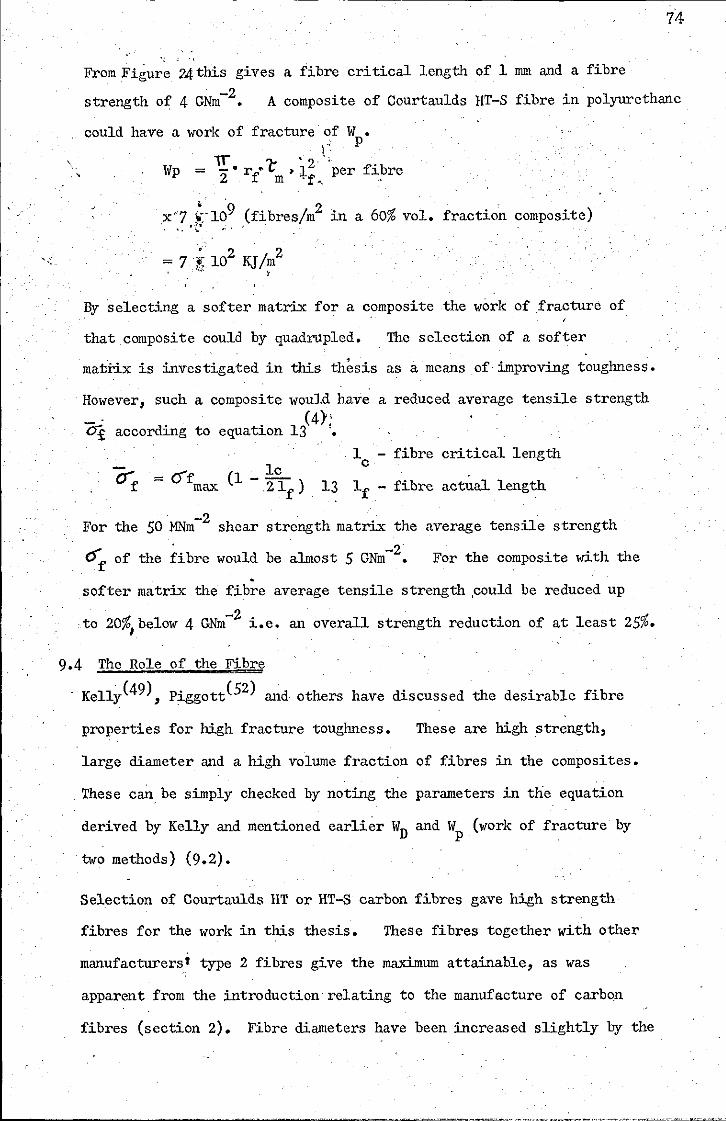
'----------------------------------------~--------------------------------------
74
From Figure 24this gives a fibre critical length of 1 mm and a fibre -2 strength of 4 GNm. A composite of Courtaulds HT-S fibre in polyurethane
\, ,
could have a work of fracture of W • , \": p
1r .' Wp = 2· rl'l:'m • +;., 'per fibre
,x7 .~' 109 (fibres/m2 in a 60% vol. fraction composite) . "'" .. '
By selecting a softer matrix for a composite the work of fracture of
that composite could by quadrupled. The selection of a softer , ,
matrix is investigated in this thesis as a means of'improving toughness.
However, such a composite would have a reduced average tensile strength (4}'
Of according to equation 13 '.
(1 lc -21
f)
,1 - fibre critical length c
13 If - fibre actual length
-2 ' For the 50 MNm shear strength matrix the average tensile strength , -2
cif of the fibre would be almost 5 GNm • For the composite with the .
softer matrix the fibre average tensile strength ,could be reduced up
% -2 % to 20 " below 4 GNm i.e. an overall strength reduction of at least 25 o.
9.4 The Role of the Fibre :e:::=-==
Kelly(49), Piggott(52) and others have discussed the desirable fibre
properties for high fracture toughness. These are high strength,
large diameter and a high volume fraction of fibres in the composites.
,These call,be simply checked by noting the parameters in the equation
derived by Kelly and mentioned earlier Wn and Wp (work of fracture by
two methods) (9.2).
Selection of Courtaulds HT or HT-S carbon fibres gave high strength
fibres for the work in this thesis. These fibres together with other
manufacturers~ type 2 fibres give the maximum attainable, as \{as
apparent from the introduction relating to the manufacture of carbon
fibres (section 2). Fibre diameters have been increased slightly by the
fibre manufacturers, up to 25% since the introduction of carbon
fibres. However significant increases in toughness would only
come from far larger increases in diameter. Since the manufacturing
process is essentially pyrolysis, the time taken to pyrolyse thicker
polyacrylonitrile fibres is so much longer as to be uneconomic.
The longer time to pyrolyse is necessary because the gases 'evolved in
the pyrolysis of thick fibres would not easily escape through the
already pyrolysed fibre outside layers. Lastly carbon-fibre ., .
composites are anyway fabricated 'with a.high volume fraction of fibres,
generally between 60% and 70%, and it is difficult to significantly
increase the fibre volume fraction. Different manufacturers have
produced their own fibres with slightly different strengths and
diameters, and it has been shown(63) that those with the greatest
area under the stress-strain curve give the greatest toughness.
Kelly(49), suggested that to improve toughness, cracks, which are
propagating through a failing composite should be obliged to take
a longer path. This mechanism can be compared to the path a crack
takes when a Igreen-stick l is broken. The crack goes backwards and
forwards along the stick and absorbs considerable energy in doing
so. A similar mechanism has been reported (64, 65) to improve the
fracture toughness of particulate-filled composites. The improvement
was achieved by a selection of particles whose size distribution was
such that the spaces in between the particles were filled by smaller
particles. This packing of the composite resulted in fracture cracks
taking a longer path through the composite and adsorbing more energy.
Applying this tecJutique to carbon-fibre composites could give a fibre .. .-'
distribution in the composite as shown in ,Figure 25'. If the small
fibre was carbon with a diameter of 10)4m then the other fibres
surrounding it should have a diameter of 64~. As already mentioned,
75

76
Figure 25
.t._,,_
110:64 Ratio of§mall to Large Fibre
carbon fibres are only manufactured with a diameter of 10 l.Am and
there is considerable difficult7 involved in manufacturing larger
carbon fibres. The small fibre occupies only 3% of the total volume
occupied by all the fibres and this technique could be used as a way
of reinforcing glass fibres to give a stiffer stronger composite.
However glass fibres are not normally produced asthick as 64/~m
and a special batch of glass fibres would be required in order to
investigate this system.
(66) . Lastly MDrley1s concept of a duplex fibre offered another possible
solution to the toughness problems of composites. He described the
duplex fibre as a hollol' outer element strongly bonded to the matrix
and an inner element relatively l"eakly bonded to the outer element.
The outer element and its interface with the matrix were discussed as
being able to withstand the longitudinal shear stresses and transverse
tensile stresses. However a crack propagating through the matrix would
crack the outer: element, but not the weakly bonded inner element which
would pull out from the outer elemcl;1t. Work would be absorbed in
pulling the inner from the outer. No experimental work has as yet
been published using IMorley type fibres!. Any possible process for
making them would almost certainly be very· expensive.
'.
,
77
78
10. TOUGHENED COMPOSITES BY FIBRE SURFACE TREATHENT
10.1 Materials Selection
dourta~ds Grafil HT-S grade carbon fibre was selected here as a high
strength fibre, \'lhich as previou'sly discussed in section 9.4, should
give composites lvith a high fracture toughness. The fibre used was
supplied in 48 inch (1. 3 m) long tOl'IS of 10,000 filaments, each
weighing approximately 1 gram.. The physical properties of HT-S
fibres \Vere, as in Appendix 1. The S in HT-S indicates an
additional oxidising surface treatment for improved adhesion. All
the composites were fabricated from one batch of fibres PPM 42/336 Z.
Most carbon fibre articles are produced from prepregs, and for
convenience in this work the fibres were made into prepregs. Prepregs
are produced by impregnating carbon fibres with a solution of epoxy
resin, the solvent evaporated and the resin partly cured. This gives
a material l,hich can be handled easily and readily prepared for moulding.
Shell produces a serles of epoxy resins for making prepregs, the most
useful of which for,tThis thesis \Vere Epikote DX210 cured with Epikure
BF3 400 and Epikote DX 231 "cureD! with Epikure DX 125. The former
mixture requires 4 hours at 1700C to cure, the latter either 4 hours . 0 0
at 140 C or 1.1/2 hours at 150 C to cure. Both systems require a . 0
precure at around 100 C for a fe\V minutes and could be stored at
room temperature, after this precure stage, for several months before
final curing.
The surface treatment to be used on the carbon fibres was' a polyurethane
rubber. o Since polyurethane degrades above 150 C the epoxy system
. Epikote 23l/Epikure 125 was chosen as its lower curing temperature \Vas
more suitable. Conventional polyurethane prepolymers, as supplied by
Du Pont in its Adiprene series, can be cured with DETA as discussed in
. the introduction. However an isocyanate terminated polyurethane would

i
I
I
I· I
1
-- -- ---------------------------------------------------------------------------
cure prematurely when mixed with DETA before the coated fibres could
be encapsulated in the epoxy matrix. A precured polyurethane would
stop the hoped for intermingling of the epoxy and polyurethane to give
a graded interface. Du Pont supplied Adiprene BL-16, a blocked
polyurethane prepolymer which cures I,hen heated to l300 C with DETA.
Fibres coated with this polyurethane prepolymer I,ould allOl, inter-
mingling with the epoxy matrix and give the graded interface to stop
cracks propagating and in addition would not prematurely cure.
10.2 Prepreg Preparation and Moulding
Carbon fibre tows dipped in a solution of the polyurethane prepolymer
were aligned on Melinex (67) sheet. This solution contained between
1% and 10% by weight of a mixture containing Adiprene BL-16 and the
stoich'jometr:k amount of DETA (100 partsBL-i6 12 parts DETA), in
acetone. The acetone evaporated quickly to leave a light coating of
the polyur~thane prepolymer on the fibre_ The epoxy resin Epikote
DX 23l/Epikure DX 125 lVas thEm spread over:the carbon fibres in
solution form. The solvent was allowed to evaporate and lVas
followed by a 40 mOUlute precure at 90oC. After removing the last
solvent traces in a vacuum, the now formed prepreg lVas stored in
a freezer until required.
Two sizes of specimen were moulded. One si2:e was 2!l (51 mm) x 2!l
(51 mm) x(};:J!1 (2.5 mm) for falling weight impact tests. The other
size lVas 12!l (300 mm) x 1/2!l (13 mm) x 0.2!l (5 mm) for flexural
modulus, short span three pOint. bending tests and charpy type impact
tests. The specimens were prepared by cutting the prepreg to size o .
and moulding at 140 C for about 4 hours under a mould pressure of
0.7 MN/m2• The specimens were moulded to about 60% by volUme of
fibre in the composite.
,.
79

10.3 Results
A series of specimens were prepared, varying the amount of polyurethane
in the sizing solution from 1% to 10%. The 12inch (300 mm) long
specimens were first tested for flexural modulus at a 40 : 1 span
to depth ratio. Four samples ,,,ere cut from this specimen and
tested to failure in three point bending at a 5:1 span to depth
ratio to give I.L.S.S',· and area under the 1.L.S.S. curve. Next the
remainder of the specimen was cut into 8 samples and tested on the
Hounsfield Plastics Impact Tester (Section 14.1), in a charpy type test.
Part of the specimen was used to find the fibre volume fraction. For
this, the resin was dissolved; using a.hot concentrated mixture of
sulphuric acid and hydrogen peroxide. The flexural modulus and
I.L.S.S. tests monitored the change in properties of the material.
The charpy type test, and area under the I.1 .. S.S. measured the change in
toughness of the material. Once the optimum coating level (10 gm
P.U./l00 gm C.F. from a 4-5% P.U.sol.) had been established a series
of specimens were prepared for falling weight impact tests. These
specimens were 2" (51 mm) x 2"(51 mm) x 0.1" 92.5 mm) and ,iere moulded
with biaxia1ly orientated fibres and uniaxially orientated fibres.
.80

81
TAl3LE 6
SAHPLE TREA 1MENT FIBRE CONTENT FLEX HOD ILSS HNm-2 AREA UNDER CHARPY TYPE Size Solution of % by vol m£2 . ILSS Nm IMPACT TEST
P. U. Joules
None 52~;O 129 61.1 1.53 . .89
None 59.1 138 62.6 2.16 1.20
None 57.6 125 37.8 5.49 1.05
. None 54.6 150 53.7 3.26 1.24
1% 62.9 119 45.4 2.04 1.37
2% 66.3 144 53.3 2.89 1.32
2% 60.3 143 48.1 3.16 1.35
2% 61.0 142 34.8 3.53 1.56
.:rfo 69.5 149 49.9· 4.50 1.32 . \
4% 66.9 142 36.6 7.06 1.44
4% 62.6 148 43.8 3.67 1.47
5% 60.2 106 34.8 9.08 1.49
5% 58.0 129 55.0 4.67 1.31
6% • 66.3 100 32.6 6.53 1.38
7% 56.1 83.2 30.2 7.85 1.10
10% 44.7 29.4 14.4 3.66 1.53
10.4 Falling Weight Impact Tests Results
Falling lveight impact tests are more representative of the type of
impact actually encountered by real specimens in service (See Section 14.1)
With carbon-fibre composites, there is no clear distinction between a failed
composite and an undamaged composite, after being impacted. The specimens
were progressively damaged by repeated low level impact t~sts. The damage
was monitored by measuring the flexural modulus at 450 to the fibre
orientation of the biaxially orientated composites betlveen the impacts.
The impact loads were such that more than one test was required to fail
the specimens. The flexural moduli quoted below are the gradient of the
load deformation curves divided by tile specimen thickness cubed.
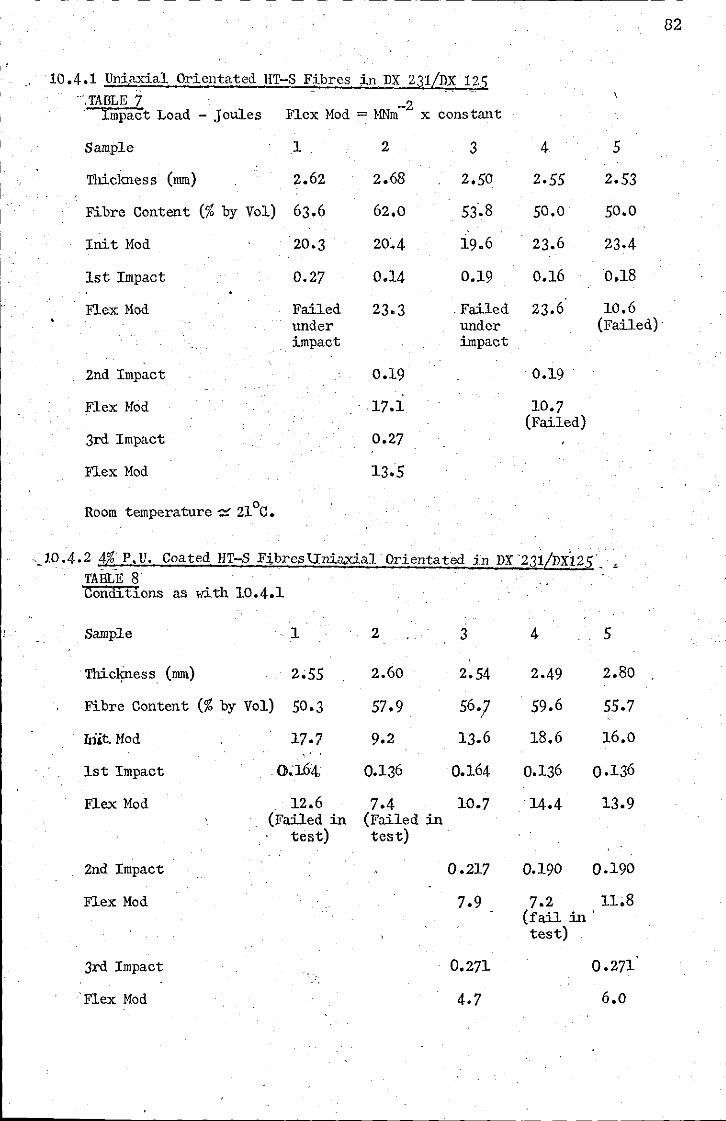
i
i
i
10.4.1 Uni,axial Orientated ]fT-S Fibres in DX 231/DX125 ".TAIlLE 7
Impact Load - Joules Flex Mod = MNm-2 x constant
Sample 1 2 3
Thiclmess (mm) 2.62 2.68 2.50
Fibre Content (% by Vol) 63.6 62.0 53.8
Init Mod 20·3 20~4 19.6
1st Impact 0.27 0.14 0.19
Flex Mod Failed 23.3 ' Failed under under impact impact
2nd Impact 0.19
Flex Mod ,17.1
3rd Impact 0.27
Flex Mod 13.5
0 Room temperature '::t 21 C.
4 5
2·55 2.53
50.0 50.0
23.6 23.4
0.16 0.18
23.6 10.6 (Failed) ,
0.19
10.7 (Failed)
,_10.4.2 4%~ P.D. Coated HT-S FibresUnia.xialOrientated in DX'231/DX125', " TABLE 8 Condit~ons as with 10.4.1
Sample Cc 1
'ThicIjD.ess (mm) 2;55
Fibre Content (% by Vol) 50.3
Liit. Mod
1st Impact
Flex Mod
2nd Impact
Flex Mod
3rd Impact
Flex Mod
17.7
c O~J.64,
12.6 (Failed in
test)
2
2.60
57.9
9.2
0.136
7.4 (Failed in test)
3
2.54
56·7
13.6
0.164
10.7
0.217
7.9
0.271
4.7
4 5
2.49 2.80
59.6 55.7
18.6 16.0
0.136 0.136
, 14.4 13.9
0.190 0.190
7.2 1L8 (fail :in ' test)
0.271'
6.0
82
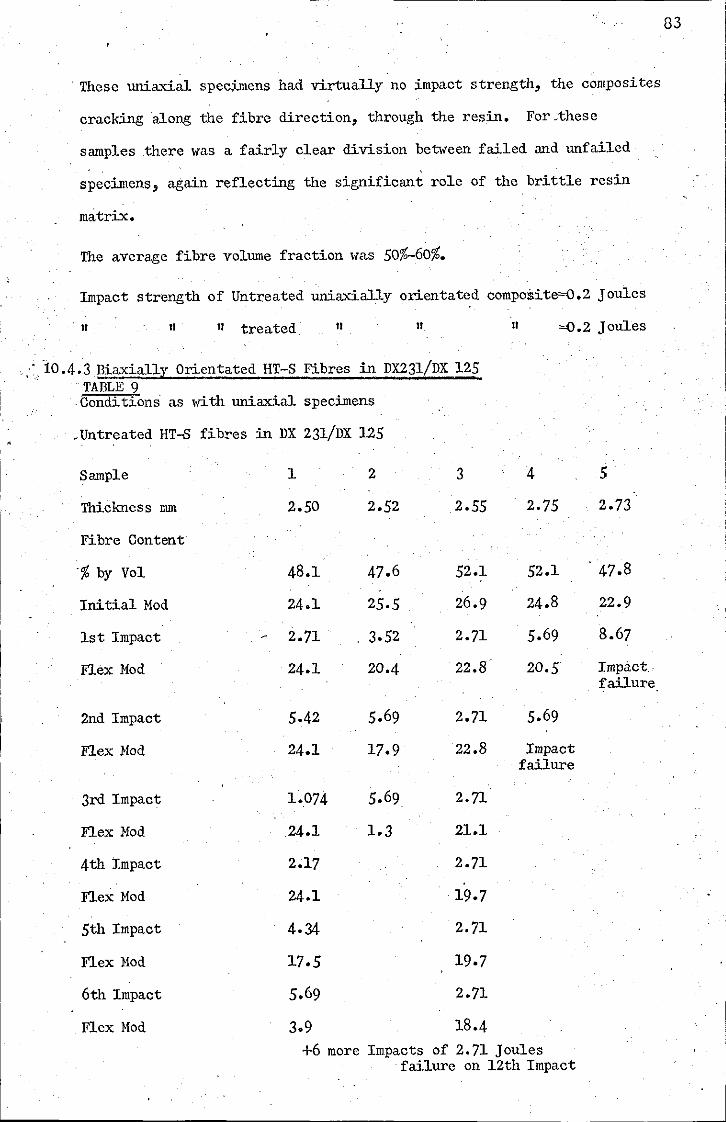
I
- These uniaxial specimens had virtually no impact strength, the composites
cracking along the fibre direction, through the resin. Forcthese
samples _there was a fairly clear division between failed and unfailed
specimens, again reflecting the significant role of the brittle resin
matrix.
The average fibre volume fraction was 50%-60%.
Impact strength of Untreated uniaxially orientated composite~.2 Joules
-11 11 11 treated 11 11 11 ~.2 Joules
_ :10.4.3 Biaxially Orientated HT-S Fibres in DX231/DX 125 TABLE 9 Conditions as \~th uniaxial specimens
_Untreated HT-B fibres in DX 231/DX 125
Sample 1 2
Thickness mm 2.50 2.52
Fibre Content
-% by Vol 48.1 47.6
Initial Mod 24.1 25.5
1st Impact 2.71 3.52
Flex Mod 24.1 20.4
2nd Impact 5.42 5.69
Flex Mod 24.1 17.9
3rd Impact 1.074 5.69
Flex Mod 24.1 1.3
4th Impact 2.17
Flex Mod 24.1
5th Impact 4.34
Flex Mod 17.5
6th Impact 5.69
Flex Mod 3.9
3
2.55
52.1
26.9
2.71
22.8
2.71
22.8
2.71
21.1
2.71
19.7
2.71
19.7
2.71
18.4
4
2.75
52.1
24.8
5.69
20.5
5.69
Impact failure
+6 more Impacts of 2.71 Joules failure on 12th Impact
5
2.73
47.8
22.9
8.67
Impa.ct -failure
83
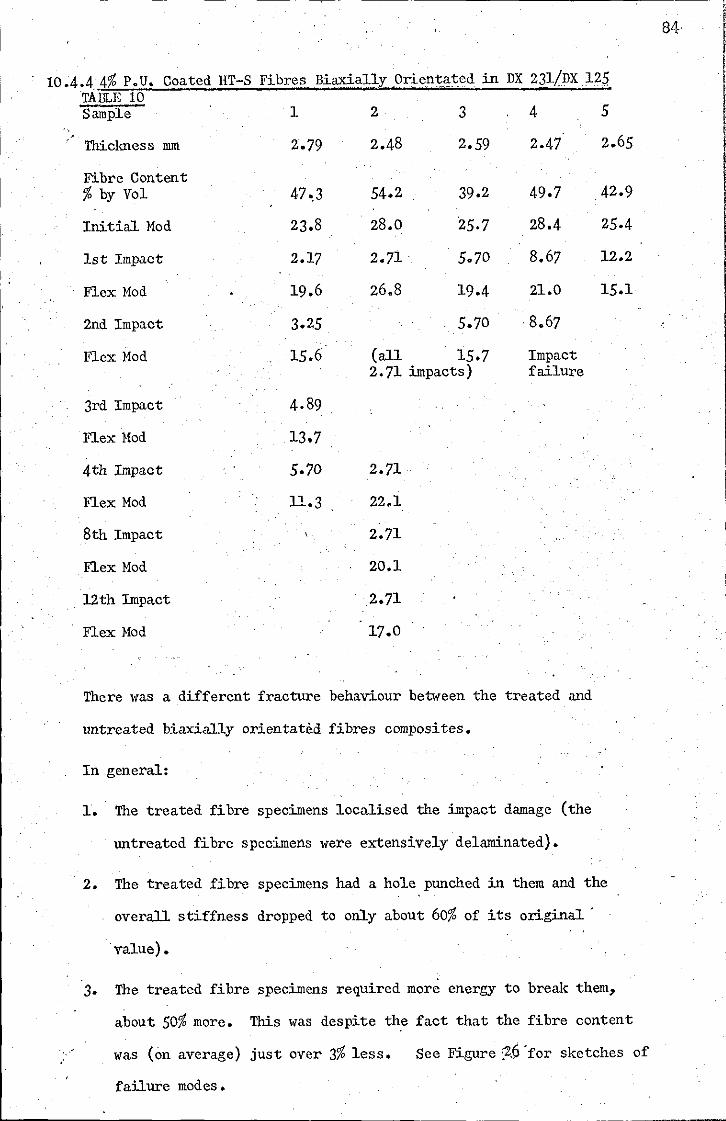
I .
10.4.44% P.U. Coated IlT-S Fibres Biaxially Orie.ntatedin DX 231jDX125
,
TAIlLE 10 Sample 1 2 3 4
Thickness mm 2.79 2.48 2.59 2.47
Fibre Content % by Vol 47 • .3 54.2 39.2 49.7
Initial Mod 23.8 28.0 '25.7 28.4
1st Impact 2.17 2.71 . 5.70 8.67
flex Mod 19.6 26.8 19.4 21.0
2nd Impact 3.25 5.70 ·8.67
flex Mod 15.6 (all 15.7 Impact 2.71 impacts) failure
3rd Impact 4.89
flex }lod 13.7
4th Impact 5.70 2.71·
flex Mod 11.3 22.1
8th Impact 2.71
flex Mod 20.1
12th Impact 2.71
flex Mod 17.0
There was a different fracture behaviour between the treated and
untreated biaxially orientated fibres composites.
In general:
1. The treated fibre specimens localised the impact damage (the
untreated fibre specimens were extensively delaminated).
5
2.65
42.9
25.4
12.2
15.1
2. The treated fibre specimens had a hole punched in them and the
overall stiffness dropped to only about 60% of its original '
value) •
3. The treated fibre specimens required more energy to break them,
about 50% more. This was despite the fact that the fibre content
was (on average) just over 3% less. See Figure ;29 'for sketches of
failure modes.
84
I
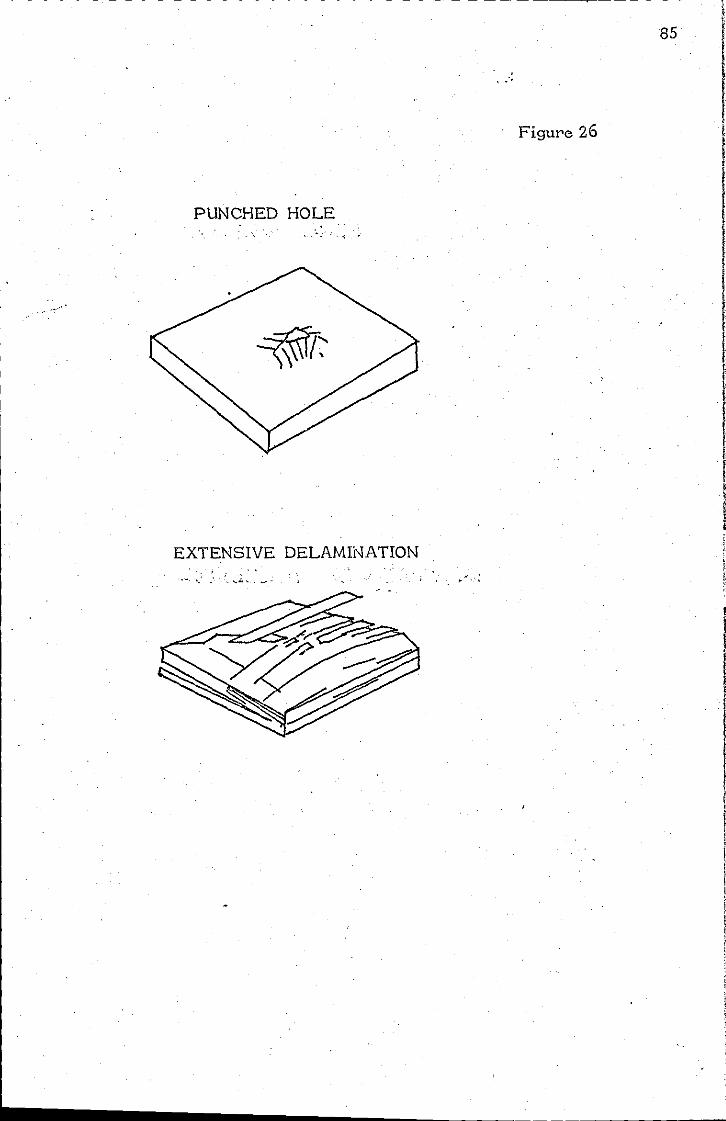
Figure 26
PUNCHED HOLE
EXTENSIVE DELAMIi'lATION
, . ,..",<
85
I I I ! j I
'. 10.5 System Investigation
" , ,
The polyurethane Adiprene BL-16 used to coat the fibres \Vas not cured ,
;,' 'exactly in accordance \Vith the technical bullet,in issued by Du Pont.
(rather the epoxy cure schedule \Vas follo\Ved). Because of this
samples of the polyurethane were cured, according to the Du-Pont
bulletin and follo\Ving the three recommended cure schedules for the
epoxy resin Shell Epikote DX23l/Epikure DX 125. In addition a cure , i ,
cycle for the polyurethane \Vas follo\Ved according to the cure cycle
for Shell Epikote DX 210 Epikure BF3400.
These cure cycles were
3 hI'S at 1300 C in a 'vacuum PUll
PU/2
PU/3
PU/4
° ' ° 45 mills at 90 C + 4 hours at 135 C in vacuum (DX231/DXl25)
45 mills at 90°C + 1.1/2 hours at 145°C in vacuum (DX231/DXl25)
45 mins at 90°C + 1.1/2 hours at 145°C + 2 hours at 170°C (DX231/DXl2S)
puis ° ' 0 10 mins at 100 C + 4 hours at 165 C.
The second stage of PU/2 to puis was taken SoC lower than the
recommended temperature, because the mould used in the press was SoC
lower than the plat~n. temperaure. ---- --~~-- ~
PU/4 ,and puis completely degraded and could not be tested. TABLE 11 Tensile properties PUll PU/2
Elongation at Break % 467 314
Tensile Stress at 100% ExtMNm-2 1.OS 1.23
tr tr tr 200% 2.14 2.57
tr 11 11 300% 3.12 3.77
-2 Tensile Strength HNm . 6.50 3.S3
' PU/3 '
4S3
0.69
1.63
2.61
4.15
The recommended cure cycle (PU/l) was most closely followed by an
86
average of PU/2 and PU/3. A p"l,a..!.:,e!!_ temperature of 145°C for 2.1/2 hours
giving a mould temperature of 140°C \Vould give the best urethane properties.
L-____________ -'-________________ ,_,_"" ____ ~ __ ,, _________ , __ '
In discussing the ideas which led to the introduction of the particular
fibre coating used, intermingling of the polyurethane coating and epoxy
matrix was expected to give a graded interface. By precuring the coated
fibres, before preparing the prepreg with the epoxy resin solution, this
intermingling could be progressively precluded. The variation in
prope~ties with the amount of intermingling at the graded interface could
also'give some insight into the behaviour of the fibre coating, in the
composite. The coating would be completely cured after 3 hours at
Consequently precures of 10 mins, 30 mileS and 90 mins were
investiga ted.
FigUre 27 shows the variation of physical properties with increasing
precure of the polyurethane coating.
The only property to improve with the precure lvaS the interlaminar
shear strength, the flexural modulus remaining essentially unchanged
and the toughness falling significantly.
'A certain amount of microscopy was undertaken in order to investigate
the nature of the coating.
Scanning electron micrographs of (harpy type fracture surfaces (jlate
,8' and ,9) revealed little diffurence between the coated and uncoated
fibre specimens.
Attempts were made at sectioning the composite with a view to staining,
and or etching of the resin. However this procedure failed, for the
carbon being very hard dropped out or was not included in the resin
sections cut. Only resin sections with holes where the fibres had been
could be cut for electron microscopy.
Lastly treated fibre composites were sectioned flat and the flat surfaces
hydroJlsed for several hours, and several days. It was hoped that the
87 il !I

--------------------------------------------------------------------
-', I
I ;
r
200
GNm-2
80
I.L.S.S.
~mpact
Joules
0.8
4 Area Under I.L.S.S.
, 2
Joules
o
Figure 27
Flexural Modulus
I.L.S.S.
Impact
I.L.S.S.
•
20 40 60
Time in Minutes of 80ating Precure Before Resin Impregnation
I'
88
80

89 COMPOSITE FRACTURE S URFACES
Coated F ibr es P late 8
Uncoated Fibres Plate 9
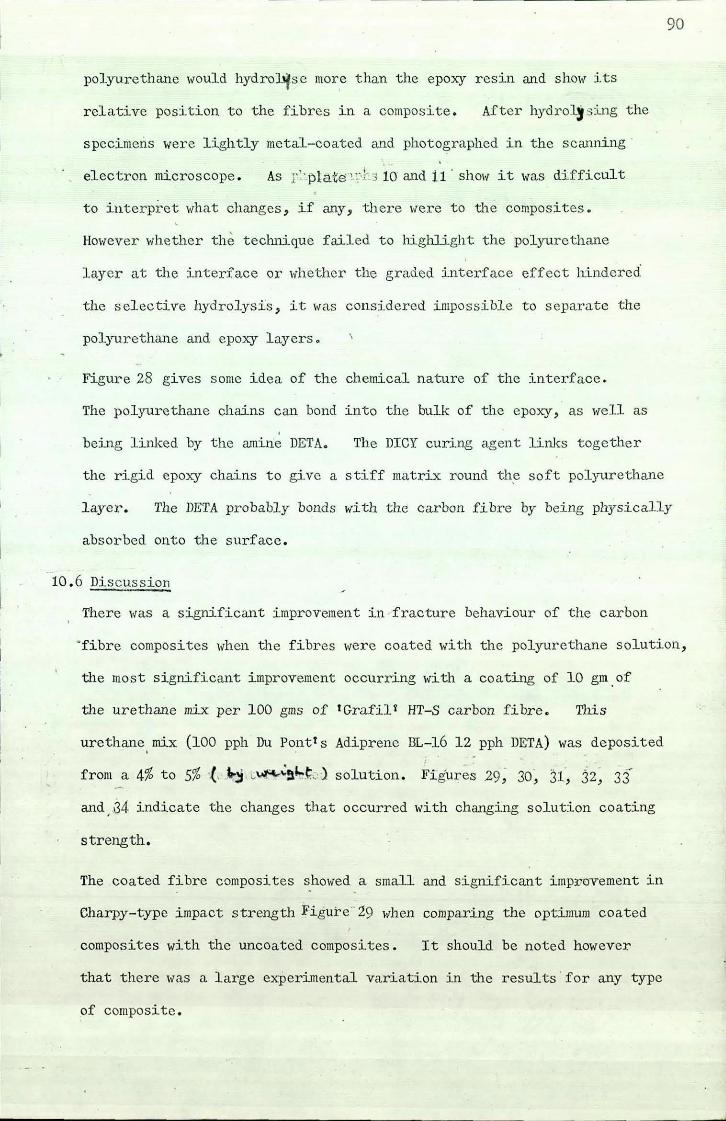
polyurethane "ould hydrollfse more than the epoxy r esin and sho\; its
relative position to the fibres in a composite. After hydrol, s ing the
specimens were lightly metal-coated and photographed in the scanning
electron microscope. As r ':plate Q}s 10 and i1 ' shO\; it "as difficult
to interpi'ct what changes , if any, there I<ere to the composites.
HO\,ever whether the teclmique failed to highlight the polyurethane
layer at the interface or whether the graded interface effect hindered
the selective hydrolysis, it \; as considered impossible to separate the
polyurethane and epo:>..'Y l ayers.
Figure 28 gives some idea of the chemical nature of the interface .
The polyurethane chains can bond into the bulk of the epoxy, as well as
being linked by the amine DETA. The DICY curing agent links together
the rigid epoxy chains to give a stiff matrix round th.e soft polyurethane
90
layer. The DETA probably bonds with the carbon fibre by being physically
absorbed onto the surface.
10 . 6 Discussion
There was a significant i mprovement in -fracture behav-lour of the carbon
"fibre composites when the fibres were coated with the polyurethane solution,
the most significant improvement occurring "ith a coating of la gmof
the urethane mix per 100 gms of 'Grafil! HT-S carbon fibre. This
urethane, mix (100 pph Du Pont's Adiprene BL-16 12 pph DETA) was deposited
from a 4% to 5% ,C, -\,;) c~!lHd solution. Figur~s 29; 30~ 31', 32; 33
and ,.14 indicate the changes that occurred with changing solution coating
strength.
The coated fibre composites shO\,ed a small and significant impl10yement in
Charpy-type impact strength l!'igure" 29 \,hen comparing the optimum coated
composites with the uncoated composites . It should be noted however
that there was a large e:>..-perimental variation in the results ' for any type
of composite.
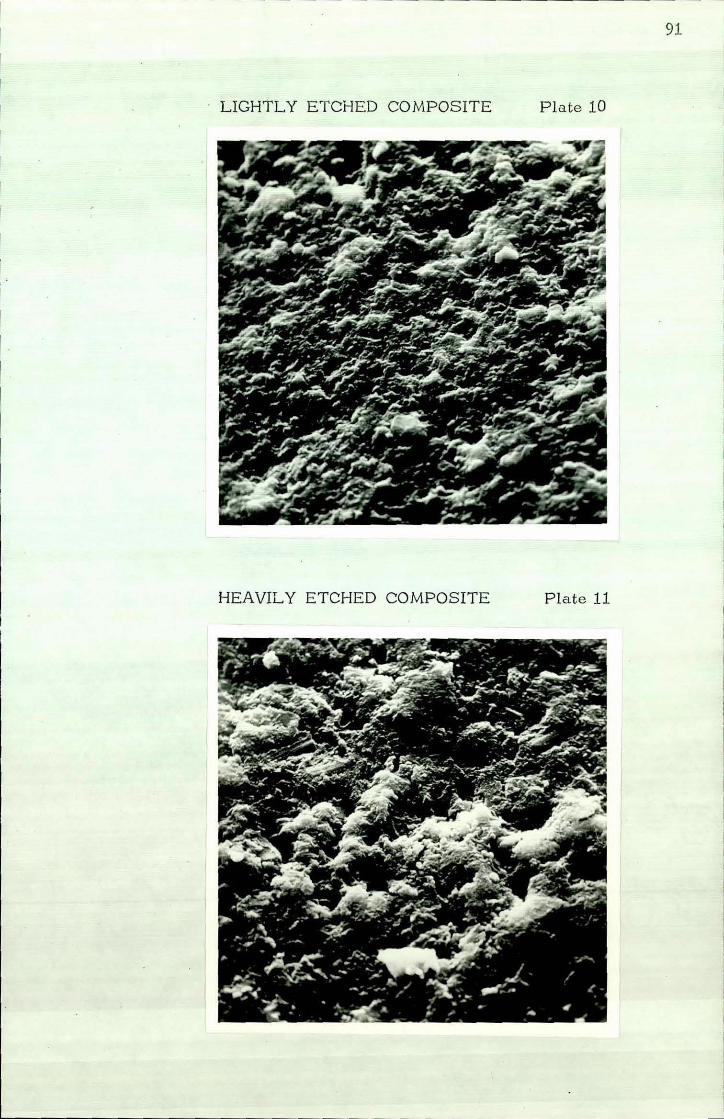
- - ------------------------
91
. LIGHTLY ETCHED COMPOSITE Plate 10
HEAVIL Y ETCHED COMPOSITE Plate 11

i !
DICY~ DICY~ . .' DICY
DICY~ DICY
C::N : . / . ,.
,~ 7?H t @ C~3 @-' .~ j i.i ~N-C=N-CH2-C-CH2 0- 0 -C- 0 0-CH2- Y-CH 2 -1--------- DICY : I., . I 0 ,H CH 3 I
C-OH' 11 N
DETA
I . ~ POLYURETHANE CHAIN EPOXY CHAIN !
1I , DICY DICYANDIAMIDE
DETA OIETHYLENETRIAMINE·
CARBON FIBRE
,-. ".'.
.' ... ,,-'
(
DETA -
"\
'TJ ~.
I.Q s:: '"J (l)
N
o ::c ITl :s: ......
~ r r ...... z 7': >c; ITl CIl
~
co -. \ .\0
N
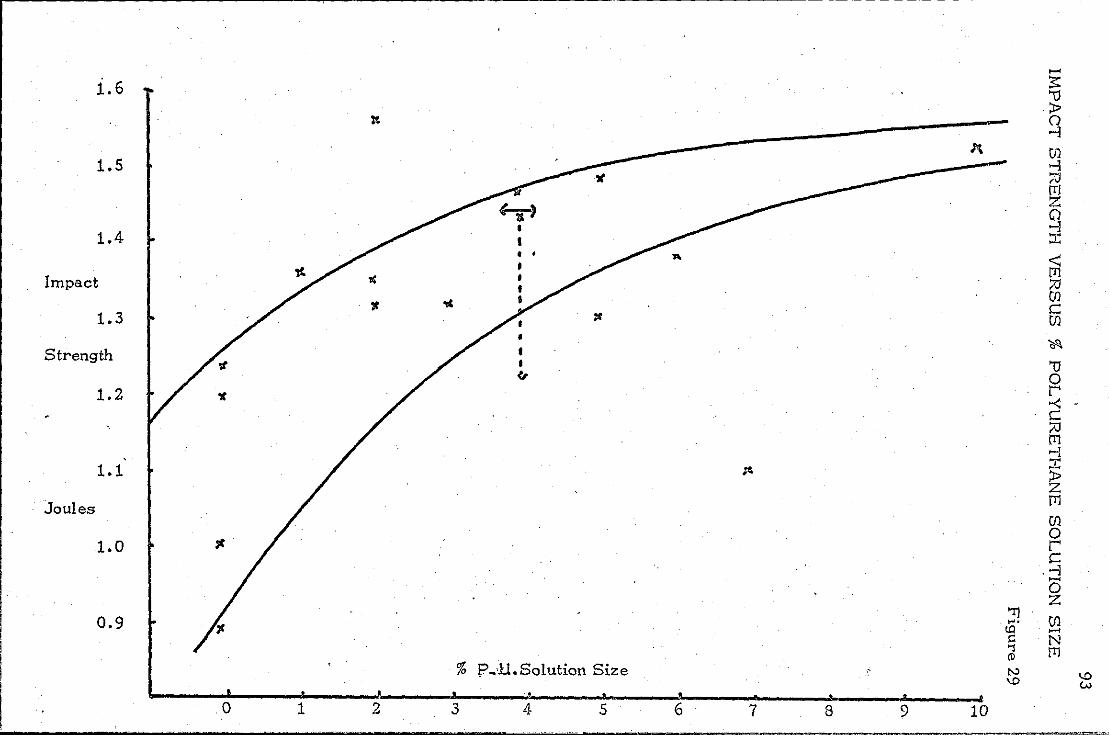
..... i.6 :s:
'tI > 0 -1
1.5 Cl) -1 ~ trJ Z Q
1.4 -1 :c
Impact ~ ;;0 (fl
1.3 c (fl
Strength * 'tI 0
1.2 l' -< C ;;0 tn ~l
1.1 ;:c > Z
Joules [11
(fl 0
1.0 l' C
_-1 ..... 0 Z
0.9 "I1 (fl .... <.Q ..... c N ""l tTJ CD
': "" \.0 ,
\.0 W % p~'ll.Solution Size
o 1 z 3 4 5 6 7 8 9 10 ,
---,

The I.L.S.S. (short span three point bend test) showed a 'significant
improvement for the optimum coated fibre composite compared to the
uncoated, see ;flg\lre 30. The uncoated fibre composites failed abruptly,
whereas the coated fibre composites failed gradually and absorbed more
energy in failing. In some cases the coated fibre composites after
failing could still be highly stressed. This increased energy absorbed
to final failure is illustrated in ;\:.iti;u're 31 by the total area under the
I.L.S.S curve. The area after the first failure, indicating the
suddeness of failure, was three times for the coated fibre composites;
the area up to first failure, and Ivas only 1/20 to 1/5 the area up to
94
failure for the uncoated fibre composites. This area after first failure,
under the I.L.S.S. curve, had increased to a maximum for the composites
coated with 4-5% solution of P.U.
The last of the tests IVhich indicated the:improved impact strength of
the coated fibre composites was the falling lVeight impact test. The
behaviour of the composites in these tests is illustrated iri' figure 32
IVhere the cumulative impact energy is plotted against the falling
flexural modulus of the composite; The modulus was taken as the gradient
from the load-deformation (measured at 450 to the fibre angle) divided
by the thickness cubed. The coated fibre composites, localised the
damage arising from the impacts. The specimens lVere,impacted until they
were either destroyed, or had a hole punched through them. For the
2 ft-lb (2.7 Joule) and 4.2,ft-lb (5.7 Joule) impacts, the coated fibre
specimens localised the damage and had a hole punched in them. In
general when the uncoated fibre composites were completely destroyed, the
coated fibre composites havc:.ng absorbed a similar amount of energy still
retained60% of their original stiffness. Note also in this graph
that the coated fibre composites at their optimum level had a higher
initial modulus than the uncoated fibre composites. This is
confirmed by Jigure 33. The uniaxial orientated fibre composites
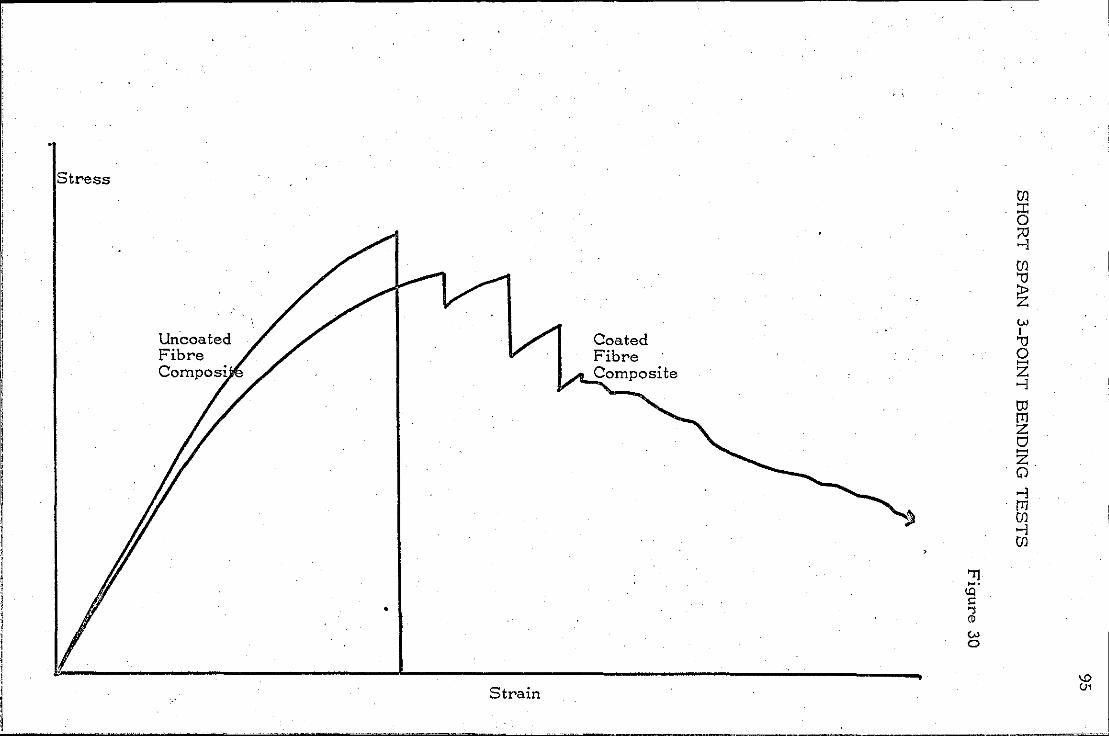
Stress
Uncoated Fibre Composi
•
Strain
Coated Fibre Composite ,.-

10
If
9 ;J>
lfl. 7:1 trl
8 "0 ;J>
Area Under 0 c: r' Z -< t1
7 c: trl ;:0 ;:0
I;L;S:iS. trl --l 0-0
• ::r: r' 6 ~ • {JJ
Curve trl • {JJ
{JJ • 5 0 () r' c: c: 7:1 --l < ...... 4 0 111
Z < Joules {JJ trl
'" ...... ;:0 3 N {JJ
{11 c: {JJ
2
"IJ .... to
1 s:: '"l (D
,-,. % P. U. Solution Size .....
\0 0 a-. 0 1 2 3 4 5 6 7 8 9 10
."--'"~. +- " ~-, .. <'----", .' -..~ .. - - - -
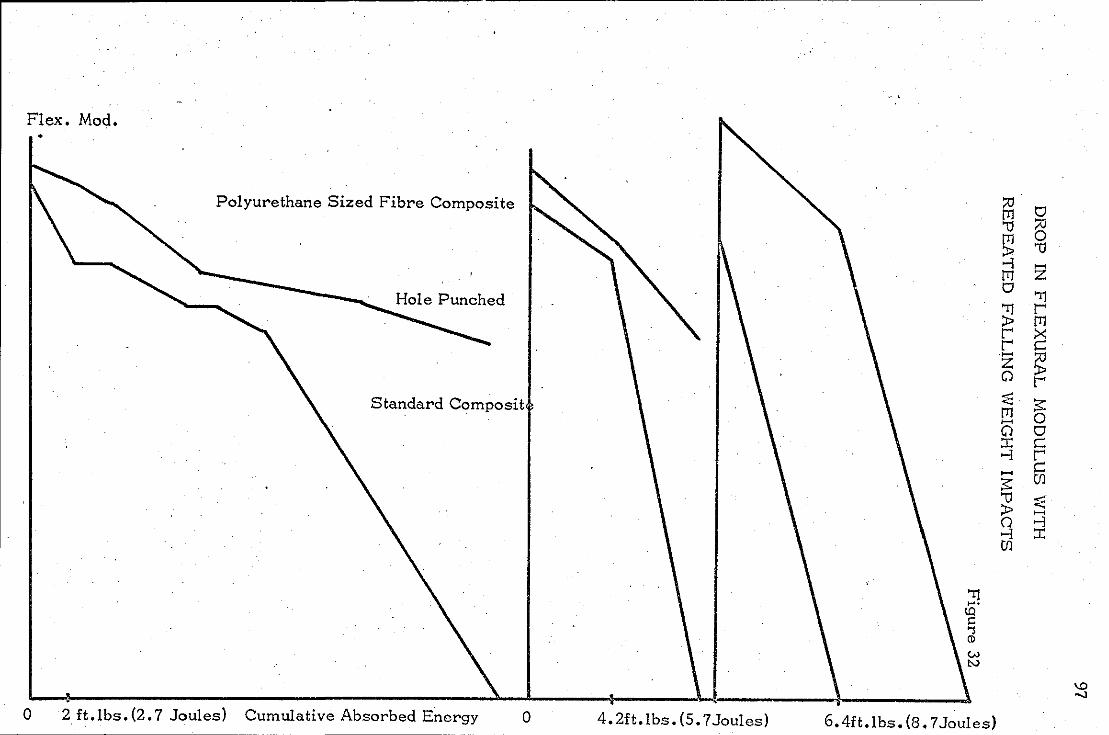
Flex. Mod • •
Polyurethane Sized Fibre Composite t:l Cl rn
'1:J t:l rn 0 > '1:J --l ..... rn z 0
'TJ 'TJ l' > rn l' :x: l' C ......
~ Z Cl l'
Standard Composit .-' <: :s: rn 0 ..... Cl Cl ::c C --l l' ..... C :s: Ul '1:J :::: > ..... 0 --l --l ::c Ul
'TJ ~.
I.Q C -s CD
\0 -..J
o 2 ft.lbs. (2. 7 Joules) Cumulative Absorbed Energy o 4. 2ft.lbs. (5.7 Joules) 6.4ft.lbs.(8.7Joules)
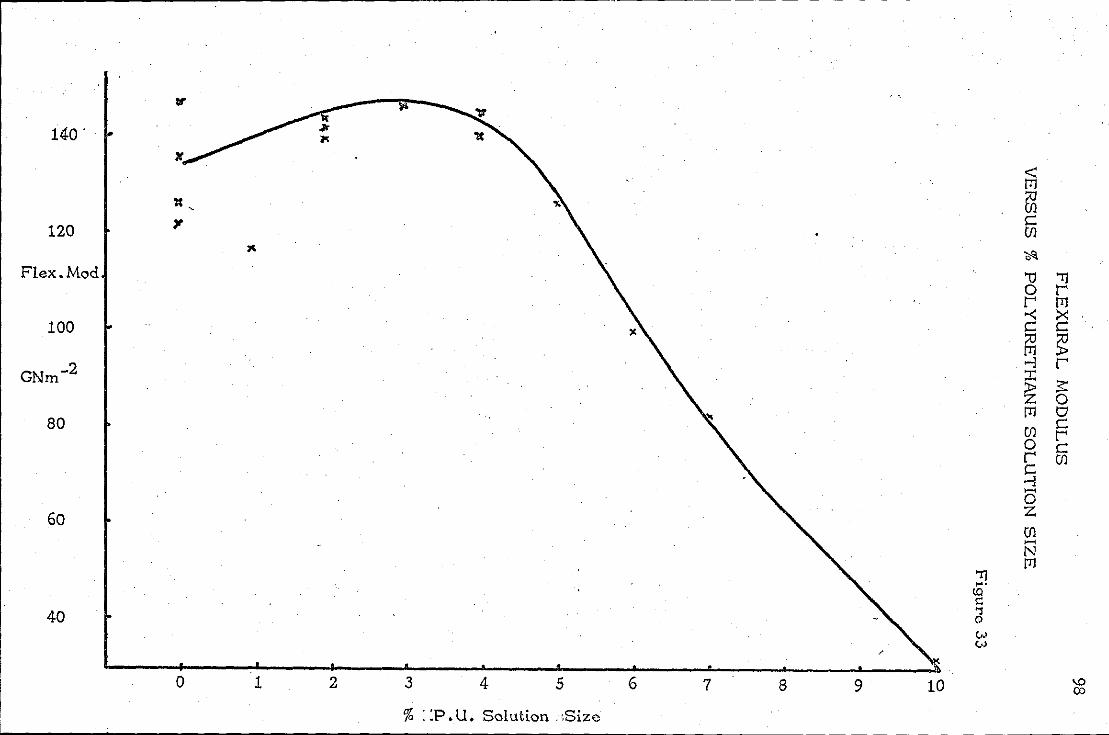
140 .
t=ii ~ ~ ~ C
120 Ul ,. ~
Flex.Mod '0 'TJ 0 l' l' [TJ -< ><
100 c c ;:0 ~ [TJ '""'l l'
GNm -2 :r: :s: ~ 0 [TJ 0
80 en C l' 0 C
l' en C '""'l .... 0
60 z en .... N [TJ
'TJ .... la \:: '1 40 (ll
", ("
0 1 2 3 4 5 6 7 8 9 10 ~ Q:)
% ::P.U. Solution .;Size

prepared for falling-I,eight impact tests had such a low impact strength
that they are not worth discussing. Their impact strength reflects
their matrix strength, as under impact the matrix split along the
fibre axis.
iig~re 3.Jshows the slight rise in (5-10%) flexural modulus with a thin
, (3% solution) coating of polyurethane on the fibres. This coating at
the 3% solution level amounts to 10% of the resin in the matrix. The
flexural moduli were high (145 GNm -2), compared to the Courtaulds Grafil
Data sheet (Appendix 1). It was expected as shown that the composite
would become more flexible with thicker coatings on the fibre, especially
as the polyurethane was compatible with th~ epoxy. The improved modulus
with thin polyurethane coatings could be explained by an analogy to the
I tie-coat I or undercoat adhesive treatments sometimes require. The
polyurethane could act as a tkeyt coating to which the epoxy resin matrix
could more easily adhere. Another explanation of the improved modulus
with a thin flexible polyurethane' coating on the fibres could be that
fibre re~alignment occurs under stress. The fibres could more correctly
take up positions in 'the composite so as to transfer stress between the
fibres and carry equal loads.
!igure 34 shows how the interlaminar shear strength of the composite was
reduced with an increasing amount of polyurethane coating. The 4%
solution coated fibre specimens showed a 25% drop in inter-laminar shear
strength. This simply reflected the reduced strength of the matrix with
coated fibres. The reduced I.L.S.S. could be improved by precuring the
coating a little if necessary as shown in Section 10.5. The balance of
properties selected would depend on the composites t requirements.
The most important variable in composites is the fibre volume fraction
although to a much lesser extent, the following can "all affect composite
properties:-
99
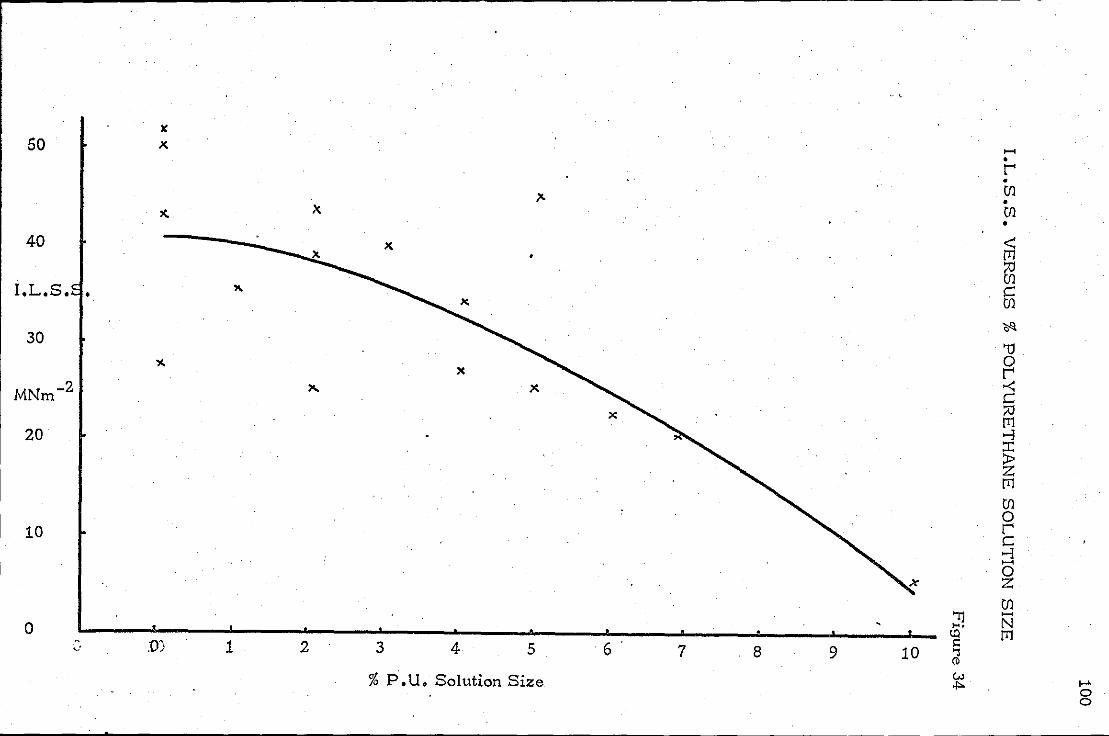
x 50 x. ......
• l' • (fl
)<. • (fl •
40 < fJ1
~ I.L.S. " C • (fl
30 ~
'"0 0 L'
-2 .-< MNm C ;U fJ1
20 >-l ::r:: :t> Z fJ1 (fl 0 l' 10 c: >-l ...... 0 Z (fl
'1l ...... .... N 0 to fJ1 h ~
.D) 1 2 3 4 5 6· 7 8 9 10 '1 ,: (D
% P.U. Solution Size w ...... ol'> 0 0
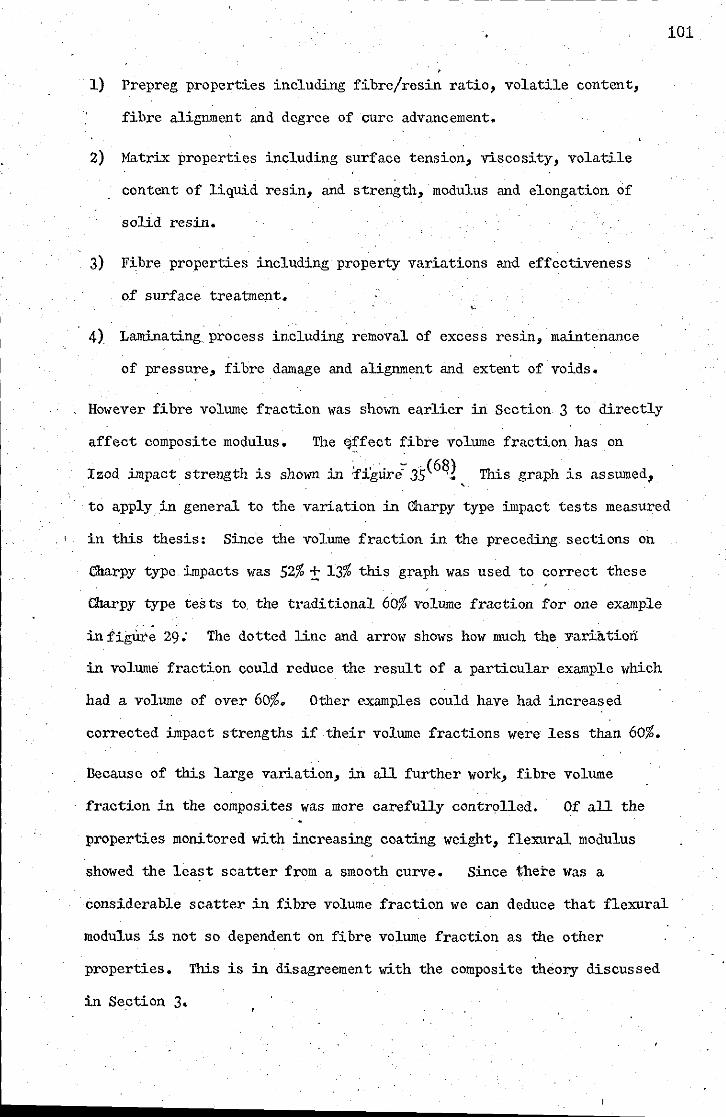
- _._-------------------------
101
1) Prepreg properties including fibre/resin ratio, volatile content,
fibre alignment and degree of cure advancement.
2) Matrix properties including surface tension, viscosity, volatile
content of liquid resin, and strength, modulus and elongation of
solid resin.
3) Fibre properties including property variations and effectiveness
of surface treatment.
4) Laminating process including removal of excess resin, maintenance
of pressure, fibre damage and alignment and extent of voids.
However fibre volume fraction was sho~n earlier in Section 3 to directly
affect composite modulus. The ~~fect fibre volume fraction has on
Izod impact strength is shown in :figtirec- 35(6~2 This graph is assumed, ,
to apply in general to the variation in Charpy type impact tests measured
in this thesis: Since the volume fraction in the preceding sections on
Charpy type impacts was 52% ± 13% this graph was used to correct these
Charpy type tests to. the traditional 60% volume fraction for one example
in figure 29" The dotted line and arro\v shows how much the variation
in volume fraction could reduce the result of a particular example which
had a volume of over 60%. Other examples could have had increased
corrected impact strengths if their volume fractions were less than 60%.
Because of this large variation, in all further work, fibre volume
fraction in the composites was more carefully controlled. Of all the
properties monitored with increasing coating weight, flexural modulus
showed the least scatter from a smooth curve. Since there was a
considerable scatter in fibre volume fraction we can deduce that flexural
modulus is not so dependent on fibre volume fraction as the other
properties. This is in disagreement with the composite theory discussed
in Section 3.
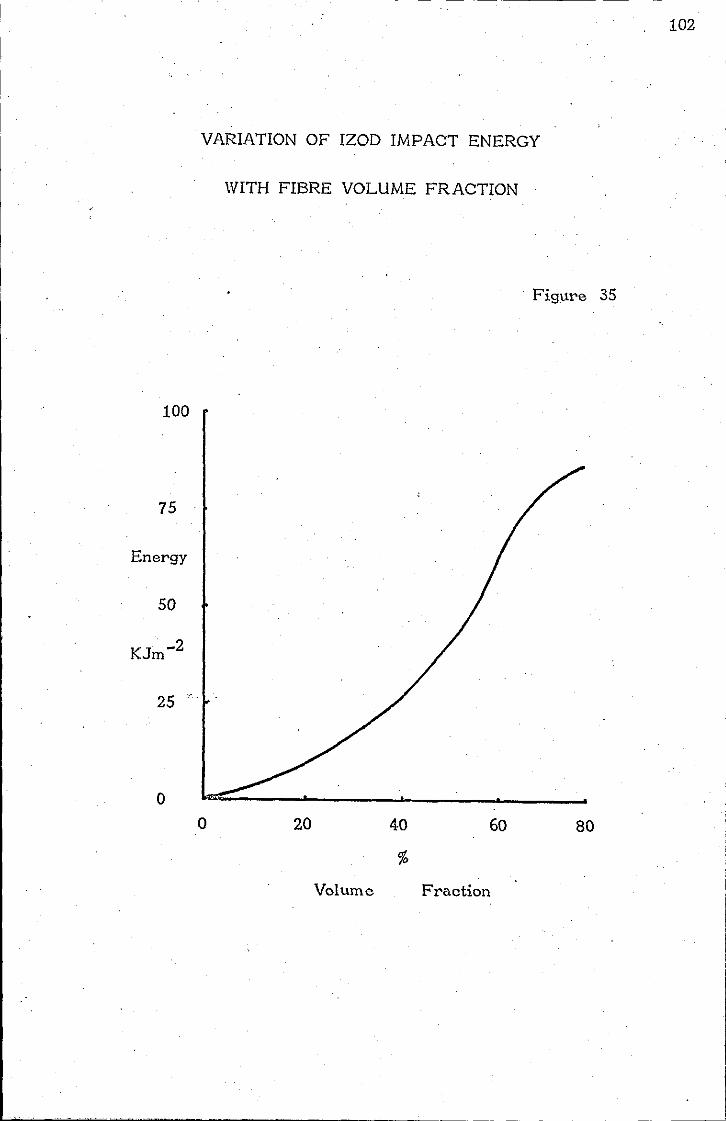
I
I
I
VARIATION OF IZOD IMPACT ENERGY
WITH FIBRE VOLUME FRACTION
Figure 35
100
75
Energy
50
KJm-2
25 .'.
o o 20 40 60 80
%
Volume Fraction
102
Fairbairn et alia(69) have shown that composite properties and
I.L.S,S. in particular always show some random variation because of
the listed reasons above. The variation they found for I.L.S.S.
tests was ±20% even in composites made under carefully controlled
identical conditions. From all the available evidence it seems
that flexural modulus was the least affected by fibre volume fraction
-and impact strength the most affected. This initial work was by
way of introduction to-composites .and in the next stage of the work
in this thesis processing requirements were much better understood and
monitored.
Their was a slight variation in the lveight of coating on a fibre as
a result of impregnating the carbon fibres lvith a specific solution
concentration. However this variation could have had only a very
small influence on the impact strength for example, as indicated by
the solid arrows on M1.1re:29. The impact strength of the composites was
their most variable property. After precuring the polyuretilane coating,
before preparing the prepreg, the physical properties of the ensuing
composite deteriorated. This deterioration supported the hypothesised
graded interface for the precuring reduced the graded interface which
it was anticipated would lead to improved impact strength. The presence
of a graded interface was also supported by the lack of success in the
photomicroscopy of the etched surfaces.
103

,----- ------------------------------------------------------
11. TOUGHlIl\'ED HATRICFB FOR TOUGHEt\ED CcMPOSITES,
11. Ofa terlals Selection
, Courtau1ds HT-S (1rafi1 carbon fibre was again used. Blending
polyurethane ,rubbers 'and epoxy resins gives matrices whose toughness
varies from, that of epoxy 'to polyurethane. Du Pont issue a Dulletin(62)
on mixtures of epoxies and polyurethanes, using a polyurethane rubber
such as Du Pontl s Adiprene L-167 and an epoxy such as Shell! s 828.
The mixtures can be cured I"ith HOCA(4,4' methylene-bis 2- chloroaniIinG),
to give a resin lath a reasonable pot life. Other curing agents are
available, but with a high percentage of polyurethane often give a
104
short Ipot-lifel • Such curing agents arc methylene dianiline and m-phenylene
diamine. Hethylene dianilinc is particularly interesting hOl,ever
because it g:hcs a 50% stiffer and 25% tougher matrix than }lOeA.
The % by weight of curing agent X required is given by the follolang
equation.
X = }I
4 [~ + b (% NCO) -,
2,100 j
, ' M = molecular I"eight of curing agent (e g MOCA 267)
w = weight of epoxy resin in the blend
e "" epoxide equivalent of the epoxy resin( e g Epikote 828-190),
b = weight of polyurethane in the blend
%NCO= isocyanate content of polyurethane prepolymer. (e g Adiprene 1-167 6.30)
The range of properties available from blends of the epoxie~ polyurethane
rubber and curing agents Ivas investigated in order to ascertain
which materials might give improvements in the toughness of a composite.
The properties obtained from .the matrix blends Ivere compared to those
properties published by Du Pont in their bulletin, and e:J.cperience gained
on the handling requirements of the blends.

------- .. - ------------------------------
Four materials I"ere prepared for tes ting ::
o B 1- 100 parts Adiprene,L-167 19.5 parts MOOA cured for 1 hI' at 1000
B 2·- 70 parts L-167 30 parts Epikotc 828 28 parts MOOA cured for 4 hI'S at 140
00
B 3 - 50 parts L-167 50 parts Epikote 828 33.5 parts MOOA cureg for 4 hrs at 140 0
. 0 B 4 - 100 parts Epikote 828 35.5 parts }lOOA cured for 5 hI'S at 140 0
Du' Pont recommel).ded that a: little more than the stoichiometric
amounts of· MOOAshould be used, whether this Ims because of handling
losses or chemical losses·was not made clear.
105
Very few curingJgents arc suitable for both epoxy resins and polyurethane
prepolymers. Besides HOOA as mentioned above methylene dianiline I .
(4,4 Diaminodiphenylmethane) (DDH) could be used, but for mixtures
of the two, the 'pot life' Ivas too short (seconds). To SlOlv dOlm
the reaction of DDH vith the blend the possible courses are
1. to make a salt of DDH vith lactic acid
DDM
C¥3 ,HO - 0 -- coqn .
I H,
either I mole of DDM to 1 mole of lactic acid or 2 moles of lactic acid
2. to make a salt of DDM with succinic acid
.JlOOOC:Itz -. O;F:IZ .OOOJI.
again 1 mole of DDH to 1 mole or 2 moles succinic acid.
3. to make a salt of DDH Inth glacial acetic acid GJ13 000)1
4. to complex DDM lYith Sodium or Potassium Lactate using 1/2% to 2%
·5. or to use instead p-phenylene diamine.
I
! I
11.2
,.
P-phenylene diamir.e gives no better physical properties than HOCA
according to the Adiprene bulletin. With lactic acid because of the
volatiles given off dur:ing the reaction, the cast rcsin produced was
unusable. Also, the pot life ,vas only slightly extended for this
system. It was considered that because of the volatiles given 6ff,
lack of improvement in physical properties or short pot life, OrLlY
MOCA could be used as a curing agent for blends of the polyurethane
prepolymer and epoJ.')' resin.
The impact strength and flexural moduli:. of the four res:ins moulded were
tested. The, results are shown :in the table and in figur~ 36, and were
compared to those published in the Du Pont Adiprene bulletin.
TAIlLE 12 Matrix Properties
Samples
El
B2
B3
~
Impaot Strength
K]m-2 ,
None (Bends)
25.1
4.4
2.9
.. :.--
-2 Flexural Modulus GNm
0,0480
:.0.180
1.40
2.08
TIle impact strength quoted is the strength of the specimen :in Charpy
type test, divided by the area under the notch.
The area of interest with this blended matrix, obviously lies with the
blend ratios of SO: SO to 70 : 30 polyurethane to epoxy blend.
,Here the flexural modulus is declining and impact strength increasing.
Composite Preparation and Moulding
The curing agent used, MOCA, ~Ias not very suitable for preparing ac:
prepreg. HOCA cures at room temperature, and even at OOC HOCA will
cure a polyurethane epoxy blend slowly. Consequently, the carbon
fibres were preimpregnated with a solution of the epoxy/polyurethane/
curing agent mixture, and the composite pressed and cured within an hour
of impregnating. The procedure ,>,as to prepare a solution of the
106

-----------------------
107
BLENDED l'ilATRIX PROPERTIES
Figures 36
As Tested Impact Strength Du Pont Bulletin
20 . 2.0
KJrrt
10
, v -Flexural Modulus
2.0
1.0
o 50 100 o 50 100
P • P • H. Adiprene L-167 in a Blend wi th Epikote 828
resins and curing agents in ethyl acetate and then extract.' the
solvent from the composite after impregnation, by using a vacuum.
o The composites ,,,ere moulded at 140 C. The viscosity of the blend
rose 'luickly in the press at this temperature, and it "as necessary
to use a high clamping forced on the prepreg 1 ton(15 }1N/m2 }in order
to consolidate it.
11"0 specimen sizes "le re moulded f 2" (51 mm) x 2" (51 mm) x
0.1" (2.5 mm) for falling weight impact tests, and a 12" (300 mm)
X 0.5" (13 nun) x 0.2" (5 mm) specimen for testing flexural modulus,
lLSS, area under lLSS curve and Charpy t:ype impact.
, 11:3 Resul t.§
As mentioned in the discussion on the fibre-coated specimen result7 the most important parameter to be monitored, besides the blend-
ratio ,,,as the fibre volume fraction of a composite. In the follwing
work, these two parameters were continuously monitored. Thirteen
composi tes were mouLded, each ,dth a different fibre volume fraction
and blend ratio of polyurethane to epoxy. Contour graphs 'vere then
drawn, fol1m.,ing the techni'lue of "Berts ch (70), showing ho,,, each of four
physical properties varied with the blend ratio and fibre volume fraction.
These four physical properties were LLSS, flexural modulus, area under
lLSS curve and Charpy type impact strength. The impact strength
results were corrected fpr area under the notch, and are 'luoted as
-2 KJm ,although the area did.not vary luuch from one specimen to
another.
Since falling weight impact tests re'luire a considerable number of
specimens, only one sample type (,dth a fixed fibre content and blend
ratio) lVas used for this test at the most interesting blend ratio.
An attempt lVas made to monitor void content, but because the density
of the matrix and the fibre volume fraction varied throughout a
specimen inconsistent results lVere obtained. However, it became
103
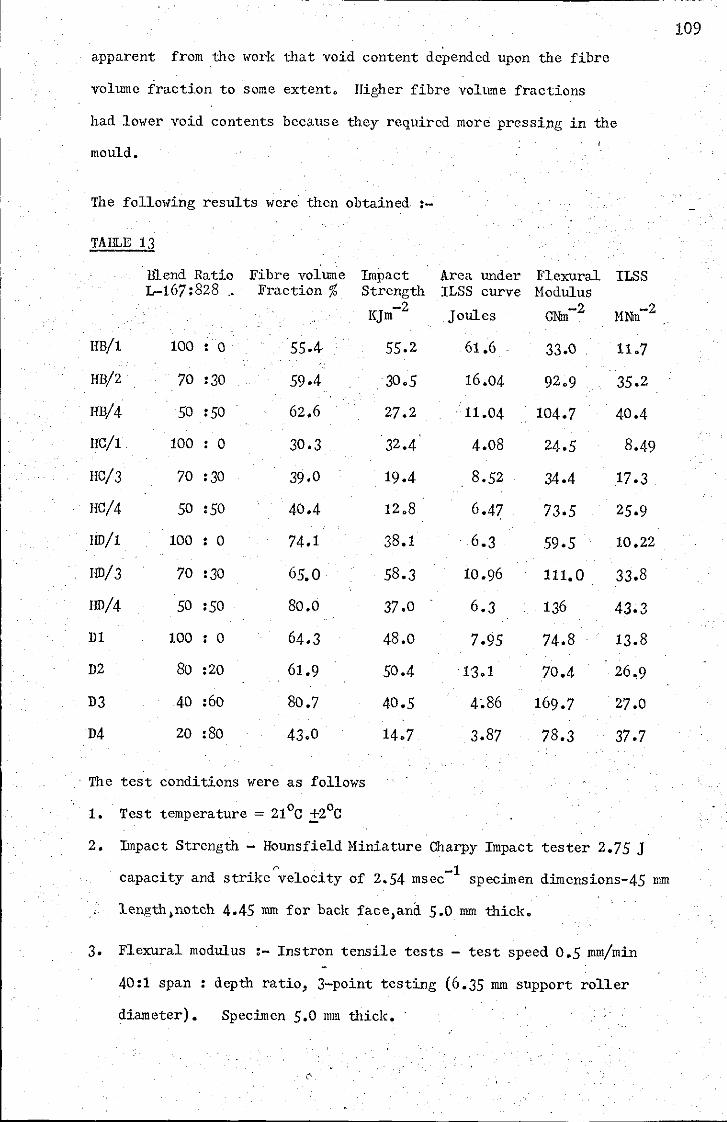
apparent from the "ork that void content depended upon the fibre
volume fraction to some extent. Higher fibre voltune fractions
had lower void contents because they required more pressing in the
mould.
The follOlving results were· then obtained :-
TAIlLE 13
HB/1
HB/2
HB/4
HC/1
HC/3
HC/4
1ID/1
[ro/3
[ro/4
D1
D2
D3
D4
Blend Ratio L-167:828 .'
100 : 0
70 :30
50 :50
100 : 0
70 :30
50 :50
100 : 0
70 :30
50 :50
100 : 0
80 :20
40 :60
20 :80
Fibre volume Fraction %
55.4
59.4
62.6
30.3
39.0
40.4
74.1
65.0
80.0
64.3
61.9
80.7
43.0
Impact Strength
KJm-2
55.2
30.5
27 .2
32.4
19.4
12.8
38.1
58.3
37.0
48.0
50.4
40.5
14.7
. The test conditions were as follows
o 0 Test temperature = 21 C ±2 C
Area under Flexural I18S ILSS curve Modulus
Joules GNm -2 MNm-2
61.6
16.04
11.04
4.08
8.52
6.47
6.3
10.96
6.3
7.95
13.1
4~86
3.87
33.0
92.9
104.7
24.5
34.4
73.5
59.5
111.0
136
74.8
70.4
169.7
78.3
11.7
35.2
40.4
8.49
17.3
25.9
10.22
33.8
43.3
13.8
26.9
27.0
37.7
2. Impact Strength - Hounsfield Miniature Charpy Impact tester 2.75 J
capacity and strike'~elocity of 2.54 msec-1 specimen dimensions-45 mm
length.notch 4.45 mm for back face.and 5.0 mm thick.
3. Flexural modulus :- Instron tensile tests - test speed 0.5 mm/min
40:1 span: depth ratio, 3-point testing (6.35 mm support roller
diameter). Specimen 5.0 mm thick.
109

4. 1LSS test :- 1nstron tensile tests - test speed 1 mm/min, 5 : 1 span
d~pth ratio, 3-point bend test (6.35 MU support roller diameter)
specimen 5.0 mm deep.
11.4 Falling-l{eight Impact Tests
Composites with a matrix ,,,hose blend ratio was 70 parts Adiprene
1-167 to 30 parts Epikote 828 cured with 28 parts of HQeA were prepared
for falling "eight impac;t tests. This ratio was judged to give the
most interesting combination of properties, together "'ith a high fibre
volume fraction (70%J.
The damage which occurred ,vith repeated impacts was again monitored
by measuring the flexural modulus at 450 to the t",o fibre directions.
2" (51 mm) x 2" (51 mm) x 0.1" (2.5 mm) spec:linens were moulded. For
tilis series of tests onlybiaxially orientated fibre composites were
prepared for as discussed, the previously prepared unixially orientated
composites have only a very low impact strength. Six samples ",ere .
prepared for testing lvith the above blend ratio and biaxially orientated
fibres. Four samples had a 'fibre volume fraction of 64% ± 3% and
2 samples of 49% + 2%.
The tests as before were carried out in accordance with B.S. 306B with a
drop height = 2 ft (610 mm)
impact probe = 0.5" (12.5 mm) diameter,
and test temperature = 210 C ± 20C.
110
,
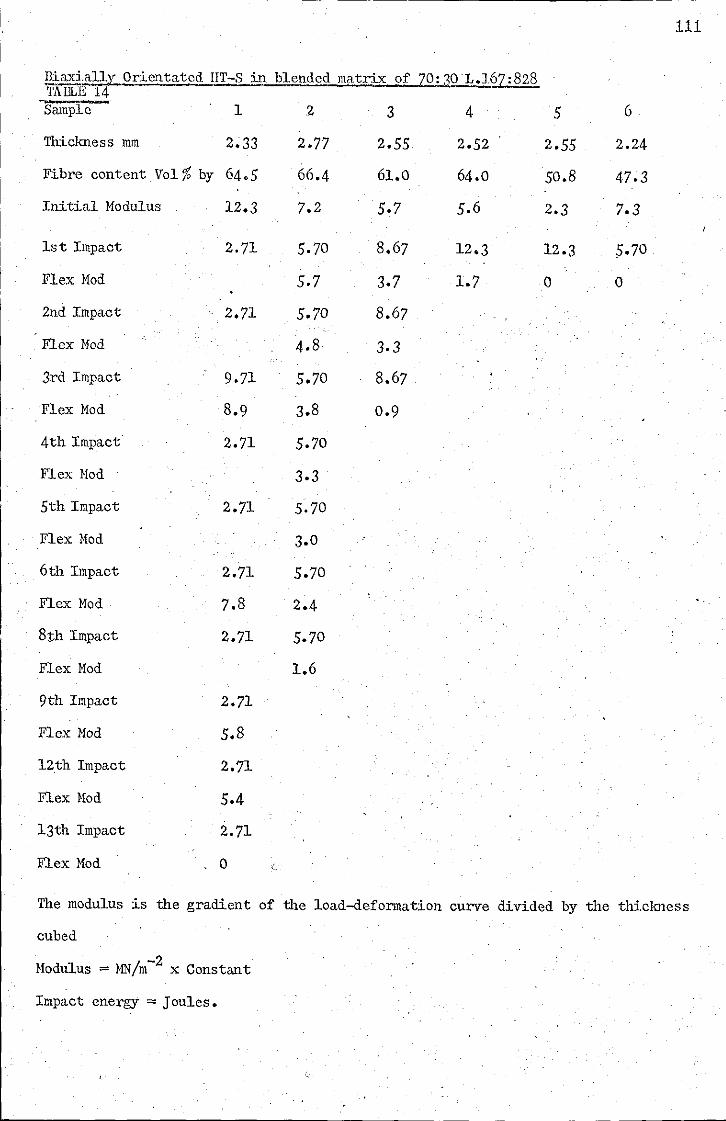
il.iaxi·ally Orientated HT-S in blended matrix of 70qOL.167:828 TAllLE 14
1
Thielmess mm
Fibre content Vol % by 64.5
Initial Modulus 12.3
1st Impact
Flex Hod
2nd Impact
Flex Hod
3rd Impact
Flex Hod
4th Impact
Flex Hod
5th Impact
Flex Hod
6th Impact
Flex Hod
8th Impact
Flex Hod
9th Impact
Flex Mod
12th Impact
Flex Mod
13th Impact
Flex Mod
2.71
2.71
9.71
8.9
2.71
2.71
2.71
7.8
2.71
2.71
5.8
2.71
5.4
2.71
o
<2 3 4
2.77 2.55 2.52
66.4 61.0 64.0
7.2 5.7 5.6
5.70 8.67 12.3
5.7 3.7 1.7
5.70 8.67
4.8 3.3
5.70 8.67
3.8 0.9
5.70
3.3
5.70
3.0
5.70
2.4
5.70
1.6
111
5 6
2.55 2.24
50.8 47;3
2.3 7.3
12.3 5.70
0 0
The modulus is the gradient of the load-deformation curve divided by the thielmess
cubed
I -2 Modulus = HN m x Constant
Impact energy = Joules.

The energy which the blended matrix composite ,absorbed, as tested by
the falling-'feight impact, was similar to the coated fibre composites,
that is 12.3 Joules. The blended matrix composite had a very low
flexural modulus at 4.50 to the fibre orientation. This Imf value
reflected the 10lfer modulus of the matrix. The flexural modulus did
not fall off }ath increasing impact damage as in previous tests.
HO'fever because of low initial modulus this Ims not significant.
The damage arising from the impacts was neither localised as Inth the
coated fibre composites, nor, did the composite break up as with the
uncoated fibres in the epoxy matrix. The specimens tended to shear~
one fibre layer, tearing from another.
11.5 Discus~
A series of contour graphs was drawn from'the table of data in section
11.3 which shO\( that virtually any composite properties can be obtained.
The Charpy type :impact strength contour graph (iigure 37) indicates that
a maximum amount of energy was absorbed, when the fibre content was
67% by volume, in a matrix containing 73 parts of Adiprene L-167 to
27 parts Epikote 828 (plus HOCA) .J?resumably at 10lfer epoxy ratios the
carbon fibres were not fully utilised in absorbing energy. At higher
fibre volume fractions the fibres 'fere not wetted by the resin and
consequently the energy to break each fibre could not be utilised. At
lower fibre volume fractions and higher epoxy resin ratios in the blend
a lower impact strength would be expected.
112
The contour graph showing the area under the inter-laminar shear strength
curve(f'lgure 38), illustrates hOlf this touglmess parameter was dependant
on both the matrix and fibre volume fraction of .a composite. In any
test looking at energy under a stress-strain curve, a balance between
elongation and stiffness produces the highest value. The ILSS test

113
CONTOUR GRAPH SHOWING IMPACT STREl'JGTI-j (CHARPY TYPE)
Varying with Resin Flexibility and Fibre Volume Fraction /
Figure 37
• ·...----...--'""1100
20
80
C-Fibres
% by
60
L---~----~----~----~--~~~~----~--~O 20 40 60
P.P.H. L-167 in a blend with 828
. KJ -2 Contours are ln m
80
L-167 - Du Pont's Adiprene L-167 828 - Shell's Epikote 828 Plus Moca
100

114
CONTOUR GRAPH SHOWING AREA UNDER THE I.L.S.S. CURVE
Varying with Resin Flexibility and Fibre Volume Fraction
Figure 38
___ ~_. ______ ~~ ____ ~ ____ ~. ______ ----~~----?-----,100
C-Fibre
%by I
VolumE? I
14
L-----~----~----~----~----~----~~ ________ ~20 20 40 60
P.P.H. L-167 in a blend with 828
Contours arE? in Joules
L-167- Du Pont's Adiprene L-167 828 - Shears Epikote 828 Plus Moca
80 100
115
carried out, showed tIns balance !;hen the ratio of the blend was
70 parts 1.-167 to 30 parts 828 and the fibre volume fraction was 55%.
Naximwn toughness for both area under 11.88 and Charpy type impact could , be achieved with a 65% fibre volume iraetion and 70:30 L-167 : 828
matrix blend as tested in the falling weight inlpact test. A reduction
in flexural modulus to 100 GNm-2 and 1L88 to 30 NNm-2 coincided with
the composite having a miL'Cimum toughness.
The falling l/eight impact tests (12.3 Jotlies) carried out on these.
tmaximum toughness f composites demonstrated that, according to tIns
test, the improvement in touglmess \Vas equal to the coated fibre composites.
This fmaximum toughness' composite had a soft matrix, which a11011e<;l
the probe of the falJJ.ng "eight to push through the matrix and force
the fibres apart. The composite was torn apart under repeated
impact. lvith a 1011er fibre volume fraction (50%) the composites with
a tough blended matrix showed no improvement in touglmess compared to
a standard composite (5.3 Joules).
The change in 1L88 and flexural modulus (f:Lg;res 39,40), with matrix
blend ratio and fibre content lVere as expected. The fall in modulus
occurring lYith the fall in modulus of the matrix. The fall in 1L8S
occurring probably as a result of the drop in matrix shear strength
level.
Bertsch(70) discussed holY errors are reduced in dralVing contour graphs.
The symmetry achieved in drawing a contour graph tends to even out any
errors present in the results from which they are drawn. This presumes
that the errors are ra~dom and the property variations lead to smooth
curves. The errors present from the earlier \Vork due to fibre volume
fraction variations, were not present in these contour graphs, because
the variation was monitored.
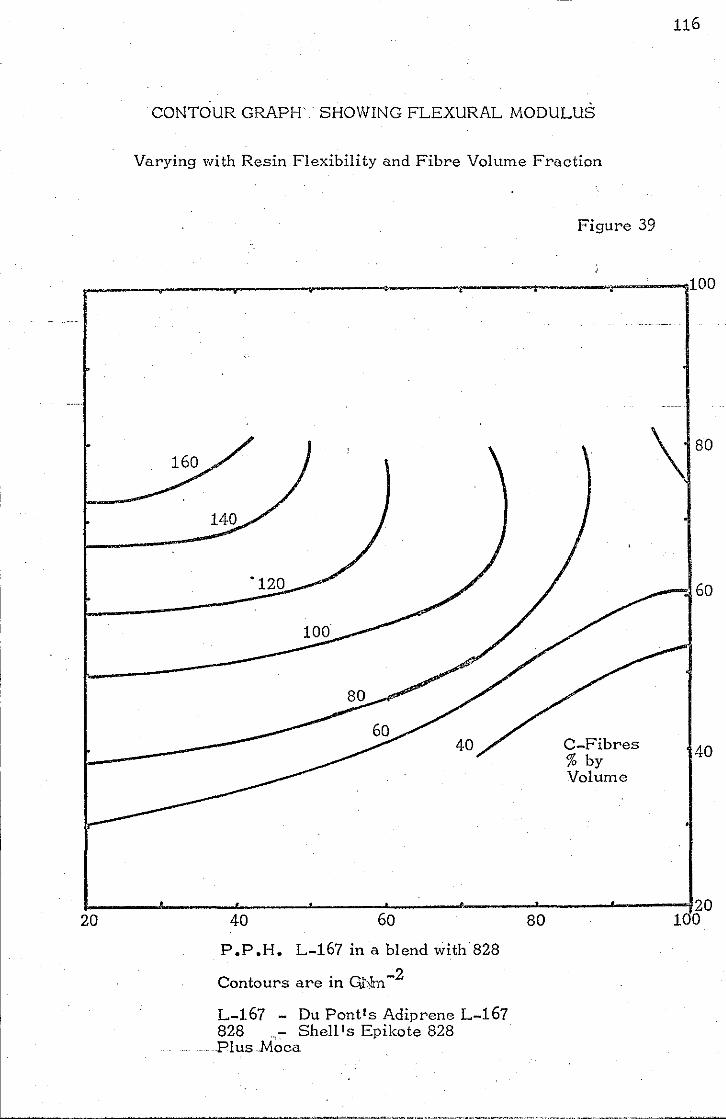
116
CONTOUR GRAPH SHOWING FLEXURAL MODULUS
Varying with Resin Flexibility and Fibre Volume Fraction
Figure 39
r-____ -r ____ ~ __ --__ ~-----.,------~-----T------,~----~100
C-Fibres % by Volume
"--..160
40
~----~----~----~----~-----d'----~------~----420 20 40 ~ 80 WO
P.P.H. L-167 in a blend with'828
Contours are in QlJm-2
L-167 - Du Pont's Adiprene L-167 828- Shell's Epikote 828
... Plus Moca
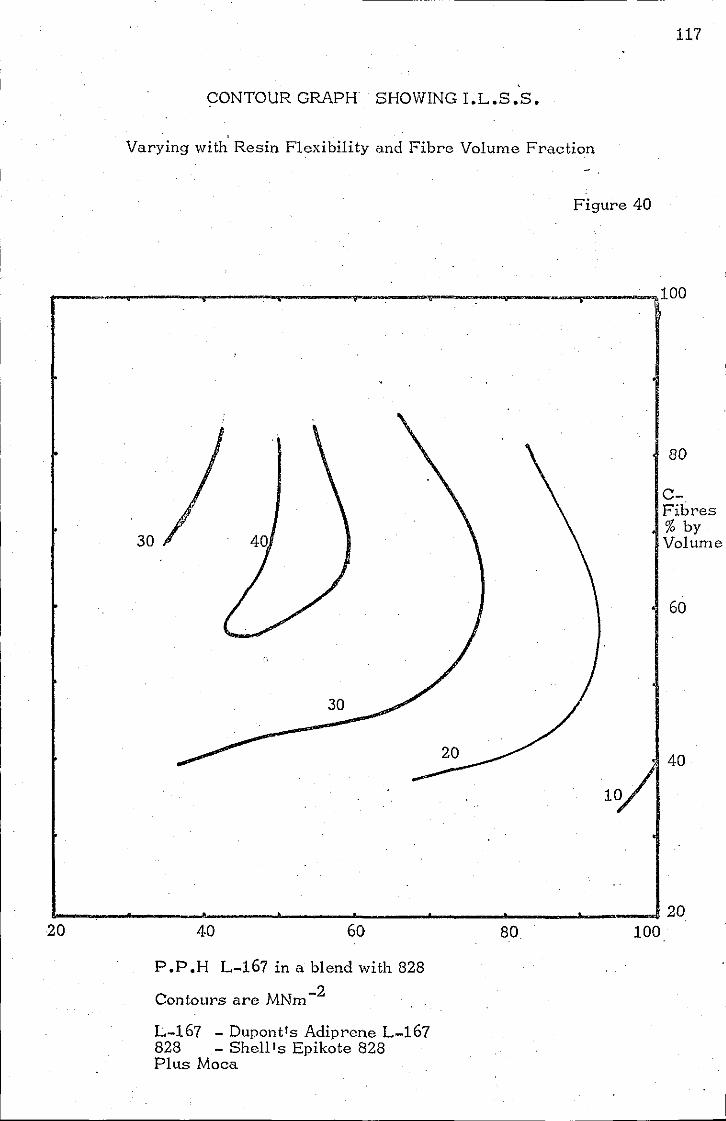
CONTOUR GRAPH SHOWING I.L.S.S.
Varying with Resin Flexibility and Fibre Volume Fraction
Figure 40
30
30
117
80
CFibres % by Volume
60
,40
L-~ __ ~ ____ ~ ____ ~ ____ ~ ____ ~ ____ ~~ ____ ~ __ ~20
20 40 60
P.P.H L-167 in a blend with 828
Contours are MNm-2
L-167 - Dupont1s Adiprene L-167 828 - Shellls Epikote 828 Plus Moca
80 100
-- --~---------------~----------------------------------
Lastly the scanning electron microscope pictures taken of the Charpy
type impact failure surfaces revealed some interesting features
" (Plates 12· and 13). lvith the lw impact strength specimens the
failure was mainly tensile~ As the impact strength of a type of
composite was increased, the fracture surface displayed a larger area
of compressive type failure, ~r.ith a considerable amount of fibre debris
on this surface.
A high impact composite defomed more before failure under impact. A
composi te grossly deformed (under impact), but not yet failed, was
. mainly under compression. The fibres had not broken on the side
remote from the impact under a tensile stress. Instead the side of
the impact under compression,· locally buckled to absorb energy. For
low impact strength composi.tes the fi.bres broke on the far side from the
impact. The crack travelled tm,ards the impact point, and the
composite failed. N. Hancox of iHarwell found.a similar behaviour
118
I
I
I
I
I
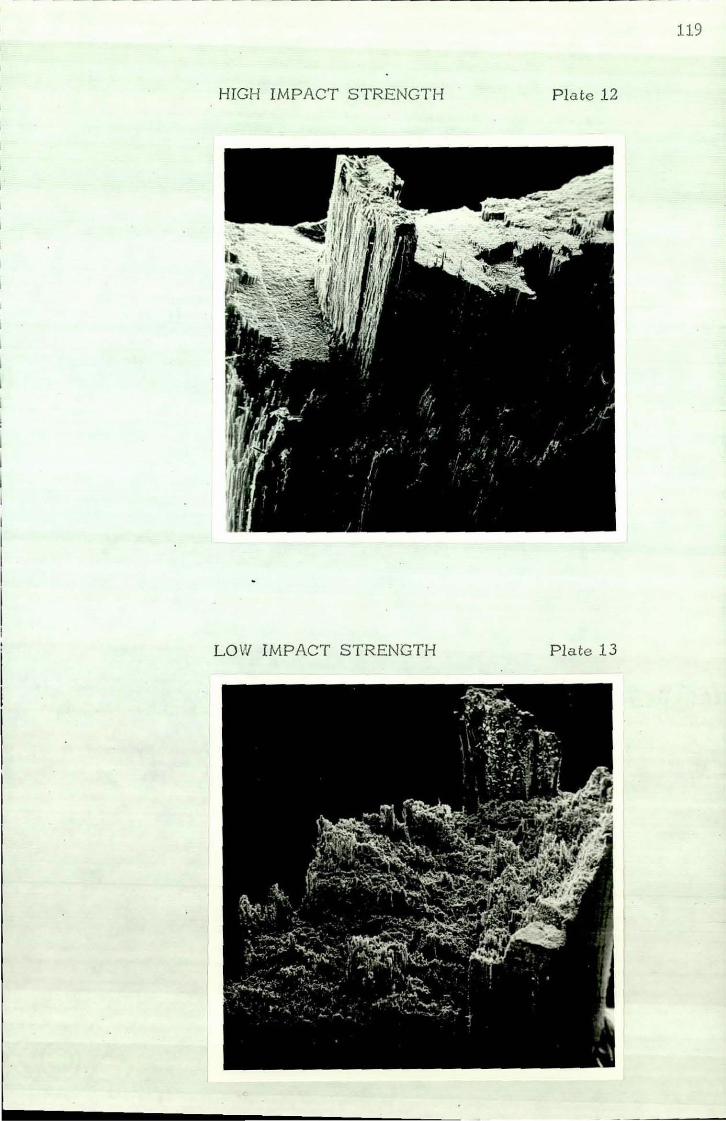
119
HIGH IMPACT STRENGTH Plate 12
LO W IMPACT STRENGT H Plate 13

- --------------------------------------------------
12. TOUGHENED COMPOSITES BY A TJlliORE'rICAI. APPROACH
12.1 Introduet:Lon
In section 9.3 it " as es timatcd tha t the fracture t ouglmess of composites
-2 - 2 couJ.d be quadrupled froll. 175 K] ou1es III to 700 K]oulos m when the
-2 matrix " as changed from epoxy resin with a shear strength of 50 HNm
to say polyurethane rubber "'ith a sh ear strength of about 10 HNm- 2•
The theme of this section \Vas t o approach the i deal system by a
theoreti cal instead of technological approach.
120
Carbon fibre compos i.tes are r equired to have high tensile moduli, and these
can only be achieved as sholm in section 11 by high matrix modu.li.
Lo,,' shear strength materials which could i mprove fracture toughness
usually have l ow tcnsil e modu1:i. . S:mce elonga t ions in shear and
tensile modes are related, a matel~ial is r equred h,hich has a high
tensile modulus and strength as \vell as a 10\< shear modulus and strength.
Generalised elasticity l a,{s relate shear modu1US G and t ensile modulus
E by equation 14.
G = E 14 l,.here 'Y = poisson l s ratio. 2(1 +)1 )
For the above r equirements a high 'Y i s r equired . The maximum
for i sotropic materials "hich cou;Ld be used as a matrix occurs in rubbers.
They have a 'I of a 1/2.
1'he ideal material ,{ould have a high i.ni tial modu1us, to give the
composite a high initial modulus and then plas ticall y defonn at a 1 0'"
shear level.
The material " ou1d shear at a steadily increas ing l evel so as to absorb
a steadily increasing amount of en ergy . Finally the stress "ould
suddenly rise l eading to further fibre breaks "hich ",ould absorb more
energy. Such an ideal material could have a stress- straj-11 relationship
as found in Figure 41.
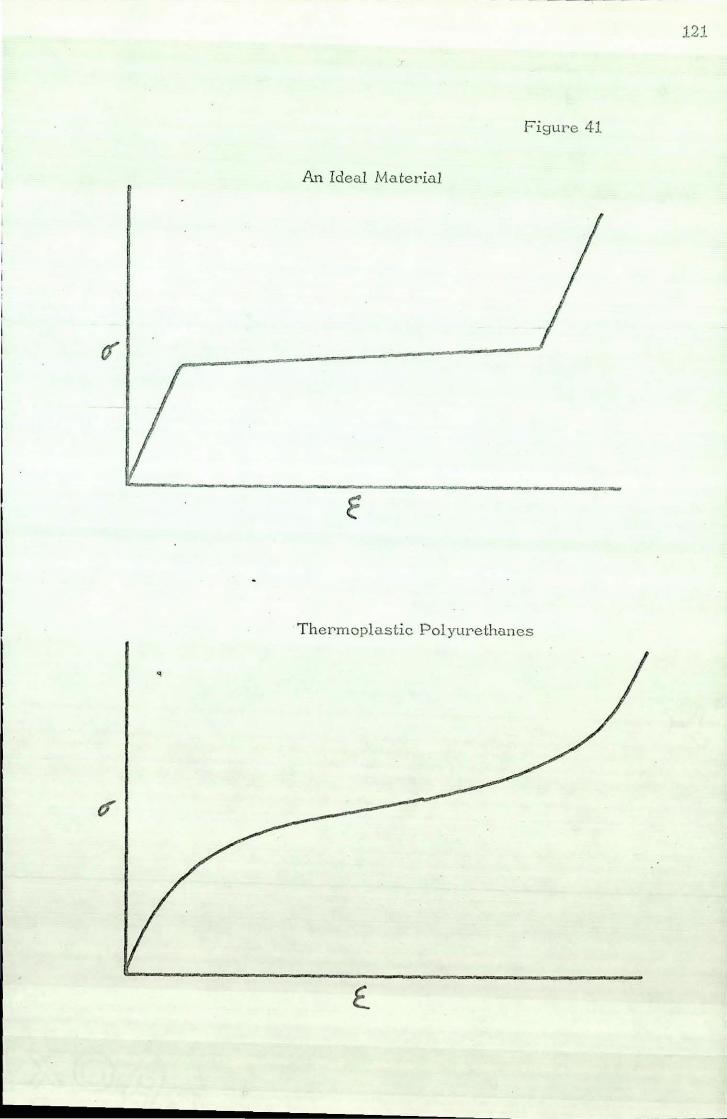
121
Figul'e 41
An Ideal Materia l
~--.---------------------------------
T he rmoplastic Polyur e thanes
q
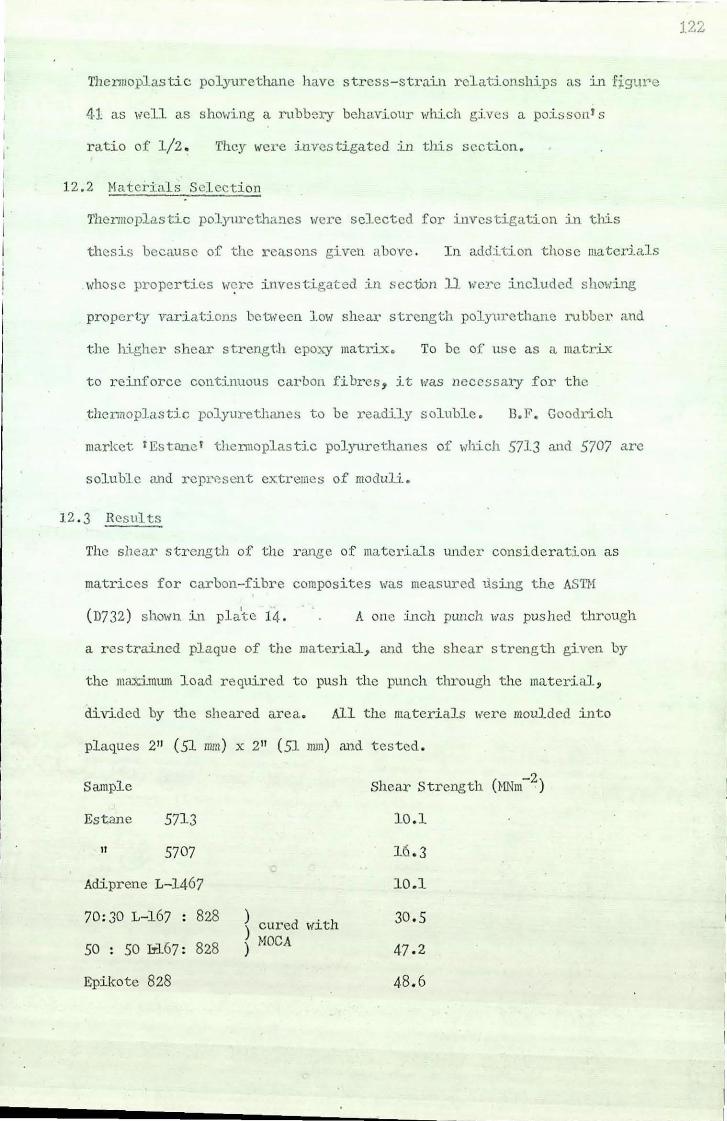
122
Thenlloplas tic polyuretha.ne have stress-strain relationships as in figure
41 as \Vell as showing a rubbery behaviour ' ''hich gives a poisson's
ratio of 1/2~ They I{ere investigated :in this section.
12.2 Matcicial s Selection
Thermoplastic polYlll'etha!les Ivere selected for investigation in this
thesis because of the reasons given above . In addition those materials
"hose properties \V~re investigated in section 11 werc included shm'li ng
property variations bcuveen l ow shear streng'ch polyurethane rubber and
the highel' shear strength epOA')' matrix. To be of usc as a matrix
to r einforce continuous carbon fibres, it \fas necessary for the
thermoplastic polyurethanes to be readily soluble. 13.1". Goodrich
market ' Estnne ' thermoplastic polyurethanes of which 5713 al1d 5707 are
soluble and repr'~sent extremes of moduli.
12.3 llesu1 ts
The shear strength of the ral1ge of materials under consider ation as
matrices for carbon-fibre composites was measured using the ASTI!
(D732 ) shOlm in pla''oe 14 . A onc inch pWlCh was pushed through
a restrained plaque of the material, alld the shear strength given by
the maximwn l oad required to push the punch through the material ,
divided by the sheared area. All the materials I,ere moulded into
plaques 2" (51 mm) x 2" (51 llun) md t ested .
Sample Shear Strength (HNm -2)
Est.<me 57]·3 10 . 1
11 5707 Hi . 3
Adiprene L-1467 10 . 1
70:30 L-167 : 828 ) cured lVith 30 . 5
) HOCA 50 : 50 Ui67: 828 ) 47 . 2
Epikote 828 48 . 6
--- - ----- - -'
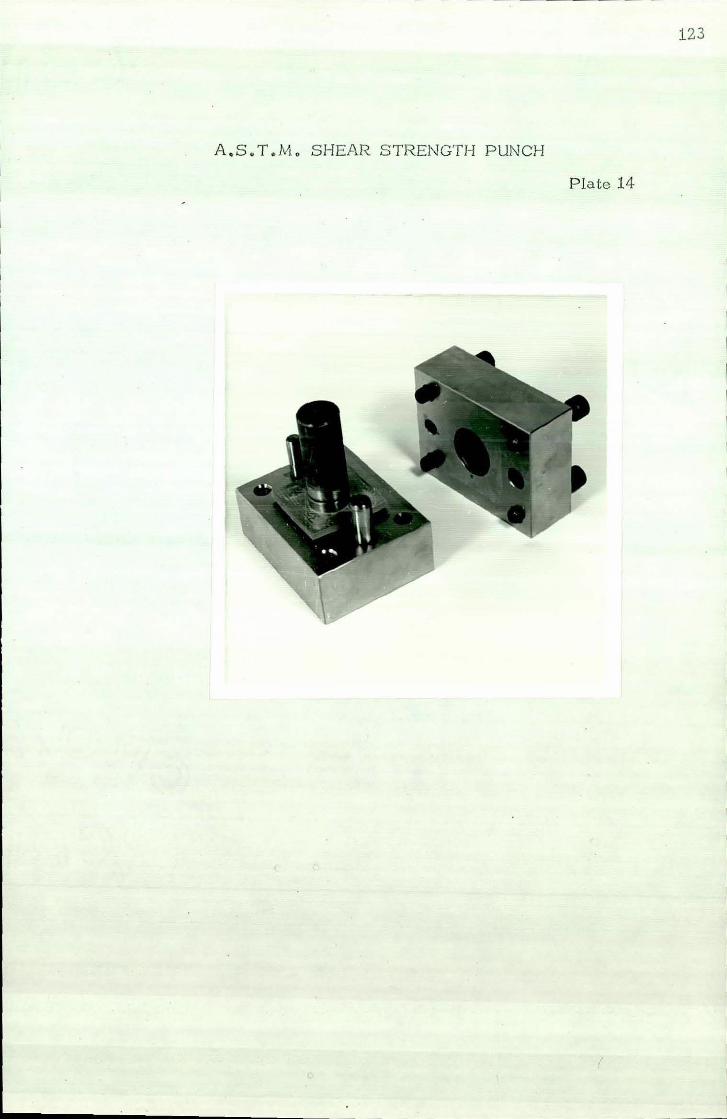
123
A.S. T .M, SHEAR STRH1GTH PUNCH
P la te 14
"
According to section 9 . 3 composites prepared with carbon fibres in
matrices of Adiprene L-167 or Estane 571 3 should have a frac ture
t ouglUless of fmu' times that of compos.itcs 1;hose matrix is Epikote 828 .
Composites lVere made lVith matrices of Estane 5713 and Estane 5707 by
solutci.on impregnati on of carbon fibre s . The thermopl astics I{er e
dissolved in a mix ture of the solvents methyl e thyl ketone and dimethyl
fonnamide . After extracting the solvent from the thermoplastic
composites they \;crc compression mould ed . The resulting composites
had v ery poor physical properties , too poor to t es t. TI1is ",as due to
the poor adhesion ' of the carbon fibres to t he thermoplastic polyurethanes
resulting from their high vi.scosi ty .
The impact fracture touglUless of composit es 1vi th a matrix of Adiprene
- 2 L-167 was about 60 KJ m ; that of composites I{it h a matrix of
Epikote 828 (both cured lVith HOCA) was about 20 KJm-2
• Adiprene L-167
shows rubbei-y behaviour and will have a Pai s sons r atio approacl1ing one
half. TI1is fulfill s' anothe r criterion of obtaining the best tensile
modulus ,vi th a 101; shear modulus. UnfortlUlately Adiprene L-167 does
no t have a good yiel d point as 8hOlm on the i deal stress- strain curve
f i gure 41 and ",i th the thennopl as tic polyurethanes •
.. 12 . 4 Dis cussion
The composites prepare.d did fail over part of their surface area by
pulling the fibres out . The scanning el ectron mi croscope pictures of
an impact failure surface ,·,ith Adiprene L-167 matrix shws (pJa te 15)"
carbon f ibres pull ed from the matrix and the sheared matrix. TIle
composite matrix - 2 had a shear s t rength of 50 MNm • Both the
caleulated energies ,;ere about 10 times too high. The epo:>..'Y matrix
f racture surface showed that only over half the surface did the fibres I
pull out and in those areas :i..n clumps of fibres. For the composite
lVho se matrix ",as Adiprene i ,-l67, l ess than half the fracture surface
124

FI8RES COVERED WITH THE SHEARED
ADIPRENE L -167 MATRIX
Plate 15
125

- --- - ------ -------------------------------
126
showed fibre pull-outs and in even larger clumps of fibres than
with the epoxy matrix. This explains the discrepancies
between the measured and calculated toughnesses.
Matrix Adiprenc L-167 Epikote 828
Calculated fracture energy 700 175 ) -2
)KJ m
As tested It 60 20 )
13. CONCLUSIONS',ON TOUCHNESS
The ~lork in this thesis aimed at investigating toughness by considering
the fibre,matrix and interface in a composite. Hayjng revielved past
research work in thi8 field, certain areas \Yere clarified and developed
by the work described in this thesis.
The system investigated "here Courtaulds HT-8 fibres I,ere coated by a
solution of Du Pontts Adiprene BL-16 cured with DETA and made into a
prepreg \,itll Shell DX23l/DXl25 epoxy resin system yielded particularly
interestiug results. Taking the most significant coating level, using
a 4% solution of the polyurethane to coat the fibres, there was a
significant improvement in fracture behaviour. Short-span bending
tests resulted not in a sudden brittle failure, as with normal carbon
fibre composites, but a more gradual failure behaviour, resulting in up
to three times as much energy absorbed. Impact energy as measured by
the Charpy test only showed a slight improvement. However the more
realistic falling-I,eight impact test demonstrated hOlY the damage due
toi'llpact \Yas localised. In addition the energy required to reduce the
flexural modulus to 50% of its initial value was twice as much for a
composite whose carbon fibres \Yere coated as for a composite whose
fibres were uncoated. The fleA~al modulus was not reduced by the
inclusion of up to 15% by I,.eight of polyurethane into the composite,
but slightly increased. The ILSS of the composite I,as slightly
reduced with increasing polyurethane content as a coating.
The second system inves,tigated using a composite whose matrix was
Du Pont's Adiprene 1-16i' blended with SheUis Epikote 828 cured with
Du-Pont's MOCA gave comparable toughness property improvements, with
particularly significant improvements in Charpy-type impact strength. -;
Figure J1 sho\Ys that improvements by up to 300% were achieved with Charpy-
type tests, compared to composites lath epoxy matrices. The energy
absorbed in fracturing short span specimens was increased by up to 800%.
127
128
" '
as sl101m in ,figure 38. HOI;cver the ILSS lyaS rcduced by 59% and
the flexural modulus by 20% at these levels as shown in -figures' j9 and 40.
The falling-Iv-eight impact tests Rgain demonstrated the increased toughness,
but because the composite was soft its failure mechanism was unsatisfactory,
the composite tending to tear apart.
Lastly the theoretical approach to toughness, although successful in
predicting the energy required to pull-out fibres from different
matrices, did not till,e account of the balance between pull-out and
compressive failure that occurs in the special shapes of any test such
as Charpy. Although a composite with a very soft matrix allolYs more energy
to be absorbed in fracture, the overall physical properties of the
composites are unacceptable.' However this does ShOl, the value in
preparing a composite with a soft rubber encapsulating the fibres to
absorb energy at fract~re, and this coated fibre in a rigid epOAJT matrix
to give, acceptable physical properties. Such a system was investigated
in section 10.
figure 42 -taken from Harrisis l,ork(47) shows the relationship he found
between composite work of fracture and ILSS. Plotted on this graph are
the composites prepared in this thesis. The standard composite system , '
using Shell DX231/DXl25 epoxy resin gave R high impact strength as shown
on the graph. The coated fibre composites and blended matrix (both taken
at their optimum levels) give much higher work of fracture than, according
to this graph, could be expected from their ILSS. This shows hOly the
carbon,fibre composites prepared in this thesis were significantly ,
toughened to give a better overall balance of properties.
'In conclusion, although the impact strength of carbon fibre composites
were dramatically increased by using a blended matrix of polyurethane
and epoxy there were practical disadvantages. This system could not
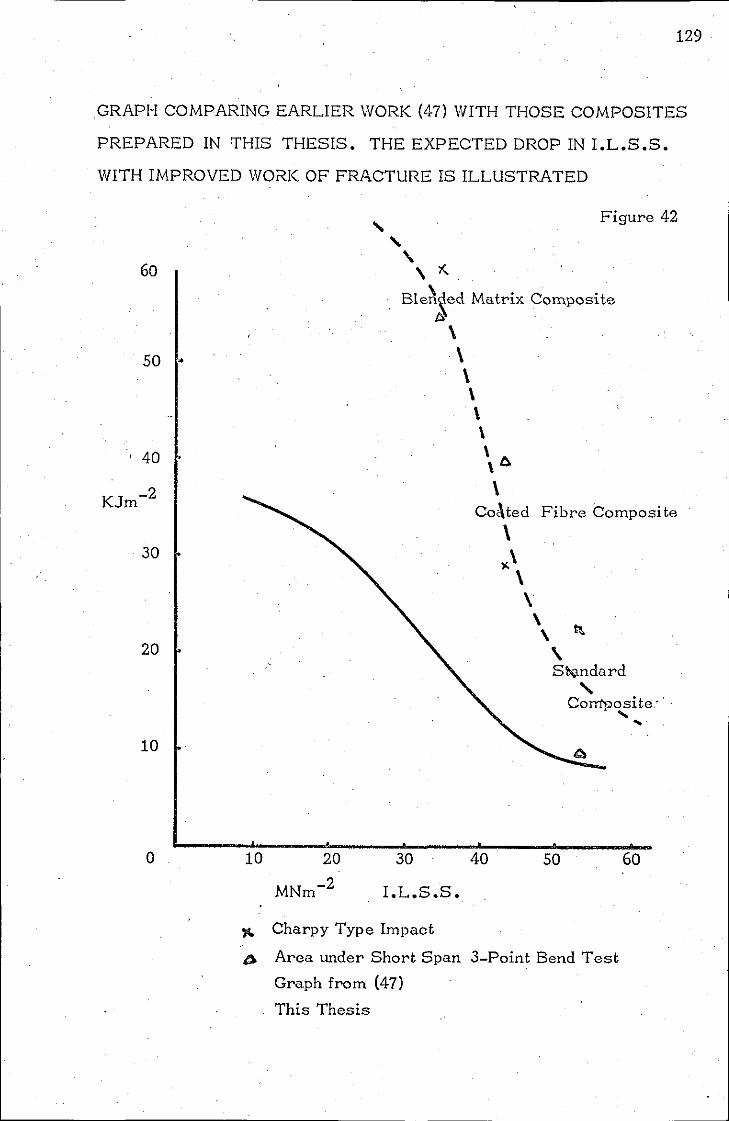
129
GRAPH COMPARING EARLIER WORK (47) WITH THOSE COMPOSITES
PREPARED IN fTHIS THESIS. THE EXPECTED DROP IN I.L.S.S.
WITH IMPROVED WORK OF FRACTURE IS ILLUSTRATED
60
50 •
, 40
KJm-2
30
20
10
o 10 20
MNm-2
.... ....
Figure 42
, \ 1<.
Ble~~ed Matrix Composite tJ.
\ \ \ \ \ \ \ 0. \
\ Co<\ted Fibre Composite
\ ,..\
\ \
\ t\ \
\ S~ndard ,
Corrtposite' . .... ...
30
I.L.S.S.
40 50 60
)Co Charpy Type Impact
C) Area under Short Span 3-Point Bend Test
Graph from (47)
This Thesis
130
easily be used to prepare a prepreg because the action of the curing
agent could not be delayed. , Secondly the impregnation of the fibres
and cure procedure required considerable sldll and experience to produce
acceptable composites. Lastly although the overall balance of
properties was acceptable, the composite was very soft, so much so
that a piercing impact, forced the fibres apart and tore the matrix.
The theoretical approach to improving toughness demonstrated the
drawbacks and difficulties, ofteil apparent v,hen theories are put into
practice. The conclusion from this . ,,,ork \Vas that an acceptable overall
balance of properties including high impact energy could be achieved
'-byfibre' pull-out· anddeformation-of-the matrix,-· as·· l{)ng -as·the·-·fibres
encapsulated by soft rubber were in a rigid epoxy matrix.
The coated fibre composites showed the most promise in possible property
improvements. In preparing carbon fibres it is quite common to size
them (usually with epoxy resin) to reduce the damage to them and to
prepare prepregs more easily. As a she a 4% solution of llL-l6 cured
IVith DETA ,-ras very good, giving fibre tows which could easily be handled,
and wetted right through by epo:l.'Y resin solution. The prepreg then
prepared could be stored as with an ordinary epoxy system for 3 months
~t room temperature, or for anunlimited time at _200 C. Lastly this
prepreg gave improved toughness, very good flexural modulus and only a
slightly reduced ILSS. This improvement in toughness was most
dramatically demonstrated in falling weight impact tests. Here the
damage was localised, the probe simply punching a hole through the composite
which retained in a smili sample up to 60% of its original stiffness.
--~-------~----------------------------------------
PART .IV:
14. FRACTuRE TOUGH»;'F,sS TESTING
14.1 Conventional Test Methods
In order to determine whether a material is brittle or ductile,
impact tests are fre~uently cited.
test used:-
There are three types of impact
1) A pendulum strilcing a cantilevered specimen (ASTM 256 method A
ns 2782306A)
2) A pendulum striking a specimen in three point bending (ASTM 256
--method B, -nS2782306 Band E)
.. ~
3) A falling weighted . hemisphere strilcing a disc (as '2782 306n).
--Inc-these-'tests ·the-relative susceptibility -to_.fracture.by _ shock is
quoted as the energy absorbed in breaking a standard specimen, by a
standard bIOI;, which has gained energy by falling a standard distance
towards the sample. The first test, Imown as the Iz;od always uses
a notched specimen and the second is kno,ffi as a Charpy test.
The bod is widely used although the Charpy simulates better the
behaviour of real materials under impact. Unfortunately the Charpy
test can give large variations in the results due to the condition of
the impact machine and the way in ,;hich the specimens are machined and
tested(71). The conditions set out in theASTM tests gives an impact
velocity of 11 ft/sec (3.39 m/sec) I,hich can give results affected by
the preparation technique; whereas 'the B,S. specify 8 ft/sec
(2.46 m/sec) which gives results which are more likelyC<.k affected
by imperfections of the notch.
131
I
I ! '
'The falling \;eight test gives more reliable results which better
compare with the conditions under which plastics will operate. This
is especially true if the mateFlal to be 'tested is used in sheet form.
The disadvantage of thib test is the number of the test pieces which have
to be prepared. When compared to the pendulum tests,where the cracks
proragate through the specimens at the speed of the pendulum)the cracks
proragate through the specimen faster than the falling weight(72) •
_c ___ ,Qne,oJthe_,toughness testers used in:this"thesis _wa~ the Hounsfield
miniature Charpy machine with a 2.75 Joules capacity and a striker
velocity of 2.54 m/sec. This machine is attractive because it
requires less bench space and smiller samples, yet still testing under
the Charpy conditions with a notch of 0.010" (0.25 mm). The specimens
were cut with a constanv depth of material under the notch. The results
are quoted in this thesis as the energy in Joules absorbed by the,impact
divided by,the area under the notch.
Another test method used was a variation on that developed by Tattersall
and Tappin(73) of measuring the energy required to break in short span
three point bending a notched specimen. In this thesis an unnotched
specimen was used in conjunction with the 1138 test, by noting tile
energy under the stress-strain curve. This test gave tile total energy
to deform and break a specimen slowly, whereas the charpy impact test I ,
gave tile energy absorbed in fracturing the specimen at a faster speed.
Impact tests used are often determined on ideally shaped specimens \>'ith
, perfect notches. In reality specimens 'fail at their weakest point,
depending on sharp edges and variable loads. The materials are
often fabricated under poor conditions with flaws and inherent design
weaknesses. It is often the case that the impact strength of a
fabricated article bears no relation to the impact strength of an ideal
sample of the material used in that article.
132
A very important criticism of impact tests is that most objects
have to lvithstand repeated bler/s. Often several blolvs at a certain
level will fail a sample, where one blow at that level would not.
Although important there is no standard test because of the number
of variables involved i.n any repeated impact test. The energy i.n
the ,blOl~ could affect the number of blows required, as could the
velocity of the blows. The' frequency of the blows, "here they
cause a rise in temperature need also to be monitored. It should also
be considered, what load'a specimen could support as the damage to it
increases with the number of blows; flndley and Hintz(74), Telfair
'and'Nazen(75), and,Heater and Lacey(76) while looking at the fracture
of samples under repeated impact, conclude that there is no direct
correlation between repeated impact resistance and the impact strength
values obtained from standard,tests. Since standard tests' do not
show hOlv ef:tective a inaterial is under impact in use, it was
considered important .in the thesis to investigate the effect of
repeatedly impacting a specimen and to monitor the damage caused by these
repeated impacts. The author/74, 75, 76) mentioned above expected
that this type of test would more nearly simulate in service conditions.
133
The apparatus used corresponds to that specified in BS 2782 method 306D.
That is where a 0.500" (13.7 mm) hardened hemispherical striker falls
vertically 24 ± 0.1" (604 ± 2.5 mm) ,',onto a specimen supported by a hollow
steel ,cylinder of 2.25" (57.2 mm) external diameter, and 2.00" (50.8 mm)
internal diameter. ,The three impact energies for the 3 tests were chosen
so that only a few tests liould fail the composite at one energy level;
only a large ,number would fail the composite at another energy level;
and intermediate energy level was chosen. Then before impacting, the
specimens 2" (50.8 mm) x 2" (50.8 mm), were tested for fleJ..'Ural modulus,
with a 2" (50.8 mm) span and 0.25" (6.4 mm) support rollers, diagonally
across the square sample at 450 to the major fibre' axis in 3-point
_ .. ---~~~~~~~~~~~~~~~~-
bending. The specimen was then impacted once, flexural modulus
tested again, impacted again and modulus tested again etc. This was
continued so that 1, 3, 7, 15, 31 and 63 impacts were made with
flexural modulus te::;ts in between each step or until the specimen broke,
a hole was punched, or the trend in behayiour was clarified. A graph
was then plotted for each sample of accumulated energy against nondnal
flexural modulus. This graph traced the drop in flexural modulus with
each impact. Nominal modulus was taken as the gradient of the
stress-~train cUrYe diyided by the thickness cubed. The final s ta te
of the composite if not delaminated was indicated on the graph •
. .14.2 Fracture Hcchanics
Set out below, are the reasons why the feasibility of using a fracture
mechanics approach to assess the touglmess of composites was inYestigated.
The cost of fabricating composites material test specimens is
considerably higher than the cost of fabricating other material test
specimens. In addit~on these composites generally require a higher
standard of expertise in order to fabricate them. Consequently a
giYen amount of time and money does not produce as many test results that
can be correlated and interpreted compared to other materials. Recent
research on the fracture of ·metals, is only now beginning to giYe
an understanding of their fracture behaYiour despite the many years
metals haYe been used. Composite technology is new and the use of
composites in structural applications, is as yet almost untried,
to the extent that the important fracture information which is required
for carbon fibre composites will be a long time in coming. The wide
yariety of ·;'fabrication techniques used to make carbon fibre composites,
and their attractiYeness for tspecialt and high performance applications
makes the characterisation of these composite more important and more
difficult than for conyentional materials. The auisotropy inherent
. in composites makes all exact material specification difficult,
134
especially related to the properties of the constituents of the composites.
I
Composite fracture information ~lOuld be expensive and difficult
to obtain by methods adopted for conventional materials. Composites
also are not exception~l in propagating cracks to complete failure
from flaws, at Ivorking stress levels "hi ch according to elastic
considerations are safe. It is the development of the knowledge
about these flaws and cracks which lead to Fracture Mechanics.
In addition Fracture Mechanics could more cheaply and more exactly
describe the behaviour of composites 'especially in an aggressive
environment, at extremes of temperature or under alternating and
dynamic load.
It has been knOlm for many years that a sharp crack can prematurely
fail, any material at working stresses considerably lower Flian that which
is considered to be safe. Griffith1s crack theory(77) stated that a
crack "ill propagate an elastic material to failure if the available
elastic strain energy release rate exceeds the surface energy of
the crack. This theory although important "as not very helpful since
most engineering materials have an elastic-plastic behaviour.
Irwin (78), equated Griffins energy approach to a stress intensity
situation, "here fracture occurs "hen a critical stress distribution
(around a crack or inclusion), characteristic of the material is reached,
for elastic-plastic materials. This gave the Griffith-Irwin concept
of sharp crack fracture mechanics. More recent logical developments
had'led(79) to the current concepts of 'Linear Elastic Fracture
Mechanics I.
The Linear elastic fracture mechanics theory defines the clastic stress
field around a crack tip in a,centrally notched plane under tension.
Mode I (opening of the crack f~ure 43) conditions are derived since these'
f . al . (80) are 0 most pract~c ~portance •
The elastic stresses close to the tip of a central crack of length 2a
subjected to a uniform stress of 6" at infinity can be expressed as(80).
135
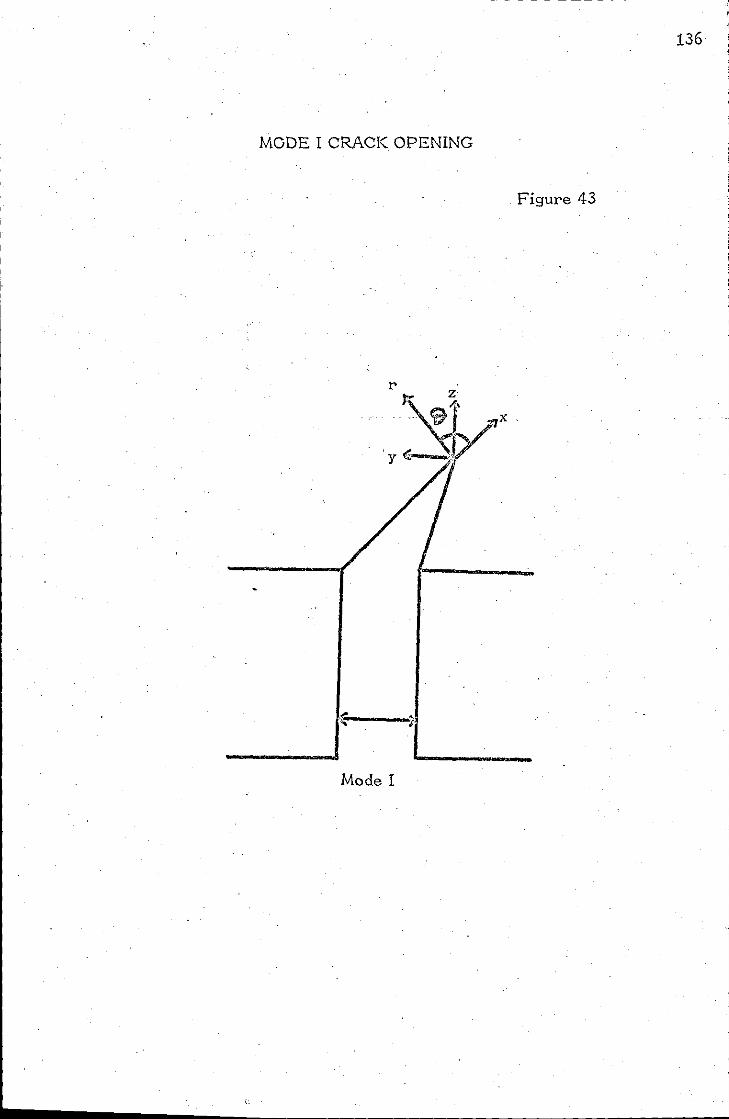
136
MODE I CRACK OPENING
. Figure 43
x
Mode I
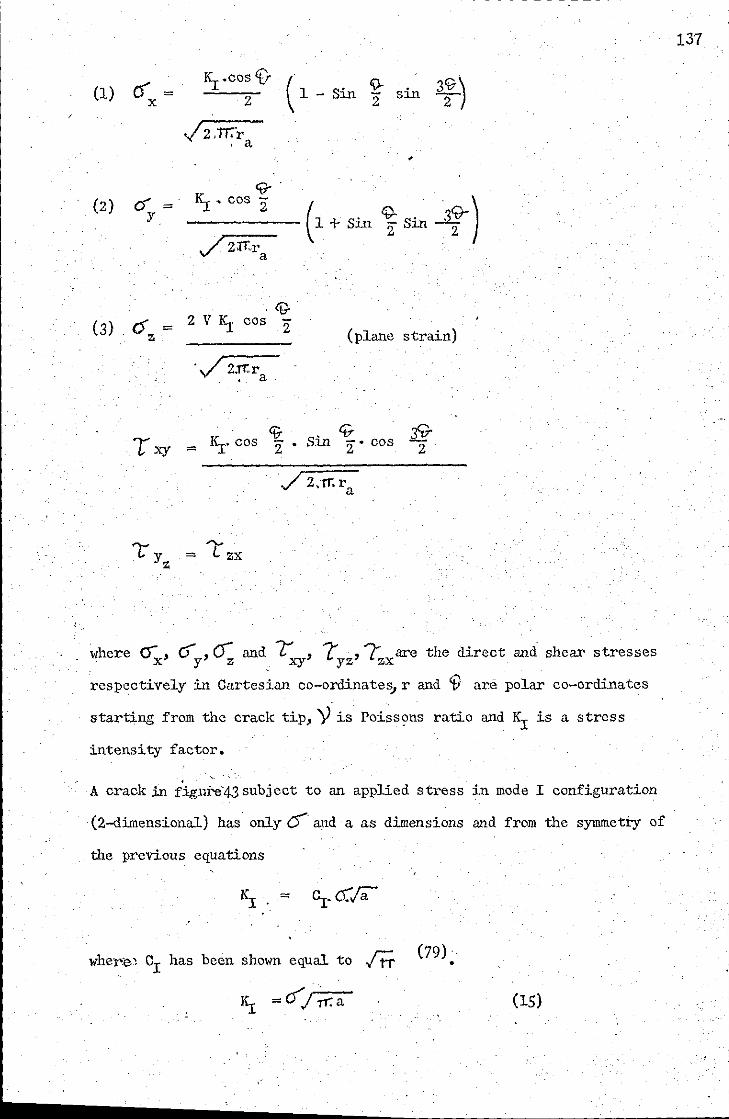
~--------------~~------------------------
. ,
(1)
(2)
if IS: .cos V (1 -Sin 2- sin 3;) =
x Z 2
.j 2:rr.r -
, a
<if ()= IS: • cos 2: ( 1 + sin ~ Sin 3~) y
/2;rfora
4r 0: = 2 V Kr cos 2:
z
. /2.1'1:1' . a
(plane strain)
TXY q;. ~ 39-
= KT· cos z' Sin 2" cos 2
""-= L zx
\;here ()x' 0y'O: and?: xy' Lyz' l'zxare the direct and shear stresses
respectively in Cartesian co-ordinate~r and 0 are polar co-ordinates
starting from the crack tip, Y i8 Poissons ratio and KT is a stress
intensity factor.
A crack in flg,ure43 subject to an applied stress in mode 1 configuration
"(2-dimensional) has only 0" and a as dimensions and from the symmetry of
the previous equations
whel'"e1 Cl has been shown equal to ..rtT (79) •
(15)
137
I
1
I
1
" -I 1
1
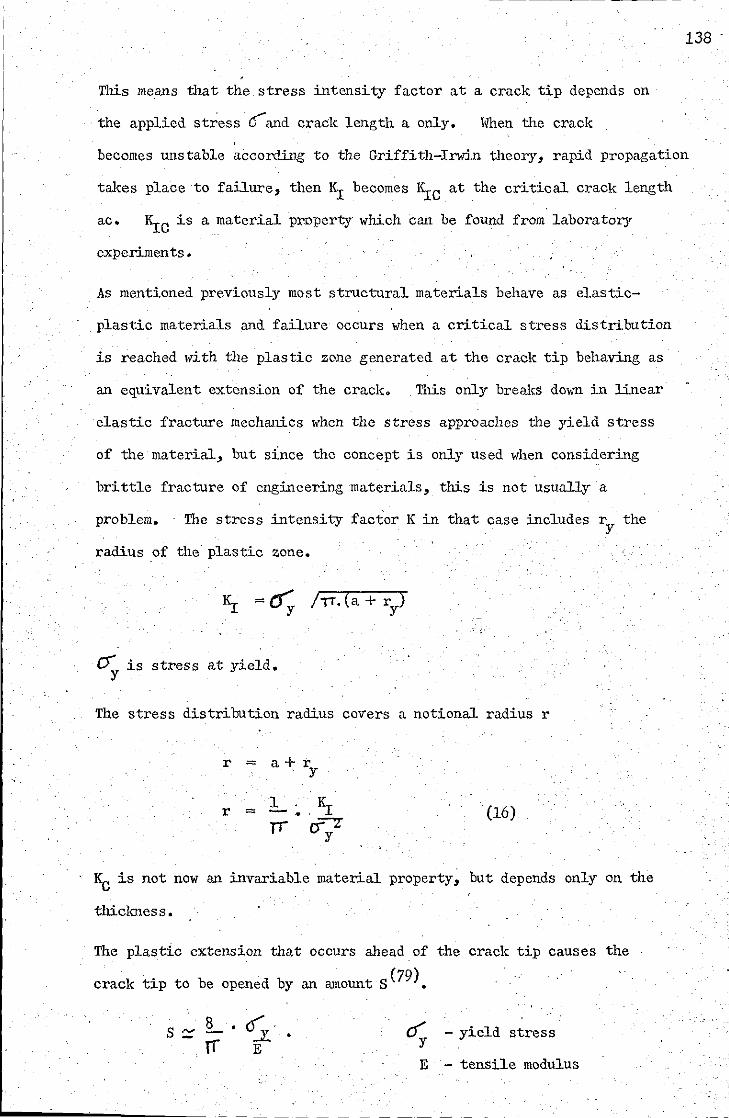
138
TIlls means that the stress intensity factor at a crack tip depends on
the applied stress 0-and crack length a only. lfuen the crack
becomes unstable according to the Griffith-Irwin theory, rapid propagation
takes place to failure, then RI becomes I~C at the critical crack length
ac. RIc is a material property which can be found from laboratory
experimen ts •
As mentioned previously most structural materials behave as elastic-
plastic materials and failure occurs when a critical stress distribution
is reached lvith the plastic zone generated at the crack tip behaving as
an equivalent extension of the crack. TIllS only breakS down in linear
elastic fracture mechanics lvhen the stress approaches the yield stresS
of the material, but since the concept is only used when considering
brittle fracture of engineering materials, this is not usually a
problem. The stress intensity factor K in that case includes ry the
radius of the plastic zone.
c> is stress at yield. y
The stress distribution radius covers a notional radius r
r = a+ ry
1 RI . (16) r = • TT" (J"-Z
y
KC is not now an invariable material property, but depends only on the
thiclmess.
The plastic extension that occurs ahead of the crack tip causes the
crack tip to be opened by an amount S (79).
6. ..1:' E
0; - yield stress
E - tensile modulus
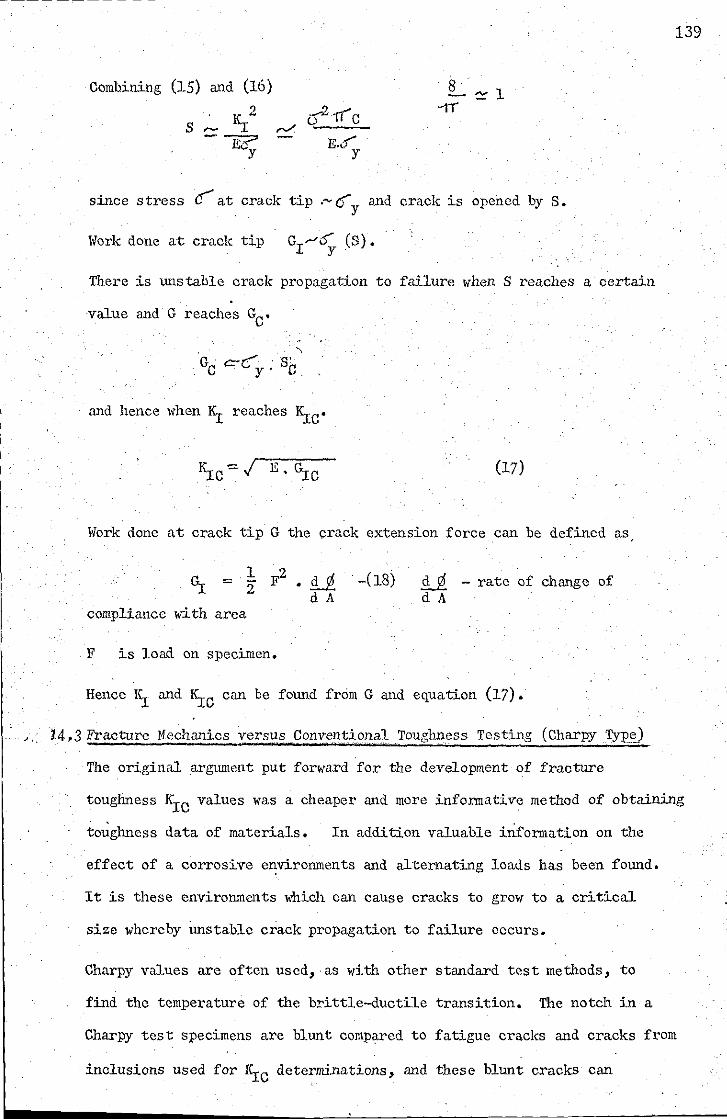
- - - --- - - --------------------
Combining (15) and (16)
s ;.. K/ -If?
'-y E.,1 y
8 ~l
since stress 0 at crack tip '-0 and crack is opened by S. . y
Work done at crack tip GI.-JO (S). y.
There is unstable crack propagation to failure when S reaches a certain
value and G reaches GC'
. " G C:-C . S'
. C y' C
and hence \~hen KJ: reaches KJ:C'
(17)
Work done at crack tip G the crack extension force can be defined as,
1 = 2"
compliance with area
F is load on specimen.
U - rate of change of dA
Hence 1':1 and KJ:c can be found from G and equation (17).
,.,14,3 Fracture Hechanics versus Conventional Touglmcss Testing (CharpyType)
The original argument put forwa:rd for the development of fracture
139
toughness Krc values was a cheaper and more informative method of obtaining
toughness data of materials. In addition valuable information on the
effect of a corrosive environments and alternating loads has been found.
It is these environments which can cause cracks to grow to a critical
size whereby Unstable crack propagation to failure occurs.
Charpy values are often used, ·as with other standard test methods, to
find the temperature of the brittle-ductile transition. The notch in a
Charpy test specimens are blunt compared to fatigue cracks and cracks from
inclusions used for I':1C determinations, and these blunt cracks can
have the effect of :increasing the apparent toughness of the materials.
Ductile-brittle transition temperatures are up to 40°C higher than the
same temperatures obtained from fracture toughness work, which expla:ins
the differences sometimes found when materials are used as opposed to
tested. Consideration of the failure mechanism of materials in use
renders Charpy and other tests of'limited use whereas KJc values are
a more reliable guide to design as opposed to a comparative test.
, The toughness of materials predicted by tests such as Charpy cannot
always be scaled up to full size, whereas fracture mechanics m<llI'e easily
copes with size effects.' Charpy values, although a valuable test
for quality control and material improvement work, can only,lith
difficulty be used in design., KJc values can with confidence be used
to compare materials for design. Fracture mechanics can also allow
'for accurate investigations of the stra:in rate dependence of touglmess
:in a material.
Charpy and fall:ing weight tests have been established as meaningful tests
for material improvement comparisons :in composites and were used as such
in this thesis. However it is apparent that although little work has
as yet been carried out on fracture mechanics :in composites l'lC values
could be useful for design \;ork and fatigue considerations of composites.
Summarising the uses of fracture toughness parameters (KJC):-·
1) KJ:c values can be used to assess the toughness of materials.
2) KJ:c values can be used to design for materials working at a safe stress
level, when the crack 0':..' 'defect size are known.
3) Inspection of materials whose KJ:c is known can give advance warning
of the failure of materials III use, as long as the crack growth is
monitored. ' For when the'crack grows to a critical size given by KJc
catastrophic failure tlli(es place.
---------'------------- - - -
140
, I
I
I
" J I
-------- ----- --- ---- ---
14.4 Estimation of Fracture Toughness in Composites
Waddoups et alia (81) have discussed the use of fracture mechanics in
composite design and give some interesting calculations involving stress
concentrations around holes in composites. They suggested its use
for
1) Prediction ofKI for significant design discontinuities
2) Anticipation of the behaviour of flaws induced in service
3) Prediction of the probability of failure on overloading the design ,
specification. Unfortunately their work did not explain how the
KI values could be obtained.
- (82) Sanford and Stonesifer have developed their ideas in a similar way
to that followed in the thesis and concluded the fracture mechanics
data could give significant improvements to the knowledge of fracture
behaviour in composites. They found significant differences in fracture
toughness according to fibre strength, type of hardener, state of cure
thickness of fibres and type of resin system used. The specimens they
used to measure fracture toughness were uniaxial(in order to minimise
the reinforcing effect of the fibre) double edge notch and single edge
notch specimens as shown in figure 4~. These specimens had starter
or fatigue cracks initiated at the machined root of the crack. The
specimen was stressed and the widening of the notch versus load to
widen it was monitored. Knowing the rate of change of stiffness with
crack length from a previously obtained calibration curve, the KI and
'Gr were obtained.
,It was considered that the new composites fabricated in the thesis might
have improved crack iarresti properties. The thesis has explained how
to blunt cracks formed in ;the matrix at the :lnterface by a graded
interface. Crack arrest is the ability of a material to stop cracks
141
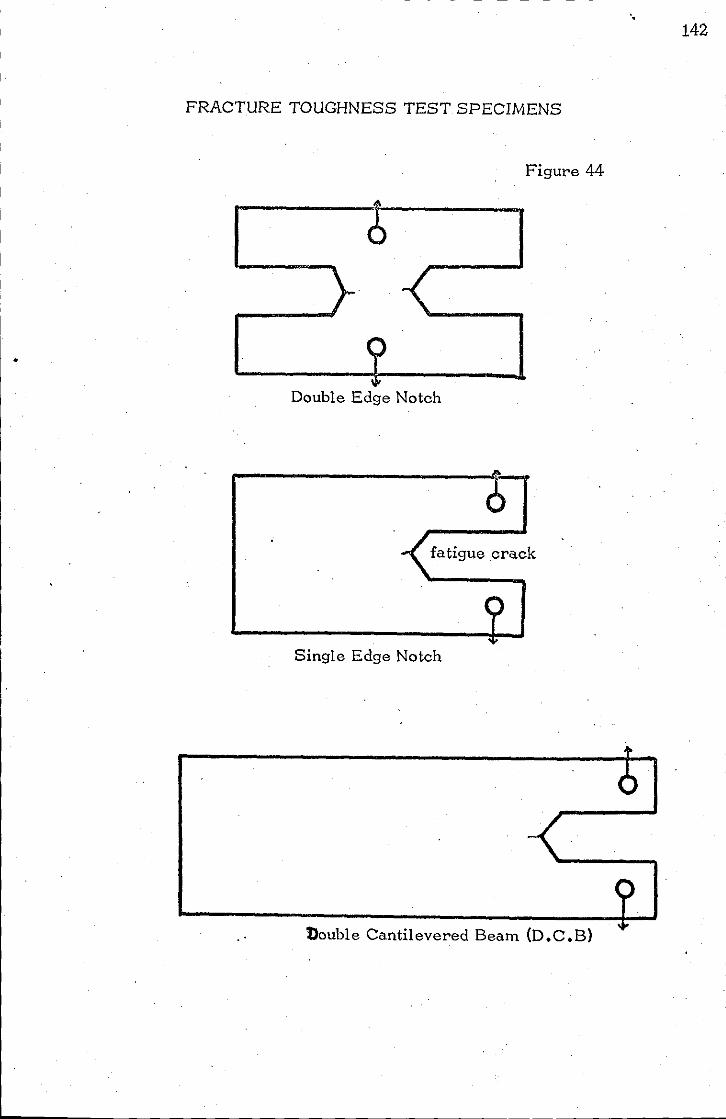
'. 142
FRACTURE TOUGHNESS TEST SPECIMENS
Figure 44
•
Double Edge Notch
fatigue .crack
Single Edge Notch
Double Cantilevered Beam (D.e.B)

- ------------------------------------- - -
"
running through and failing a material after the cracks have been
,initiated by an impact. Because
cantilevered beam) test discussed
for investigation in this thesis.
initiation and arrest properties.
of this requirement the D.C.B.
by Crosley and Ripling(83) was
This test can measure crack
(double
adopted
In developing the specimen shape and
143
design in order to measure and calculate RI and KA(crack arrest) values the
work of Mostovoy(84) and advice of canon(53) were considered. Mostovy
shows the type of trace to be expected on stressing the D.C.B. and allowing
the crack to move along the groove (see fi'gure' 45) •
A composite containing uniaxially orientated fibres will tend to crack
along the axis of the fibres, although in use it is the energy to
propagate a crack across the fibres which is of most interest. In
order to become faIililiar with fracture toughness testing techniques, and
to use already prepared composites, D.C.B. test specimens were prepared
.whose cracks would propagate along the fibre axis. The specimens were
moulded, 6" (152 rnm)x 0.5" (12.6 rnm)x 0.2" (5.1 mm) and then machined
with 450 notches along their length as shown in h~u~l·46. A starter
notch was cut and the specimen stressed as shown. The 'load and deflection
of the test specimen as the arms were separ~ated was recorded. For the
determination of GI and hence RI, the compliance ~ variation with crack
length was required. A separate calibration specimen with a sawn crack
was loaded, and unloaded before the crack started to extend. The crack
was cut deeper and again the arms stressed and unstressed. From a
graph of crack length against stiffness of the composite at that crack
length, the compliance variation with crack length, and hence IS:c can
be calculated as below.
·Two specimens were prepared.
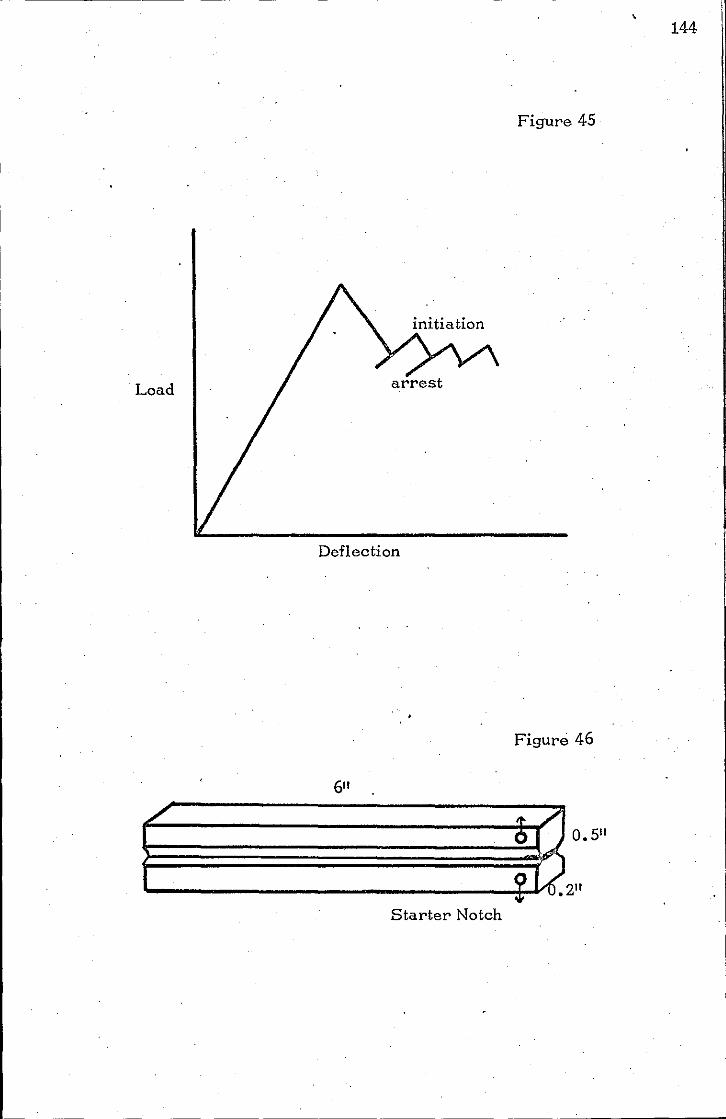
144
Figure 45
Load
Deflection
Figure 46
o AI. 0.5"
I ____________ --.:?+.-VGI' J. 2"
Starter Notch
•
1) HT-S fibres inDX231/125 (approx 60% fibre volwne fraction)
2) HT-S coated in a 4% polyurethane solution cmb,edded inDX431/
DX 125 as developed earlier in the thesis.
Both specimens for the D.e.B. tests and calibration tests had the carbon
fibres aligned along their length with a starter crack of 0.1" (2.54 mm)
and holes to load the specimen drilled 0.175" (4.45 mm) from the end
and sides. The crack width was 0.1" (2.54 mm).
The flexural modulus was also J.:equired for the calculation of Kr
This was measured for the test specimens.
D-1 Untreated fibre composite flexural modulus = 135 GNm-2
D-2 Treated " " " "
Compliance {J = 1 -s-t""i""f"'fn-e-s-s-
Recall equation 17.
E - composite modulus
and 18 G = 1 F2 I '2 ·M
cIA A - composite beam area
=' 1 2H
M H - specimen width . da
a - crack length
Calibration samples of D-1 and D-2 were used to draw respectiv~ly D.e.B.
1A and D.e.B. 2A (figures 47 and 49) .shOldng the compliance /J (reciprocal
'of stiffness) change of the D.e.B. specimens with crack length. From
these were drawn the graphs in figures 48 and 50 by taking the gradient
of the graphs in figures 47 and 49 and plotting these gradients against
the compliances values to which they correspond. This gradient is the
rate of change of compliance.
145

146
D.C.B. lA Figure 47
0.3
Complianc
0.2
0.1
mm/N
o
o Crack Length 50 a mm 100 130
D.C.B.18 Figure 48
0.006
0.004
bt/> ~Q 0.002
o
o 0.1 0.2 0.24
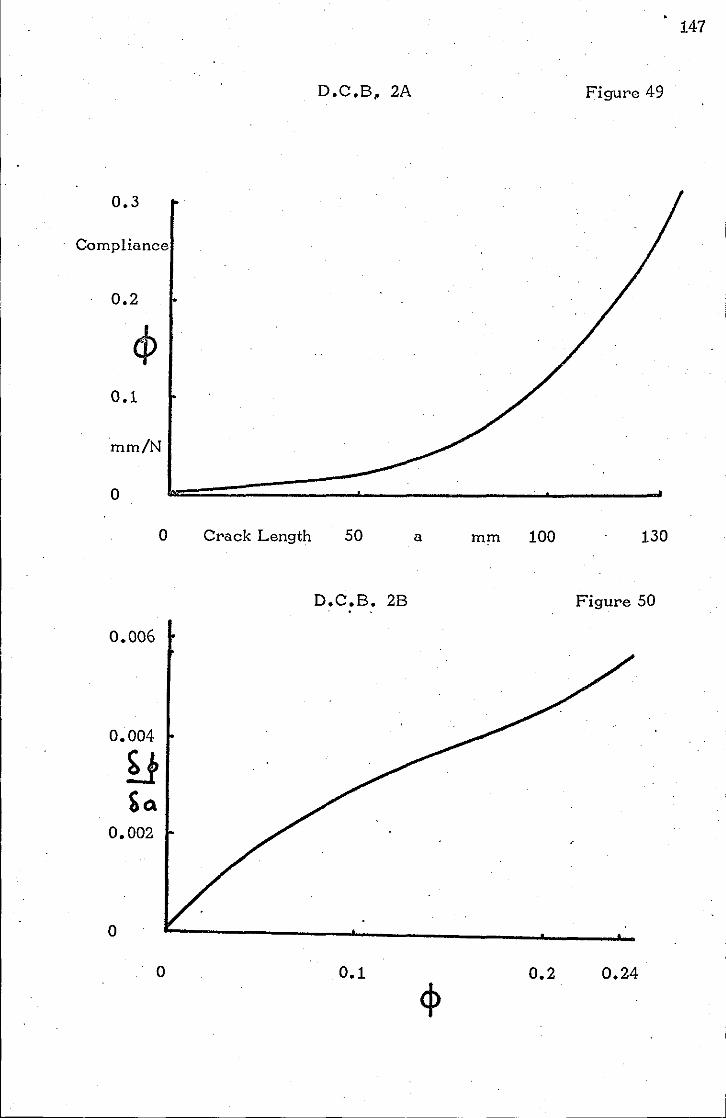
0.3
Compliance
0.2
0.1
mm/N
o
0.006
0.004
B Sa
0.002
o
o
o
147
D.C.B, 2A Figure 49
Crack Length 50 a mm 100 130
D.C.B. 2B Figure 50
0.1 0.2 0.24
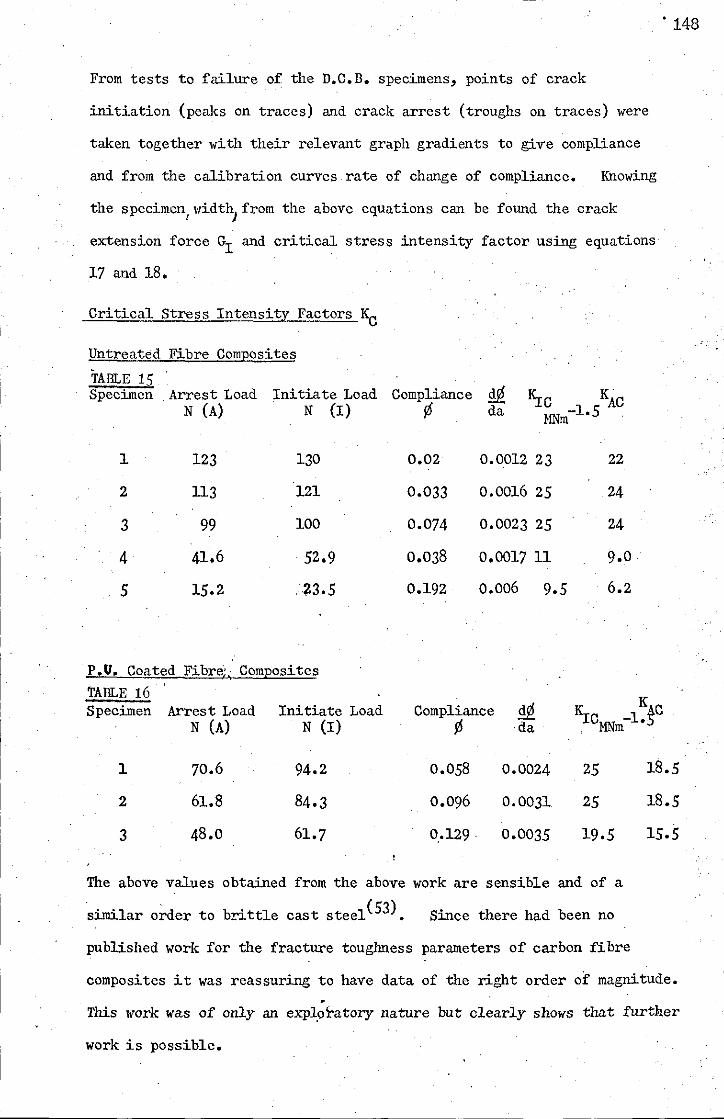
From tests to failure of the D.C.B. specimens, points of crack
initiation (peill{s on traces) and crack arrest (troughs on traces) were
t~en together with their relevant graph gradients to give compliance
and from the calibration curves rate of change of compliance. Knowing
the specimen/widthjfrom the above equations can be found the crack
extension force GI and critical stress intensity factor using equations
17 and 18.
Critical Stress Intensity Factors KC
Untreated Fibre Composites
TABLE 15 Specimen Arrest Load Initiate Load Compliance iQ ":rC K
N (A) N (I) r6 da -1.5 AC MNm .
1 123 130 0.02 0.0012 23 22
2 113 121 0.033 0.0016 25 24
3 99 100 0.074 0.0023 25 24
4 41.6 52.9 0.038 0.0017 11 9.0
5 15.2 ~3.5 0.192 0.006 9.5 6.2
P.". Coated Fibre;; Com~osites TABL~; 16
KJ:CMNml~~C Specimen Arrest Load Initiate Load Compliance iQ N (A) N (I) r6 ·da
. 148
1 70.6 94.2 0.058 0.0024 25 18.5
2 61.8 84.3 0.096 0.0031 25
3 48.0 61.7 0.129· 0.0035 19.5
The above values obtained from the above work are sensible and of a
similar o~der to brittle cast steel (53) • Since there had been no
18.5
15.5
published work for the fracture toughness parameters of carbon fibre
composites it was reassuring to have data of the right order of magnitude • •
This work was of only an expl,oratory nature but clearly shows that further
work is possible.
.. !
I
I.
149
There is little difference between the results of the coated fibre
composites and the uncoated fibre composites since the cracks were
propagating parallel to the fibres, whereas the coating was positioned to
retard cracks propagating perpendicular to the fibres.
As a result of the work in this thesis and discussions with Meeks(63),
samples were prepared for D.C.B. test specimens which would propagate
a crack across, the fibres. The first specimen prepared to investigate ' ..
this effect had a structure similar to that shown in figure ,51'; The carbon
fibres ran across the machined notch, and the glass fibres, at right
angles to these ran along the length of the specimen. The original
sample was pr~pared as a 25:50:25 glass:carbon:glass sandwich, with
the glass being machined away in the relevant area. Under test this
specimen fail.ed by interlaminar shear between the glass and carbon.
, A simple calculation showed that knowing the onset of shear failure,
the notch must be machined to less than 0.010" (0.25 mm). A further
specimen was prepared with such a notch and tested. Although the notch
did propagate across the carbon fibres, the specimen was too fragile.
A second composite was then prepared which stressed the carbon fibres
to a higher level without delaminating them. It was constructed as in
figure 52'.' The carbon fibres were wrapped around steel anus through which
holes where drilled to stress the composite. The remainder of the composite
was glass, which was machined away in the centre of the composite to
leave only carbon fibres running perpendicular to the notch.
was a quarter the thickness of the composite (1.25 mm) • . ' ."
The notch
When stressed this composite gave a graph as in figure 45' from which
fracture toughness parameters could be measured. However the arms of
this double cantil~red beam were stiff and the results erratic. A more
carefully controTIed separation of the arms and a high speed recorder,
capable of recording the crack movements was required. Facilities for this
more detailed work were available at the Railway Technical Centre,
Derby and D. Canon kindly agreed to test a series of samples.

--------------------
150
Figure 51
Carbon ibres
Figure 52
...
Steel

These tests when they were carried out \;ere accidentally destroyed by
the British Rail l{orkshops and could not be tested. Unfortunately
there is no further information on tilis work.
~4.5 Conclusions on Fracture Toughness Testing
-The standard B.S. and A.S.T.M. impact test methods: give the conditions
whereby reproducible results can be achieved. However, although useful
for comparing improved composites they (especially pendulum tests)
do not always compare \;ith actual service conditions of components.
The falling weight impact test in the B.S. better simulates
actual service conditions. However the two criticisms of a)
requiring too many samples and b) failing a sample with one massive
blow have been overcome with the procedure described. With only a
few samples a method is described whereby meaningful toughness test
can be carried out, using repeated falling weight impact.
It is apparent that design fracture toughness parameters developed for
steel could be useful(82), for designing with composite materials. The
literature contained a remarkable paucity of experimental details on
the design and testing of composites from which to find the fracture
toughness parameters. This was despite considerable and varied
opinion on the -use of such parameters. The work in this thesis
demonstrated that sensible fracture toughness parameters can be
obtained. A suitable design of a composite was developed which
could be used to measure fracture toughness parameters across the
fibres. This technique shows considerable scope for further work
in order to establish design level fracture toughness parameters.
It does however require suitable equipment.
151

15. FURTHER WORK
The work described, where by coating carbon fibres with a low modulus
polyurethane elastomer which was compatible with the epoxy resin
matrix, gives a pre-preg system with significantly improved handling
and processing characteristics. The final cured composites from these
pre-pregs additionally have improved physical properties. This work is
the subject of British Patent Application No. 12090/71.
152
The concept of a graded interface with an elastomeric coating, which is
compatible and reactive with a rigid matrix could be further investigated.
~ selecting suitable elastomers and resins and investigating them as
in this thesis, could give improved physical properties to a range of
fibre reinforced plastic composites.
The latter part of the work discusses the measurement of fracture mechanics
parameters for CFRP. It was shown that sensible values could be
obtained, and if perfected, fracture mechanics could be a useful tool to
more cheaply and accurately assess a variety of composite materials such
as CFRP.
These two areas are then worthy of further investigation.
CARBON FIBRE COHPOSITES
The use of carbon fibres is at the present in the classic situation,
where the amount of carbon fibres used depends upon their price.
Unfortunately their price depends upon their volume usage. The
commercial position is in reality a little more complex than this.
Carbon fibres are produced from a special grade of polyacrylonitrile,
the cost of which is £2 a lb. "I:he treatment with converts this
polyacrylonitrile to carbon fibres reduces the weight by a factor of
two and increases the price to £4 a lb. Finally the overheads,
development costs, profit and sales costs would lead to a figure of
about £16 a lb. This at present is the long term low price for carbon
fibres produced by conventional techniques. It is conceivable to
reduce this price if a general purpose textile grade of polyacrylonitrile
lras used which could reduce the price to £5 a lb. However many problems
will have to be overcome before this is feasible.
Carbon fibres when developed, were an important step forward for plastics.
For the first time plastics could be made whose properties exceeded those
of steel in the important design areas of strength, modulus and fatigue.
Before this only glass fibres had been available in sufficient quantity
as a reinforcing material for plastics. Although glass fibres have a
high strength, their modulus and fatigue properties were too low to
challenge steel in structural designs. Carbon fibres were however much
lighter than steel and also, although more expensive, were expected soon
to be cheaper.
rH
Perhaps it was unfortunate that their discovery was made in a Government
Research Establishment or that much of the initial.work with carbon fibres
was carried out in Universities. Rolls-Royce in their courageous and
nearly successful attcmpt to single-handedly launch carbon fibres also
damaged the prospects of carbon fibres, because their fan blade for the
RB211 aeroengine would not meet the specifications.
What was needed many years ago, is now beginning to take place. Carbon
fibre composites are being used where their installation gives real
improvements in simple comp~nents.
The industry which produces carbon fibres markets a multitude of grades
and types. Up to four different combinations of strength and modulus
are available. These carbon fibres can be supplied untreated or
oXidatively treated to improve their adhesion to plastics. They are
available in short staple form (less than lOmm), short lengths (up to
1.3m) and long lengths (up to lOOOnt). The fibres are often coated and
can be supplied as sheet and tapes, in woven and mat form, before
incorporation in plastic matrices.
The most widely used grade of carbon fibre is the cheapest, that with '-2 -2 a modulus in the region of 175 GNm and a strength of about 2.5 GNm •
The shear strength is good especially when treated, and the toughness
adequate. If the manufacturers priced their fibre to preferentially
promote only a surface treated fibre of the grade indicated above, this
should help both their production economics and simplify the choice for
the user. Other grades could be made available at a premium price.
Essentially only one grade of glass fibre is now sold and there seems to
be no reason why this cannot be the position with carbon fibres.
Carbon fibres can be incorporated in a variety of matrices, although epoxy
resins are m,ost widely used to give outstanding properties with relatively
easy processing. Other matrices, such as a variety of metals, polyimides
and phenolics have,been investigated for specialist applications where
their particular properties are required. Polyester resin is cheaper
than epoxy and in the future it is therefore likely that the technology
will be developed to use it more widely.
The development of matrices will improve the properties of carbon fibre
composites, and in this thesis blended matrices of polyurethane and
epoxy were used to :iJuprove the toughness of the composites. In evaluating
any matrix improvement the e~se of pro'cessing was considered. Tba system
which coated the fibres ~~th polyurethane was especially useful for it
eased the processing and improved the overall properties of the composite.
In tba previous developments of carbon fibre technology the ease of
processing had not been considered and much of the research carried out
was consequently wasted with the result that production of carbon fibre
components has been delayed. Now the demand from industry for carbon
fibre composites is dictating the pattern of future supplies of the
fibre and matrix type with due consideration to cost, ease of processing
and finished quality.
Now that components are made from carbon fibres new fabrication techniques
are being developed. Initially carbon fibre composites were made by
immersing the fibres in resin squeezing off the excess and curing the
composite. This was a development of the most commonly used technique
with glass fibres and polyester resin, known as hand lay-up. In order
to utilise the full properties of carbon fibre composites it is necessary
to use the fibres straight and without a textile handling size. This
led to the industrial user demanding carbon fibres in the form of "prepregs tt
where the fibres, in sheet form, were pre-impregnated with resin and
partly cured to give a material which could be cut, formed and cured
relatively easily to give the final product. The majority of industrial
users making components reinforced with carbon fibres use them in the
form of a nprepreg ll • It was with this in mind that the work in this
thesis prepared specimens for test purposes from prepregs and the systems
used to improve toughness were developed so as to be amenable to prepreg
production.
Possibly the cheapest method of fabricating articles in reinforced plastics
is by filament lrinding. Filament winding builds up tubes or cylinders by
rotating a mould and winding on the fibres in prepreg form or running them
through a resin bath, and onto the mould. The fibres can be laid in
complex patterns, depending on the stress distribution in the product under
load. There is little finishing required to the final product and the
labour content is lOll. HOl(ever a fairly expensive machin.e is generally
required to obtain consistent results. Another method of fabricating long
thin continuous cross-sections is pultrusion. In pultrusion the fibres
are coated with a resin which can gel very quickly when heated, then they
are pulled through the die which shapes the composite. the die itself is
heated and the resin which gels on leaving the die is then cut into lengths and
post cured. This technique is important, because it could be used to
produce a large volume of carbon fibre composites in.their finished form,
with low production costs. One of the most promising areas for carbon
fibre composites is as long thin sections which can be built into framework
structures, which are light, strong and stiff.
Many of the possible uses for carbon fibre composites require intricate
placing of fibres, built up layer by layer. Using prepregs and matched
die moulding often leads to the fibres moving during resin flow when heat
and pressure are applied. If the fibres are built up layer by layer and
held in place by a light, soluble size to give a porous composite, then

resin can be injected round the fibres and cured by heat. This allows
intricate designs to be fabricated, albeit at a high cost, with the
fibre placings accurately held.
The major problems which have to be solved in order that carbon fibre
composites can more widely be used will depend upon simple answers.
These answers 'rill be along sjmjlar lines to those developed in this
thesis; that is by fibre coatings, matrix selection and other simple
modifications of existing materials and techniques. The key to
fUrther successful development is therefore simplicity.
FUture profitable areas for carbon fibre composites will depend on
volume usage, not single hovercraft fan blades, but initially with
sports equipment. In golf clubs where a carbon fibre handle can
give an extra 20m to a drive, the price will be paid in this already
costly sport. Other areas include equipment such as skis, tennis
rackets, squash rackets, sailing boat spars, canoes and racing boats.
These are the areas which could launch the material and reduce the
price. As the price is reduced engineering. structures' using framework
sections could be developed using components which need to be light.
The big unJmown is the aerospace industry, ,mere the adoption of a
carbon fibre fan blade could give a tremendous spur to the adoption
of carbon fibres in general use.
However carbon fibre composites will always be a specialist material
~ch will only be used where lightweight, strength and stiffness are
required.
I
I
I
I
I

16. REFERENCES
(1) R.M. Gill -, Carbon Fibres in Composite Materials, IlUfe !looks
(2) A. Shindo - Rep Osaka Ind Res 'Inst No 317 (1961)
,(3) W, Watt, L.N. Phillips and W. Johnson - Engineer 221, No. 5757, 815 (1966)
(4) J. Broughton and R.R. KrOk - Modern Composite Materials, Adison Wesley
(5) L.B. Greszczuk - Interfaces in Composites ASTM STP 452 (1969)
(6) F.M. Fowkes - Ahesion and Adhesives
(7) R. Simon, S.P. Prosen and J. Duffy - Nature 217 (1967)
(8) W.A. Zisman - Ind Eng Chem, Oct 1963
(9) W.A~ Zisman - Adhesion and Cohesion, ed. P. Weiss, Elsevier
(10) ,j.R.J. Harford and E.F.T. White - Plastics and Polymers, Feb 1969
(11) Souheng Wu - Du Pont House Magazine
(12) D.M. Brewis - Poly Eng and Sci, jun 1967
'(13) j.R. Huntsberg~r - Chem Eng News, 42 (44), 82-7, (1964)
(14) Souheng Wu - J. Colloid and Int Sci 74, 632 (1970)
(15) J .R. Huntsberger - J. Polym Sci A, p.2241 - 2250 (1963)
'(16) R,E. Baier, E,G. Safrin, W.A. Zisman - Science, 162, Dec 1968
(17) B,W. Cherry, S. El Muddarris - J. Adhesion Vol. 2 Jan (1970)
(18) H. Schouhorn-J. Polym Sci, 31\, 569 (1965)
(19)
(20) ,
(21)
(22)
(23)
B.W. Cherry and C.M. Holmes - j. Colloid and Int Sci, 29, 174 (1969)
R.N. Wenzel - Ind Eng and Chem, 28, 988 (1936)
R. Shuttleworth and G.I. Bailey - Discussions Faraday Soc, 316, (1948)
W.K. Adam and R.S. Morell - j. Soc. Chem Ind 53, 255T (1934)
W.C. Bigelow, D.L. Pickett and W.A. Zisman, - j. ColI. Sci, 1,513 - 538 , ,(1946)
(24) T.J. Fort and H.T. Patters on - J. ColI. Sci 18, 217-222 (1963)
(25) G.E. Collins - j. Textile Inst, 38, 173 - 178 (1947)
(26) W.C. jones and M.C. Porter - J. ColI. Int Sci 24, 1-3 (1967)
(27) T.R. Grindstaff - Textile Research Journal, Oct 69, 958

· (28) L.,Glasser and R.P. Miller - J. of Chem. Ed. Vol. 42, No. 265
(19) J .B. Donnet and M. Dauksch -':t;st Int Conf. Carbon Fibre, P.I., Feb 71
(30) D.A. Scola'and C.S. Brooks - 25th Ann. Tech. Conf. (1970) Rein.
Plastics/Comp. Division S.P.I.
(31) J .l~. Herrick, P.E. Gruber, F.I. Monsur - AFML - TR-66-178 Part 1
(32) J.W. Herrick, 23rd Ann. Tech, Conf. 68 Reinforced Plastics/Comp.
Division SPI
(33) ASTM D1510-65
(34) M. Yamamoto, S. Yamada, Y. Sakatani, M. Taguchi, and Y. Yamaguchi
1st Int. Carbon Fibre Cohf. P.I. 71 )
(35) M.J. Stevens - Private Communications IPT Loughborough University
(36) J.C. Goan and S.P. Pros en-Interfaces in Composites ASTM STP 452
(37) R. Dukes and B.A. Barnett - Research Projects III P.I. Conf. 1971
(38) L.J. Broutman - Poly. Eng. and Sci. - July (1966)
(39) N.M. Trivisanno and L.H. Lee - Ind. Eng. Chem. 50 912 (1958)
(40) W.E. Edelman and J .M. Dahlke - Ann. Meeting Soc. Exp. Stress Analysis
Nov 1967
(41) G.D. Andreavska and U.A. Garbatkina - Verre Text. Plast. Renf 5(11),
(42)
(43)
13-15 (1967)
N.J. Wadsworth and I. Spilling - Brit. J. Appl. Phys. Ser 2" Vol 1 (1968)
I.D. Aitken, G.R. Rhodes and R.A.P. Spencer - BPF Ann. Tech.Conf. 1970
paper 24.
(44) I.D. Aitken, G.R. Rhodes and R.A.P. Spencer - U.K.A.E.A. Research
Group Harwell (1970)
(45) L.J. Broutman - AS1M STP 452
(46) M. Vasta and V;· Zvonar - Adhesive Age Oet 1965
(47) B. Harris, Beaumont and Moncinill de Ferran - J. Mat. Sci 6
(1971) 238-251
(48) W.J. Eakins - ASTM STP 452
'(49) A. Kelly - Proe. Roy. Soc. London A319, 95, 116 (1970)
(50) G.A. Cooper and A. Kelly ASTM STP 452 (1969)
(51) J .0. Outlvater and M.C. Murphy - 26th Ann.Conf. Rein.Plas./Comp.Div
APl (1969)
(52) M.R. Piggott - J. Hat. Sci - 5,669 - 675, (1970)
(53) D.F. Canon - Railway Technical Centre, Derby, - Private Communications
(54) G.T. Merrall - 7th Int. Rein. Plastics Conf. BPF (1970)
(55) F.J. McGarry and A. Willner - R68-6 - March 1969 (MIT)
(56) F.J. McGarry and J. Sutton - 24th Ann Tech Conf Rein Plastics/Comp Div
SPI (1969)
(57) A.C. Soldatos and A.S. Burhans - 25th Ann Tech Conf. Rein. Plast./
Comp. Div. SPI (1970)
(58) R.S. Drake, E.H. Rowe, A.R. Siebert and C~ Kiethriew - 7th Int. Rein.
Plast. Conf. BPF (1970)
(59) L.N. Phillips and K.F. Rogers - Polymer Age 3 No. 5 May (1972)
(60) K.F. Rogers, G.R. Sidney and D.M. Kingston-Lee-Composites 2 No. 4
Dec 71
(61) M.J. Owen and R.G. Rose - Research Projects III p.r. Conf. (1971)
(62) Du Pont Adiprene Urethane Rubber Bulletin No. 2
(63) A.C. Meeks - Shell Research Egham private discussion
(64) F. Lord - ICI Organics Division Blakely private discussion
(65) J. Hitter - Interscience App. Polymer Symposia No. 15 (1970)
(66) J .G. Morley - Composites 2 No. 2 June p80-4 (1971)
(67) Melinex - ICI's poly ethylene terephthalate biaxially orientated sheet
. (68) G.R. Sidey and F.J. Bradshaw - Int Carbon Fibre Conf. P.I. 1971
(69) G. Fairbairn, C.J. Dominic an~ E.W. Garnish - Int. Carbon Fibre Conf.
P.I. 1971 .
(70) P.F. Bertsch - Rubber World - June 1961 p75-81
(71) Encyclopedia of Polymer Science and Technology
(72) Dr R.R. Smith - Private Discussions
,.'
(73) H.G. Tattersall and G. Tappin - J. Mater. Sci. 1, 296 (1966)
(74) W.N. Findley and O.E. Hintz - ASTM Proc. 43 1 226 (1943)
(75) D. Telfair and H.K. Nazen - ASTM Prec. 43 1'211 (1943)
(76) J.R. Heater and E.M. Lacey - Modern Plastics 41, 9, 123 (1964)

I I
(77) A.A. Criffiths - Phil. Trans. Royal Soc. - Series A; Vol.· 221 1920
(78) C.R. II'IVin.- Proc 7th Sagrunore Ord Matts Res Conf 1960 - IV
(79) ASTM - STP N381 (1965)
(80) B.R. Research and Development Internal Publication - Linear Elastic
Fracture Mechanics - D. Canon
(81) M.E. Waddoups, J.E. Eisenmann and B.E. Kruninski - J. Comp Mat Vol. 5,
Oct 1971
(82) R.J. Sanford and F.R. Stones if er - J. Comp Mat Vol. 5 April 1971
(83) P.B. Crosley and E.J. Ripling - J. Basic Eng Sept 1969
(84) S. Mostavoy, P.B. Crosley and E.J. Ripling - J. of Mat Vol. 2 No. 3
Sept 1967
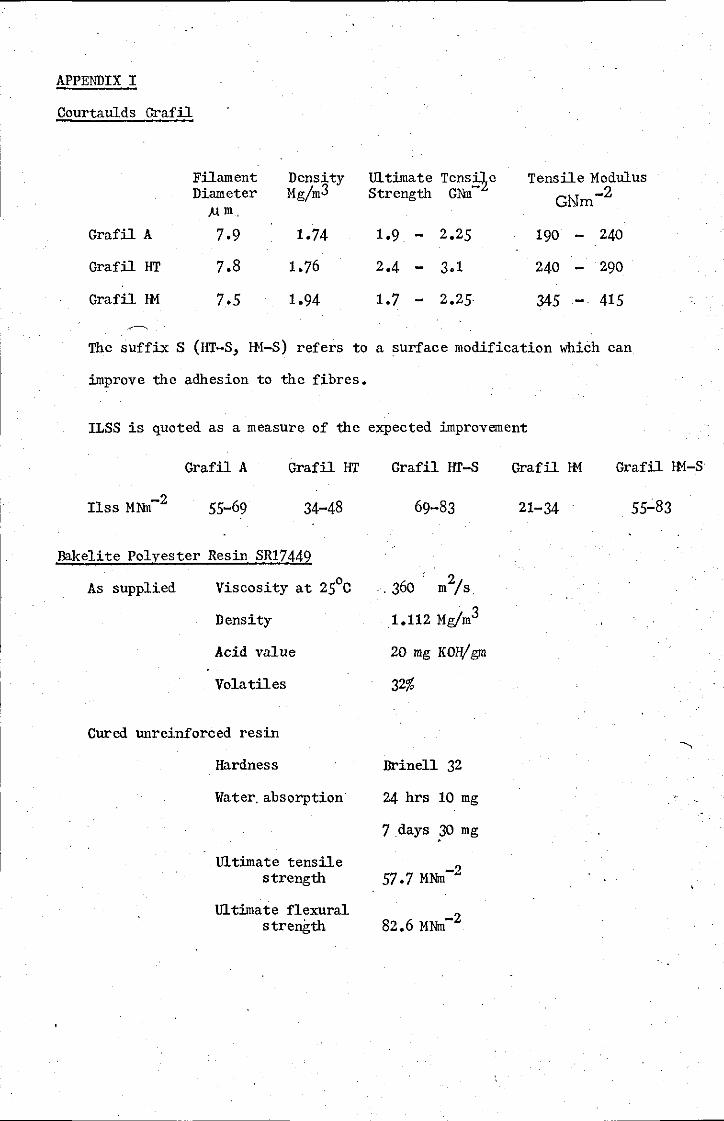
APPENDIX I
Courtaulds Grafil
Filament Density Ultimate Tens~e Tensile Modulus Diameter Mg/m3 Strength GNn GNm -2
}.l m ,
Grafil A 7.9 1.74 1.9 - 2.25 190 - 240
Grafil HT 7.8 1.76 2.4 - 3.1 240 - 290
Grafil lM 7.5 1.94 1.7 - 2.25 345 -. 415
The suffix S (HT-S, lM-S) refers to a surface modification which can
improve the adhesion to the fibres.
ILSS is quoted as a measure of the expected improvement
-2 Ilss MNn
Grafil A
55-69
GrafilHT
34-48
Bakelite Polyester Resin SR17449
As supplied Viscosity at 25°C
Density
Acid value
Vola tiles
Cured unreinforced resin
Hardness
Water, absorption
Ultimate tensile strength
Ultimate flexural strength
Grafil HT-S
69-83
,360 m2/s
1.112 Mg/m3
20 mg KO!V' gm
32%
Brinell 32
24 hrs 10 mg
7 days .30 mg
Grafil lM
21-34
Grafil lM-S
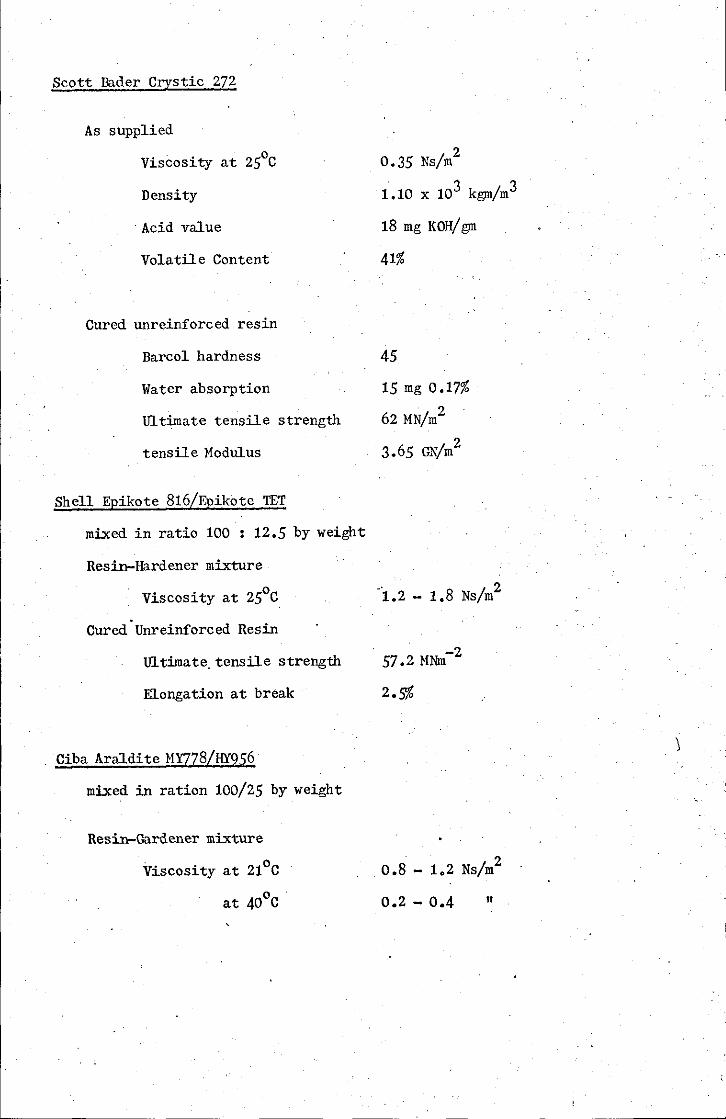
Scott Bader Crystic 272
As supplied
Viscosity at 25°C
Density
. Acid value
Volatile Content
Cured unreinforced resin
Barcol hardness
Water absorption
ill tima te tensil e strength
tensile Modulus
Shell Epikote 816/Epikote TET
mixed in ratio 100 : 12.5 by weight
Resin-Hardener mixture
Viscosity at 25°C
Cured Unreinforced Resin
illtimate. tensile strength
Elongation at break
Ciba Araldi te MY778/HY956
mixed in ration 100/25 by weight
Resin-Gardener mixture
Viscosity at 21°C
at 40°C·
0.35 Ns/m2
1.10 x 10³ kgm/m3
18 mg KOH/gm
41%
45
15mgO.17%
62 MN/m2
3.65 GN/m2
.' ! 2 1.2 - 1.8 Ns m
. ! 2 0.8 - 1.2 Ns m
0.2 - 0.4 tI
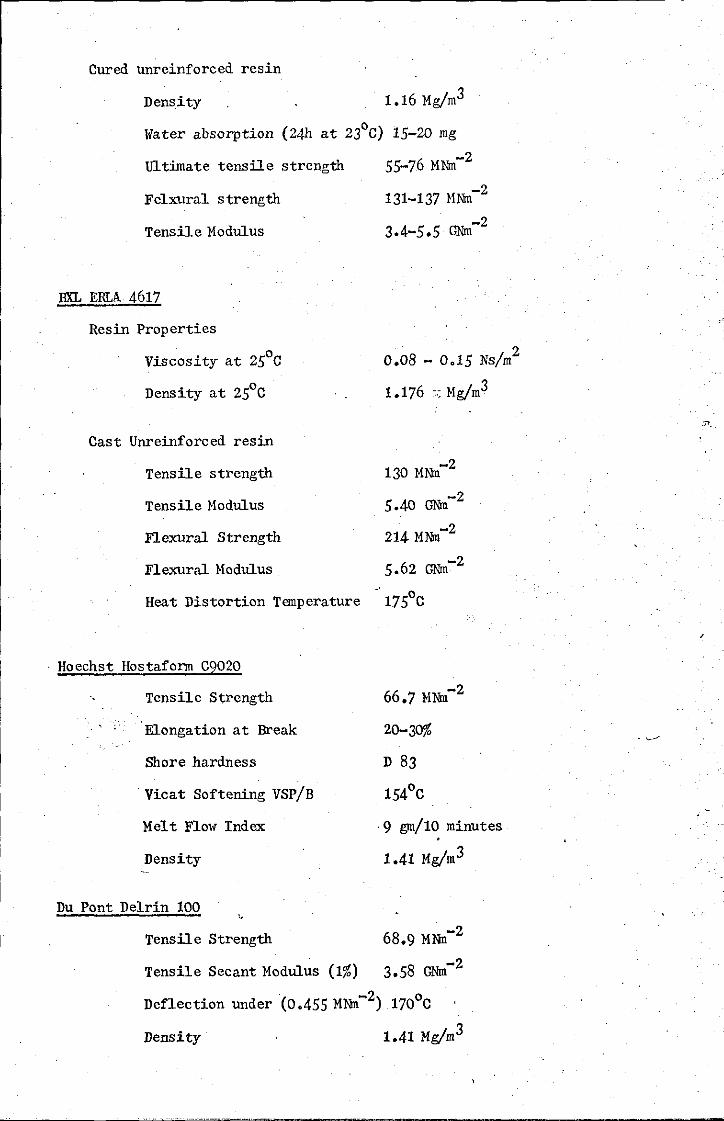
Cured unreinforced resin
Density
Water absorption (24h at 23°C) 15-20 mg
Ultimate tensile strength 55-76 MNn-2
Felxural strength 131-137 HNn-2
Tensile Hodulus -2
3.4-5.5 GNm
JlXL ERLA 4617
Resin Properties
Viscosity at 25°C
Density at 25°C·
2 0.08 - 0.15 Ns/m
1.176:; Mg/m3
Cast Unreinforced resin
Tensile strength 130 MNn-2
Tensile Modulus 5.40 GNm-2
Flexural Strength 214 MNn-2
Flexural Modulus 5.62 GNm-2
Heat Distortion Temperature 175°C
. Hoechst Hostafonn C9020
Tensile Strength 66.7 HNn-2
20-30% . ' ·Elongation at Break
Shore hardness
Vicat Softening VSP/B
Mel t Flow Index
Density
D 83
154°C
·9 gm/l0 minutes
1.41 Mg/m3
Du Pont Delrin 100
Tensile Strength 68.9 MNn-2
Tensile Secant Modulus (1%) 3.58 GNm-2
Deflection under (0.455 MNn-2) 170°C
Density 1.41 Hg/m3
:71'.
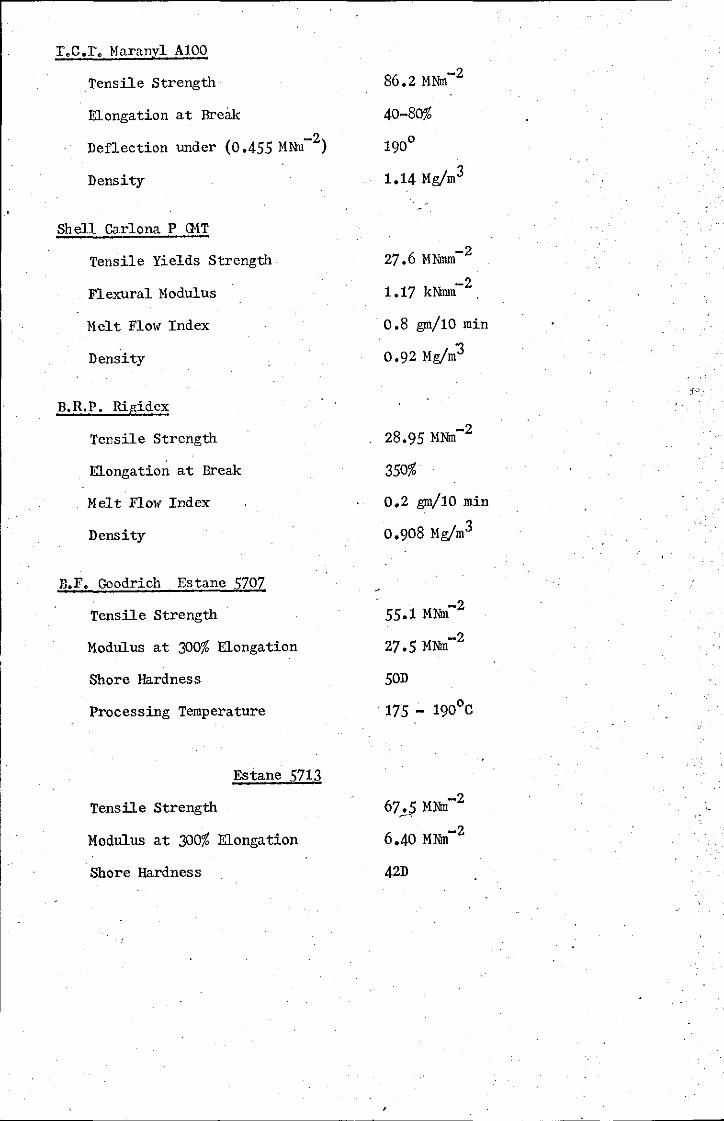
I,C.I, Maranyl Al00
Tensile Strength
Elongation at Break
Deflection under (0.455 MNn-2)
Density
Shell Carlona P GMT
Tensile Yields Strength
Flexural Modulus
Melt Flow Index
Density
B.R.P. Rigidex
Tensile Strength
Elongation at Break
Melt Flow Index
Density
B.F, Goodrich Estane 5707
Tensile Strength
Modulus at 300% Elongation
Shore Hardness
Processing Temperature
Estane 5713
Tensile Strength
Modulus at 300% Elongation
Shore Hardness
86.2 MNn-2
40-80%
1900
1.14 Mg/m3
27.6 MNnm-2
1.17 kNnm-2 .
0.8 gm/l0 min
0.92 Mg/m'3
0.2 gm/l0 min
0.908 Mg/m3
·55.1 MNn-2
27.5 MNm-2
SOD
175 - 190°C
67~ MNrt-2
6.40 MNrt-2
42D

APPENDIX 2
l~ eiss enburg Rh eo goniometer
Tne Weissenburg Rheogoniometer was used in thesis to measure the
o viscosity of a--range of resins over a temperature range from 20-50 C.
The basis of the instrument is a cone and plate, nearly in contact with
one another. The liquid fills the space between the two and the plate
rotates at a fixed speed. The force transmitted through the liquid
exerts a force on the cone. The force exerted is derived from a
calibrated torsion beam on which the cone is suspended, and the amount
the cone is deflected.
At a particular plate rotational speed there is a constant shear rate.
If the angular velocity is w rad/sec
Then the circular velocity V at a radius r from the centre
V = wr
The gap between the cone and plate at a radius r where the angle between
cone and plate is ~ ,
= r tan~
r B (small angles)
Then the shear rate Y in th~ polymer at this point
This shows that by using a cone and plate viscometer with a small
included angle the shear rate is independant of the radius r
The viscosity of a liquid = Stress
Shear rate
For a particular instrument with a set angle between cone and plate, the
shear rate depends on the angular velocity of the plate. The stress
applied to the cone can be deducted from the deflection of the
calibrated torsion bar supporting the cone.

The Weissenburg can rotate the plate over several decades of shear rate
and detect stresses on the cone to cover this wide range. It can thus
be-used to show how viscosities of· polymers vary with the rate at which
they are sheared.
. I