eia - reinforced plastics, final
TRANSCRIPT
United States Office Of Air Quality Planning And Standards
Agency Research Triangle Park, NC 27711 FINAL REPORT Environmental Protection August 2002
Air
Economic Impact Analysis of the Final Reinforced Plastics NESHAP
Final Report

EPA 452/R-02-007 August 2002
Economic Impact Analysis of the Final Reinforced Plastics NESHAP
By:Brooks M. DeproMark C. Buckley
Tayler H. BinghamCenter for Regulatory Economics and Policy Research
RTIResearch Triangle Park, NC 27709
Prepared for:Tyler J. Fox
U.S. Environmental Protection AgencyOffice of Air Quality Planning and StandardsInnovative Strategies and Economics Group
(MD-C339-01)Research Triangle Park, NC 27711
EPA Contract No. 68-D-99-024 RTI Project No. 7647.003.271
Tom Curran, DirectorU.S. Environmental Protection Agency
Office of Air Quality Planning and StandardsOffice of Air and Radiation
Research Triangle Park, NC 27711
This report has been reviewed by the Emission Standards Division of the Office of Air Quality Planning and Standards of the United States Environmental Protection Agency and approved for publication. Mention of trade names or commercial products is not intended to constitute endorsement or recommendation for use. Copies of this report are available through the Library Services (MD-C267-01), U.S. Environmental Protection Agency, Research Triangle Park, NC 27711, or from the National Technical Information Services 5285 Port Royal Road, Springfield, VA 22161.

CONTENTS
Section Page
1 Introduction . . . . . . . . . . . . . . . . . . . . . . . . . . . . . . . . . . . . . . . . . . . . . . . . . . . . 1-1
1.1 Organization of the Report . . . . . . . . . . . . . . . . . . . . . . . . . . . . . . . . . . . 1-1
2 Industry Profile . . . . . . . . . . . . . . . . . . . . . . . . . . . . . . . . . . . . . . . . . . . . . . . . . . 2-1
2.1 Production . . . . . . . . . . . . . . . . . . . . . . . . . . . . . . . . . . . . . . . . . . . . . . . 2-32.1.1 Material Inputs . . . . . . . . . . . . . . . . . . . . . . . . . . . . . . . . . . . . . . 2-5
2.1.1.1 Plastic Resins . . . . . . . . . . . . . . . . . . . . . . . . . . . . . . . 2-52.1.1.2 Reinforcements . . . . . . . . . . . . . . . . . . . . . . . . . . . . . . 2-62.1.1.3 Nonreinforcing Fillers . . . . . . . . . . . . . . . . . . . . . . . . . 2-72.1.1.4 Additives . . . . . . . . . . . . . . . . . . . . . . . . . . . . . . . . . . . 2-8
2.1.2 Production Processes . . . . . . . . . . . . . . . . . . . . . . . . . . . . . . . . 2-102.1.2.1 Open Molding Processes . . . . . . . . . . . . . . . . . . . . . . 2-102.1.2.2 Closed Molding Processes . . . . . . . . . . . . . . . . . . . . 2-14
2.2 Products . . . . . . . . . . . . . . . . . . . . . . . . . . . . . . . . . . . . . . . . . . . . . . . . 2-19
2.3 Cost of Production . . . . . . . . . . . . . . . . . . . . . . . . . . . . . . . . . . . . . . . . 2-19
2.4 Uses and Consumers of Reinforced Plastics . . . . . . . . . . . . . . . . . . . . 2-19
2.5 Manufacturing Facilities . . . . . . . . . . . . . . . . . . . . . . . . . . . . . . . . . . . 2-292.5.1 Location . . . . . . . . . . . . . . . . . . . . . . . . . . . . . . . . . . . . . . . . . . 2-292.5.2 Employment . . . . . . . . . . . . . . . . . . . . . . . . . . . . . . . . . . . . . . . 2-29
2.6 Facility Ownership . . . . . . . . . . . . . . . . . . . . . . . . . . . . . . . . . . . . . . . . 2-292.6.1 Size Distribution . . . . . . . . . . . . . . . . . . . . . . . . . . . . . . . . . . . 2-312.6.2 Issues of Vertical and Horizontal Integration . . . . . . . . . . . . . 2-34
2.7 Small Businesses . . . . . . . . . . . . . . . . . . . . . . . . . . . . . . . . . . . . . . . . . 2-342.7.1 Identifying Small Businesses . . . . . . . . . . . . . . . . . . . . . . . . . . 2-34
iii
3 Engineering Cost Analysis . . . . . . . . . . . . . . . . . . . . . . . . . . . . . . . . . . . . . . . . . 3-13.1 Identifying Regulated Entities . . . . . . . . . . . . . . . . . . . . . . . . . . . . . . . . 3-13.2 National Control Cost Estimates . . . . . . . . . . . . . . . . . . . . . . . . . . . . . . 3-1
4 Economic Impact Analysis . . . . . . . . . . . . . . . . . . . . . . . . . . . . . . . . . . . . . . . . 4-1
4.1 Reinforced Plastic Composite Markets . . . . . . . . . . . . . . . . . . . . . . . . . 4-2
4.2 Producers, Costs, and Supply . . . . . . . . . . . . . . . . . . . . . . . . . . . . . . . . . 4-6
4.3 Consumers, Value, and Demand . . . . . . . . . . . . . . . . . . . . . . . . . . . . . . 4-8
4.4 Baseline and With-Regulation Equilibrium . . . . . . . . . . . . . . . . . . . . . 4-10
4.5 Results . . . . . . . . . . . . . . . . . . . . . . . . . . . . . . . . . . . . . . . . . . . . . . . . . 4-104.5.1 Market-Level Impacts . . . . . . . . . . . . . . . . . . . . . . . . . . . . . . . 4-124.5.2 Industry-Level Impacts . . . . . . . . . . . . . . . . . . . . . . . . . . . . . . . 4-16
4.5.2.1 Changes in Pre-Tax Earnings . . . . . . . . . . . . . . . . . . 4-184.5.2.2 Product-Line and Facility-Level Impacts . . . . . . . . . 4-204.5.2.3 Changes in Employment . . . . . . . . . . . . . . . . . . . . . . 4-22
4.6 Social Costs . . . . . . . . . . . . . . . . . . . . . . . . . . . . . . . . . . . . . . . . . . . . . 4-22
4.7 Sensitivity Analysis for Profit Rate . . . . . . . . . . . . . . . . . . . . . . . . . . . 4-26
4.8 New Source Analysis . . . . . . . . . . . . . . . . . . . . . . . . . . . . . . . . . . . . . . 4-27
5 Final Regulatory Flexibility Analysis . . . . . . . . . . . . . . . . . . . . . . . . . . . . . . . . 5-1
5.1 Statement of Need and Objectives of the Rule . . . . . . . . . . . . . . . . . . . 5-2
5.2 Identifying Small Businesses . . . . . . . . . . . . . . . . . . . . . . . . . . . . . . . . . 5-3
5.3 Screening-Level Analysis . . . . . . . . . . . . . . . . . . . . . . . . . . . . . . . . . . . 5-35.3.1 Recommended Alternative . . . . . . . . . . . . . . . . . . . . . . . . . . . . . 5-35.3.2 MACT Floor Alternative . . . . . . . . . . . . . . . . . . . . . . . . . . . . . . 5-55.3.3 Above-the-MACT Floor Alternative . . . . . . . . . . . . . . . . . . . . . 5-5
5.4 Economic Analysis . . . . . . . . . . . . . . . . . . . . . . . . . . . . . . . . . . . . . . . 5-11
5.5 Assessment . . . . . . . . . . . . . . . . . . . . . . . . . . . . . . . . . . . . . . . . . . . . . . 5-11
5.6 Projected Reporting and Recordkeeping Requirements . . . . . . . . . . . 5-13
iv
5.7 Other Federal Rules That May Impact Reinforced Plastic CompositeProduction Facilities . . . . . . . . . . . . . . . . . . . . . . . . . . . . . . . . . . . . . . 5-14
5.8 Alternatives to the Proposed Rule . . . . . . . . . . . . . . . . . . . . . . . . . . . . 5-14
References . . . . . . . . . . . . . . . . . . . . . . . . . . . . . . . . . . . . . . . . . . . . . . . . . . . . . . . . . . . R-1
Appendix A Summary Data for Companies Owning ReinforcedPlastic Composite Facilities . . . . . . . . . . . . . . . . . . . . . . . . . . . . . . . . . A-1
Appendix B Economic Model of the Merchant Sector of the U.S. ReinforcedPlastic Composites Industry . . . . . . . . . . . . . . . . . . . . . . . . . . . . . . . . . . B-1
v
LIST OF FIGURES
Number Page
2-1 Production Flows for Reinforced Plastic Composites . . . . . . . . . . . . . . . . . . . . 2-42-2 Hand Lay-up Processing . . . . . . . . . . . . . . . . . . . . . . . . . . . . . . . . . . . . . . . . . 2-122-3 Spray-up Processing . . . . . . . . . . . . . . . . . . . . . . . . . . . . . . . . . . . . . . . . . . . . 2-122-4 Filament Winding . . . . . . . . . . . . . . . . . . . . . . . . . . . . . . . . . . . . . . . . . . . . . . 2-132-5 Pultrusion . . . . . . . . . . . . . . . . . . . . . . . . . . . . . . . . . . . . . . . . . . . . . . . . . . . . 2-152-6 Injection Molding . . . . . . . . . . . . . . . . . . . . . . . . . . . . . . . . . . . . . . . . . . . . . . 2-182-7 Consumption of Reinforced Plastic Composites by Market Segment:
1997 . . . . . . . . . . . . . . . . . . . . . . . . . . . . . . . . . . . . . . . . . . . . . . . . . . . . . . . . . 2-262-8 Geographic Distribution of Major Source Facilities . . . . . . . . . . . . . . . . . . . . 2-302-9 Alternative Chains of Ownership . . . . . . . . . . . . . . . . . . . . . . . . . . . . . . . . . . . 2-322-10 RPC Firms by Size . . . . . . . . . . . . . . . . . . . . . . . . . . . . . . . . . . . . . . . . . . . . . . 2-37
4-1 Supply Curve for a Representative Directly Affected Merchant Facility . . . . . 4-74-2 Demand Curve for RPCs . . . . . . . . . . . . . . . . . . . . . . . . . . . . . . . . . . . . . . . . . . 4-94-3 Market Equilibrium Without and With Regulation . . . . . . . . . . . . . . . . . . . . . 4-114-4 Sensitivity of Changes in Consumer Surplus to the Elasticity of
Demand . . . . . . . . . . . . . . . . . . . . . . . . . . . . . . . . . . . . . . . . . . . . . . . . . . . . . . 4-254-5 Baseline Equilibrium without Regulation . . . . . . . . . . . . . . . . . . . . . . . . . . . . 4-284-6 With-Regulation Equilibrium Case 1: New Sources Added . . . . . . . . . . . . . . 4-304-7 With-Regulation Equilibrium Case 2: No New Sources Added . . . . . . . . . . . 4-30
5-1(a) Distribution of Cost-to-Sales Ratios for Small Companies: RecommendedAlternative . . . . . . . . . . . . . . . . . . . . . . . . . . . . . . . . . . . . . . . . . . . . . . . . . . . . . 5-6
5-1(b) Distribution of Cost-to-Sales Ratios for Large Companies: RecommendedAlternative . . . . . . . . . . . . . . . . . . . . . . . . . . . . . . . . . . . . . . . . . . . . . . . . . . . . . 5-6
5-2(a) Distribution of Cost-to-Sales Ratios for Small Companies: MACTFloor Alternative . . . . . . . . . . . . . . . . . . . . . . . . . . . . . . . . . . . . . . . . . . . . . . . . 5-8
5-2(b) Distribution of Cost-to-Sales Ratios for Large Companies: MACTFloor Alternative . . . . . . . . . . . . . . . . . . . . . . . . . . . . . . . . . . . . . . . . . . . . . . . . 5-8
5-3(a) Distribution of Cost-to-Sales Ratios for Small Companies: Above-the-MACT-Floor Alternative . . . . . . . . . . . . . . . . . . . . . . . . . . . . . . . . . . . . . . . . . 5-10
5-3(b) Distribution of Cost-to-Sales Ratios for Large Companies: Above-the-MACT-Floor Alternative . . . . . . . . . . . . . . . . . . . . . . . . . . . . . . . . . . . . . . . . . 5-10
vi
LIST OF TABLES
Number Page
2-1 SIC Codes for Potentially Affected Products . . . . . . . . . . . . . . . . . . . . . . . . . . . 2-22-2 Consumption of Reinforced Plastics by Resin Type: 1991-1993 . . . . . . . . . . . 2-62-3 Consumption of Fibrous Reinforcements in Plastics: 1990 . . . . . . . . . . . . . . . 2-82-4 Consumption of Nonreinforcing Fillers in Plastics: 1990 . . . . . . . . . . . . . . . . 2-92-5 Consumption of Plastics Additives: 1990 . . . . . . . . . . . . . . . . . . . . . . . . . . . . . 2-92-6 Reinforced Plastics Shipments by Production Process: 1990 . . . . . . . . . . . . . 2-102-7 Compatibility of RPC Production Processes with Shape
Characteristics and Specific Products . . . . . . . . . . . . . . . . . . . . . . . . . . . . . . . 2-202-8 Plastic Resin Prices: 1996-1999 . . . . . . . . . . . . . . . . . . . . . . . . . . . . . . . . . . . 2-222-9 Selected Plastic Reinforcement and Filler Prices: 1997 . . . . . . . . . . . . . . . . . 2-232-10 Demand for Reinforced Plastic Composites: Some Examples . . . . . . . . . . . . 2-252-11 Consumption of Reinforced Plastic Composites by End Use: 1984-
1997 (106 lbs) . . . . . . . . . . . . . . . . . . . . . . . . . . . . . . . . . . . . . . . . . . . . . . . . . . 2-272-12 Consumption of Reinforced Unsaturated Polyester by End Use: 1984-
1993 (106 lbs) . . . . . . . . . . . . . . . . . . . . . . . . . . . . . . . . . . . . . . . . . . . . . . . . . . 2-282-13 Distribution of Major Source Facilities by Employment . . . . . . . . . . . . . . . . . 2-312-14 Distribution of Potentially Affected Firms by Employment . . . . . . . . . . . . . . 2-332-15 Distribution of Potentially Affected Firms By Sales . . . . . . . . . . . . . . . . . . . . 2-332-16 Small Business Administration Size Standards for RPC—Companies
by SIC . . . . . . . . . . . . . . . . . . . . . . . . . . . . . . . . . . . . . . . . . . . . . . . . . . . . . . . 2-36
4-1 Reinforced Plastics Composites Shipments by End-Use Market:1997 (106 lbs) . . . . . . . . . . . . . . . . . . . . . . . . . . . . . . . . . . . . . . . . . . . . . . . . . . . 4-4
4-2 Estimated Market Quantities and Prices for Reinforced PlasticsComposites by Product Group: 1997 . . . . . . . . . . . . . . . . . . . . . . . . . . . . . . . . 4-5
4-3 Market-Level Impacts of the Reinforced Plastic Composites NESHAPRegulatory Alternatives: 1997 . . . . . . . . . . . . . . . . . . . . . . . . . . . . . . . . . . . . 4-13
4-4 Summary of Compliance Costs and Market Price Changes: 1997($/lb) . . . . . . . . . . . . . . . . . . . . . . . . . . . . . . . . . . . . . . . . . . . . . . . . . . . . . . . . . 4-15
4-5 Industry-Level Impacts of Reinforced Plastic Composites NESHAPRegulatory Alternatives: 1997 . . . . . . . . . . . . . . . . . . . . . . . . . . . . . . . . . . . . 4-17
4-6 Distributional Impacts on Merchant Thermoset Producers Associatedwith Reinforced Plastic Composites NESHAP Regulatory Alternatives: 1997 . . . . . . . . . . . . . . . . . . . . . . . . . . . . . . . . . . . . . . . . . . . . . . 4-19
vii

4-7 Social Costs with Reinforced Plastic Composites NESHAP RegulatoryAlternatives: 1997 . . . . . . . . . . . . . . . . . . . . . . . . . . . . . . . . . . . . . . . . . . . . . . 4-24
4-8 Summary of Economic Impacts Under Range of Industry Profit Rates:Recommended Alternative . . . . . . . . . . . . . . . . . . . . . . . . . . . . . . . . . . . . . . . . 4-27
4-9 New Source Analysis of Unit Production and Compliance Costs($1997) . . . . . . . . . . . . . . . . . . . . . . . . . . . . . . . . . . . . . . . . . . . . . . . . . . . . . . . 4-31
4-10 Changes in Facility Construction Under the Proposed NESHAP: 2000–2005 . . . . . . . . . . . . . . . . . . . . . . . . . . . . . . . . . . . . . . . . . . . . . . . . . . . . 4-32
5-1 Summary Statistics for SBREFA Screening Analysis: RecommendedAlternative . . . . . . . . . . . . . . . . . . . . . . . . . . . . . . . . . . . . . . . . . . . . . . . . . . . . . 5-4
5-2 Summary Statistics for SBREFA Screening Analysis: MACT Floor Alternative . . . . . . . . . . . . . . . . . . . . . . . . . . . . . . . . . . . . . . . . . . . . . . . . . . . . . 5-7
5-3 Summary Statistics for SBREFA Screening Analysis: Above-the-MACT-Floor Alternative . . . . . . . . . . . . . . . . . . . . . . . . . . . . . . . . . . . . . . . . . . . . . . . . 5-9
5-4 Summary of Small Business Impacts of Reinforced Plastic CompositesNESHAP . . . . . . . . . . . . . . . . . . . . . . . . . . . . . . . . . . . . . . . . . . . . . . . . . . . . . 5-12
viii
SECTION 1
INTRODUCTION
The Clean Air Act’s (CAA’s) purpose is to protect and enhance the quality of the nation’s air resources (Section 101(b)). Under the authority of Section 112 of the CAA as amended in 1990, the U.S. Environmental Protection Agency (EPA or the Agency) is currently developing a National Emission Standard for Hazardous Air Pollutants (NESHAP) to reduce emissions generated during the production of reinforced plastic composites (RPCs). This report evaluates the economic impacts of three regulatory alternatives that are designed to control these releases.
1.1 Organization of the Report
This report is divided into four sections and two appendices that describe the industry and economic methodology and present results of this economic impact analysis (EIA):
� Section 2 provides a summary profile for the manufacture of RPCs. It presents data on manufacturing plants and the companies that own and operate these plants.
� Section 3 reviews the regulatory control alternatives and associated costs of compliance. These costs are based on EPA’s engineering analysis conducted in support of the proposed NESHAP as described in the Background Information Document (BID).
� Section 4 details the methodology for assessing the economic impacts of the proposed NESHAP and the results of the analysis, which include market, industry, and social welfare impacts.
� Section 5 provides the Agency’s screening and economic analyses of the regulation’s impact on affected small businesses.
� Appendix A provides a list of companies that own directly affected facilities and includes sales, employment, and size classification.
� Appendix B provides a detailed description of the Agency’s economic model.
1-1
SECTION 2
INDUSTRY PROFILE
Plastics are one of the most used materials in U.S. industrial and commercial activities
and contribute to virtually all products consumed from packaging to motor vehicles. Plastics can
be divided into two major groups by resin type: thermoset or thermoplastic. When additional
strength is required, many plastics can be reinforced with structural materials to produce RPCs.
In the production of RPCs, polymers and reinforcing materials can be compounded with a
variety of fillers to minimize resin requirements and additives that change the physical properties
of the desired composite. The polymer is most often a thermosetting resin and the typical
reinforcement is glass fiber. Compounding consists of mixing these various materials
(sometimes in several stages) and reforming the homogeneous mass into a usable form such as
pellets, flakes, or sheets for processing into the final product. A wide variety of RPC processes
have evolved to facilitate efficient production of many different types of composites with
different physical properties. The fundamental characteristics of the resulting composites include
lightweight, high strength-to-weight ratio, nonconductivity, various degrees of
corrosion-resistance, and dimensional stability.
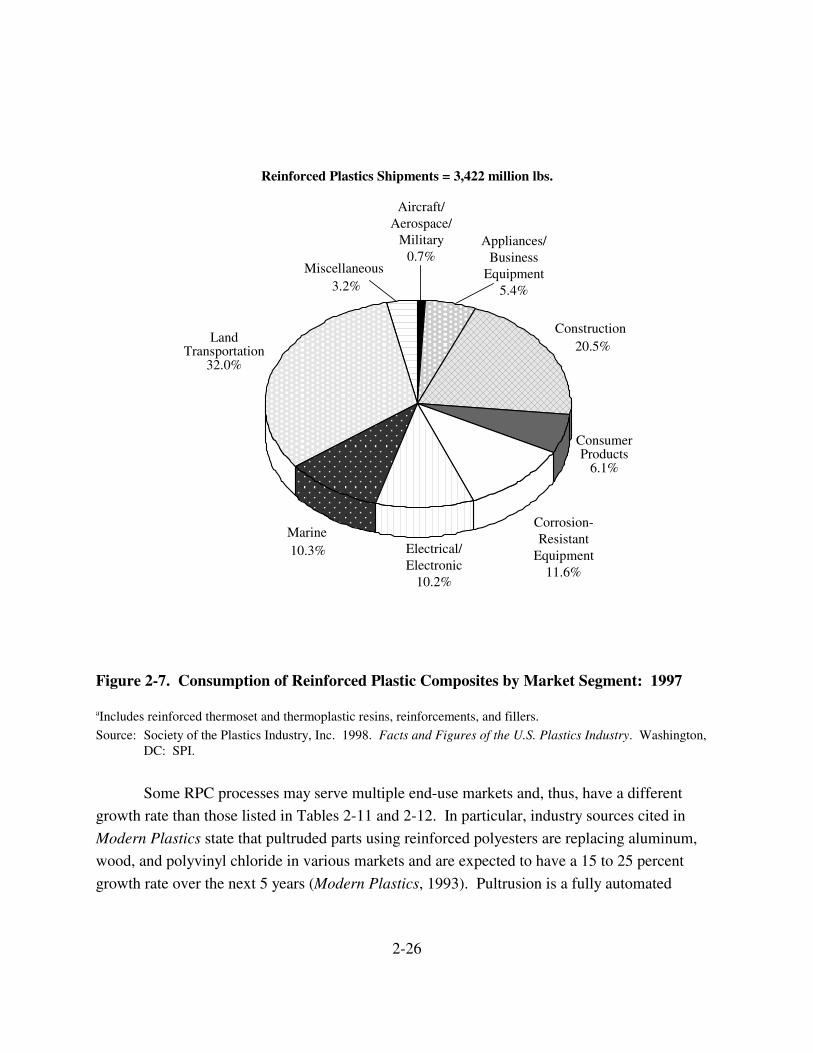
In 1997, 3.4 billion pounds of RPCs were consumed in the United States. The RPC
market is divided into a number of segments according to its end use. The market segments
include general aviation, aerospace, appliances, business equipment, construction, consumer
goods, corrosion-resistant products, electrical/electronics, marine, and land transportation (e.g.,
motor vehicles, trucks, buses). The transportation segment was the largest consumer of RPCs
with 1,095 million pounds, or 32 percent of the total consumed in 1997. The construction
segment followed with 700 million pounds of reinforced plastics consumed in 1997 (SPI, 1998).
Reinforced plastics are used in the production of many different products, as indicated by
the involvement of 42 different SIC codes, as Table 2-1 shows. The SIC codes were obtained
from the updated 1993 EPA survey and subsequent screening for potentially affected reinforced
plastics producers.
The remainder of this section provides a brief introduction to the reinforced plastics
industry. Although the reinforced plastics source category includes only thermoset materials, this
2-1

Table 2-1. SIC Codes for Potentially Affected Products
SIC Definition
2434 Wood Kitchen Cabinets2519 Household Furniture, NEC2522 Office Furniture, Except Wood 2541 Wood Office and Store Fixtures, Partitions, Shelving, and Lockers2599 Furniture and Fixtures, NEC2821 Plastics Material and Synthetic Resins, and Nonvulcanizable Elastomers3082 Unsupported Plastics Profile Shapes3083 Laminated Plastics Plate, Sheet, and Profile Shapes3084 Plastics Pipe 3087 Custom Compounding of Purchased Plastics Resins3088 Plastics Plumbing Fixtures3089 Plastics Products, NEC3281 Cut Stone and Stone Products3296 Mineral Wool3299 Nonmetallic Mineral Products, NEC3431 Enameled Iron and Metal Sanitary Ware 3499 Fabricated Metal Products, NEC3531 Construction Machinery and Equipment3533 Oil and Gas Field Machinery and Equipment3546 Power-Driven Handtools3561 Pumps and Pumping Equipment3564 Industrial and Commercial Fans and Blowers and Air Purification Equipment3589 Service Industry Machinery, NEC3612 Power, Distribution, and Specialty Transformers3613 Switchgear and Switchboard Apparatus3621 Motors and Generators3647 Vehicular Lighting Equipment3663 Radio and Television Broadcasting and Communications Equipment3679 Electronic Components, NEC3711 Motor Vehicles and Passenger Car Bodies3713 Truck and Bus Bodies3714 Motor Vehicle Parts and Accessories3715 Truck Trailers3716 Motor Homes3728 Aircraft3743 Aircraft Parts and Equipment, NEC3792 Travel Trailers and Campers3799 Transportation Equipment, NEC3821 Laboratory Apparatus and Furniture 3949 Sporting and Athletic Goods, NEC3993 Signs and Advertising Specialties3999 Manufacturing Industries, NEC
2-2

profile provides a broader picture of the RPC industry. Section 2.1 provides an overview of the
RPC production processes, including a description of the major inputs to production and directly
affected production processes. Section 2.2 characterizes the resulting reinforced plastics
products and presents historical data on their consumption across various end uses. Section 2.3
details the costs of production. Section 2.4 describes uses and consumers of reinforced plastics.
Section 2.5 summarizes U.S. production facilities, and Section 2.6 describes the firms that own
these facilities.
2.1 Production
The basic stages of production for RPCs are compounding and processing, as Figure 2-1
illustrates. Polymers and reinforcing materials are compounded with a variety of fillers to
minimize resin requirements and additives that change the physical properties of the desired
composite. The polymer is most often a thermosetting resin such as polyester (unsaturated),
vinyl ester, phenolic, or epoxy; however, thermoplastic resins such as nylons and polyolefins are
increasingly being utilized. Compounding consists of mixing these various materials (sometimes
in several stages) and then reforming the homogeneous mass into a usable form such as pellets,
flakes, or sheets for processing into the final product.
Processing involves shaping and/or molding the compounded plastic material into the
desired final product. A wide variety of RPC processes have evolved to facilitate efficient
production of many different types of composites with different physical properties. RPC
production processes can be separated into two broad categories: open molding and closed
molding. Open molding refers to processes where the plastic resins, polymers, reinforcements,
and other additives are exposed to the air during the shaping and/or curing stages of processing.
This category includes such manual contact molding processes as hand lay-up and spray-up, as
well as processes with a greater degree of automation, such as centrifugal casting, filament
winding, pultrusion, and continuous lamination. Closed molding processes isolate the input
materials inside closed molds during the mixing and curing stages. These include more capital-
intensive production methods such as match die molding, reaction injection molding, rotational
molding, and thermoforming.
Pollution releases can occur throughout the production processes. Spills of additives and
plastic pellets can occur during transport to the facility. Leaks of chemical additives can occur
while the additives are being incorporated into the plastic. Volatile organic compounds (VOCs),
fugitive emissions, and wastewater discharge are released during the actual processing of the
reinforced plastic part. The finishing operations of cleaning can also release VOCs, fugitive
emissions, and wastewater discharge (EPA, 1995).
2-3

Polymers Fillers,
(thermoset resins, Reinforcements, and thermoplastic resins) Additives
Compounding
Processing
Compounded Plastic
Material
VOCs Reinforced Plastic
Composite
Figure 2-1. Production Flows for Reinforced Plastic Composites
The result of the processing stage is the final part or product referred to as a RPC. RPCs
range from small parts for toys or automotive uses to composite structures such as boat hulls,
automobile panels, or the fuselage of an aircraft. Thus, some RPCs constitute a final product
such as a bathtub or shower stall, whereas others are intermediate products such as panels, pipes,
and molding compounds that serve as inputs to manufacturing processes and construction
activities.
The remainder of this section describes the manufacture of RPCs in terms of the input
materials used, the production processes employed, and the types of products ultimately
produced.
2-4
2.1.1 Material Inputs
This section describes the different types of plastic resins, reinforcements, fillers, and
additives that are most commonly used in the production of RPCs. It includes a discussion of
both thermoset and thermoplastic materials; however, EPA’s RPC source category only includes
thermoset materials.
2.1.1.1 Plastic Resins
There are two broad categories of plastic resins: thermoplastics and thermosets.
Thermoplastic resins become soft when heated and may be shaped or molded while in a heated
semi-fluid state. Once the thermoplastic resin is molded to the proper state, it is cooled until
hardened. In contrast, thermoset resins are usually liquids or low melting point solids in their
initial form. When used to produce finished goods, these thermosetting resins are “cured” by the
use of a catalyst, heat, or a combination of the two. Once cured, thermoset resins cannot be
converted back to their original liquid form. Unlike thermoplastic resins, cured thermosets will
not melt and flow when heated and once formed they cannot be reshaped.
Thermoplastics have certain advantages as substitutes for thermoset resins.
Thermoplastics have faster processing than thermosets because there is no curing necessary; they
have low toxicity and can be remelted and recycled. Improvements in thermoplastic resins over
the past 20 years have increased the advantages over thermoset resins. Thermoplastics have high
delamination, chemical, and damage resistance, and low moisture absorption (Berglund, 1998).
The damage resistance of thermoplastics is due to high impact strength and fracture resistance.
Thermosets have better resistance to matrix microcracking in the composite laminate, while
thermoplastics have higher strains to failure (Schwartz, 1997). Differences in the characteristics
and strengths between thermosets and thermoplastics lead to less than perfect substitution and a
gradual increase in the use of thermoplastics for reinforced plastics. Thermoplastics’ share of all
resins used for reinforced plastics increased by 1 percent from 1991 to 1993.
From 1991 to 1993, thermoset and thermoplastic use for reinforced plastics increased,
with thermosets accounting for consistently more than twice the quantity of thermoplastics, as
Table 2-2 shows. These figures include the weight of resins, reinforcements, and fillers.
Thermoset unsaturated polyesters accounted for roughly 60 percent of the total reinforced
plastics shipped during each of these years. Other thermosets, mainly epoxies and phenolics,
accounted for an additional 7 to 10 percent of total usage. Recent innovations in thermoplastic
resin formulation have improved both their performance properties and cost-effectiveness to the
point that their use for RPC production is increasing. Thermoplastics are widely used because of
2-5
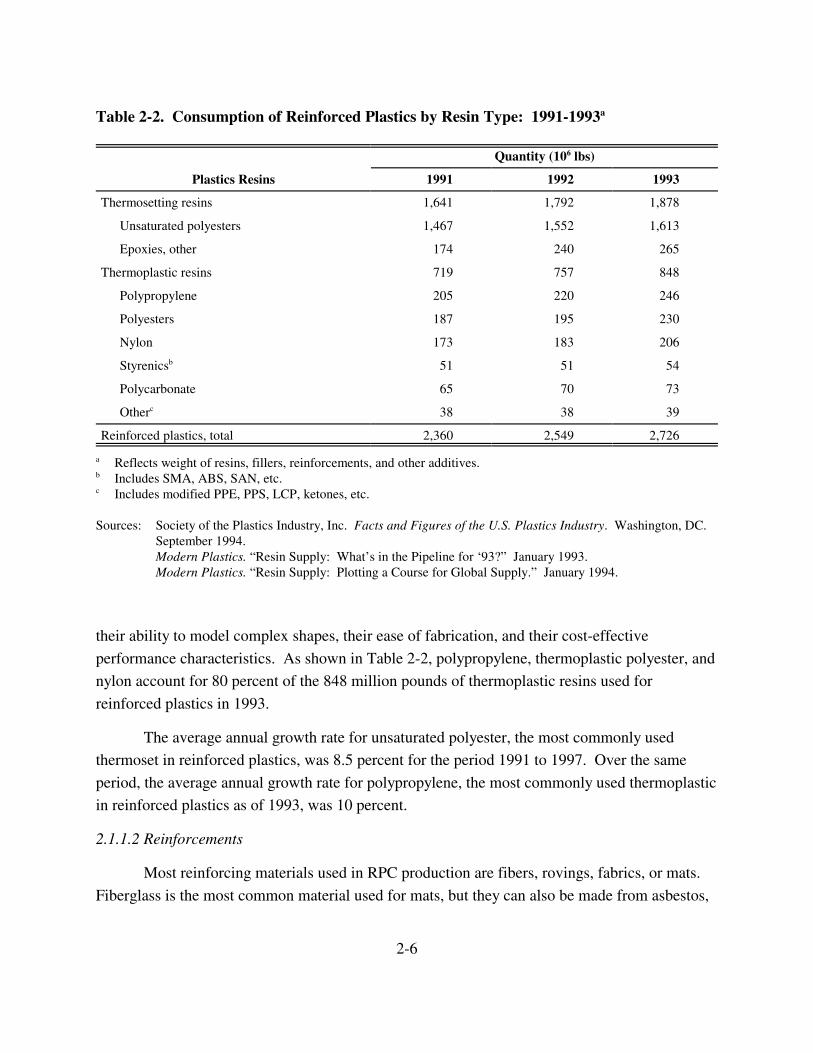
Table 2-2. Consumption of Reinforced Plastics by Resin Type: 1991-1993a
Plastics Resins
Thermosetting resins
Unsaturated polyesters
Epoxies, other
Thermoplastic resins
Polypropylene
Polyesters
Nylon
Styrenicsb
Polycarbonate
Otherc
Reinforced plastics, total
Quantity (106 lbs)
1991 1992 1993
1,641 1,792 1,878
1,467 1,552 1,613
174 240 265
719 757 848
205 220 246
187 195 230
173 183 206
51 51 54
65 70 73
38 38 39
2,360 2,549 2,726
a Reflects weight of resins, fillers, reinforcements, and other additives. b Includes SMA, ABS, SAN, etc.
Includes modified PPE, PPS, LCP, ketones, etc.
Sources: Society of the Plastics Industry, Inc. Facts and Figures of the U.S. Plastics Industry. Washington, DC. September 1994. Modern Plastics. “Resin Supply: What’s in the Pipeline for ‘93?” January 1993. Modern Plastics. “Resin Supply: Plotting a Course for Global Supply.” January 1994.
their ability to model complex shapes, their ease of fabrication, and their cost-effective
performance characteristics. As shown in Table 2-2, polypropylene, thermoplastic polyester, and
nylon account for 80 percent of the 848 million pounds of thermoplastic resins used for
reinforced plastics in 1993.
The average annual growth rate for unsaturated polyester, the most commonly used
thermoset in reinforced plastics, was 8.5 percent for the period 1991 to 1997. Over the same
period, the average annual growth rate for polypropylene, the most commonly used thermoplastic
in reinforced plastics as of 1993, was 10 percent.
2.1.1.2 Reinforcements
Most reinforcing materials used in RPC production are fibers, rovings, fabrics, or mats.
Fiberglass is the most common material used for mats, but they can also be made from asbestos,
2-6
c
paper, metals, sisal, nylon, or cotton. Reinforcements are used in four basic forms: (1) premixed
compounds in injection molding and extrusion; (2) woven mats in laminates; (3) preformed
woven mats in spray-up or press mold processing; and (4) prepregs, which are semi-cured woven
mats impregnated with resins. The amount of fiber reinforcement varies by resin and reinforcing
fiber (e.g., fiberglass varies from 5 to 45 percent by weight, cloth
from 30 to 70 percent, and carbon and other expensive fibers from 30 to 65 percent) (Rauch,
1991). Using reinforcing fibers provides the following attributes to composites:
� improved tensile and flexural strength, stiffness, modulus, and impact resistance;
� resistance to crazing and cracking; and
� reduced shrinkage (Rauch, 1991).
The relative improvement in each of these parameters is a function of the type of fiber, amount of
fiber, orientation of fiber, fiber surface treatment, and the characteristics of the matrix polymer.
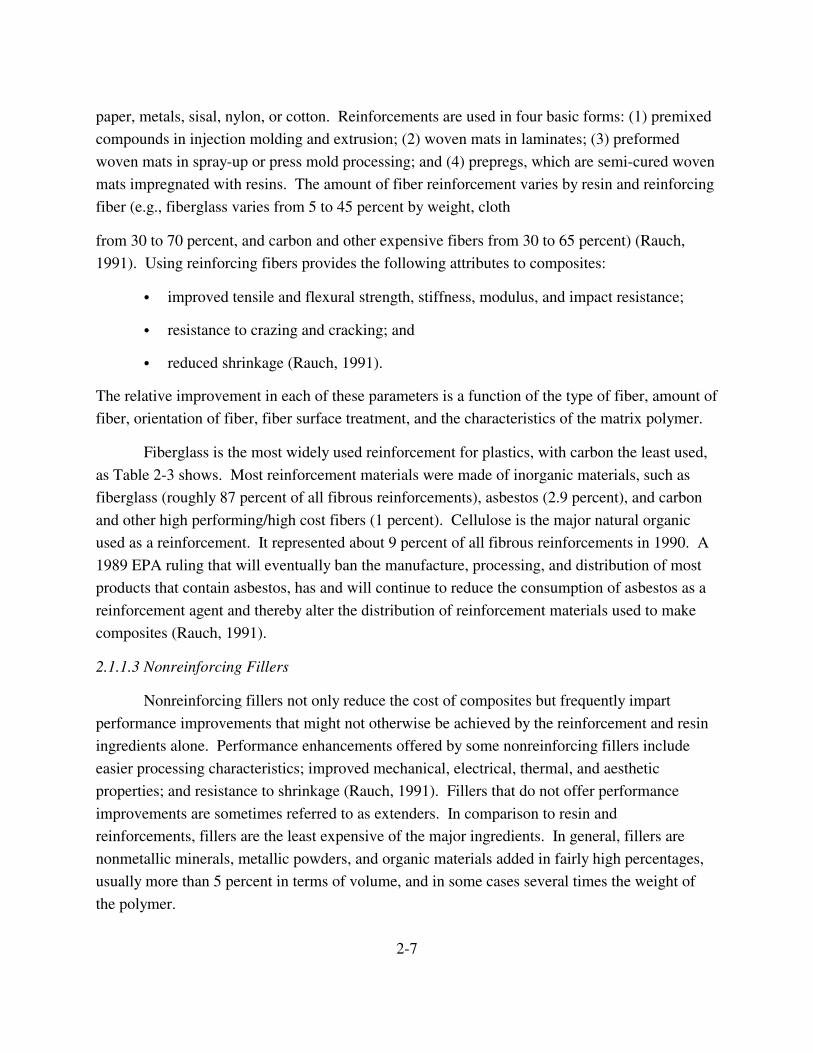
Fiberglass is the most widely used reinforcement for plastics, with carbon the least used,
as Table 2-3 shows. Most reinforcement materials were made of inorganic materials, such as
fiberglass (roughly 87 percent of all fibrous reinforcements), asbestos (2.9 percent), and carbon
and other high performing/high cost fibers (1 percent). Cellulose is the major natural organic
used as a reinforcement. It represented about 9 percent of all fibrous reinforcements in 1990. A
1989 EPA ruling that will eventually ban the manufacture, processing, and distribution of most
products that contain asbestos, has and will continue to reduce the consumption of asbestos as a
reinforcement agent and thereby alter the distribution of reinforcement materials used to make
composites (Rauch, 1991).
2.1.1.3 Nonreinforcing Fillers
Nonreinforcing fillers not only reduce the cost of composites but frequently impart
performance improvements that might not otherwise be achieved by the reinforcement and resin
ingredients alone. Performance enhancements offered by some nonreinforcing fillers include
easier processing characteristics; improved mechanical, electrical, thermal, and aesthetic
properties; and resistance to shrinkage (Rauch, 1991). Fillers that do not offer performance
improvements are sometimes referred to as extenders. In comparison to resin and
reinforcements, fillers are the least expensive of the major ingredients. In general, fillers are
nonmetallic minerals, metallic powders, and organic materials added in fairly high percentages,
usually more than 5 percent in terms of volume, and in some cases several times the weight of
the polymer.
2-7
Table 2-3. Consumption of Fibrous Reinforcements in Plastics: 1990
Quantity Reinforcement (106 lbs)
Fiberglass 900
Cellulose 90
Asbestos 30
Carbon and other high performance 10
Total 1,030
Source: Rauch Associates, Inc.. The Rauch Guide to the U.S. Plastics Industry. Bridgewater, NJ: 1991. Table 2-12.
As Table 2-4 shows, the majority of nonreinforcing fillers used in reinforced plastics are
inorganic, particularly calcium carbonate. In 1990, roughly 4.2 billion pounds of fillers were
used in plastics products. Nonmetallic minerals account for 90 percent of the total consumption
in 1990; calcium carbonate is the dominant mineral filler, with roughly 3.17 billion pounds used,
or 75 percent of all fillers consumed that year. Calcium carbonate is by far the most commonly
used mineral filler in RPC production. Kaolin clay offers several advantages including low water
absorption, chemical resistance, and improved electrical properties. Some calcined grades of
kaolin even offer additional reinforcement when added to a matrix of nylon or polyolefin resins
(Rauch, 1991).
2.1.1.4 Additives
A wide variety of additives are used in composites to modify materials properties and
performance. Although these materials are generally used in relatively low quantities as
compared to resins, reinforcements, and fillers, they perform critical functions including air
release, color, fire resistance, lubricity, speed curing, static reduction, surface smoothness,
thermal conductivity, and others (SPI Composites Institute, 1995).
Plasticizers are the most common additive to plastics, as Table 2-5 shows. In 1990,
roughly 3.5 billion pounds of additives, were used in plastics products. Plasticizers accounted
for 52 percent of additive consumption in 1990 followed by flame retardants and colorants with
19 and 13 percent, respectively. Plasticizers are essential for producing RPCs in some
applications.
2-8

Table 2-4. Consumption of Nonreinforcing Fillers in Plastics: 1990
Quantity Product (106 lbs)
Inorganics
Minerals
Calcium carbonate
Kaolin
Talc
Mica
Other minerals
Other Inorganic
Glass spheres
Natural
Total
3,170
185
145
34
450
23
203
4,210
Source: Rauch Associates Inc. The Rauch Guide to the U.S. Plastics Industry. Bridgewater, NJ: 1991. Table 2-7.
Table 2-5. Consumption of Plastics Additives: 1990
Additive
Plasticizers
Flame Retardants
Colorants
Impact Modifiers
Lubricants
Stabilizers
Organic Peroxides
Blowing Agents
Antistats
Othersa
Total
Quantity (106 lbs)
1,810
661
456
160
112
99
47
14
9
130
3,498
a Includes viscosity depressants, mold release agents, surfactants, slip agents, biocides, antiblocking agents and catalysts.
Source: Rauch Associates Inc. The Rauch Guide to the U.S. Plastics Industry. Bridgewater, NJ: 1991. Table 2-6.
2-9
2.1.2 Production Processes
Application development in the production of composites requires careful selection not
only of which materials to use but also of the production process that can combine these inputs
into the desired form most efficiently. Table 2-6 provides data on the distribution of the volume
of reinforced plastics by process for 1990. In 1990, approximately 2.6 billion pounds of RPCs
were shipped from RPC facilities in the United States. Approximately 1.67 billion pounds of
RPCs, or 65 percent of the total, were produced using open molding processes. Hand lay-up,
spray-up, and continuous lamination processes accounted for about 62 percent of the RPCs
produced with open molding processes. Approximately 900 million pounds of RPCs were
produced using closed molding processes in 1991. About two-thirds of this total were produced
using injection molding processes, with compression molding processes accounting for most of
the remaining RPCs made using closed molding processes. This section provides a more detailed
description of these processes with special attention given to the five processes that contribute
most to emissions at RPC facilities. As presented below, these processes can be segregated into
open and closed molding categories.
Table 2-6. Reinforced Plastics Shipments by Production Process: 1990
Quantity Share of Total Processing Method (106 lbs) (%)
Open molding 1,674 65
Hand lay-up, spray-up and continuous laminating 1,038 40
Filament winding, pultrusion, and centrifugal casting 636 25
Closed molding 901 35
Compression 360 14
Injection 523 20
Other 18 1
Total 2,575 100
Source: Rauch Associates Inc. The Rauch Guide to the U.S. Plastics Industry. Bridgewater, NJ: 1991.
2.1.2.1 Open Molding Processes
Open molding processes can be broken down into those that are simple, with minimal
capital requirements, and those that are more heavily automated, with higher tooling, start-up,
and other capital costs. Hand lay-up and spray-up are two contact molding processes that fit the
2-10

first category of open molding processes. These two production processes use the simplest
materials, technology, and manufacturing methods and are ideally suited for low-to-medium
volume production of larger, more complex structural shapes. Other open molding processes,
such as centrifugal and rotational casting, lamination, filament winding, and pultrusion
processes, have much higher start-up capital costs, often in the millions of dollars.
These processes have relatively low labor costs per unit output. Open molding processes
typically only are cost-efficient when used in mass production of uniform RPCs because of high
capital costs (SPI Composites Institute, 1995). The following sections provide more detailed
descriptions of four open molding processes that contribute to hazardous air pollutant (HAP) and
VOC emissions at the RPC production facilities—hand lay-up, spray-up, filament winding, and
pultrusion (LeFlam and Proctor, 1995).
Hand Lay-Up. Hand lay-up is one of the most common low-to-medium volume RPC
production processes. It typically involves manual application of general polyester liquid resins
to a reinforcement, such as glass fiber mats or woven roving, that are laid against the smooth
surface of an open mold. Serrated rollers or squeegees drawn across the preparation help to
release any air that may be entrapped in the reinforcement material. Chemical curing, often
induced by a catalyst additive, hardens the resin and reinforcement into a structural form that is
exceptionally strong for its weight. The resin offers a uniform matrix for the reinforcing material
in much the same way that concrete does when used in conjunction with reinforcing bars made of
steel (SPI Composites Institute, 1995).
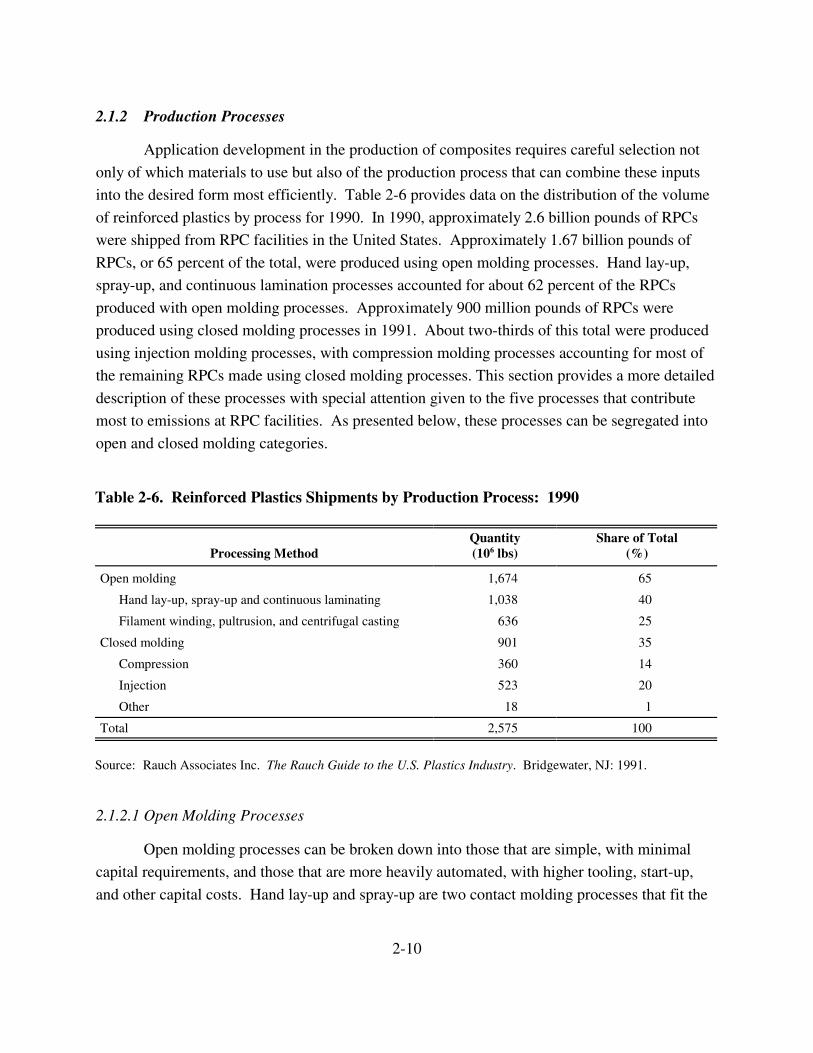
The mold is the primary piece of equipment necessary for the hand lay-up process, as
Figure 2-2 illustrates. Prior to hand lay-up production, the mold (which is often itself a
composite) is sprayed with a tinted gel-coat and allowed to partially cure. The gel-coat side of
the final product takes on the color of the pigment used to tint the gel-coat and has a smooth
surface and decorative finish, much like that provided by a high quality paint. The appearance
and texture of the other side is rough and abrasive, unless corrective measures, such as applying a
tightly woven sail cloth to the back surface prior to curing, or sanding the back-surface after
curing are performed. In most applications of hand lay-up, only a single finished side is required
(SPI Composites Institute, 1995).
Spray Up. The spray-up process is very similar to hand lay-up processing. It too is best
suited to low-to-medium volume production of larger composites with complex shapes.
Unsaturated polyesters are also the most commonly used polymer, although isophthaltic
polyesters and vinyl esters may also be used. As with hand lay-up, the polymers, reinforcements,
2-11
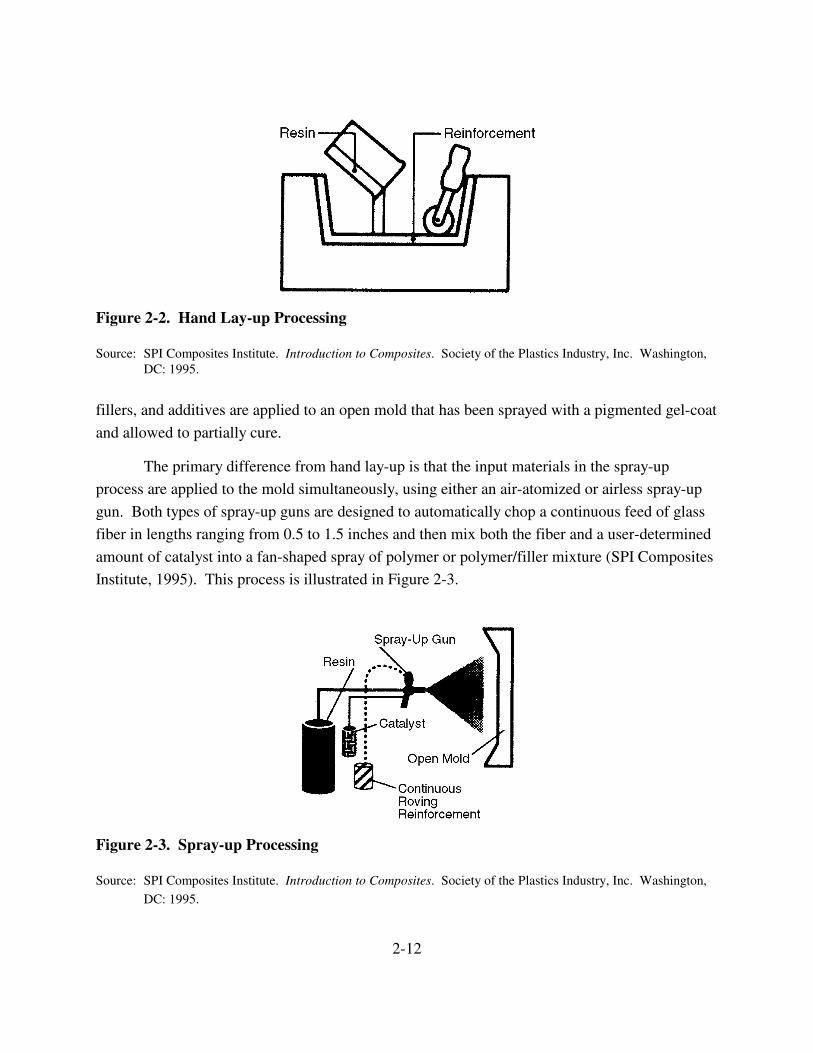
Figure 2-2. Hand Lay-up Processing
Source: SPI Composites Institute. Introduction to Composites. Society of the Plastics Industry, Inc. Washington, DC: 1995.
fillers, and additives are applied to an open mold that has been sprayed with a pigmented gel-coat
and allowed to partially cure.
The primary difference from hand lay-up is that the input materials in the spray-up
process are applied to the mold simultaneously, using either an air-atomized or airless spray-up
gun. Both types of spray-up guns are designed to automatically chop a continuous feed of glass
fiber in lengths ranging from 0.5 to 1.5 inches and then mix both the fiber and a user-determined
amount of catalyst into a fan-shaped spray of polymer or polymer/filler mixture (SPI Composites
Institute, 1995). This process is illustrated in Figure 2-3.
Figure 2-3. Spray-up Processing
Source: SPI Composites Institute. Introduction to Composites. Society of the Plastics Industry, Inc. Washington,
DC: 1995.
2-12

For some applications requiring added structural strength, more fiber reinforcement mats
or rovings can be hand laid-up between applications of the sprayed mixture. Rollers or brushes
are generally used to remove entrapped air from the mixture after it has been applied to the mold.
Twenty-five to 30 pounds of laminate can be applied per minute using some types of spray-up
equipment. This speed of application can lessen the labor input requirements relative to hand
lay-up but is somewhat offset by the need for a skilled spray-up gun operator to ensure product
quality (SPI Composites Institute, 1995).
Filament Winding. Filament winding is a highly automated RPC production process
suited to high volume production of strong surface-of-revolution composites, be they open (e.g.,
springs), cylindrical (e.g., pipes), or closed (e.g., storage tanks and pressure bottles). This
process is extremely versatile, offering a wide choice of input materials. Traditional polymer
choices have been dominated by thermoset resins (e.g., polyesters, vinyl esters, bisphenol A
fumarate resins, furanes, and epoxies), but the use of thermoplastic resins (e.g., nylon,
polycarbonates, and acrylic) is under development and gaining popularity. Figure 2-4 offers a
simple schematic of a sample filament winding process. The basic steps involve drawing a
continuous strand of reinforcing material through a resin bath and then wrapping the impregnated
reinforcement around a revolving mold, called a mandrel. Depending on the shape of the
intended RPC, the mandrel can advance in one direction as it rotates (for springs and tubular
shapes) or can rotate on two axes (for closed cylinders or spheres) (SPI Composites Institute,
1995).
Figure 2-4. Filament Winding
Source: SPI Composites Institute. Introduction to Composites. Society of the Plastics Industry, Inc. Washington,
DC: 1995.
2-13
The most common reinforcement material used is direct processed rovings of glass fiber;
however, the choice of reinforcement fibers is virtually unlimited and numerous reinforcement
application methods are commonly used. In fact, two or more different reinforcements can be
applied in different patterns to a single composite. The ability to vary the type, form, quantity,
and orientation of reinforcement materials as filament-wound RPCs are produced allows
production designers to optimize the trade-off between input costs and performance requirements
of composites intended for a given application. This is because they can limit the use of more
costly, higher performance reinforcements to strategic locations in the composite structure and
substitute lower cost fibers elsewhere. The use of hybrid reinforcement methods is increasingly
common in filament winding processes. Limitations of filament winding include relatively high
VOC emissions and capital investment requirements (SPI Composites Institute, 1995).
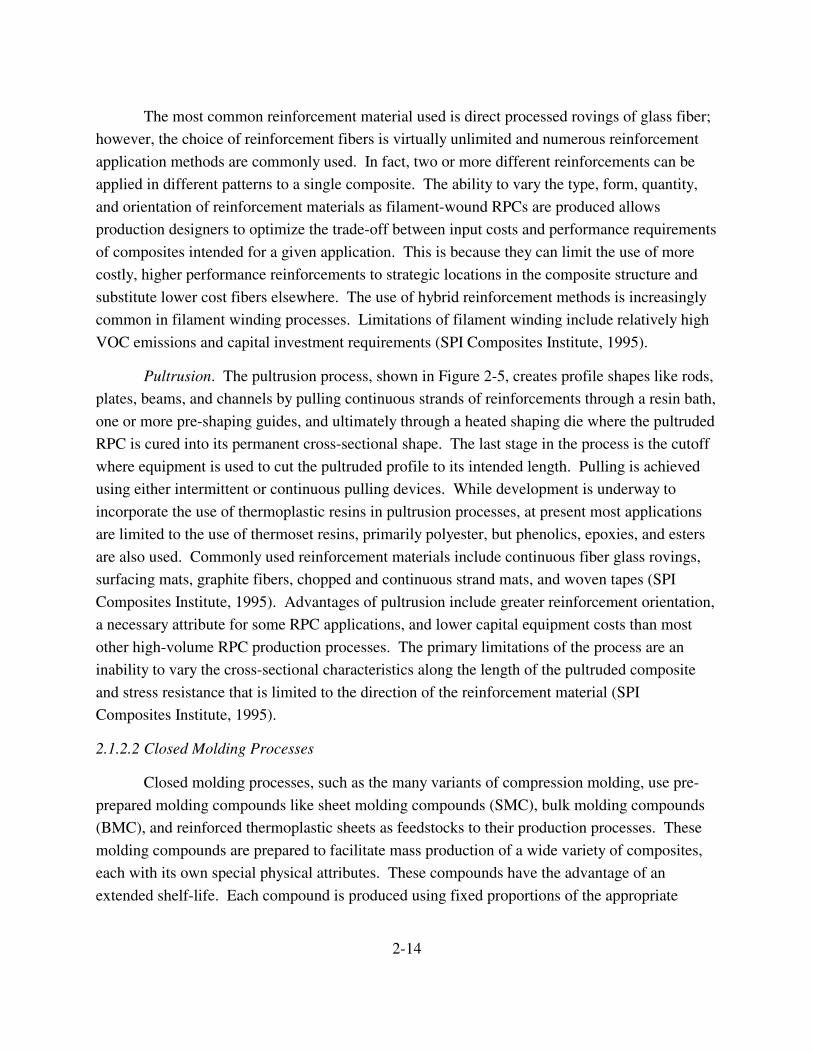
Pultrusion. The pultrusion process, shown in Figure 2-5, creates profile shapes like rods,
plates, beams, and channels by pulling continuous strands of reinforcements through a resin bath,
one or more pre-shaping guides, and ultimately through a heated shaping die where the pultruded
RPC is cured into its permanent cross-sectional shape. The last stage in the process is the cutoff
where equipment is used to cut the pultruded profile to its intended length. Pulling is achieved
using either intermittent or continuous pulling devices. While development is underway to
incorporate the use of thermoplastic resins in pultrusion processes, at present most applications
are limited to the use of thermoset resins, primarily polyester, but phenolics, epoxies, and esters
are also used. Commonly used reinforcement materials include continuous fiber glass rovings,
surfacing mats, graphite fibers, chopped and continuous strand mats, and woven tapes (SPI
Composites Institute, 1995). Advantages of pultrusion include greater reinforcement orientation,
a necessary attribute for some RPC applications, and lower capital equipment costs than most
other high-volume RPC production processes. The primary limitations of the process are an
inability to vary the cross-sectional characteristics along the length of the pultruded composite
and stress resistance that is limited to the direction of the reinforcement material (SPI
Composites Institute, 1995).
2.1.2.2 Closed Molding Processes
Closed molding processes, such as the many variants of compression molding, use pre-
prepared molding compounds like sheet molding compounds (SMC), bulk molding compounds
(BMC), and reinforced thermoplastic sheets as feedstocks to their production processes. These
molding compounds are prepared to facilitate mass production of a wide variety of composites,
each with its own special physical attributes. These compounds have the advantage of an
extended shelf-life. Each compound is produced using fixed proportions of the appropriate
2-14
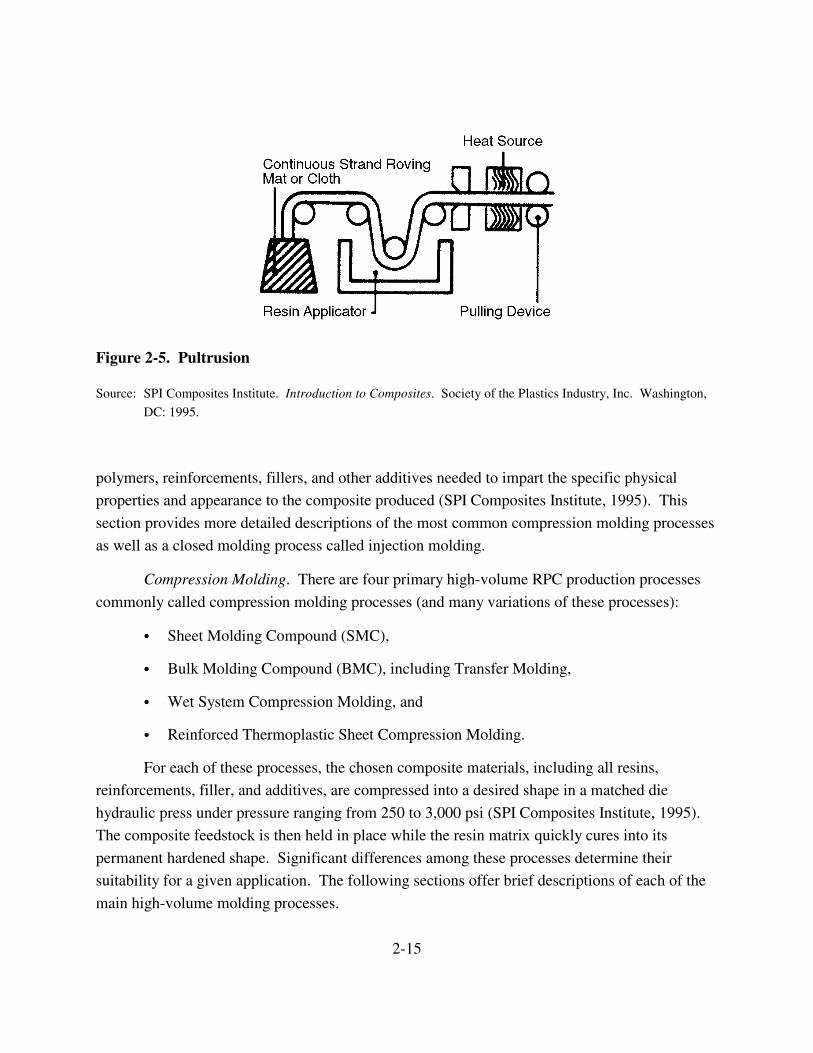
Figure 2-5. Pultrusion
Source: SPI Composites Institute. Introduction to Composites. Society of the Plastics Industry, Inc. Washington,
DC: 1995.
polymers, reinforcements, fillers, and other additives needed to impart the specific physical
properties and appearance to the composite produced (SPI Composites Institute, 1995). This
section provides more detailed descriptions of the most common compression molding processes
as well as a closed molding process called injection molding.
Compression Molding. There are four primary high-volume RPC production processes
commonly called compression molding processes (and many variations of these processes):
� Sheet Molding Compound (SMC),
� Bulk Molding Compound (BMC), including Transfer Molding,
� Wet System Compression Molding, and
� Reinforced Thermoplastic Sheet Compression Molding.
For each of these processes, the chosen composite materials, including all resins,
reinforcements, filler, and additives, are compressed into a desired shape in a matched die
hydraulic press under pressure ranging from 250 to 3,000 psi (SPI Composites Institute, 1995).
The composite feedstock is then held in place while the resin matrix quickly cures into its
permanent hardened shape. Significant differences among these processes determine their
suitability for a given application. The following sections offer brief descriptions of each of the
main high-volume molding processes.
2-15

Sheet Molding Compound. SMC is produced by mixing all of the composite materials, except for the reinforcing fibers, into a paste. The paste is then uniformly spread onto two separate “carrier films” that are fed through an SMC machine where the paste is compounded with the reinforcements. The carrier films are held apart, one above the other, while reinforcements, cut from continuous strand rovings, are uniformly distributed on the lower carrier film and then forced together like a fiber reinforcement sandwich as they are fed through a system of rollers that compact and consolidate the SMC. The SMC, with the carrier film still in place, is then rolled up and encased in a nylon sleeve that prevents evaporation of volatiles from the resin matrix that would allow the compound to finish curing. After a period of storage in a climate controlled area, the SMC is thickened to the desired viscosity for its intended application and then taken to a molding press where it is cut to its desired shape. The carrier films are then removed and the SMC permanently compressed into its ultimate shape in a heated matched die mold (SPI Composites Institute, 1995).
SMC molding has high start-up capital costs associated with it. However, while the tooling costs of SMC compression molding are much higher than for most other RPC production processes, they are still generally lower than would be required to produce equally strong shapes from metal inputs. Retooling an SMC process to modify the design of a composite is much quicker than in metal stamp molding operation. Other advantages include the ability to consolidate many parts into a single RPC. These attributes make SMC molding very attractive to such high-volume end users as producers of automobiles, appliances, construction, and electrical product industries. SMC compression molding is used to produce more composites of greater value than any other RPC production process (SPI Composites Institute, 1995).
Bulk Molding Compound. Bulk molding compound, like SMC, is more a material than a process. BMC generally consists of approximately 20 percent reinforcement, 50 percent fillers and additives, and 30 percent resin matrix. The compound can be tinted to a desired color and, through strategic selection of input materials, can be prepared to afford exceptional mechanical and fire retardant properties. The basic process entails combining the desired composite materials into a molding compound that resembles putty and then placing the compound into a compression mold. Molding typically takes place at temperatures between 250 and 350 °F and at pressures ranging from 350 to 2,000 psi (SPI Composites Institute, 1995). BMC is also used in transfer molding and injection molding processes to produce more complex shapes with closer mold tolerances than can be achieved using matched die compression molds.
The advantages of BMC include reduced costs and improved stiffness and fire retardance due to lower reinforcement loadings and increased filler loadings. BMC can also be molded into intricately detailed, precise shapes with inserts affixed during the molding process.
2-16

Wet System Compression Molding. Wet system compression molding differs from SMC
and BMC compression molding in that a matrix of liquid resin mixed with fillers and additives is
pumped or poured onto dry reinforcement mats that have been placed inside of the matched die
mold. Thus, unlike SMC and BMC processing, the resin is not introduced to the reinforcements
prior to molding. Hydraulic pressure is exerted on the mold, forcing the resin to permeate the
reinforcement materials and fixing, and the composite remains under pressure until it has fully
cured. Typical curing temperatures are 250 to 350 °F, much like SMC and BMC molding, but
the pressure requirements are much lower, in the range of 250 to 1,000 psi (SPI Composites
Institute, 1995).
Like SMC and BMC, wet system molding can produce RPCs with two finished surfaces.
Other advantages of this process include equipment and tooling savings, due to the reduced
pressure requirements, and higher reinforcement loading, which affords superior mechanical
properties. The disadvantages of wet system molding include an inability to provide undercuts or
reinforcing ribs to add strength to the composite, higher labor costs, and more process waste than
is typical with BMC and SMC molding processes.
Reinforced Thermoplastic Sheet Molding. Reinforced thermoplastic sheet molding is
quite similar to SMC, in that the composite materials are all combined and shaped into sheets
prior to molding, but as the name implies, this process is designed for use with thermoplastic
resins. Another difference is that the sheet is cut to fit entirely within the mold and is preheated
prior to placement in the mold. When the mold is closed and pressure is applied, the
thermoplastic resins start to flow and conform to the shape of the mold. The temperature of the
mold is then controlled for 30 to 90 seconds to permit the molded sheet to solidify and permit
removal of the RPC from the mold (SPI Composites Institute, 1995). This process is sometimes
called stamping, because the mold used is similar to a steel stamping press.
Advantages of this process include unlimited shelf life for the input sheets, fast molding
cycles, recyclable scrap, and potential for parts consolidation relative to metals. Capital costs are
comparable to SMC molding. There are, as yet, few suppliers of the input sheets because this
process is new.
Injection Molding. Injection molding is perhaps the most versatile and widely applied
process for mass producing fairly complex composites of absolute dimensional accuracy. It can
be used for parts of any size for which a mold can be built and is ideally suited to high-volume
applications. Each compression molding machine is capable of producing thousands of detailed
RPCs per hour. As illustrated in Figure 2-6, the same equipment can be used to mold both
thermoplastic resins and thermoset resins into RPCs. The only difference is the temperature at
2-17

Figure 2-6. Injection Molding
Source: SPI Composites Institute. Introduction to Composites. Society of the Plastics Industry, Inc. Washington,
DC: 1995.
which the resin is kept during the curing stage of the process within the mold. This process is
most commonly used to shape RPCs from thermoplastic resins (e.g., nylon, acetal, PVC,
polyethylene, SAN, polycarbonate, and ABS), which require cooler curing temperatures, but
compression molding of thermoset resins (e.g., polyester, phenolic, epoxy and urethane) is
gaining popularity (SPI Composites Institute, 1995).
The basic steps in the standard injection molding process consist of conveying granular or
pelletized thermoplastic resin from a supply hopper to an opening at the opposite end of a heated
metal chamber, using an auger to control the rate that the resin advances to the tip. The resin is
thus heated to a semi-fluid state melting or plasticizing the resin and can be injected into the
mold at the tip of the chamber with a twist of the auger. The mold is kept at a cool temperature
and held closed while the resin cools down and solidifies. Once the resin has solidified, the mold
is opened to eject the composite from the mold and the whole process can be restarted.
2-18
2.2 Products
There is great diversity in the types of products made using most of these processes.
Among the open molding processes, product diversity is especially extensive in the hand lay-up,
spray-up, and filament winding processes. Among closed molding processes, product diversity is
greatest for the compression and injection molding processes. Table 2-7 describes the basic
shape characteristics that are best produced by each RPC production process and lists examples
of composite products that result from each process.
2.3 Costs of Production
There are three variable inputs in reinforced plastic production: raw materials, labor, and
energy. Raw materials include plastic resins, reinforcing materials, and fillers. Labor and energy
are used throughout production as well as for final product transport.
Prices for thermoset resins have increased since 1996, while most thermoplastic prices
have fallen over the same period, as Table 2-8 shows. Among thermoset resins, unsaturated
polyester and phenolics are close in price, while epoxy has a higher price than both. PVC and
polypropylene are the least expensive thermoplastics, while the price of nylon is more than four
times greater than these two. Table 2-9 provides prices for fibrous reinforcing materials. For
1997, the price of fiberglass, the most common reinforcement, is approximately $1.11 per pound.
The price of carbon is the most expensive and is primarily used in high performance applications
($10 to $30 per pound).
Many producers use fillers in order to minimize the amount of higher-cost resins needed
per unit output (see Table 2-9). RPC manufacturers frequently select calcium carbonate because
of its relative low cost ($0.08 per pound). Other popular low cost fillers include kaoline and
alumina trihydrate ($0.05 and $0.13 per pound respectively). As noted in Section 2.1.1.4,
additives are also used in relatively low quantities to enhance particular properties of RPCs . The
Agency computed a weighted average price for additives in 1997 of $0.88 per pound.
2.4 Uses and Consumers of Reinforced Plastics
RPCs are an input into the production of a variety of products ranging from children’s
toys to aerospace components and bathtubs to boat hulls. Therefore, the demand for RPCs is
derived from the demand for these products, which can be found within one of the following
major segments of the market for RPCs:
2-19
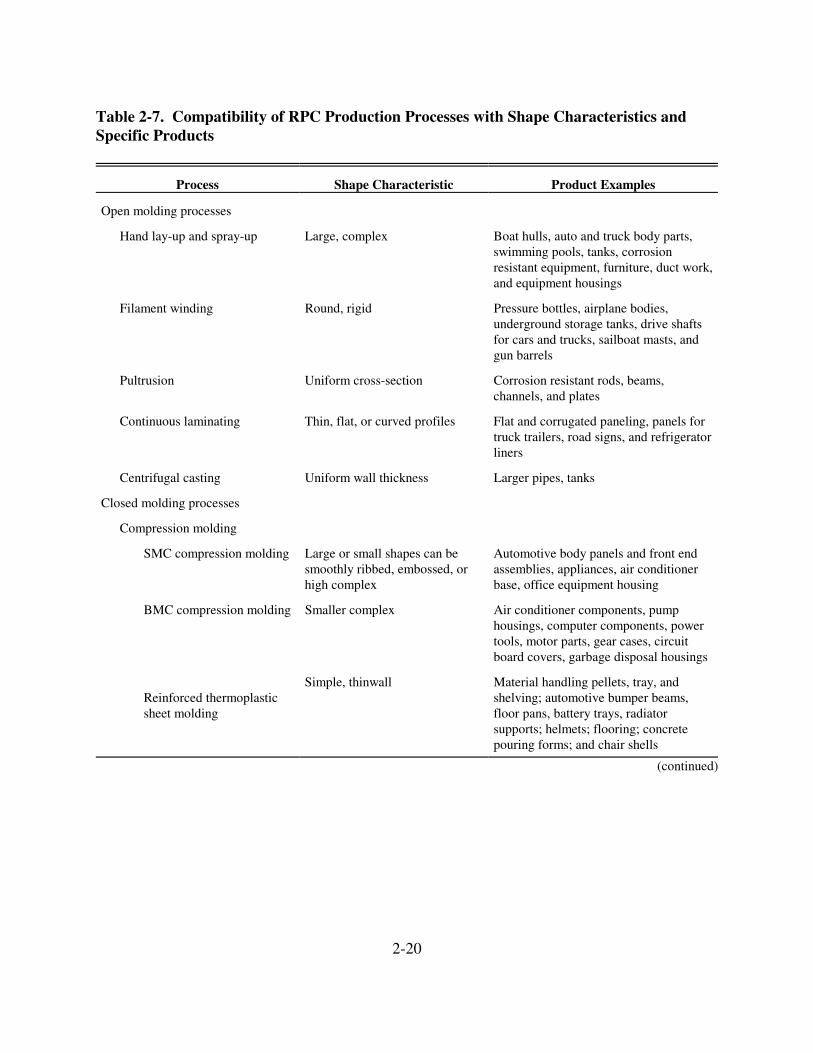
Table 2-7. Compatibility of RPC Production Processes with Shape Characteristics and Specific Products
Process Shape Characteristic Product Examples
Open molding processes
Hand lay-up and spray-up
Filament winding
Pultrusion
Continuous laminating
Centrifugal casting
Closed molding processes
Compression molding
SMC compression molding
BMC compression molding
Reinforced thermoplastic sheet molding
Large, complex
Round, rigid
Uniform cross-section
Thin, flat, or curved profiles
Uniform wall thickness
Large or small shapes can be smoothly ribbed, embossed, or high complex
Smaller complex
Simple, thinwall
Boat hulls, auto and truck body parts, swimming pools, tanks, corrosion resistant equipment, furniture, duct work, and equipment housings
Pressure bottles, airplane bodies, underground storage tanks, drive shafts for cars and trucks, sailboat masts, and gun barrels
Corrosion resistant rods, beams, channels, and plates
Flat and corrugated paneling, panels for truck trailers, road signs, and refrigerator liners
Larger pipes, tanks
Automotive body panels and front end assemblies, appliances, air conditioner base, office equipment housing
Air conditioner components, pump housings, computer components, power tools, motor parts, gear cases, circuit board covers, garbage disposal housings
Material handling pellets, tray, and shelving; automotive bumper beams, floor pans, battery trays, radiator supports; helmets; flooring; concrete pouring forms; and chair shells
(continued)
2-20
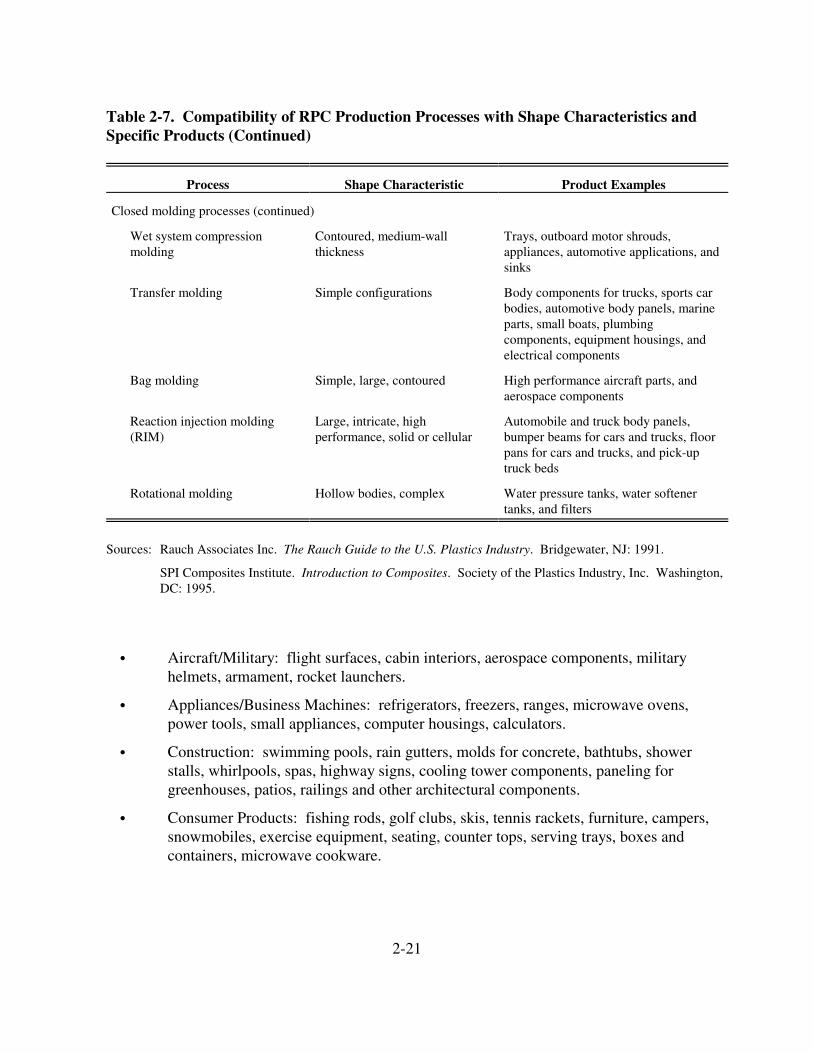
Table 2-7. Compatibility of RPC Production Processes with Shape Characteristics and Specific Products (Continued)
Process Shape Characteristic Product Examples
Closed molding processes (continued)
Wet system compression Contoured, medium-wall Trays, outboard motor shrouds, molding thickness appliances, automotive applications, and
sinks
Transfer molding Simple configurations Body components for trucks, sports car bodies, automotive body panels, marine parts, small boats, plumbing components, equipment housings, and electrical components
Bag molding Simple, large, contoured High performance aircraft parts, and aerospace components
Reaction injection molding Large, intricate, high Automobile and truck body panels, (RIM) performance, solid or cellular bumper beams for cars and trucks, floor
pans for cars and trucks, and pick-up truck beds
Rotational molding Hollow bodies, complex Water pressure tanks, water softener tanks, and filters
Sources: Rauch Associates Inc. The Rauch Guide to the U.S. Plastics Industry. Bridgewater, NJ: 1991.
SPI Composites Institute. Introduction to Composites. Society of the Plastics Industry, Inc. Washington, DC: 1995.
� Aircraft/Military: flight surfaces, cabin interiors, aerospace components, military helmets, armament, rocket launchers.
� Appliances/Business Machines: refrigerators, freezers, ranges, microwave ovens, power tools, small appliances, computer housings, calculators.
� Construction: swimming pools, rain gutters, molds for concrete, bathtubs, shower stalls, whirlpools, spas, highway signs, cooling tower components, paneling for greenhouses, patios, railings and other architectural components.
� Consumer Products: fishing rods, golf clubs, skis, tennis rackets, furniture, campers, snowmobiles, exercise equipment, seating, counter tops, serving trays, boxes and containers, microwave cookware.
2-21
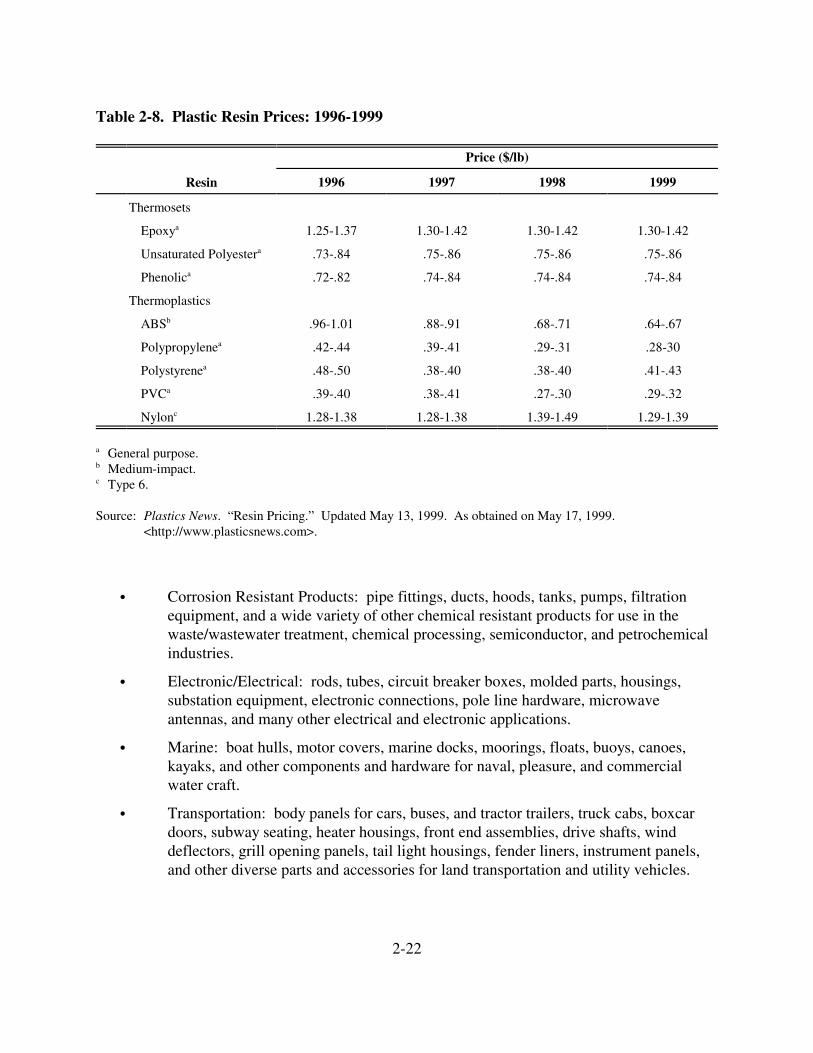
Table 2-8. Plastic Resin Prices: 1996-1999
Price ($/lb)
Resin
Thermosets
Epoxya
Unsaturated Polyestera
Phenolica
Thermoplastics
ABSb
Polypropylenea
Polystyrenea
PVCa
Nylonc
a General purpose. b Medium-impact.
Type 6.
1996 1997 1998 1999
1.25-1.37 1.30-1.42 1.30-1.42 1.30-1.42
.73-.84 .75-.86 .75-.86 .75-.86
.72-.82 .74-.84 .74-.84 .74-.84
.96-1.01 .88-.91 .68-.71 .64-.67
.42-.44 .39-.41 .29-.31 .28-30
.48-.50 .38-.40 .38-.40 .41-.43
.39-.40 .38-.41 .27-.30 .29-.32
1.28-1.38 1.28-1.38 1.39-1.49 1.29-1.39
Source: Plastics News. “Resin Pricing.” Updated May 13, 1999. As obtained on May 17, 1999. <http://www.plasticsnews.com>.
� Corrosion Resistant Products: pipe fittings, ducts, hoods, tanks, pumps, filtration equipment, and a wide variety of other chemical resistant products for use in the waste/wastewater treatment, chemical processing, semiconductor, and petrochemical industries.
� Electronic/Electrical: rods, tubes, circuit breaker boxes, molded parts, housings, substation equipment, electronic connections, pole line hardware, microwave antennas, and many other electrical and electronic applications.
� Marine: boat hulls, motor covers, marine docks, moorings, floats, buoys, canoes, kayaks, and other components and hardware for naval, pleasure, and commercial water craft.
� Transportation: body panels for cars, buses, and tractor trailers, truck cabs, boxcar doors, subway seating, heater housings, front end assemblies, drive shafts, wind deflectors, grill opening panels, tail light housings, fender liners, instrument panels, and other diverse parts and accessories for land transportation and utility vehicles.
2-22
c

Table 2-9. Selected Plastic Reinforcement and Filler Prices: 1997
Input
Reinforcements
Fiberglass
Cellulose
Carbon
Average
Fillers
Calcium carbonate
Kaolin
Alumina trihydrate
Talc
Mica
Other minerals
Glass spheres
Natural
Average
Additives
Average
Price ($/lb)
$1.11
$0.52a
$10–30
$1.25
$0.08a
$0.05a
$0.13
$0.30
$0.21a
$0.08a
$0.78a
$0.05a
$0.09
$0.88
a Price computed by dividing value by quantity and adjusting by a producer price index (PPI) where appropriate.
Sources: U.S. Geological Survey. 1997. Minerals Yearbook: Clays. [online] <http://minerals.usgs.gov/ minerals/pubs/commodity/myb>. Obtained January 21, 2000. U.S. Geological Survey. 1997. Minerals Yearbook: Mica. [online] <http://minerals.usgs.gov/ minerals/pubs/commodity/myb>. Obtained January 21, 2000. Rauch Associates. 1991. The Rauch Guide to the U.S. Plastics Industry. Bridgewater, NJ: Rauch Associates, Inc. Murphy, John. 1994. The Reinforced Plastics Handbook. Oxford, UK: Elsevier Advanced Technology. U.S. Bureau of Labor Statistics. 2000. Producer Price Index—Commodities: WPUSOP9200, Intermediate Materials Less Food and Energy, 1990–2000. [online] <http://www.bls.gov>. Obtained January 20, 2000. Shearer, Brent. April 15, 1996. “Carbon Fibers Adjusting to Changes.” Chemical Marketing Reporter.
2-23

� Other: all other composites applications. One significant new category of applications the repair/replacement of components of the civil infrastructure. Product examples include: guardrails, sign posts, and structural supports for highways and bridges.
Over time, the need for lightweight structural materials that meet strength, stiffness, and
other mechanical property requirements for high performance applications has prompted major
developments in production practices in the end-use markets. The characteristics demanded vary
by the market (e.g., construction, transportation, consumer goods, or other product
manufacturer). For example, the ability to replace an assembly of several metal parts with a
single molded composite is very appealing to manufacturers of appliances and transportation
equipment. The chemical resistance properties of RPCs allow users in the construction and
marine market segments to avoid the higher maintenance costs associated with the metal and
wood materials that they traditionally used.
The strength-to-weight ratios for composites are typically greater than those of metals.
As an example, phenolic composites have greater yield strengths than steel or aluminum,
although resistance to bending and the resistance to elongation may be superior in metals
depending on the type of reinforcement in the plastic (Murphy, 1994). Composites have low
flammability properties, which make composites superior to wood for applications susceptible to
fire. Table 2-10 provides some examples of these desired demand characteristics for selected end
uses and associated products.
Land transportation products consumed the most reinforced plastics in 1997, followed by
construction, as Figure 2-7 illustrates. The land transportation segment alone used 1,095 million
pounds, which accounts for 32 percent of the 3.4 billion pounds of RPCs consumed in 1997.
Construction applications, the second largest end-use category, consumed 700 million pounds of
composites during 1997. Other significant market segments are marine and electrical products.
Producers serving the marine segment will not be subject to the proposed controls; they will be
separately addressed by the Agency.
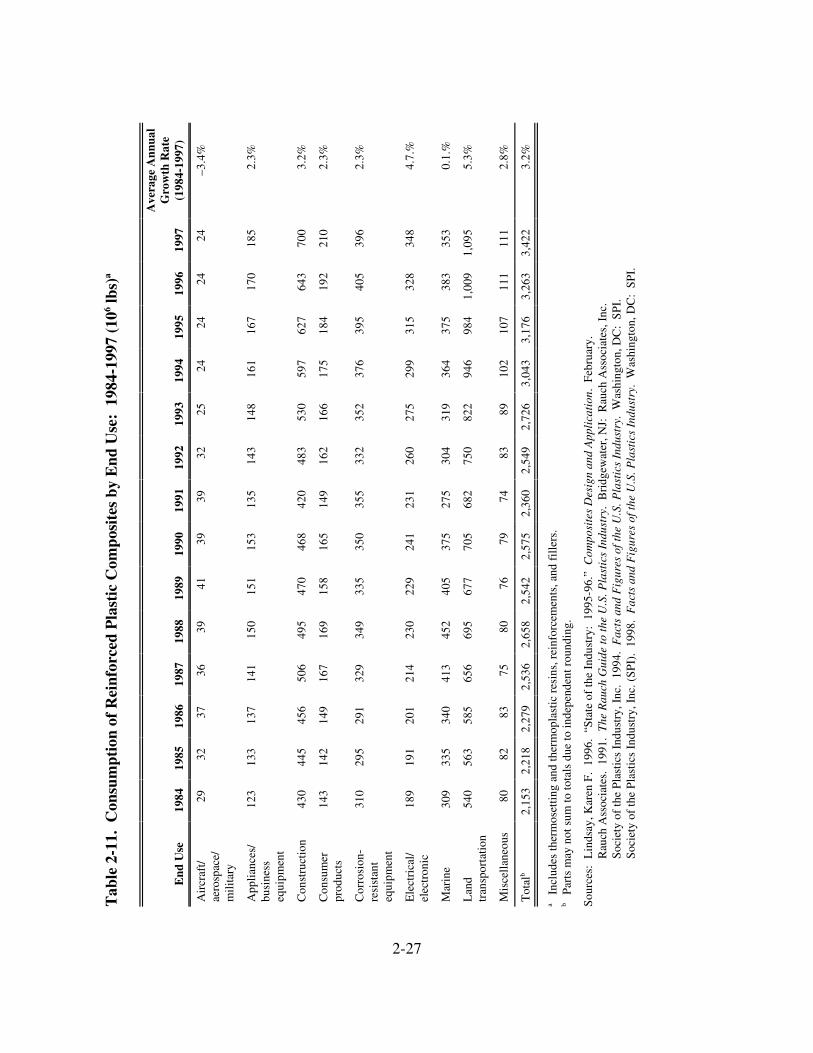
Table 2-11 indicates that consumption has risen from 1989 levels in all end-use
categories except for aviation/aerospace/military, which has declined because of the recent
reductions in U.S. government spending on defense. Total shipments have increased every year
since 1991. The growth rate for consumption by land transportation was highest for the period
1984-1997, followed by electrical applications. Causes for aggregate growth vary across
individual market segments. Growth may be driven by advances in RPC production processes or
increased demand for specific final products. Demand in some end-use categories is strongly
2-24

Table 2-10. Demand for Reinforced Plastic Composites: Some Examples
End-User Industries and Product Markets Demand Characteristics Product Examples
Aircraft/aerospace/military Lightweight, moldability, and versatile nature
Appliances/business equipment Parts consolidation, design flexibility, and high strength to weight ratios
Construction Corrosion resistance, high strength to weight ratio, custom finishing, longer life-cycle and/or fewer maintenance requirements
Marine Large, rigid, continuous shapes with smooth, corrosion-resistant finishes and high strength to weight ratios
Transportation Parts consolidation, light weight, continuous shapes with smooth corrosion-resistant finishes
Structures and interiors of both military and commercial planes
Dishwasher panels, freezers, small appliances, computer housings, and radios
Beams, columns, roof trusses, soffit, siding, flooring, bathtubs, sinks, shower stalls, whirlpools and spas
Boat hulls, jet skis, and other marine craft
Body panels, front ends, bumpers, and interior dashboards for automobiles, mobile homes, buses, and trucks.
Source: Society of the Plastics Industry, Inc. Introduction to Composites. 2nd ed. Washington, DC. The Composites Institute. 1992.
influenced by fluctuations in consumer confidence or by changes in government spending
priorities.
The growth for particular RPC processes and resins may differ from the observed
aggregate rates of growth for the markets they serve, which is significant because the RPC source
category to be regulated includes only thermosetting resins—mainly unsaturated polyesters.
Table 2-12 presents information on consumption of reinforced unsaturated polyesters based on
consumption data by end use for 1984 through 1993 from Predicasts Basebook and Modern
Plastics. In contrast to the aggregate growth rates across end-use markets, Table 2-12 shows that
growth for reinforced unsaturated polyesters was positive in electrical/electronic (0.7 percent),
aircraft/aerospace/military (0.6 percent), appliances/business equipment (0.4 percent annually),
and corrosion resistant equipment (0.2 percent). It appears that reinforced unsaturated polyesters
are losing market share in many end uses as technological advances allow thermoplastic resins to
be used in a wider range of processes and applications.
2-25
Reinforced Plastics Shipments = 3,422 million lbs.
Aircraft/ Aerospace/
Military Appliances/ 0.7% Business
Land Transportation
Construction
Marine
Miscellaneous 3.2%
Equipment5.4%
Corrosion-Resistant
20.5% 32.0%
Consumer Products
6.1%
10.3% Electrical/ Equipment Electronic 11.6%
10.2%
Figure 2-7. Consumption of Reinforced Plastic Composites by Market Segment: 1997
aIncludes reinforced thermoset and thermoplastic resins, reinforcements, and fillers.
Source: Society of the Plastics Industry, Inc. 1998. Facts and Figures of the U.S. Plastics Industry. Washington, DC: SPI.
Some RPC processes may serve multiple end-use markets and, thus, have a different
growth rate than those listed in Tables 2-11 and 2-12. In particular, industry sources cited in
Modern Plastics state that pultruded parts using reinforced polyesters are replacing aluminum,
wood, and polyvinyl chloride in various markets and are expected to have a 15 to 25 percent
growth rate over the next 5 years (Modern Plastics, 1993). Pultrusion is a fully automated
2-26
Ave
rage
Ann
ual
1997
(1
984-
1997
) G
row
th R
ate
0.1.
%
4.7.
%
–3.4
%
2.3%
3.2%
2.3%
2.3%
5.3%
2.8%
3.2%
24
185
700
210
396
348
353
1,09
5
111
3,42
2
Was
hing
ton,
DC
: S
PI.
1996
24
170
643
192
405
328
383
1,00
9
111
3,26
3
Tab
le 2
-11.
Con
sum
ptio
n of
Rei
nfor
ced
Pla
stic
Com
posi
tes
by E
nd U
se:
1984
-199
7 (1
06 lbs)
a
Was
hing
ton,
DC
: S
PI.
B
ridg
ewat
er, N
J: R
auch
Ass
ocia
tes,
Inc
.
1995
24
167
627
184
395
315
375
984
107
3,17
6
Feb
ruar
y.
1994
24
161
597
175
376
299
364
946
102
3,04
3
1998
. F
acts
and
Fig
ures
of t
he U
.S. P
last
ics
Indu
stry
.
“Sta
te o
f th
e In
dust
ry:
1995
-96.
” C
ompo
site
s D
esig
n an
d A
ppli
cati
on.
1993
25
148
530
166
352
275
319
822 89
2,72
6
1994
. F
acts
and
Fig
ures
of t
he U
.S. P
last
ics
Indu
stry
.
1992
32
143
483
162
332
260
304
750 83
2,54
9
1991
2,36
0 74
39
135
420
149
355
231
275
682
1991
. T
he R
auch
Gui
de to
the
U.S
. Pla
stic
s In
dust
ry.
Incl
udes
ther
mos
etti
ng a
nd th
erm
opla
stic
res
ins,
rei
nfor
cem
ents
, and
fil
lers
.
1990
79
39
153
468
165
350
241
375
705
2,57
5
1989
76
41
151
470
158
335
229
405
677
2,54
2
1988
Par
ts m
ay n
ot s
um to
tota
ls d
ue to
inde
pend
ent r
ound
ing.
80
39
150
495
169
349
230
452
695
2,65
8
Soc
iety
of
the
Pla
stic
s In
dust
ry, I
nc. (
SP
I).
1987
2,53
6
75
36
141
506
167
329
214
413
656
Soc
iety
of
the
Pla
stic
s In
dust
ry, I
nc.
1986
2,27
9
456 83
37
137
149
291
201
340
585
Sou
rces
: L
inds
ay, K
aren
F.
1996
.
1985
2,21
8
445 82
32
133
142
295
191
335
563
Rau
ch A
ssoc
iate
s.
2,15
3
1984
End
Use
430
Con
stru
ctio
n
80
29
mil
itar
y
123
equi
pmen
t
143
prod
ucts
310
equi
pmen
t
189
elec
tron
ic
309
Mar
ine
540
tran
spor
tati
on
Mis
cell
aneo
us
App
lian
ces/
Cor
rosi
on-
aero
spac
e/
Con
sum
er
Ele
ctri
cal/
Air
craf
t/
busi
ness
resi
stan
t
Tot
alb
Lan
d
a b
2-27

Ave
rage
Ann
ual
1993
(‘
84-‘
93)b
Gro
wth
Rat
e
0.6%
0.4%
–0.7
%
–1.3
%
–1.6
%
–5.8
%
–1.4
%
–0.9
%
0.2%
0.7%
–3.7
%
–0.5
%
–0.7
%
–0.5
%
NA
NA
25
91
418 96
116 29
122 55
255
207
1,61
3
124
Tab
le 2
-12.
Con
sum
ptio
n of
Rei
nfor
ced
Uns
atur
ated
Pol
yest
er b
y E
nd U
se:
1984
-199
3 (1
06 lbs)
a
31
88
387 94
108 27
122
122
299 53
243
190 52
1,55
2
1992
50
36
84
337 88
99
24
126
120
329
221
185 45
1,40
7
1991
53
48
34
93
384
106
109 36
139
127
336
300
215
1,59
0
1990
93
53
52
35
426
115
125 50
158
138
350
353
221
1,72
1
1989
Nov
embe
r 19
92.
Fos
ter
Cit
y, C
A:
Info
rmat
ion
Acc
ess
Cor
pora
tion
. “R
esin
Sup
ply:
Plo
ttin
g a
Cou
rse
for
Glo
bal S
uppl
y.”
Jan
uary
199
4.
93
53
51
34
414
112
117 42
143
135
338
375
207
1,70
0
1988
90
55
50
33
393
100
115 39
139
130
326
350
195
1,62
2
1987
87
52
50
32
402
102
123 40
137
130
322
324
200
1,59
9
1986
85
101
320 48
220 52
28
400
122 41
136
132
320
1,60
5
1985
NA
86
109
310
200
NA
26
420
125 45
141
130
308
1,59
2
1984
Par
ts m
ay n
ot s
um to
tota
ls d
ue to
inde
pend
ent r
ound
ing.
Incl
udes
wei
ght o
f re
sin,
rei
nfor
cem
ents
, and
fil
lers
.
Pre
dica
st
End
Use
3075
4-00
3076
0-00
3076
5-00
3075
5-00
3075
2-00
3075
2-20
m
ilit
ary
3076
1-00
3076
1-40
3076
6-00
3077
0-00
3075
2-40
Cod
e
NA
NA
Or
wid
est r
ange
of
avai
labl
e ye
ars.
App
lian
ces/
busi
ness
equ
ipm
ent
Pre
dica
sts
Bas
eboo
k.
Cor
rosi
on-r
esis
tant
equ
ipm
ent
Sou
rces
: M
oder
n P
last
ics.
Gla
zing
and
sky
ligh
ts
Pip
e, f
itti
ngs,
con
duit
Ele
ctri
cal/
elec
tron
ic
Plu
mbi
ng f
ixtu
res
Lan
d tr
ansp
orta
tion
Con
sum
er p
rodu
cts
Pan
els
and
sidi
ng
Air
craf
t/ae
rosp
ace/
Mis
cell
aneo
us
Con
stru
ctio
n
Mar
ine
Tot
alc
a b c
2-28

fabrication process with low tooling and labor costs that produces continuous, cross-sectional
composite profiles, all of which are expected to allow it to continue its strong growth and
penetration of traditional material profile markets in the 1990s. Growth is expected to be
particularly significant in the electrical and corrosion-resistant markets, with opportunities
increasing in the construction and aerospace markets (Modern Plastics, 1994).
2.5 Manufacturing Facilities
The information provided in this section is based on EPA’s 1993 survey of the reinforced
plastics industry (EPA, 1993). Although roughly 700 facilities participated in the survey, only
438 facilities were determined to be potential major sources of HAP emissions from the
production of reinforced plastics. Thus, this section focuses on those 438 facilities likely to be
subject to the proposed air regulations.
2.5.1 Location
Based on the 1993 updated industry screening survey, Figure 2-8 identifies the location of
the 438 major source facilities producing reinforced plastics in 1993.1 Ohio, Indiana, California,
Texas, and Pennsylvania are the top five states in order of number of major source facilities.
2.5.2 Employment
The 1993 survey data indicate that employment at these major source facilities ranged
from 2 to 1,250 per facility with an average of 84 employees for those facilities reporting their
employment level. Table 2-13 provides the distribution of major source facilities reporting
employment data. Over 80 percent of the 389 facilities reporting employment data had
100 employees or fewer. The vast majority of the remaining facilities reported employment
levels between 101 and 500. Less than 3 percent of facilities reporting employment reported
have more than 500 employees.
2.6 Facility Ownership
Facilities comprise a site of land with plant and equipment that combine inputs (raw
materials, fuel, energy, and labor) to produce outputs (reinforced plastics). Companies that own
these facilities are legal business entities that have the capacity to conduct business transactions
and make business decisions that affect the facility. The terms facility, establishment, plant, and
mill are used synonymously in this analysis and refer to the physical location where products are
1Three facilities have closed since 1997, the baseline year of the economic analysis.
2-29

WA
11
OR
11
CA
34
NV
2
ID
3
MT
WY
UT
3 C
O
1
AZ
3
NM
1
HI 1
AK
TX
25
LA
3
SD
2
NE
5
KS 10 O
K
5
IL
15
MO
11
IA
11
WI
15
MN
13
ND
3
AR
4
OH
41
KY
6
TN
13
AL
10
MS 4
IN
38
MI
18
PA
23
WV
2 V
A
9 NC
20
SC
9 G
A
9
FL
15
ME
2
NH
2
CT
1
NY
9
VT
MA
3
RI
NJ 3
DE
2
MD
3
Figure 2-8. Geographic Distribution of Major Source Facilities
2-30
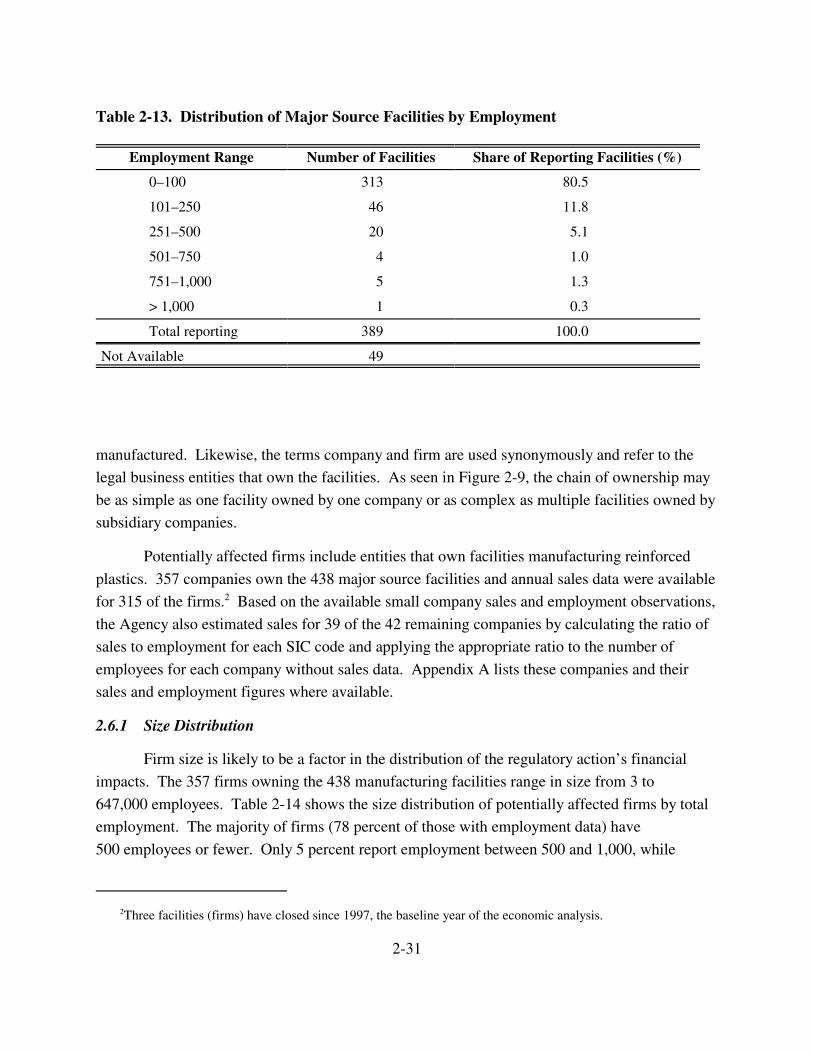
Table 2-13. Distribution of Major Source Facilities by Employment
Employment Range Number of Facilities Share of Reporting Facilities (%)
0–100
101–250
251–500
501–750
751–1,000
> 1,000
Total reporting
Not Available
313 80.5
46 11.8
20 5.1
4 1.0
5 1.3
1 0.3
389 100.0
49
manufactured. Likewise, the terms company and firm are used synonymously and refer to the
legal business entities that own the facilities. As seen in Figure 2-9, the chain of ownership may
be as simple as one facility owned by one company or as complex as multiple facilities owned by
subsidiary companies.
Potentially affected firms include entities that own facilities manufacturing reinforced
plastics. 357 companies own the 438 major source facilities and annual sales data were available
for 315 of the firms.2 Based on the available small company sales and employment observations,
the Agency also estimated sales for 39 of the 42 remaining companies by calculating the ratio of
sales to employment for each SIC code and applying the appropriate ratio to the number of
employees for each company without sales data. Appendix A lists these companies and their
sales and employment figures where available.
2.6.1 Size Distribution
Firm size is likely to be a factor in the distribution of the regulatory action’s financial
impacts. The 357 firms owning the 438 manufacturing facilities range in size from 3 to
647,000 employees. Table 2-14 shows the size distribution of potentially affected firms by total
employment. The majority of firms (78 percent of those with employment data) have
500 employees or fewer. Only 5 percent report employment between 500 and 1,000, while
2Three facilities (firms) have closed since 1997, the baseline year of the economic analysis.
2-31
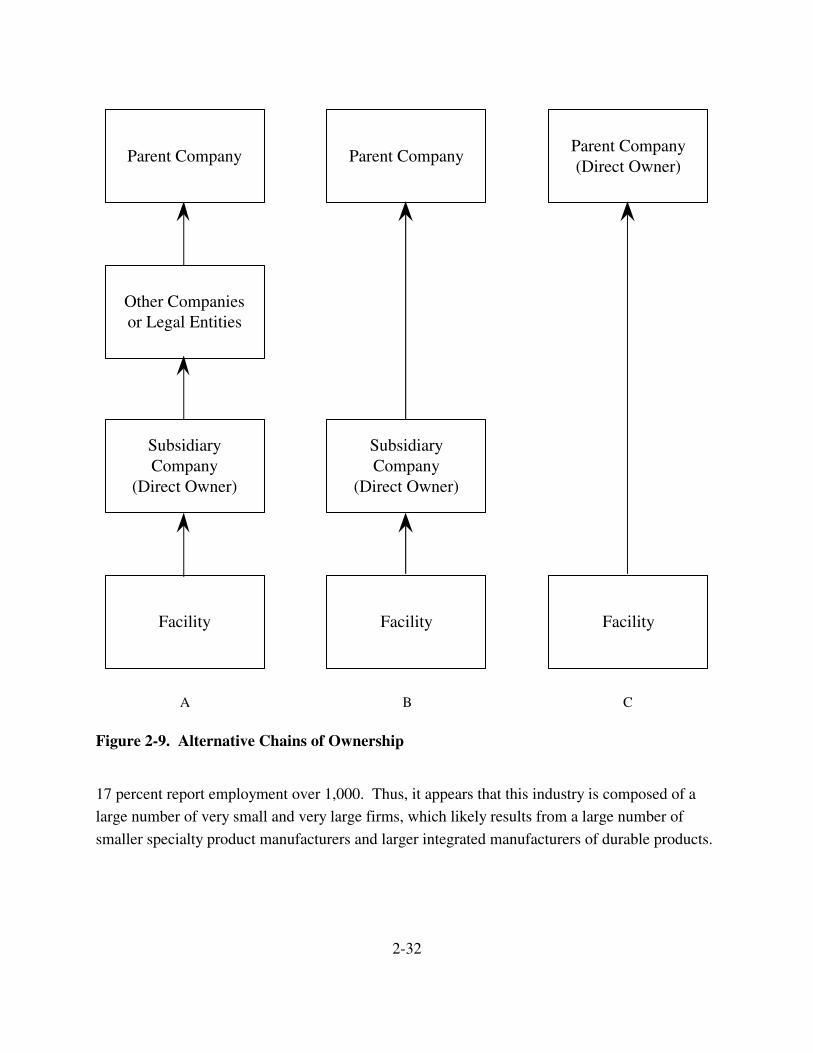
Other Companies or Legal Entities
Subsidiary Company
(Direct Owner)
Facility
Parent Company
Subsidiary Company
(Direct Owner)
Parent Company Parent Company (Direct Owner)
Facility Facility
A B C
Figure 2-9. Alternative Chains of Ownership
17 percent report employment over 1,000. Thus, it appears that this industry is composed of a
large number of very small and very large firms, which likely results from a large number of
smaller specialty product manufacturers and larger integrated manufacturers of durable products.
2-32
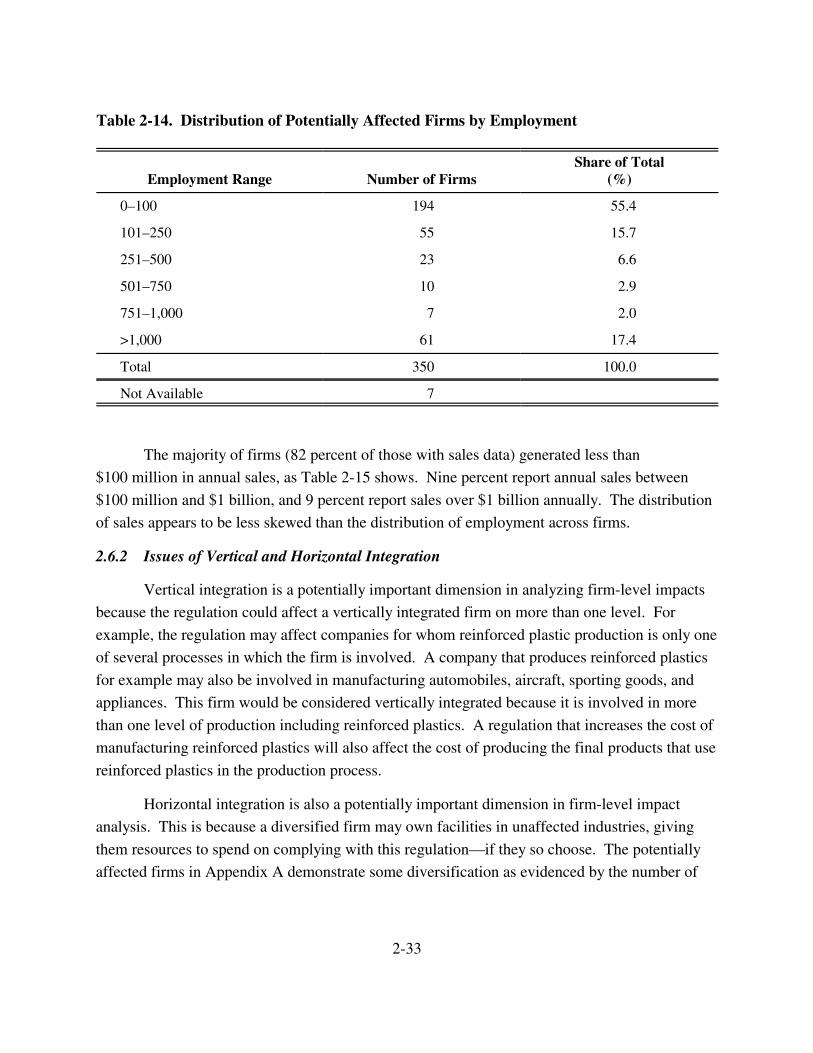
Table 2-14. Distribution of Potentially Affected Firms by Employment
Share of Total Employment Range Number of Firms (%)
0–100 194 55.4
101–250 55 15.7
251–500 23 6.6
501–750 10 2.9
751–1,000 7 2.0
>1,000 61 17.4
Total 350 100.0
Not Available 7
The majority of firms (82 percent of those with sales data) generated less than
$100 million in annual sales, as Table 2-15 shows. Nine percent report annual sales between
$100 million and $1 billion, and 9 percent report sales over $1 billion annually. The distribution
of sales appears to be less skewed than the distribution of employment across firms.
2.6.2 Issues of Vertical and Horizontal Integration
Vertical integration is a potentially important dimension in analyzing firm-level impacts
because the regulation could affect a vertically integrated firm on more than one level. For
example, the regulation may affect companies for whom reinforced plastic production is only one
of several processes in which the firm is involved. A company that produces reinforced plastics
for example may also be involved in manufacturing automobiles, aircraft, sporting goods, and
appliances. This firm would be considered vertically integrated because it is involved in more
than one level of production including reinforced plastics. A regulation that increases the cost of
manufacturing reinforced plastics will also affect the cost of producing the final products that use
reinforced plastics in the production process.
Horizontal integration is also a potentially important dimension in firm-level impact
analysis. This is because a diversified firm may own facilities in unaffected industries, giving
them resources to spend on complying with this regulation—if they so choose. The potentially
affected firms in Appendix A demonstrate some diversification as evidenced by the number of
2-33

Table 2-15. Distribution of Potentially Affected Firms By Sales
Company Sales Number of Firms Share of Total (%)
Less than $5M
$5M to $10M
$10M to $25M
$25M to $50M
$50M to $100M
$100M to $250M
$250M to $500M
$500M to $1B
$1B or greater
127 36.0
65 18.4
52 14.7
28 7.9
20 5.6
12 3.4
13 3.7
6 1.7
31 8.8
Total 354 100.0
Not Available 3
subsidiaries and divisions listed. Most are part of larger firms or holding companies that are
involved in several different industries.
2.7 Small Businesses
The Regulatory Flexibility Act (RFA) of 1980 as amended by the Small Business
Regulatory Enforcement Fairness Act (SBREFA) of 1996 requires that the Agency give special
consideration to small entities affected by Federal regulation. This section focuses on identifying
the small businesses affected by the proposed NESHAP.
2.7.1 Identifying Small Businesses
The following secondary sources were used to obtain data for the 438 affected
manufacturers identified in the industry screening survey (EPA, 1993):
� Business and Company ProFile (Information Access Corporation, 1998)
� Dun and Bradstreet Market Identifiers (Dun & Bradstreet, 1998)
� Ward’s Business Directory of U.S. and Private and Public Companies (Gale Research, 1998)
2-34

� Worldscope (Disclosure Inc., 1998)
� Standard & Poor’s Corporations (Dialog Information Service, 1997)
� Manufacturing USA (Gale Research, 1996)
� Company 10-K Reports
We identified the ultimate parent company and obtained sales and employment data for
companies for which data are available. Based on available secondary data, the Agency has
determined that 357 parent companies are affected by the regulation. Employment data could be
obtained from the above sources for 350 of these parent companies (98 percent).
The Small Business Administration (SBA) defines small businesses based on industry
size standards (SBA, 1996). Table 2-16 presents the size standards for the SIC codes covered by
the industry survey. As shown, the small business definition for the RPC industry ranges from
500 to 1,000 employees. We developed a company’s size standard based on the reported SIC
code for its facilities. In determining the companies’ SIC, we made the following assumptions:
� In cases where companies own facilities with multiple SICs, the most conservative SBA definition was used. For example, if a company owned facilities within SICs 3714 (size standard = 750 employees) and 3089 (size standard = 500 employees), we assumed the size standard to be 750 employees.
� Thirty-eight facilities report an SIC code of 3079. To our knowledge, this SIC code is not currently used. Therefore, we assigned SIC 3089 to these facilities.
� Twenty-four facilities report no SIC code. We assigned these facilities the most conservative size standard of 1,000 employees.
Based on the SBA’s definitions, 279 companies out of 357 (78 percent) were identified as small,
as Figure 2-10 shows. These companies own 305 facilities (70 percent of all RPC facilities).
Appendix A lists the companies identified as small for this analysis.
2-35
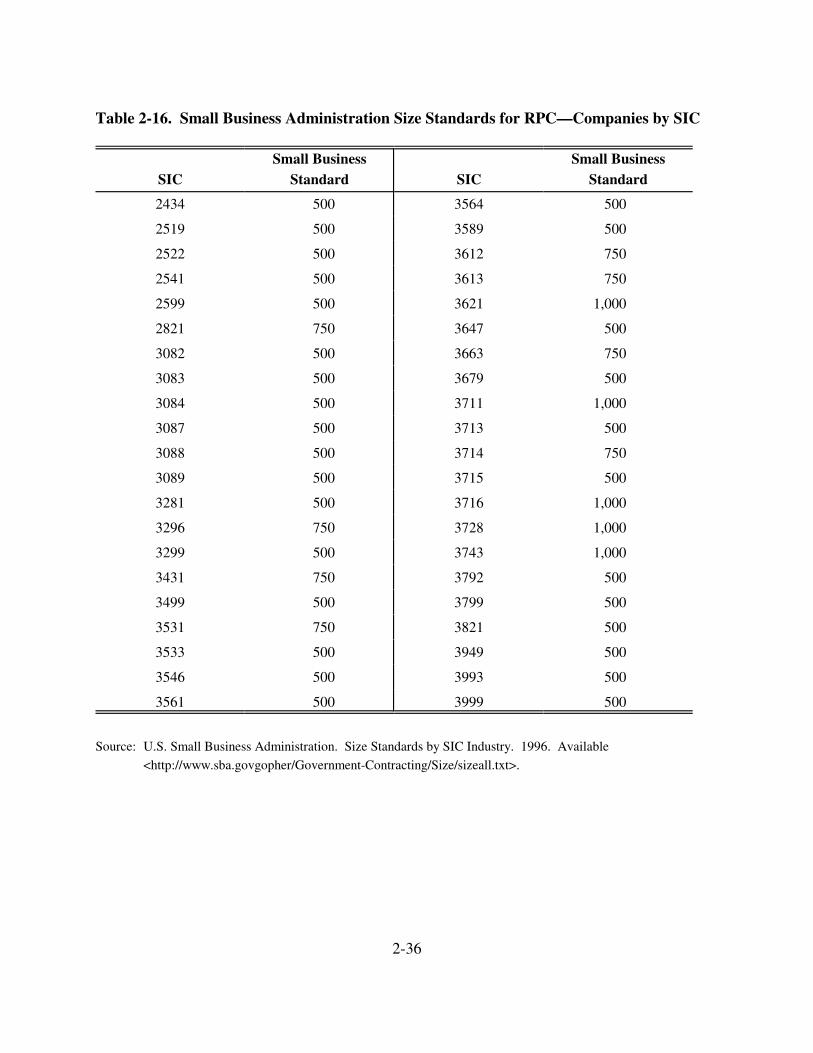
Table 2-16. Small Business Administration Size Standards for RPC—Companies by SIC
SIC
2434
2519
2522
2541
2599
2821
3082
3083
3084
3087
3088
3089
3281
3296
3299
3431
3499
3531
3533
3546
3561
Small Business Standard
500
500
500
500
500
750
500
500
500
500
500
500
500
750
500
750
500
750
500
500
500
SIC
3564
3589
3612
3613
3621
3647
3663
3679
3711
3713
3714
3715
3716
3728
3743
3792
3799
3821
3949
3993
3999
Small Business Standard
500
500
750
750
1,000
500
750
500
1,000
500
750
500
1,000
1,000
1,000
500
500
500
500
500
500
Source: U.S. Small Business Administration. Size Standards by SIC Industry. 1996. Available
<http://www.sba.govgopher/Government-Contracting/Size/sizeall.txt>.
2-36
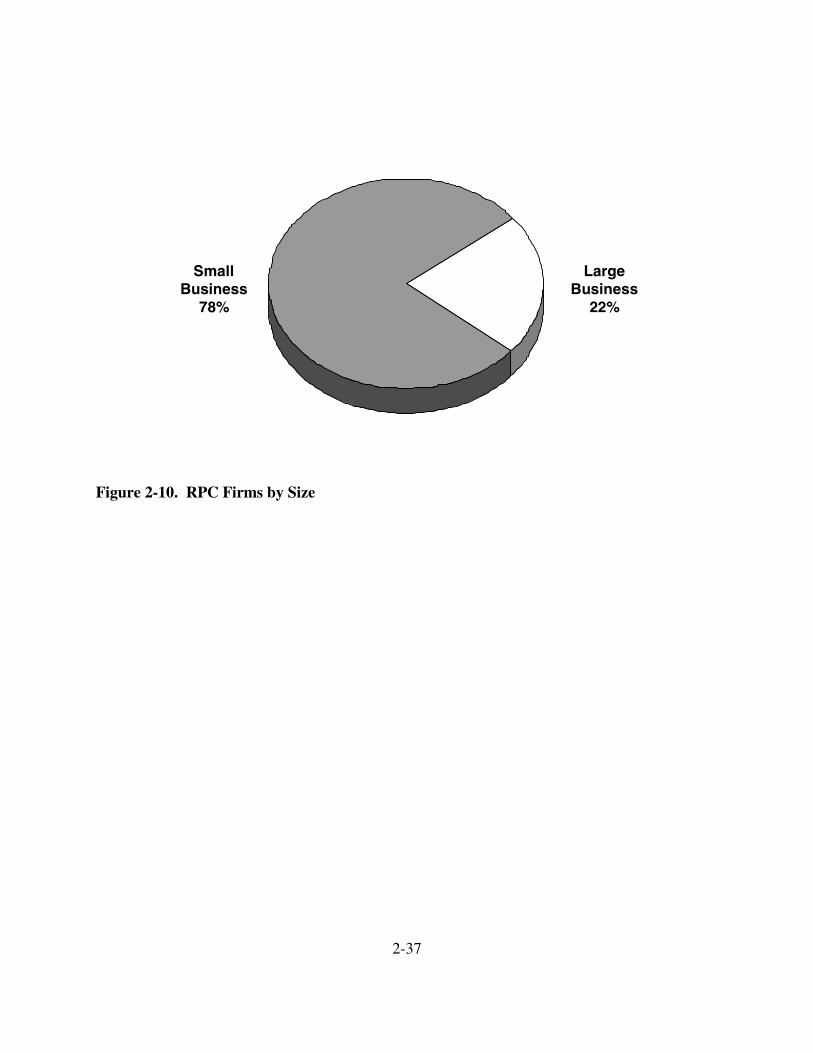
Small Large Business Business
78% 22%
Figure 2-10. RPC Firms by Size
2-37

SECTION 3
ENGINEERING COST ANALYSIS
During the production of RPCs, a portion of the monomers (i.e., styrene, methyl methacrylate) used to transform plastic resin into a durable product are released into the environment. To control these emissions, EPA has developed national emission standards for these HAPs under the authority of Section 112 of the CAA. This section presents the Agency’s estimates of the national compliance costs associated with three regulatory alternatives developed to reduce HAP emissions. A detailed discussion of the methodologies used to develop these estimates is provided in the BID.
3.1 Identifying Regulated Entities
Based on information provided from EPA’s 1993 survey of the reinforced plastics industry, 438 facilities were determined to be potential major sources of HAP emissions from the production of reinforced plastics. Ohio, Indiana, California, Texas, and Pennsylvania are the top five states in order of number of major source facilities. Based on available data on firm ownership, 305 facilities (70 percent) are owned by small businesses. Additional information on these facilities and their ownership is provided in Section 2.
3.2 National Control Cost Estimates
The Agency developed facility-specific estimates of annual compliance costs for each of the following three regulatory alternatives:
� the MACT floor applied to all existing sources,
� above-the-floor controls applied to all sources, and
� the recommended alternative that applies control costs as follows:
In the proposed rule there were different emission thresholds above which an existing facility had to comply with more stringent above-the-floor requirements of 95 percent capture and control. This threshold was 250 tpy of HAP emissions for small businesses and only 100 tpy for large businesses. In this final rule, we have removed the above-the-floor capture and control requirements for existing facilities except for centrifugal casting and continuous lamination/casting and we have established a threshold of 100 tpy for all facilities.
3-1
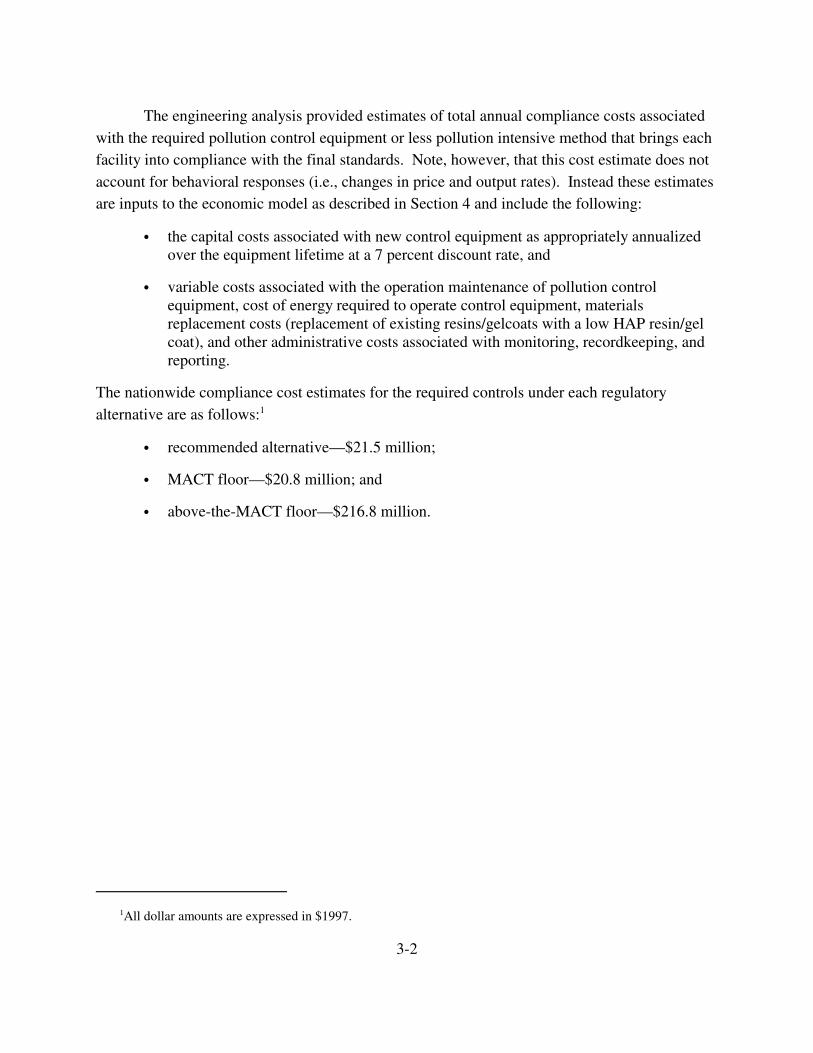
The engineering analysis provided estimates of total annual compliance costs associated with the required pollution control equipment or less pollution intensive method that brings each facility into compliance with the final standards. Note, however, that this cost estimate does not account for behavioral responses (i.e., changes in price and output rates). Instead these estimates are inputs to the economic model as described in Section 4 and include the following:
� the capital costs associated with new control equipment as appropriately annualized over the equipment lifetime at a 7 percent discount rate, and
� variable costs associated with the operation maintenance of pollution control equipment, cost of energy required to operate control equipment, materials replacement costs (replacement of existing resins/gelcoats with a low HAP resin/gel coat), and other administrative costs associated with monitoring, recordkeeping, and reporting.
The nationwide compliance cost estimates for the required controls under each regulatory alternative are as follows:1
� recommended alternative—$21.5 million;
� MACT floor—$20.8 million; and
� above-the-MACT floor—$216.8 million.
1All dollar amounts are expressed in $1997.
3-2

SECTION 4
ECONOMIC IMPACT ANALYSIS
The proposed NESHAP requires producers of RPCs that use selected thermosetting resins to meet emission standards for releases of HAPs to the atmosphere. To meet these standards, most producers will have to install equipment designed to capture pollutants now released to the environment or to change production to less pollution-intensive methods. These actions will have financial implications for the affected producers. They will have broader societal implications because these effects are transmitted through market relationships to other producers and consumers. These potential economic impacts are the subject of this section.
EPA examined three regulatory alternatives for addressing the problem of HAP releases from these sources:
1) the MACT floor applied to all sources,
2) above-the-floor controls applied to all sources, and
3) the recommended alternative that applies control costs as follows:
In the proposed rule there were different emission thresholds above which an existing facility had to comply with more stringent above-the-floor requirements of 95 percent capture and control. This threshold was 250 tpy of HAP emissions for small businesses and only 100 tpy for large businesses. In this final rule, we have removed the above-the-floor capture and control requirements for existing facilities except for centrifugal casting and continuous lamination/casting and we have established a threshold of 100 tpy for all facilities. This section provides results for each alternative.
To measure the size and distribution of the economic impacts of these alternatives, EPA compared baseline conditions of RPC markets in 1997 with those for the counterfactual or with-regulation conditions expected to result from implementing each alternative. The main elements of this analysis are
� identification of markets for RPC products and description of firm behavior within these markets;
� economic characterization of the regulated facilities in terms of whether they are a commercial or captive producer, commodity produced, and cost of production;
4-1
� characterization of baseline demand for each product;
� development of an economic model that evaluates behavioral responses to additional costs of regulation in a market context; and
� presentation and interpretation of economic impact estimates developed by the model.
4.1 Reinforced Plastic Composite Markets
RPCs are consumed as inputs in the production of a wide variety of products that can be found within the following broad market segments:
� Aircraft/Military: flight surfaces, cabin interiors, aerospace components, military helmets, armament, rocket launchers, etc.
� Appliance/Business: refrigerators, freezers, ranges, microwave ovens, power tools, small appliances, computer housings, calculators, etc.
� Construction: swimming pools, rain gutters, molds for concrete, bathtubs, shower stalls, whirlpools, spas, highway signs, cooling tower components, paneling for greenhouses, patios, railings and other architectural components
� Consumer Products: fishing rods, golf clubs, skis, tennis rackets, furniture, campers, snowmobiles, exercise equipment, seating, counter tops, serving trays, boxes and containers, microwave cookware, etc.
� Corrosion Resistant Products: pipe fittings, ducts, hoods, tanks, pumps, filtration equipment, and a wide variety of other chemical resistant products for use in the waste/wastewater treatment, chemical processing, semiconductor, and petrochemical industries
� Electronic/Electrical: rods, tubes, circuit breaker boxes, molded parts, housings, substation equipment, electronic connections, pole line hardware, microwave antennas, and many other electrical and electronic applications
� Land Transportation: body panels for cars, buses, and tractor trailers, truck cabs, boxcar doors, subway seating, heater housings, front end assemblies, drive shafts, wind deflectors, grill opening panels, tail light housings, fender liners, instrument panels, and other diverse parts and accessories for land transportation and utility vehicles
� Other: all other composites applications, including the repair/replacement of components of the civil infrastructure such as guardrails, sign posts, and structural supports for highways and bridges
4-2
Some of the directly affected operations are performed as part of larger integrated process. These captive producers do not engage in commercial transactions involving the RPC product. They produce and sell a product (e.g., appliances) that incorporates the RPC product that they also produce. Other RPC producers do sell their products in the market where the RPC product is used as an input to another product, which also could be appliance manufacture. Presumably, each producer has conducted a “make or buy” decision, some deciding to buy the RPC commodity, others to self-produce it.
Each of the product groups above is taken as a separate composite commodity with a single price and unique supply and demand characterization. In addition to these segments, sufficient market information is available to separate the construction segment into three distinct end-use markets—general construction, plumbing fixtures, and panels. Operating at this broad level of product aggregation when there are literally thousands of specific products obviously masks baseline price differences and market shifts within each segment. However, without substantial additional data further disaggregation is not possible.
As shown in Table 4-1, more than 3.1 billion pounds of RPC products were shipped in 1997 to domestic and foreign consumers in these markets. Based on industry survey responses and historical average growth rates, EPA estimated that 1.4 billion pounds of RPCs, or 45 percent of the total shipments, were manufactured by facilities directly affected by the regulation. Facilities using unaffected resins (i.e., thermoplastics or unaffected thermosets) produced 1.7 billion pounds of RPCs.
Both segments include “in-house” production of RPCs by captive facilities and merchant production by commercial RPC suppliers. The captive facilities are likely to be owned by larger integrated firms manufacturing durable products, while the commercial facilities are typically smaller specialty firms. Given limited data on the type of facility, the Agency approximated this distribution by using the SBA criteria for large and small businesses. In the directly affected segment, facilities owned by large businesses are assumed to be captively owned and operated. Facilities owned by small businesses are assumed to be merchant producers. For the unaffected segment, the Agency computed the merchant/captive distribution using the ratio observed for the regulated segment.
Following the above approach, EPA estimated that 559.9 million pounds of regulated thermoset RPCs were exchanged in markets during 1997, or 39 percent of the directly affected segment. Captively produced resins that are directly affected by the regulation accounted for the remaining 859.8 million pounds. As shown in Table 4-1, the same merchant/captive proportions
4-3
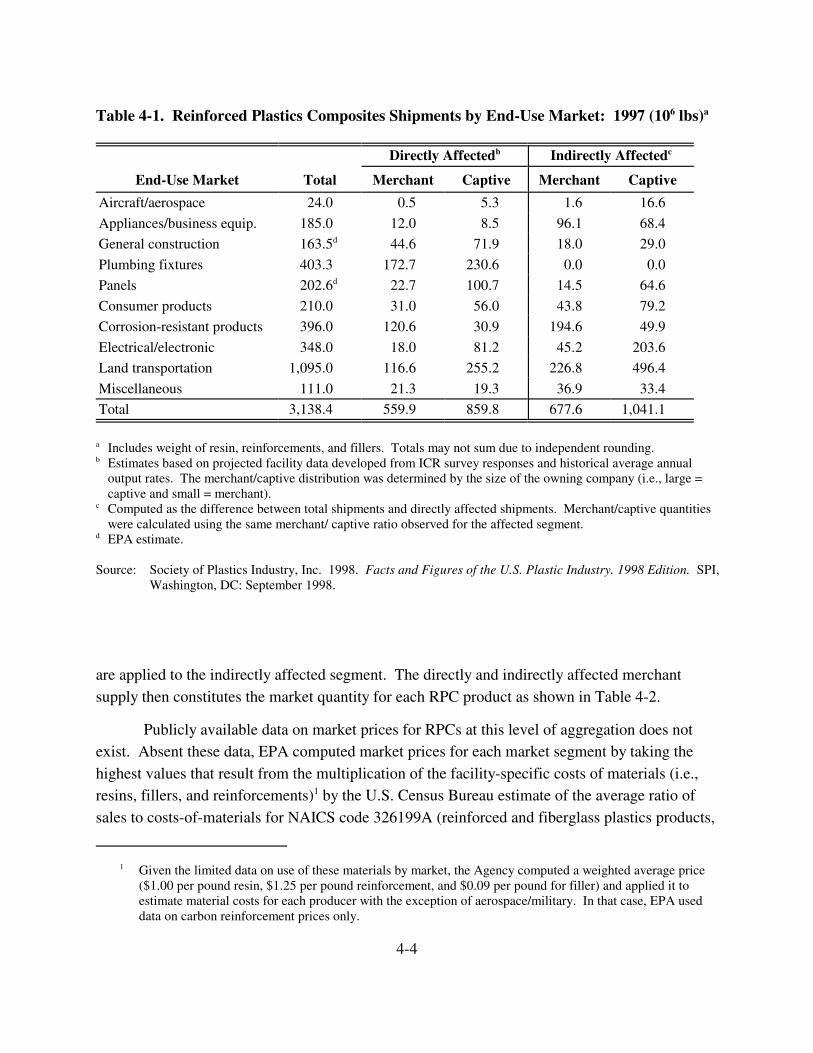
Table 4-1. Reinforced Plastics Composites Shipments by End-Use Market: 1997 (106 lbs)a
1.6
677.6
Directly Affectedb Indirectly Affectedc
End-Use Market Total Merchant Captive Merchant Captive
Aircraft/aerospace 24.0 0.5 5.3 16.6
Appliances/business equip. 185.0 12.0 8.5 96.1 68.4
General construction 163.5d 44.6 71.9 18.0 29.0
Plumbing fixtures 403.3 172.7 230.6 0.0 0.0
Panels 202.6d 22.7 100.7 14.5 64.6
Consumer products 210.0 31.0 56.0 43.8 79.2
Corrosion-resistant products 396.0 120.6 30.9 194.6 49.9
Electrical/electronic 348.0 18.0 81.2 45.2 203.6
Land transportation 1,095.0 116.6 255.2 226.8 496.4
Miscellaneous 111.0 21.3 19.3 36.9 33.4
Total 3,138.4 559.9 859.8 1,041.1
a Includes weight of resin, reinforcements, and fillers. Totals may not sum due to independent rounding. b Estimates based on projected facility data developed from ICR survey responses and historical average annual
output rates. The merchant/captive distribution was determined by the size of the owning company (i.e., large = captive and small = merchant). Computed as the difference between total shipments and directly affected shipments. Merchant/captive quantities were calculated using the same merchant/ captive ratio observed for the affected segment.
d EPA estimate.
Source: Society of Plastics Industry, Inc. 1998. Facts and Figures of the U.S. Plastic Industry. 1998 Edition. SPI, Washington, DC: September 1998.
are applied to the indirectly affected segment. The directly and indirectly affected merchant supply then constitutes the market quantity for each RPC product as shown in Table 4-2.
Publicly available data on market prices for RPCs at this level of aggregation does not exist. Absent these data, EPA computed market prices for each market segment by taking the highest values that result from the multiplication of the facility-specific costs of materials (i.e., resins, fillers, and reinforcements)1 by the U.S. Census Bureau estimate of the average ratio of sales to costs-of-materials for NAICS code 326199A (reinforced and fiberglass plastics products,
1 Given the limited data on use of these materials by market, the Agency computed a weighted average price ($1.00 per pound resin, $1.25 per pound reinforcement, and $0.09 per pound for filler) and applied it to estimate material costs for each producer with the exception of aerospace/military. In that case, EPA used data on carbon reinforcement prices only.
4-4
c
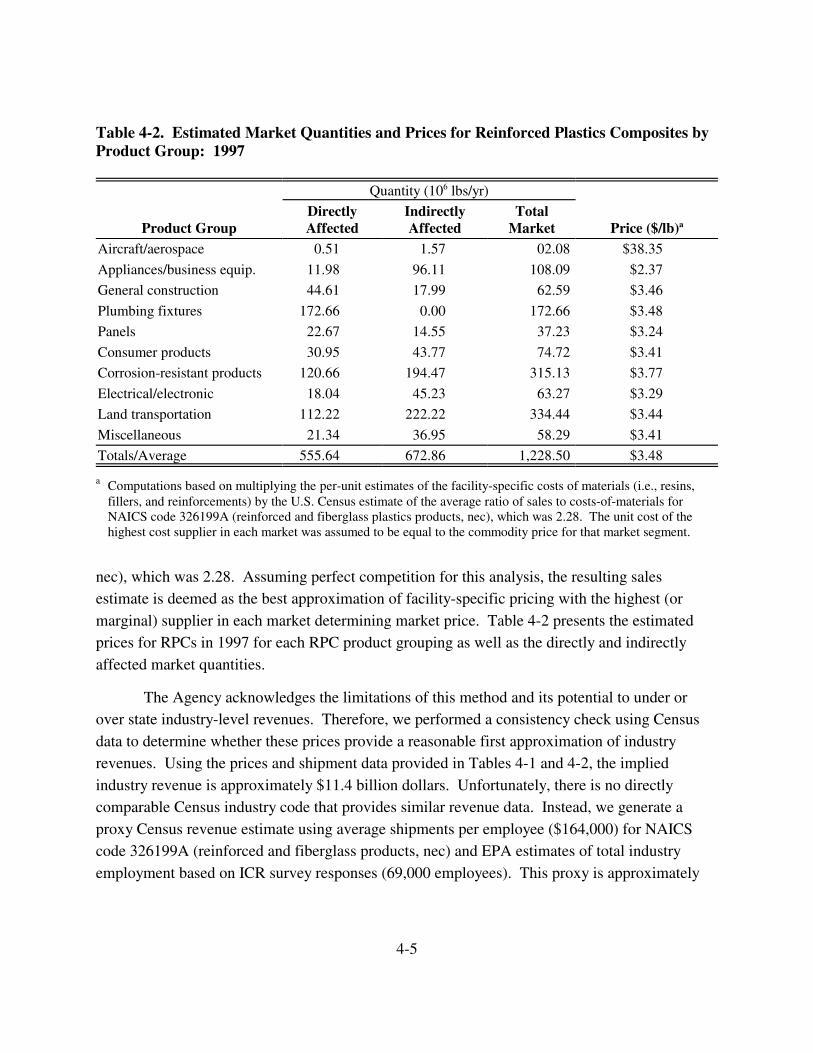
Table 4-2. Estimated Market Quantities and Prices for Reinforced Plastics Composites by Product Group: 1997
Quantity (106 lbs/yr)
Product Group Aircraft/aerospace
Appliances/business equip.
General construction
Plumbing fixtures
Panels
Consumer products
Corrosion-resistant products
Electrical/electronic
Land transportation
Miscellaneous
Totals/Average
Directly Indirectly Total Affected Affected Market Price ($/lb)a
0.51 1.57 02.08 $38.35
11.98 96.11 108.09 $2.37
44.61 17.99 62.59 $3.46
172.66 0.00 172.66 $3.48
22.67 14.55 37.23 $3.24
30.95 43.77 74.72 $3.41
120.66 194.47 315.13 $3.77
18.04 45.23 63.27 $3.29
112.22 222.22 334.44 $3.44
21.34 36.95 58.29 $3.41
555.64 672.86 1,228.50 $3.48
a Computations based on multiplying the per-unit estimates of the facility-specific costs of materials (i.e., resins, fillers, and reinforcements) by the U.S. Census estimate of the average ratio of sales to costs-of-materials for NAICS code 326199A (reinforced and fiberglass plastics products, nec), which was 2.28. The unit cost of the highest cost supplier in each market was assumed to be equal to the commodity price for that market segment.
nec), which was 2.28. Assuming perfect competition for this analysis, the resulting sales estimate is deemed as the best approximation of facility-specific pricing with the highest (or marginal) supplier in each market determining market price. Table 4-2 presents the estimated prices for RPCs in 1997 for each RPC product grouping as well as the directly and indirectly affected market quantities.
The Agency acknowledges the limitations of this method and its potential to under or over state industry-level revenues. Therefore, we performed a consistency check using Census data to determine whether these prices provide a reasonable first approximation of industry revenues. Using the prices and shipment data provided in Tables 4-1 and 4-2, the implied industry revenue is approximately $11.4 billion dollars. Unfortunately, there is no directly comparable Census industry code that provides similar revenue data. Instead, we generate a proxy Census revenue estimate using average shipments per employee ($164,000) for NAICS code 326199A (reinforced and fiberglass products, nec) and EPA estimates of total industry employment based on ICR survey responses (69,000 employees). This proxy is approximately
4-5
$11.2 billion dollars, which is the same order of magnitude as our revenue estimate generated from the computed market prices.
Market impacts of the regulation are conditional on the behavior of firms. For this analysis, firms are viewed as a price-takers; that is, each firm takes the market price as given. This assumption of “perfect competition” seems appropriate given the number and distribution of buyers and sellers of RPCs across the United States and the reasonably homogeneous nature of RPC products. Therefore, the Agency modeled ten national, perfectly competitive markets based on the product groups identified above.
4.2 Producers, Costs, and Supply
As described above, RPC facilities are classified into two types of producers: captive or merchant. Several factors would suggest that the impact of the regulation on the choices of captive producers (i.e., the use of “in-house” RPCs production methods, substitute materials, and RPC output levels) is small because RPCs typically represent a small cost share of their final products. In addition, quality and control issues may preclude these operations from obtaining RPCs from outside suppliers. Therefore, the market analysis focuses only on the merchant segment of RPC production.
Two types of merchant suppliers operate in these markets:
� facilities directly affected by the regulation because they face additional costs with the implementation of the NESHAP and
� facilities indirectly affected by the regulation because they produce a close substitute for the products produced by the regulated entities.
Although this second type of supplier does not incur additional control costs, it will be affected by any changes in market prices that occur with the regulation. The engineering analysis projected each directly affected facility’s 1997 product-line quantities based on the Information Collection Request (ICR) survey data and historical industry average annual output growth rates. Each individual merchant facility is included in the economic model. The output from indirectly affected producers is the difference between total merchant shipments produced and that from affected producers (see Table 4-1). Absent a detailed characterization of these producers and because they are not subject to the regulation, this component of supply was included in the economic model as a single representative supplier with a general functional form that allows for increases in their production in response to price increases (see Appendix B for details).
For affected facilities, the Agency developed unit cost curves for each RPC product line based on the reported production and the associated market price from Table 4-2 (see
4-6

Appendix B for details). Given fixed factors of production (i.e., plant and equipment), each RPC product line at a directly affected facility is characterized by an upward-sloping supply function, as shown in Figure 4-1. In this case, the supply function is that portion of the marginal cost curve bounded by zero and the technical capacity at the facility with production costs being measured as the area under the curve up to their output level. Suppliers select their output level according to this schedule as long as the market price is sufficiently high to cover average variable costs (i.e., greater than C0 in Figure 4-1) and the resulting revenue surplus is large enough to cover any fixed costs. If the market price falls below the minimum average variable costs, then the firm’s best response is to cease production because total revenue does not cover the total variable costs of production. These individual supply decisions are then aggregated (i.e., horizontally summed) to develop the market supply curve. Once we apply this characterization of the supply function to each affected producer, we derive their production costs by taking the integral of the area under the curve corresponding to their production rate and market price.
$/lb
C0
Sd
lbs/year
Figure 4-1. Supply Curve for a Representative Directly Affected Merchant Facility
4-7
As detailed in Appendix B, this analysis employs an “intermediate” run analysis in which some factors are fixed (capital) and others are variable (labor, materials, etc.). This allows us to avoid the consequences of assuming the very short run or the long run. The very short run is a case in which all factors of production are fixed and producers are unable to respond and, thus, incur a one-to-one reduction in profits due to regulation, while the long run is a case in which all factors are variable and all regulatory costs are passed on to consumers. Therefore, our modeling approach addresses economic viability for both the short-run criteria (i.e., product-line revenues cover all variable costs) and the long-run criteria (i.e., facility revenues cover total costs).
4.3 Consumers, Value, and Demand
Two types of consumers use RPC products:
� “in-house” consumers of RPCs produced by captive producers, and
� other firms that purchase RPCs from merchant producers.
Large integrated firms consume RPCs manufactured within the firm, and no explicit RPC demand is revealed through a market transaction. Rather, the decision to consume RPCs produced “in-house” is the result of a “make or buy” decision that considers the value to the firm of manufacturing these inputs as opposed to purchasing them offsite. Although these choices are not explicitly addressed in the economic model, it is likely that these consumers are less responsive to changes in RPC costs because the cost share of total production is small and their supply options may be limited for corporate or technical reasons. As a result, the impacts on these producers are determined using a full-cost absorption approach with the estimated regulatory costs causing a dollar for dollar reduction in their profits.
A variety of consumers purchase RPC products commercially and incorporate them into other higher-order products. For example, automobile manufacturers use RPC bumpers and interior components; electrical appliances and electronic products use RPCs as internal components and external housings. The value of these products depends on the availability and cost of substitution for the product (i.e., metal instead of plastic), the features of the alternative product that affect its degree of substitutability in higher-order products, and the price of the higher-order product.
For the economic analysis, each commodity market was modeled as having a single aggregate consumer with a downward-sloping market demand curve (see Figure 4-2). The Agency constructed this curve for each RPC commodity using baseline quantity, price data, and
4-8
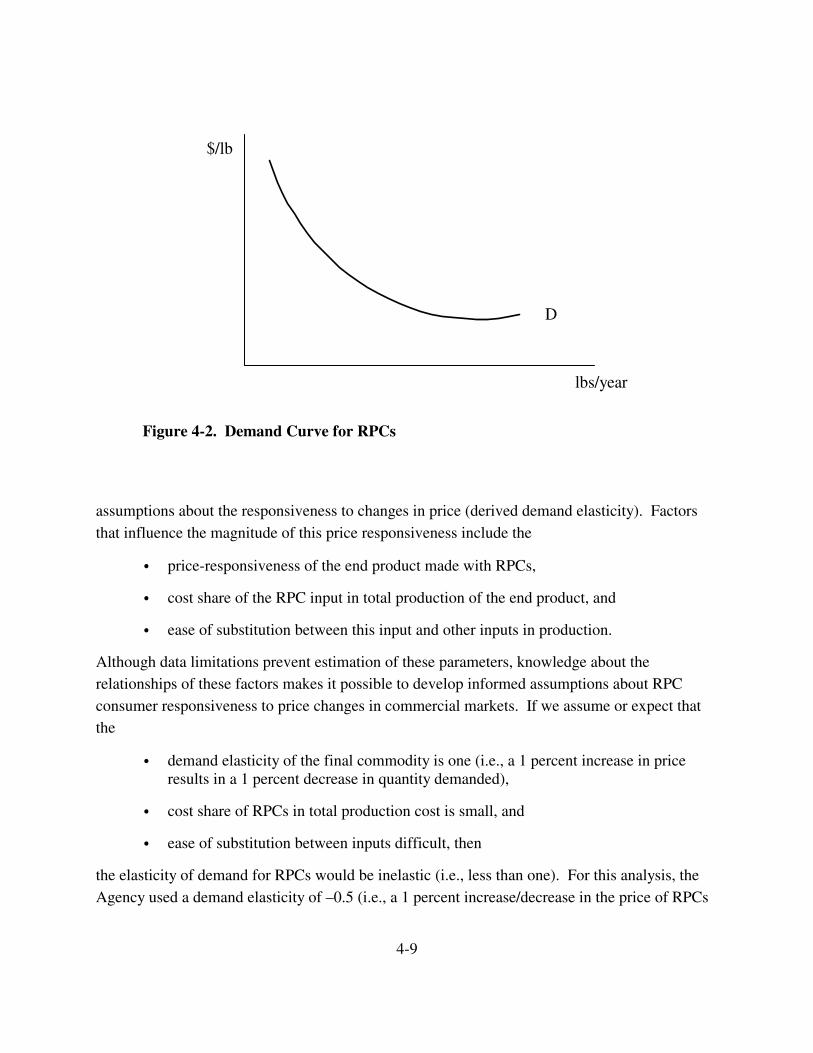
$/lb
D
lbs/year
Figure 4-2. Demand Curve for RPCs
assumptions about the responsiveness to changes in price (derived demand elasticity). Factors that influence the magnitude of this price responsiveness include the
� price-responsiveness of the end product made with RPCs,
� cost share of the RPC input in total production of the end product, and
� ease of substitution between this input and other inputs in production.
Although data limitations prevent estimation of these parameters, knowledge about the relationships of these factors makes it possible to develop informed assumptions about RPC consumer responsiveness to price changes in commercial markets. If we assume or expect that the
� demand elasticity of the final commodity is one (i.e., a 1 percent increase in price results in a 1 percent decrease in quantity demanded),
� cost share of RPCs in total production cost is small, and
� ease of substitution between inputs difficult, then
the elasticity of demand for RPCs would be inelastic (i.e., less than one). For this analysis, the Agency used a demand elasticity of –0.5 (i.e., a 1 percent increase/decrease in the price of RPCs
4-9
would result in a 0.5 percent decrease/increase in the quantity of RPC products demanded). Appendix B provides a detailed description of the equations that characterize the market demand curves.
4.4 Baseline and With-Regulation Equilibrium
The competitive model of price formation, as shown in Figure 4-3 (a), posits that market prices and quantities are determined by the intersection of the market supply and demand curves. Under the baseline scenario, a market price and quantity (P,Q) are determined by the downward-sloping market demand curve (DM) and the upward-sloping market supply curve (SM) that reflects the sum of the individual supply curves of directly affected and indirectly affected facilities that produce a given product.
With the regulation, the cost of production increases for suppliers using regulated thermoset resins. These additional costs include a variable component consisting of the operating and maintenance costs and a fixed component that does not vary with output (i.e., expenditures for control-related capital equipment to comply with the regulatory alternative). The imposition of the regulatory control costs is represented as an upward shift in the supply curve for each directly affected facility. As a result of the upward shift in these individual supply curves, the market supply curve for RPC products will shift upward as shown in Figure 4-3(b) to reflect the increased costs of production at facilities using thermoset resins.
In baseline without the proposed standards, the industry produces total output, Q, at price, P, with directly affected facilities producing the amount qd and indirectly affected facilities accounting for Q minus qd, or qi. With the regulation, the market price increases from P to P� and market output (as determined from the market demand curve, DM) declines from Q to Q�. This reduction in market output is the net result of reductions at directly affected facilities and increases at indirectly affected facilities.
4.5 Results
The simple analytics presented above suggest that, when faced with higher costs of RPC product production, producers will attempt to mitigate their impacts by making adjustments to shift as much of the burden on other economic agents as market conditions allow. The adjustments available to facility operators include changing production processes, changing inputs, changing output rates, or even closing the facility. This analysis focuses on the last two options because they appear to be the most viable for RPC facilities, at least in the near-term. A large segment of the RPC industry is affected by the regulation, and we would expect upward pressure on prices as producers facing higher costs reduce output rates in response to these costs. Changes in market prices and, through the impact of price on quantity demanded, output for each
4-10
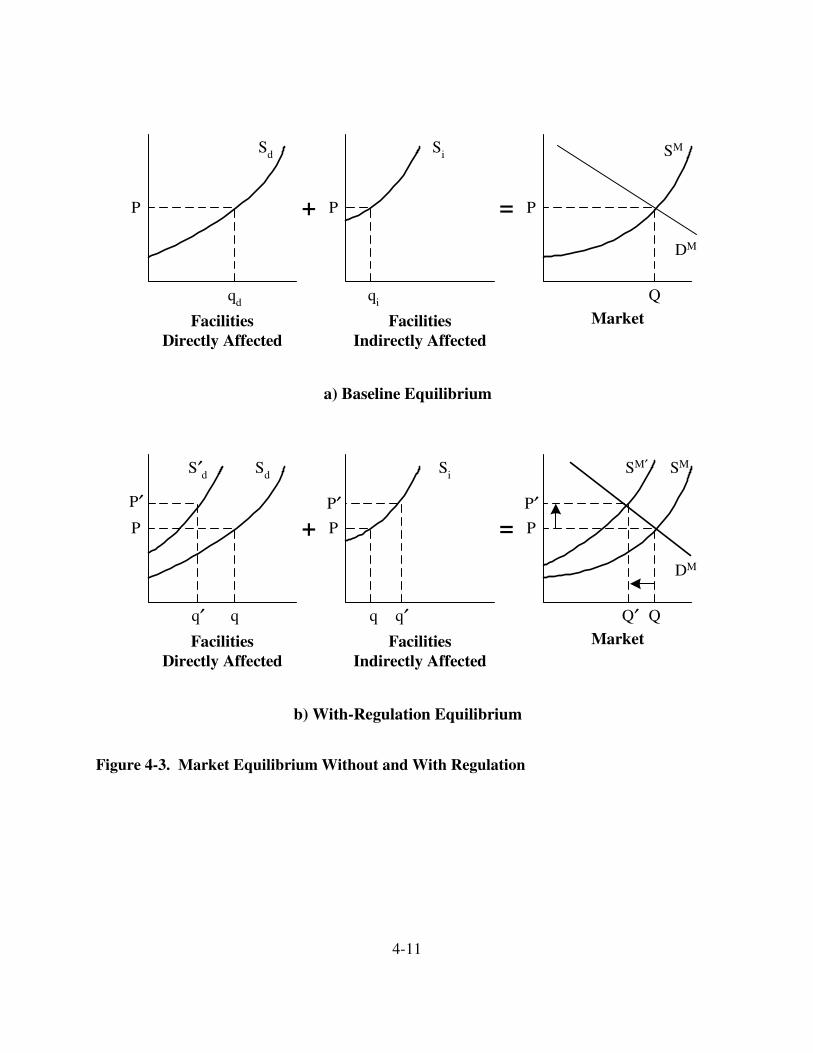
Sd Si
P+
SM
DM
qi Q
Facilities Market Indirectly Affected
a) Baseline Equilibrium
P′ P′
Si SM′
DM
SM
P = P
qd
Facilities Directly Affected
P′
SdS′ d
P + P = P
q′ q q q′ Q′ Q
Facilities Facilities Market Directly Affected Indirectly Affected
b) With-Regulation Equilibrium
Figure 4-3. Market Equilibrium Without and With Regulation
4-11
product will lead to changes in the profitability of product lines, facilities, and firms. These market and industry adjustments will also determine the social costs of the regulation.
To estimate these economic impacts, the conceptual model described above was operationalized in a multiple spreadsheet model, as detailed in Appendix B. In summary, this model characterizes producers and consumers of each RPC product and their behavioral responses to the imposition of the regulatory compliance costs. These costs are expressed per pound of RPC product for each facility and serve as the input to the market model, or “costshifters” of the baseline supply curves at the facility. Given these costs for directly affected facilities, the model determines a new equilibrium solution in a comparative static approach with higher market prices and reductions in output for each RPC product.
The following sections provide the Agency’s estimates of these economic impacts for the recommended alternative and compare and contrast these results with the projected impacts under the MACT floor and above-the-MACT floor alternatives.
4.5.1 Market-Level Impacts
The increased cost of production due to the regulation is expected to slightly increase the price of composites and marginally reduce their production/consumption from baseline levels. As shown in Table 4-3, the recommended alternative is projected to increase the average price of RPC products by 0.7 percent, or $0.03 per pound. The price impacts are attenuated by the existence of a perfect substitute for the regulated RPC products. This substitute is RPC products made from thermoplastic resins, which are not subject to the regulation. With higher RPC product prices, they are expected to increase production by 0.7 percent. The combined effect of higher costs due to regulation and substitution to unaffected RPC products is expected to cause a 1.7 percent reduction in production at regulated facilities. The net result of these reductions at affected facilities and the increases at unaffected facilities is a market decline in output of 0.4 percent.
The size of the projected price increase for each commodity is primarily determined by the level and distribution of compliance costs incurred by the facilities manufacturing these commodities. In general, we would expect markets with higher per-unit variable compliance costs to experience the most significant price changes. As shown in Table 4-4, the two markets with the highest average per-unit compliance costs (corrosion-resistant, general construction) also see the most significant price changes (1.6 and 0.6 percent, respectively) . An additional factor in determining the changes in market price is the market share of substitute products (i.e., thermoplastic RPCs). As discussed above, these unaffected suppliers are expected to limit the ability of affected producers to pass along costs to consumers and thereby increase market price.
4-12
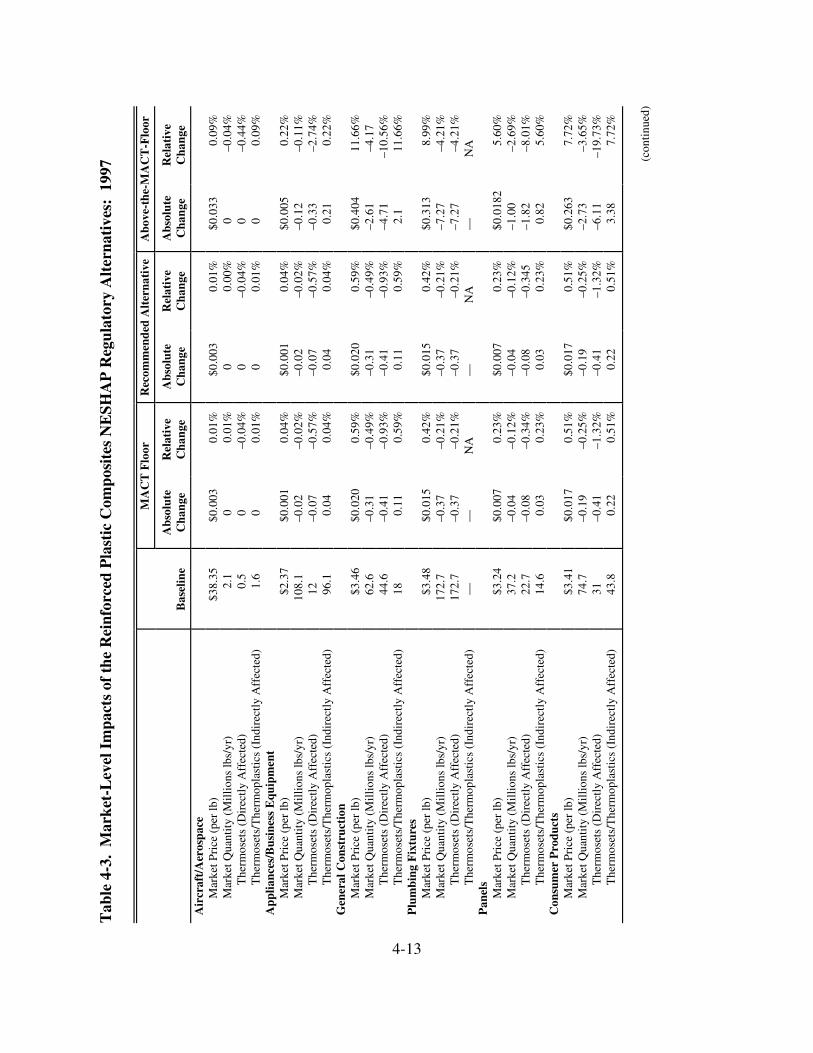
0.09
%
–0.0
4%
–0.4
4%
0.09
%
0.22
%
–0.1
1%
–2.7
4%
0.22
%
11.6
6%
11.6
6%
8.99
%
–4.2
1%
–4.2
1%
5.60
%
–2.6
9%
–8.0
1%
5.60
%
7.72
%
–3.6
5%
7.72
%
–4.1
7
NA
(con
tinu
ed)
Tab
le 4
-3.
Mar
ket-
Lev
el I
mpa
cts
of t
he R
einf
orce
d P
last
ic C
ompo
site
s N
ESH
AP
Reg
ulat
ory
Alt
erna
tive
s: 1
997
Bas
elin
e
MA
CT
Flo
or
Rec
omm
ende
d A
lter
nati
ve
Abo
ve-t
he-M
AC
T-F
loor
Abs
olut
e C
hang
e R
elat
ive
Cha
nge
Abs
olut
e C
hang
e R
elat
ive
Cha
nge
Abs
olut
e C
hang
e R
elat
ive
Cha
nge
Air
craf
t/A
eros
pace
–10.
56%
–19.
73%
3.
38
$0.0
182
$0.0
33
$0.0
05
$0.4
04
$0.3
13
$0.2
63
–0.1
2 –0
.33
0.21
–2.6
1 –4
.71
–7.2
7 –7
.27
–1.0
0 –1
.82
0.82
–2.7
3 –6
.11
2.1
0 0 0 —
0.00
%
0.01
%
–0.0
4%
0.01
%
0.04
%
–0.0
2%
–0.5
7%
0.04
%
0.59
%
–0.4
9%
–0.9
3%
0.59
%
0.42
%
–0.2
1%
–0.2
1%
0.23
%
–0.1
2%
0.23
%
0.51
%
–0.2
5%
–1.3
2%
0.51
%
–0.3
45
NA
0.22
$0.0
03
$0.0
01
$0.0
20
$0.0
15
$0.0
07
$0.0
17
0.04
0.11
0.03
–0.0
2 –0
.07
–0.3
1 –0
.41
–0.3
7 –0
.37
–0.0
4 –0
.08
–0.1
9 –0
.41
0 0 0 —
0.01
%
0.04
%
0.59
%
0.23
%
0.51
%
0.01
%
–0.0
4%
0.01
%
0.04
%
–0.0
2%
–0.5
7%
0.59
%
–0.4
9%
–0.9
3%
0.42
%
–0.2
1%
–0.2
1%
0.23
%
–0.1
2%
–0.3
4%
0.51
%
–0.2
5%
–1.3
2%
NA
43.8
0.
22
$0.0
03
$0.0
01
$0.0
20
$0.0
15
$0.0
07
$0.0
17
–0.0
7 0.
04
–0.4
1 0.
11
–0.3
7
–0.0
8 0.
03
–0.4
1
–0.0
2
–0.3
1
–0.3
7
–0.0
4
–0.1
9
0 0 0 —
$38.
35
$2.3
7
$3.4
6
$3.4
8
$3.2
4
$3.4
1
2.1
0.5
96.1
44.6
172.
7
22.7
14
.6
1.6
108.
1
62.6
172.
7
37.2
74.7
12
18
31
—
The
rmos
ets/
The
rmop
last
ics
(Ind
irec
tly
Aff
ecte
d)
The
rmos
ets/
The
rmop
last
ics
(Ind
irec
tly
Aff
ecte
d)
The
rmos
ets/
The
rmop
last
ics
(Ind
irec
tly
Aff
ecte
d)
The
rmos
ets/
The
rmop
last
ics
(Ind
irec
tly
Aff
ecte
d)
The
rmos
ets/
The
rmop
last
ics
(Ind
irec
tly
Aff
ecte
d)
The
rmos
ets/
The
rmop
last
ics
(Ind
irec
tly
Aff
ecte
d)
The
rmos
ets
(Dir
ectl
y A
ffec
ted)
The
rmos
ets
(Dir
ectl
y A
ffec
ted)
The
rmos
ets
(Dir
ectl
y A
ffec
ted)
The
rmos
ets
(Dir
ectl
y A
ffec
ted)
The
rmos
ets
(Dir
ectl
y A
ffec
ted)
The
rmos
ets
(Dir
ectl
y A
ffec
ted)
Mar
ket Q
uant
ity
(Mil
lion
s lb
s/yr
)
Mar
ket Q
uant
ity
(Mil
lion
s lb
s/yr
)
Mar
ket Q
uant
ity
(Mil
lion
s lb
s/yr
)
Mar
ket Q
uant
ity
(Mil
lion
s lb
s/yr
)
Mar
ket Q
uant
ity
(Mil
lion
s lb
s/yr
)
Mar
ket Q
uant
ity
(Mil
lion
s lb
s/yr
)
App
lianc
es/B
usin
ess
Equ
ipm
ent
Mar
ket P
rice
(pe
r lb
)
Mar
ket P
rice
(pe
r lb
)
Mar
ket P
rice
(pe
r lb
)
Mar
ket P
rice
(pe
r lb
)
Mar
ket P
rice
(pe
r lb
)
Mar
ket P
rice
(pe
r lb
)
Gen
eral
Con
stru
ctio
n
Con
sum
er P
rodu
cts
Plu
mbi
ng F
ixtu
res
Pan
els
4-13
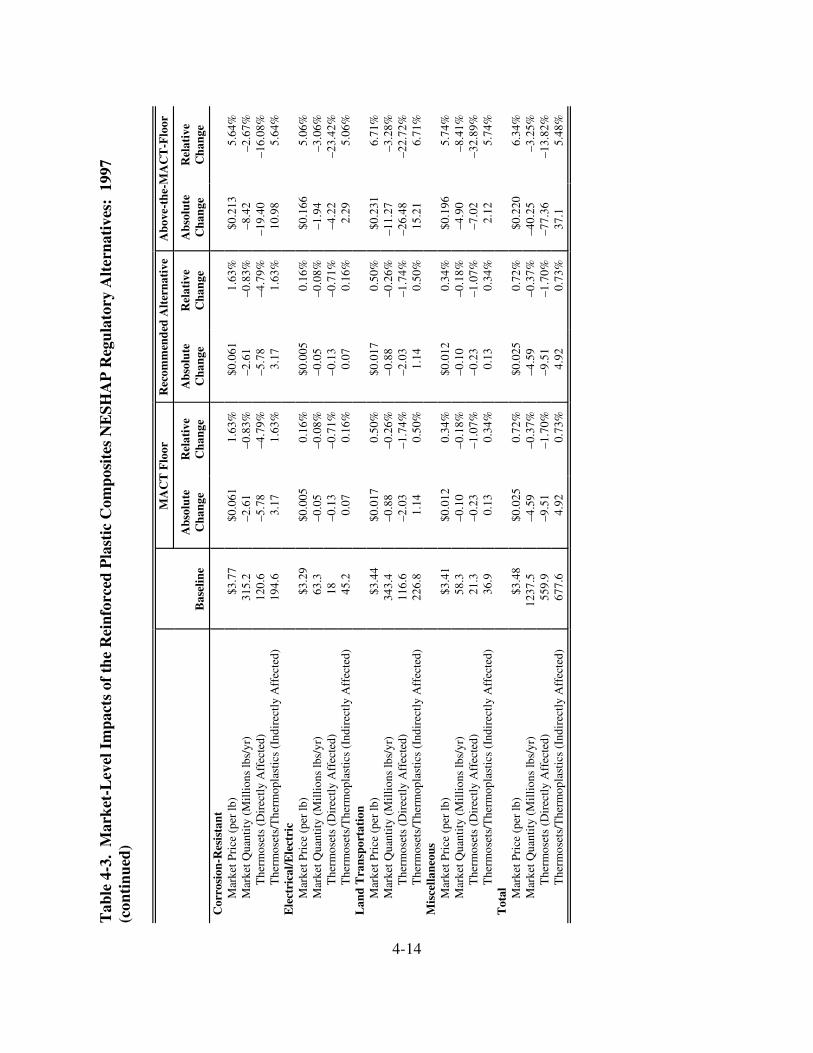
5.64
%
–2.6
7%
5.64
%
5.06
%
–3.0
6%
5.06
%
6.71
%
–3.2
8%
6.71
%
5.74
%
–8.4
1%
5.74
%
6.34
%
–3.2
5%
5.48
%
Tab
le 4
-3.
Mar
ket-
Lev
el I
mpa
cts
of t
he R
einf
orce
d P
last
ic C
ompo
site
s N
ESH
AP
Reg
ulat
ory
Alt
erna
tive
s: 1
997
(con
tinu
ed)
Bas
elin
e
MA
CT
Flo
or
Rec
omm
ende
d A
lter
nati
ve
Abo
ve-t
he-M
AC
T-F
loor
Abs
olut
e C
hang
e R
elat
ive
Cha
nge
Abs
olut
e C
hang
e R
elat
ive
Cha
nge
Abs
olut
e C
hang
e R
elat
ive
Cha
nge
Cor
rosi
on-R
esis
tant
–23.
42%
–32.
89%
–16.
08%
–22.
72%
–13.
82%
37
.1
$0.2
13
$0.1
66
$0.1
96
$0.2
20
$0.2
31
–8.4
2 –1
9.40
10
.98
–1.9
4 –4
.22
2.29
–11.
27
–26.
48
15.2
1
–4.9
0 –7
.02
2.12
–40.
25
–77.
36
1.63
%
–0.8
3%
–4.7
9%
1.63
%
0.16
%
–0.0
8%
–0.7
1%
0.16
%
0.50
%
–0.2
6%
–1.7
4%
0.50
%
0.34
%
–0.1
8%
–1.0
7%
0.34
%
0.72
%
–0.3
7%
–1.7
0%
0.73
%4.
92
$0.0
61
$0.0
05
$0.0
17
$0.0
12
$0.0
25
3.17
0.07
1.14
0.13
–2.6
1 –5
.78
–0.0
5 –0
.13
–0.8
8 –2
.03
–0.1
0 –0
.23
–4.5
9 –9
.51
1.63
%
0.16
%
0.50
%
0.34
%
1.63
%
–0.8
3%
–4.7
9%
0.16
%
–0.0
8%
–0.7
1%
0.50
%
–0.2
6%
–1.7
4%
0.34
%
–0.1
8%
–1.0
7%
0.72
%
–0.3
7%
–1.7
0%
0.73
%67
7.6
4.92
$0.0
61
$0.0
05
$0.0
17
$0.0
12
$0.0
25
–5.7
8 3.
17
–0.1
3 0.
07
–2.0
3 1.
14
–0.2
3 0.
13
–9.5
1
–2.6
1
–0.0
5
–0.8
8
–0.1
0
–4.5
9
$3.7
7
$3.2
9
$3.4
4
$3.4
1
$3.4
8
120.
6 19
4.6
45.2
116.
6 22
6.8
21.3
36
.9
559.
9
315.
2
63.3
343.
4
58.3
1237
.5
18
The
rmos
ets/
The
rmop
last
ics
(Ind
irec
tly
Aff
ecte
d)
The
rmos
ets/
The
rmop
last
ics
(Ind
irec
tly
Aff
ecte
d)
The
rmos
ets/
The
rmop
last
ics
(Ind
irec
tly
Aff
ecte
d)
The
rmos
ets/
The
rmop
last
ics
(Ind
irec
tly
Aff
ecte
d)
The
rmos
ets/
The
rmop
last
ics
(Ind
irec
tly
Aff
ecte
d)
The
rmos
ets
(Dir
ectl
y A
ffec
ted)
The
rmos
ets
(Dir
ectl
y A
ffec
ted)
The
rmos
ets
(Dir
ectl
y A
ffec
ted)
The
rmos
ets
(Dir
ectl
y A
ffec
ted)
The
rmos
ets
(Dir
ectl
y A
ffec
ted)
Mar
ket Q
uant
ity
(Mil
lion
s lb
s/yr
)
Mar
ket Q
uant
ity
(Mil
lion
s lb
s/yr
)
Mar
ket Q
uant
ity
(Mil
lion
s lb
s/yr
)
Mar
ket Q
uant
ity
(Mil
lion
s lb
s/yr
)
Mar
ket Q
uant
ity
(Mil
lion
s lb
s/yr
)
Mar
ket P
rice
(pe
r lb
)
Mar
ket P
rice
(pe
r lb
)
Mar
ket P
rice
(pe
r lb
)
Mar
ket P
rice
(pe
r lb
)
Mar
ket P
rice
(pe
r lb
)
Lan
d T
rans
port
atio
n
Ele
ctri
cal/E
lect
ric
Mis
cella
neou
s
Tot
al
4-14
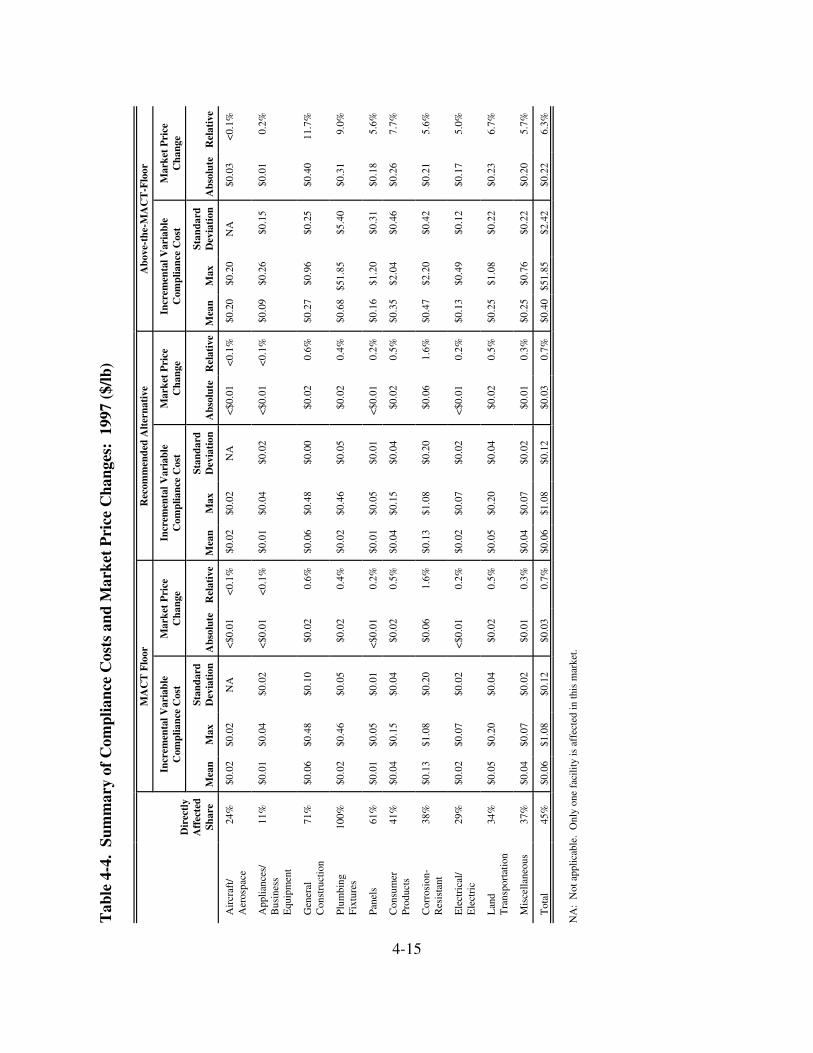
Tab
le 4
-4.
Sum
mar
y of
Com
plia
nce
Cos
ts a
nd M
arke
t P
rice
Cha
nges
: 19
97 (
$/lb
)
Dir
ectl
y A
ffec
ted
Shar
e
MA
CT
Flo
or
Rec
omm
ende
d A
lter
nati
ve
Abo
ve-t
he-M
AC
T-F
loor
Incr
emen
tal V
aria
ble
Com
plia
nce
Cos
t M
arke
t P
rice
C
hang
e In
crem
enta
l Var
iabl
e C
ompl
ianc
e C
ost
Mar
ket
Pri
ce
Cha
nge
Incr
emen
tal V
aria
ble
Com
plia
nce
Cos
t M
arke
t P
rice
C
hang
e
Mea
n M
ax
Stan
dard
D
evia
tion
A
bsol
ute
Rel
ativ
e M
ean
Max
St
anda
rd
Dev
iati
on
Abs
olut
e R
elat
ive
Mea
n M
ax
Stan
dard
D
evia
tion
A
bsol
ute
Rel
ativ
e
Air
craf
t/ 24
%
$0.0
2 $0
.02
NA
<
$0.0
1 <
0.1%
$0
.02
$0.0
2 N
A
<$0
.01
<0.
1%
$0.2
0 $0
.20
NA
$0
.03
<0.
1%
Aer
ospa
ce
App
lianc
es/
11%
$0
.01
$0.0
4 $0
.02
<$0
.01
<0.
1%
$0.0
1 $0
.04
$0.0
2 <
$0.0
1 <
0.1%
$0
.09
$0.2
6 $0
.15
$0.0
1 0.
2%
Bus
ines
sE
quip
men
t
Gen
eral
71
%
$0.0
6 $0
.48
$0.1
0 $0
.02
0.6%
$0
.06
$0.4
8 $0
.00
$0.0
2 0.
6%
$0.2
7 $0
.96
$0.2
5 $0
.40
11.7
%
Con
stru
ctio
n
Plum
bing
10
0%
$0.0
2 $0
.46
$0.0
5 $0
.02
0.4%
$0
.02
$0.4
6 $0
.05
$0.0
2 0.
4%
$0.6
8 $5
1.85
$5
.40
$0.3
1 9.
0%
Fixt
ures
Pane
ls
61%
$0
.01
$0.0
5 $0
.01
<$0
.01
0.2%
$0
.01
$0.0
5 $0
.01
<$0
.01
0.2%
$0
.16
$1.2
0 $0
.31
$0.1
8 5.
6%
Con
sum
er
41%
$0
.04
$0.1
5 $0
.04
$0.0
2 0.
5%
$0.0
4 $0
.15
$0.0
4 $0
.02
0.5%
$0
.35
$2.0
4 $0
.46
$0.2
6 7.
7%
Prod
ucts
Cor
rosi
on-
38%
$0
.13
$1.0
8 $0
.20
$0.0
6 1.
6%
$0.1
3 $1
.08
$0.2
0 $0
.06
1.6%
$0
.47
$2.2
0 $0
.42
$0.2
1 5.
6%
Res
ista
nt
Ele
ctri
cal/
29%
$0
.02
$0.0
7 $0
.02
<$0
.01
0.2%
$0
.02
$0.0
7 $0
.02
<$0
.01
0.2%
$0
.13
$0.4
9 $0
.12
$0.1
7 5.
0%
Ele
ctri
c
Lan
d 34
%
$0.0
5 $0
.20
$0.0
4 $0
.02
0.5%
$0
.05
$0.2
0 $0
.04
$0.0
2 0.
5%
$0.2
5 $1
.08
$0.2
2 $0
.23
6.7%
T
rans
port
atio
n
Mis
cella
neou
s 37
%
$0.0
4 $0
.07
$0.0
2 $0
.01
0.3%
$0
.04
$0.0
7 $0
.02
$0.0
1
$0.0
3
0.3%
$0
.25
$0.7
6 $0
.22
$0.2
0 5.
7%
Tot
al
45%
$0
.06
$1.0
8 $0
.12
$0.0
3 0.
7%
$0.0
6 $1
.08
$0.1
2 0.
7%
$0.4
0 $5
1.85
$2
.42
$0.2
2 6.
3%
NA
: N
ot a
pplic
able
. O
nly
one
faci
lity
is a
ffec
ted
in th
is m
arke
t.
4-15

As shown in Table 4-4, the smaller price changes occur in markets where the share of affected supply is small (i.e., less than 25 percent). Finally, the number and distribution of projected closures also influences the size of the market price increases. If facilities that are projected to close account for significant shares of baseline market production, we would expect to see higher price increases (all else equal).
A review of the results under the recommended alternative shows the projected market impacts in the corrosion resistant market are consistent with our expectations. First, the facilities in this market have higher average per-unit variable compliance costs, i.e., $0.13 per pound compared to industry average of $0.06 per pound. Second, the market share of affected products is low (38 percent compared to an industry average of 45 percent). As a result, affected producers in this market face more competition from unaffected sources which limits their ability to pass on costs to consumers. It follows that the model projects 48 potential product line closures in the corrosion resistant market (54% of total projection of 89). These lines accounted for approximately 2 percent of total baseline market output and are produced at 33 facilities nationwide.
The other regulatory alternatives have similar directional effects on price and quantity (i.e., higher price, declines in output). The expected price and quantity adjustments under the recommended and MACT floor alternatives are very similar because most of these facilities do not require the above-the-floor controls under the recommended alternative. However, subjecting all facilities to the above-the-MACT floor alternative is projected to heighten the increase in RPC market prices (i.e., 6.3 percent increase vs. 0.7 percent under the recommended alternative) and the decline in market quantity (i.e., 3.3 percent decline vs. 0.4 percent under the recommended alternative). Furthermore, the above-the-MACT floor alternative shows greater displacement of market production with affected producers reducing output by 13.8 percent as opposed to the 1.7 percent decline projected under the recommended alternative.
4.5.2 Industry-Level Impacts
Industry revenues, costs, and profitability change as RPC prices and production levels adjust to the imposition of the regulation. As a result of these changes, we project a net increase in RPC industry pre-tax earnings by $12 million (see Table 4-5) under the recommended alternative because the gains of the unregulated resin producers (totaling $18 million) outweigh the losses of the regulated producers (totalling $6 million). In addition, 36 facilities and 89 product lines are projected to prematurely close due to the rule with losses in employment totaling 1,297 employees. The net loss in employment would be 1,075 as unaffected producers hire additional workers. The less stringent MACT floor alternative projects similar results, while the economic impacts of the more stringent alternative are significantly higher. The following
4-16
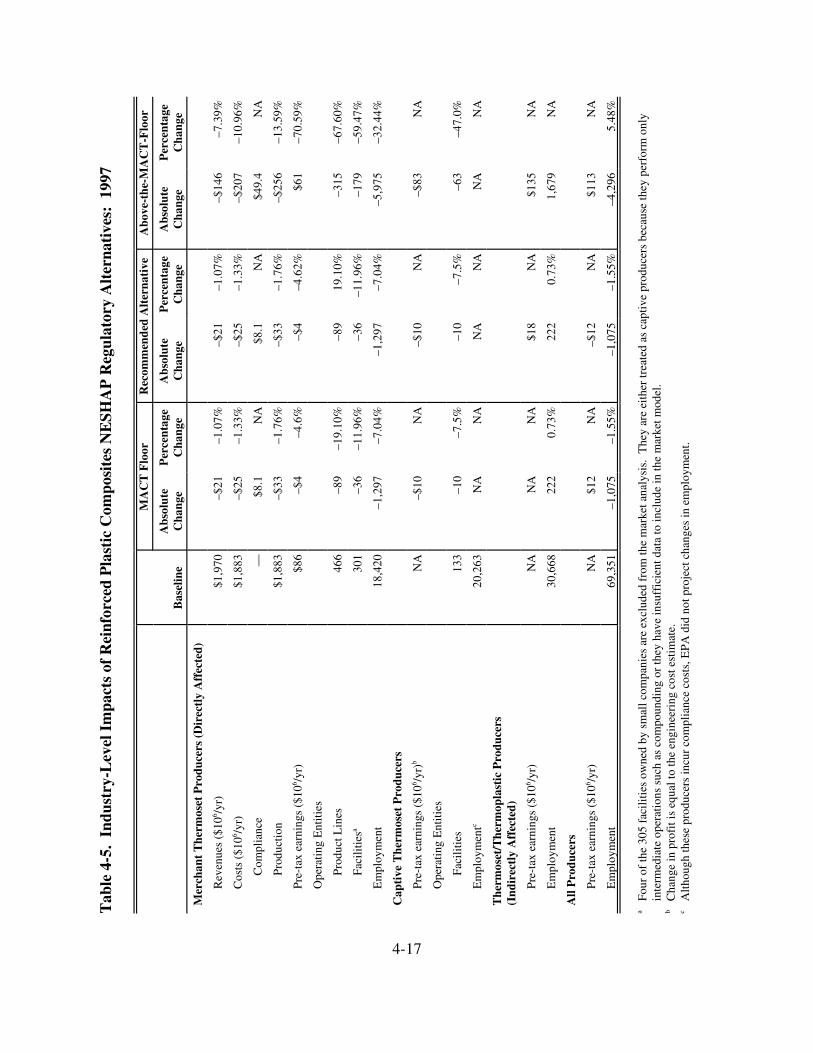
NA
NA
NA
–7.3
9%
–10.
96%
NA
–13.
59%
–70.
59%
–67.
60%
–59.
47%
–32.
44%
NA
–47.
0%
NA
5.48
%
Tab
le 4
-5.
Indu
stry
-Lev
el I
mpa
cts
of R
einf
orce
d P
last
ic C
ompo
site
s N
ESH
AP
Reg
ulat
ory
Alt
erna
tive
s: 1
997
Bas
elin
e
MA
CT
Flo
or
Rec
omm
ende
d A
lter
nati
ve
Abo
ve-t
he-M
AC
T-F
loor
Abs
olut
e C
hang
e P
erce
ntag
e C
hang
e A
bsol
ute
Cha
nge
Per
cent
age
Cha
nge
Abs
olut
e C
hang
e P
erce
ntag
e C
hang
e
Mer
chan
t T
herm
oset
Pro
duce
rs (
Dir
ectl
y A
ffec
ted)
The
y ar
e ei
ther
trea
ted
as c
apti
ve p
rodu
cers
bec
ause
they
per
form
onl
y
–4,2
96
–$14
6
–$20
7
$49.
4
–$25
6
$61
–315
–179
–5,9
75
–63
NA
$135
1,67
9
$113
–$83
NA
NA
NA
–1.0
7%
–1.3
3%
–1.7
6%
–4.6
2%
19.1
0%
–11.
96%
–7.0
4%
NA
–7.5
%
NA
0.73
%
–1.5
5%–1
,075
–$21
–$25
$8.1
–$33
–$4
–89
–36
–1,2
97
–10
NA
$18
222
–$12
–$10
inte
rmed
iate
ope
rati
ons
such
as
com
poun
ding
or
they
hav
e in
suff
icie
nt d
ata
to in
clud
e in
the
mar
ket m
odel
.
NA
NA
NA
–1.0
7%
–1.3
3%
–1.7
6%
–4.6
%
–19.
10%
–11.
96%
–7.0
4%
NA
–7.5
%
NA
0.73
%
–1.5
5%
Alt
houg
h th
ese
prod
ucer
s in
cur
com
plia
nce
cost
s, E
PA
did
not
pro
ject
cha
nges
in e
mpl
oym
ent.
Fou
r of
the
305
faci
liti
es o
wne
d by
sm
all c
ompa
nies
are
exc
lude
d fr
om th
e m
arke
t ana
lysi
s.
69,3
51
–1,0
75
NA
–$21
–$25
$8.1
–$33
–$4
–89
–36
–1,2
97
–10
NA
222
$12
–$10
—
133
NA
NA
$1,9
70
$1,8
83
$1,8
83
$86
466
301
18,4
20
NA
30,6
68
20,2
63
Cha
nge
in p
rofi
t is
equa
l to
the
engi
neer
ing
cost
est
imat
e.
The
rmos
et/T
herm
opla
stic
Pro
duce
rs
(Ind
irec
tly
Aff
ecte
d)
Cap
tive
The
rmos
et P
rodu
cers
Pre
-tax
ear
ning
s ($
106 /y
r)b
Pre
-tax
ear
ning
s ($
106 /y
r)
Pre
-tax
ear
ning
s ($
106 /y
r)
Pre
-tax
ear
ning
s ($
106 /y
r)
Rev
enue
s ($
106 /y
r)
Ope
rati
ng E
ntit
ies
Ope
rati
ng E
ntit
ies
Pro
duct
Lin
es
Cos
ts (
$106 /y
r)
Com
plia
nce
Pro
duct
ion
Em
ploy
men
tc
Em
ploy
men
t
Em
ploy
men
t
Em
ploy
men
t
Fac
ilit
iesa
Fac
ilit
ies
All
Pro
duce
rs
a b c
4-17

sections discuss these industry-level impacts in detail with additional emphasis on the rule’s distributional impacts.
4.5.2.1 Changes in Pre-Tax Earnings
The projected change in pre-tax earnings is the net result of changes for directly and indirectly affected merchant facilities plus changes for directly affected captive facilities. After accounting for market adjustments, the directly affected merchant producers are expected to incur $8.1 million annually in regulatory compliance costs. As shown in Table 4-5, based on projected individual and market responses, the economic analysis estimates the net effect of revenue and cost changes for these producers to result in a increase in pre-tax earnings of $4 million per year. This net gain results from increased revenues associated with their gain in market share and the higher prices associated with the regulation. Indirectly affected producers also see increases in pre-tax earning of $18 million per year. Given the Agency’s inability to predict higher prices for captive producer end products and, thus, shift costs to their ultimate consumers, we assume captive producer profits decline by the aggregate engineering estimate of compliance costs ($10 million).
We emphasize the projected $4 million increase in for directly affected merchant producers does not suggest all of these thermoset producers will benefit with the regulation. To the contrary, the economic analysis shows the regulation creates both gainers and losers within
the directly affected merchant segment. As shown in Table 4-6, a substantial subset of the merchant facilities are projected to experience profit increases under the recommended alternative (i.e., 111 facilities representing 37 percent of the sector total of 301 facilities). Their gain in pre-tax earnings is projected to be $10 million annually. However, the majority of directly affected merchant facilities (i.e., 154 facilities, or 51 percent of the sector total) are projected to experience pre-tax earnings losses of $5 million per year. The remaining 36 facilities are projected to cease operations and, thus, forego $1 million in baseline pre-tax earnings.
Based on this distributional analysis, EPA concludes the directly affected merchant facilities with profit gains will tend to have higher output rates (average of 3.6 million pounds per facility) and lower per-unit compliance costs (<$0.01 per pound) than the negatively affected facilities. Facilities that experience profit losses or shutdown are generally lower-volume facilities (average of 0.8 million pounds per year) and have higher per-unit compliance costs (average ranging from $0.05 to $0.33 per pound).
4-18

$61
Tab
le 4
-6.
Dis
trib
utio
nal I
mpa
cts
on M
erch
ant
The
rmos
et P
rodu
cers
Ass
ocia
ted
wit
h R
einf
orce
d P
last
ic
Com
posi
tes
NE
SHA
P R
egul
ator
y A
lter
nati
ves:
199
7
MA
CT
Flo
or
Rec
omm
ende
d A
lter
nati
ve
Abo
ve-t
he-M
AC
T-F
loor
Mor
e P
rofi
tabl
e L
ess
Pro
fita
ble
Clo
sure
T
otal
M
ore
Pro
fita
ble
Les
s P
rofi
tabl
e C
losu
re
Tot
al
Mor
e P
rofi
tabl
e L
ess
Pro
fita
ble
Clo
sure
T
otal
$134
.2
$0.2
40
–5,9
75
The
y ar
e ei
ther
trea
ted
as c
apti
ve p
rodu
cers
bec
ause
they
per
form
79.4
$79.
11
$0.9
96
–6,0
06
179
0.4
–$12
71.2
$23.
99
$0.3
37
–156
34
2.1
–$6
187
409.
3
$31.
14
$0.0
76
88
4.7
$79
only
inte
rmed
iate
ope
rati
ons
such
as
com
poun
ding
or
they
hav
e in
suff
icie
nt d
ata
to in
clud
e in
the
mar
ket m
odel
.
560
$11.
3
$0.0
20
–1,2
97
301
1.9 $4
Mor
e pr
ofit
able
—in
clud
es f
acil
itie
s w
ith
high
er p
re-t
ax e
arni
ngs
wit
h th
e re
gula
tory
alt
erna
tive
s.
Les
s pr
ofit
able
—in
clud
es f
acil
itie
s w
ith
low
er p
re-t
ax e
arni
ngs
wit
h th
e re
gula
tory
alt
erna
tive
s.
Clo
sure
—in
clud
es f
acili
ties
that
wou
ld c
ease
pro
duct
ion
wit
h th
e re
gula
tory
alt
erna
tive
s.
5.1
$1.6
7
$0.3
27
–999
36
0.1
–$1
Fou
r of
the
305
faci
liti
es o
wne
d by
sm
all c
ompa
nies
are
exc
lude
d fr
om th
e m
arke
t ana
lysi
s.
152
$8.1
2
$0.0
53
–338
154 1
–$5
39
402.
8
$1.5
2
$0.0
04
111
3.6
$10
560
1.9
$11.
3
$0.0
20
–1,2
97
301 $4
5.1
$1.6
7
$0.3
27
–999
36
0.1
–$1
152 1
$8.1
2
$0.0
53
–338
154
–$5
39C
hang
e in
E
mpl
oym
ent
402.
8 (1
06 lbs/
yr)
3.6
(lbs
/fac
ilit
y)
$1.5
2 ($
106 /y
r)
$0.0
04
($/l
b)
111
$10
($10
6 /yr)
Com
plia
nce
Cos
ts
Ave
rage
Ave
rage
Pro
duct
ion
Cha
nge
in
Fac
ilit
iesa
Tot
al
Tot
al
earn
ings
P
re-t
ax
Not
es:
a
4-19
301
560
1.9

The other important distributional impact of the rule that merits discussion is the unambiguous benefits unregulated resin producers experience at the expense of affected merchant producers and consumers of RPC products. As shown in Table 4-5, these unaffected merchant producers, mainly thermoplastic producers, increase their production in response to the higher market prices and, thereby, experience gains in pre-tax earnings of $18 million per year.
As with the market-level results, there is little difference in the industry-level profitability and the distribution of profit changes between the recommended and less stringent MACT floor alternative. However, the same conclusion cannot be drawn when examining the above-the-MACT floor alternative. Seventy-one percent of the affected merchant producers become less profitable or close (profit losses of $18 million), and estimates of captive producer profit losses increase to $83 million. Only 29 percent of the affected merchant producers become more profitable ($79 million), while suppliers of thermoplastic RPCs experience a large increase in profits ($135 million) because they benefit from higher prices and increased output.
4.5.2.2 Product-Line and Facility-Level Impacts
In the face of higher production costs, some facilities may find that their best economic response is to prematurely close the facility (presumably every current production facility will eventually close as new technologies replace old and current methods become economically unviable). Such a choice is optimal with regulation conditions when the facilities’ projected revenues fall short of their variable costs (production and compliance). Using the approaches described in detail below, the recommended and MACT floor may result in 89 merchant product line closures, 36 merchant facility closures, and 10 captive facility closures. This number increases dramatically with the Above-the-MACT floor—315 merchant product lines, 179 merchant facilities, and 63 captive facilities may cease operations under this alternative.
It is important to point out that these estimates of facility and product-line closures are sensitive to the accuracy of the baseline characterization of these entities. These impact estimates should be considered and upper-bound estimate because the facilities may not cease operations for various reasons. For example, facility operators may believe that market demand conditions may change and allow the facility to become profitable in the future. In addition, the terms of contractual agreements for independent suppliers may require them to continue operations or may allow the supplier to pass on a greater portion of these additional costs than the market model projects. Our model does not explicitly account for these factors.
Merchant Producer Analysis. In the economic model, we limit the assessment of potential for closures to small merchant producers after accounting for the behavioral responses of producers and consumers to changing equilibrium conditions. Under the recommended
4-20
alternative, 36 merchant facilities are projected to close, or 12 percent of the total directly affected merchant facilities. As shown in Table 4-6, facilities expected to close have extremely low baseline output rates (average of 0.1 million pounds per facility) and significantly higher per-unit compliance costs ($0.33 per pound).
As noted above, 36 facilities cease all of their product line operations in response to the regulation. These facilities account for 62 of the 89 product line closures projected by the economic model (70 percent). However, a less severe response is also available to producers with multiple production lines: close lines that are expected to be unprofitable with the regulation. We project 23 facilities choose this option and close 27 unprofitable lines (30 percent). The product lines most affected by the regulation are the manual and mechanical resin applications because these processes typically have higher compliance costs. Over ninety percent of the product line closures employ these processes.
The number of projected closures does not decrease under the less stringent MACT floor alternative. However, the projected closures increase significantly under the above-the floor alternative. The number of facility closures is nearly 5 times higher (179 facilities or 60 percent of the total, and the number of product line closures more than triples to 315 (68 percent of the total).
Captive Producer Analysis. The Agency also developed a method of identifying captive plant closure decisions using industry measures of profitability. The approach assumes affected captive producers have very limited choices and cannot adjust production rates in response to higher production costs. They fully absorb these costs resulting in a one-to-one reduction in profits.2 If the additional compliance costs associated with the rule exceed the plants pre-tax earnings, the captive producer is expected to cease their operations. If producers were unable to pass forward increased costs to final product producers (and therefore their customers), then this approach offers a tractable way to provide closure estimates for the 30 percent of the affected RPC facilities considered captive in our analysis. Using this method, we conclude that 10 captive facilities would be potentially at risk of closure under the recommended and MACT floor alternatives. This number increases to 63 facilities under the Above-the-MACT floor alternative.
2 The Agency also consider a less restrictive assumption by allowing total revenue to vary based on partial-cost pass through and the associated demand response. These analyses did not significantly vary from the full cost absorption conclusions.
4-21
4.5.2.3 Changes in Employment
In response to the decreased levels of output, aggregate employment in the merchant segment of the RPC industry is projected to decrease by 1.6 percent, or 1,075 employees, under the recommended alternative. This is the net result of employment losses for merchant thermoset producers (1,297 employees) and employment gains for unaffected (i.e., thermoplastic) producers (222 employees). Although captive producers incur compliance costs that will likely influence levels of employment, EPA did not attempt to project changes in employment for these facilities. Employment changes for the MACT floor alternative are identical (1,075 employees, or 1.6 percent) but are four times higher under the more stringent above-the-floor alternative (4,296 employees, or 6.0 percent).
4.6 Social Costs
The value of a regulatory action is traditionally measured by the change in economic welfare that it generates. Welfare impacts, or the social costs required to achieve the environmental improvements, resulting from this regulatory action will extend to the many consumers and producers of RPC products. Consumers will experience welfare impacts due to changes in market prices and consumption levels associated with imposition of the regulation. Producers will experience welfare impacts resulting from changes in their revenues associated with imposition of the regulation and the corresponding changes in production and market prices. However, it is important to emphasize that this measure does not include benefits that occur outside the market, that is, the value of reduced levels of air pollution with the regulation.
For this analysis, based on applied welfare economics principles, social costs as described above are measured as the sum of the expected changes in consumer and producer surplus (see Appendix B for a more complete discussion). Consumers experience reductions in consumer surplus because of increased market prices. Producers may experience either increases or decreases in producer surplus (i.e., profits) as a result of increased market prices and changes in production and compliance costs.
The national estimate of compliance costs is often used as an approximation of the social cost of the rule. Under the recommended alternative, the engineering analysis estimated annual costs of $21.5 million. However, this estimate does not account for behavioral responses by producers or consumers to imposition of the regulation (e.g., shifting costs to other economic agents, shutting down product lines or facilities). Accounting for these responses results in a social cost estimate that differs from the engineering estimate as well as provides insights on how the regulatory burden is distributed across society (i.e., the many consumers and producers of RPC products). Therefore, based on the market analysis described above, the annual social
4-22
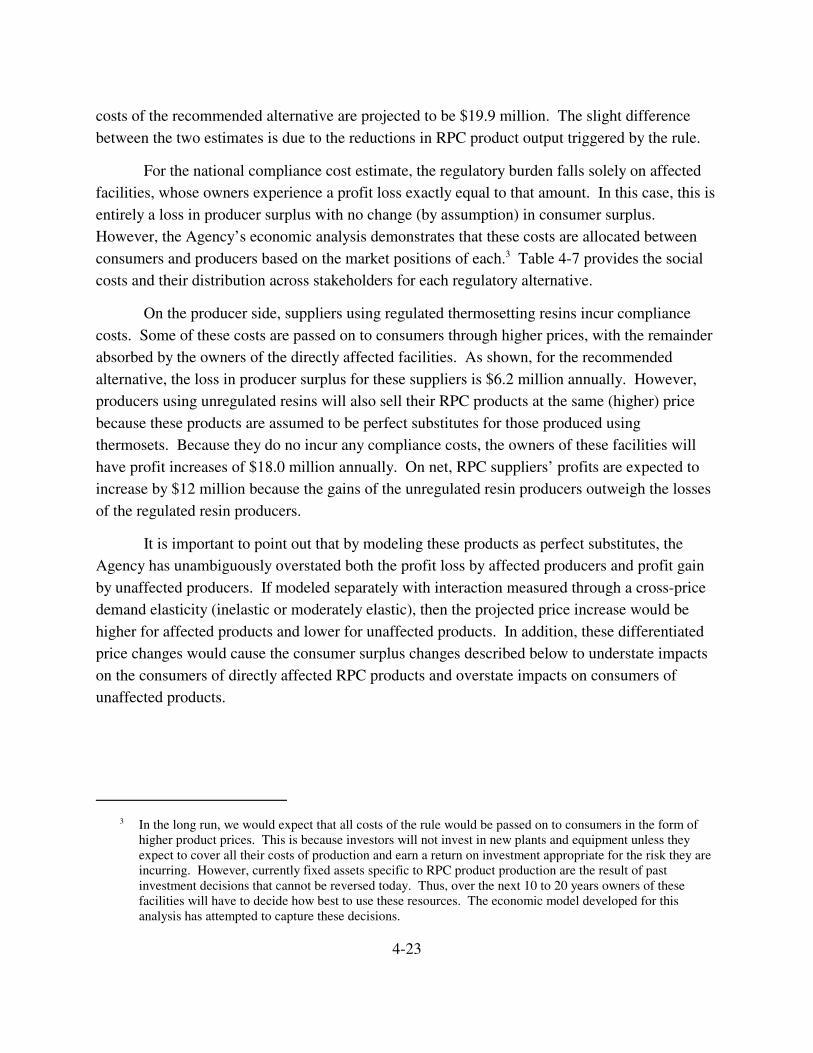
costs of the recommended alternative are projected to be $19.9 million. The slight difference between the two estimates is due to the reductions in RPC product output triggered by the rule.
For the national compliance cost estimate, the regulatory burden falls solely on affected facilities, whose owners experience a profit loss exactly equal to that amount. In this case, this is entirely a loss in producer surplus with no change (by assumption) in consumer surplus. However, the Agency’s economic analysis demonstrates that these costs are allocated between consumers and producers based on the market positions of each.3 Table 4-7 provides the social costs and their distribution across stakeholders for each regulatory alternative.
On the producer side, suppliers using regulated thermosetting resins incur compliance costs. Some of these costs are passed on to consumers through higher prices, with the remainder absorbed by the owners of the directly affected facilities. As shown, for the recommended alternative, the loss in producer surplus for these suppliers is $6.2 million annually. However, producers using unregulated resins will also sell their RPC products at the same (higher) price because these products are assumed to be perfect substitutes for those produced using thermosets. Because they do no incur any compliance costs, the owners of these facilities will have profit increases of $18.0 million annually. On net, RPC suppliers’ profits are expected to increase by $12 million because the gains of the unregulated resin producers outweigh the losses of the regulated resin producers.
It is important to point out that by modeling these products as perfect substitutes, the Agency has unambiguously overstated both the profit loss by affected producers and profit gain by unaffected producers. If modeled separately with interaction measured through a cross-price demand elasticity (inelastic or moderately elastic), then the projected price increase would be higher for affected products and lower for unaffected products. In addition, these differentiated price changes would cause the consumer surplus changes described below to understate impacts on the consumers of directly affected RPC products and overstate impacts on consumers of unaffected products.
3 In the long run, we would expect that all costs of the rule would be passed on to consumers in the form of higher product prices. This is because investors will not invest in new plants and equipment unless they expect to cover all their costs of production and earn a return on investment appropriate for the risk they are incurring. However, currently fixed assets specific to RPC product production are the result of past investment decisions that cannot be reversed today. Thus, over the next 10 to 20 years owners of these facilities will have to decide how best to use these resources. The economic model developed for this analysis has attempted to capture these decisions.
4-23
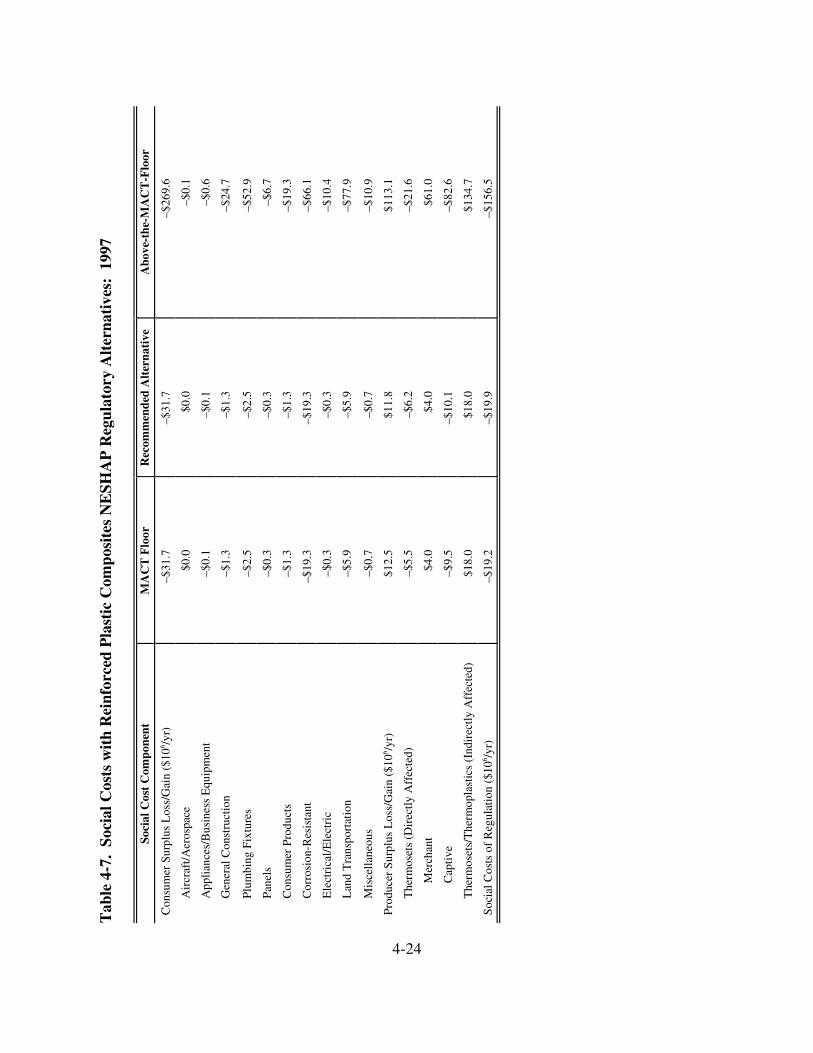
MA
CT
Flo
or
Rec
omm
ende
d A
lter
nati
ve
Abo
ve-t
he-M
AC
T-F
loor
–$19
.2
–$19
.9
–$15
6.5
–$26
9.6
–$0.
1
–$0.
6
–$24
.7
–$52
.9
–$6.
7
–$19
.3
–$66
.1
–$10
.4
–$77
.9
–$10
.9
$113
.1
–$21
.6
$61.
0
–$82
.6
$134
.7
Tab
le 4
-7.
Soci
al C
osts
wit
h R
einf
orce
d P
last
ic C
ompo
site
s N
ESH
AP
Reg
ulat
ory
Alt
erna
tive
s: 1
997
–$31
.7
$0.0
–$0.
1
–$1.
3
–$2.
5
–$0.
3
–$1.
3
–$19
.3
–$0.
3
–$5.
9
–$0.
7
$11.
8
–$6.
2
$4.0
–$10
.1
$18.
0
–$31
.7
$0.0
–$0.
1
–$1.
3
–$2.
5
–$0.
3
–$1.
3
–$19
.3
–$0.
3
–$5.
9
–$0.
7
$12.
5
–$5.
5
$4.0
–$9.
5
$18.
0T
herm
oset
s/T
herm
opla
stic
s (I
ndir
ectl
y A
ffec
ted)
Soci
al C
ost
Com
pone
nt
Con
sum
er S
urpl
us L
oss/
Gai
n ($
106 /y
r)
Pro
duce
r S
urpl
us L
oss/
Gai
n ($
106 /y
r)
Soc
ial C
osts
of
Reg
ulat
ion
($10
6 /yr)
App
lian
ces/
Bus
ines
s E
quip
men
t
The
rmos
ets
(Dir
ectl
y A
ffec
ted)
Gen
eral
Con
stru
ctio
n
Lan
d T
rans
port
atio
n
Cor
rosi
on-R
esis
tant
Con
sum
er P
rodu
cts
Air
craf
t/A
eros
pace
Plu
mbi
ng F
ixtu
res
Ele
ctri
cal/
Ele
ctri
c
Mis
cell
aneo
us
Mer
chan
t
Cap
tive
Pan
els
4-24

On the consumer side, welfare losses are critically dependant on consumers’ ability to find substitutes for RPC products and on the terms they can purchase those products. Because RPC products made from thermoplastics are assumed here to be perfect substitutes for those produced by the regulated entities, consumers are indifferent in their source of supply for these products, and there is a single market price for each RPC product regardless of the input used in its production. Thus, just as producers of the indirectly affected sector can be expected to gain with the rule, their customers will experience losses in economic welfare due to the higher prices for RPC products. Under the recommended alternative, the loss in consumer welfare is $31.7 million annually. Consumers of corrosion-resistant and land transportation are expected to experience the largest consumer surplus losses (see Table 4-7).
An important model parameter affecting the estimated consumer surplus losses is the elasticity of demand for the RPC products. As discussed above, the Agency believes that a value of -0.5 is warranted based on a review of the impacted factor demand elasticities. However, as shown in Figure 4-4, if demand is less (more) elastic, the consumer surplus losses estimate would be more (less).
Loss in Consumer Surplus 50
($106/yr)
40
30
20
10
0 -0.1 -0.5 -1.0 -1.5
●
●
●
●
Elasticity of Demand
Figure 4-4. Sensitivity of Changes in Consumer Surplus to the Elasticity of Demand (Elasticity of Supply = 1.0)
4-25

Thus, in returning to the social costs of the recommended alternative, it is simply
Directly affected producers –$6.2 million Indirectly affected producers +$18.0 million Consumers –$31.7 million Social cost $19.9 million
In comparison, the social costs of the MACT floor alternative are about $19.2 million, those of the above MACT floor alternative, $156.5 million.
4.7 Sensitivity Analysis for Profit Rate
The baseline profitability of producers is a key parameter in the Agency’s economic modeling. However, obtaining profit data for firms that produce reinforced plastic composites is difficult because these firms are most often privately owned and, thus, do not publish the requisite financial information. In lieu of firm-specific profit rates, the Agency applied an industry average profit rate of 4.4 percent for each facility. As applied for this analysis, this rate reflects the maximum profit rate for an individual facility, i.e., a threshold level of profitability. Those facilities whose total revenue minus production costs resulted in a return of less than 4.4 percent of revenues used the lower rate for determination of economic viability or regulation induced closure.
In 1997, the baseline year of the economic analysis, the industry average profit rate was 6.5 percent as reported for SIC 30 by the Census Bureau’s Quarterly Financial Report (QFR). This profit rate reflects income before income taxes as a share of sales for firms with less than $25 million in assets. However, this analysis must address the impacts on many firms that have less than $25 million in assets which often have lower profit rates. The pre-tax earnings for plastic companies with less than $5 million in sales was on average two-thirds of that for plastic companies with between $10 and $25 million in sales (SPI, 1998). Thus, to better reflect the profit rates for smaller companies for our analysis, the Agency used this two-thirds ratio to adjust the QFR reported industry average profit rates for firms less than $25 million in assets, i.e.,
Year Industry Average Adjusted Average 1999 4.7% 3.0% 1998 6.0% 4.0% 1997 6.5% 4.4% 1996 5.5% 3.7% 1995 5.2% 3.5%
As shown, the profitability measures range over this time period from 3 to 6.5 percent of sales. Therefore, as a sensitivity, the Agency evaluated the economic impacts for the
4-26
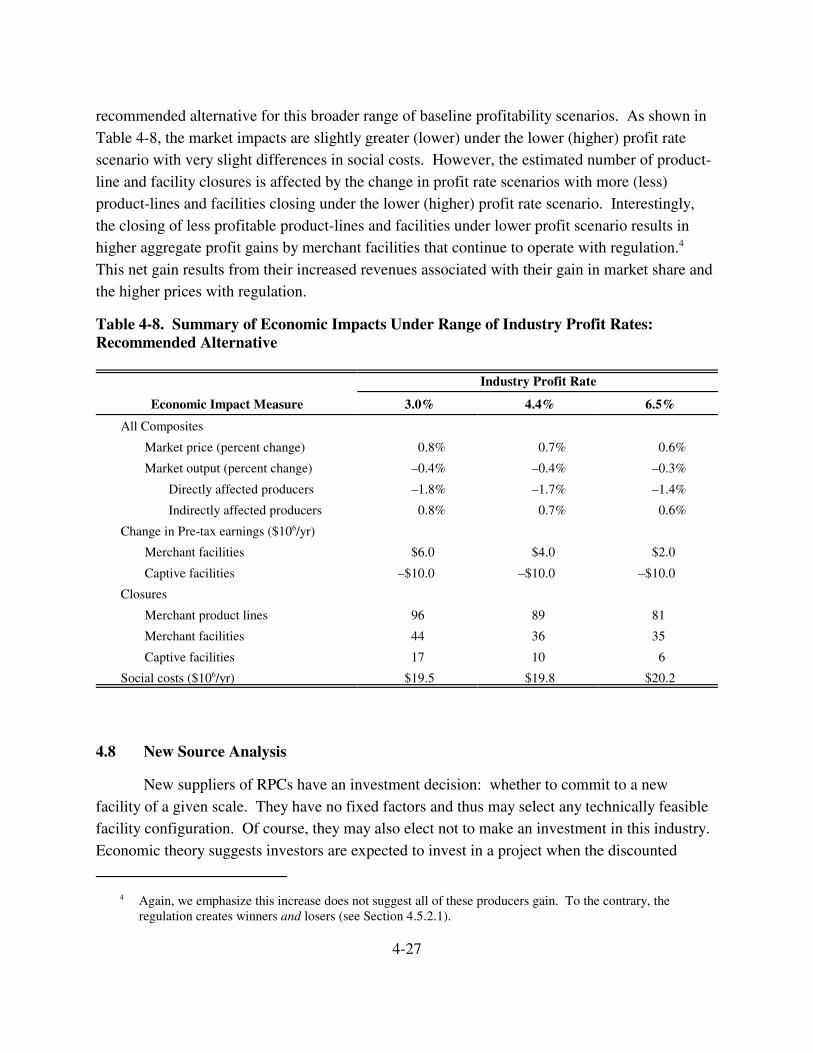
recommended alternative for this broader range of baseline profitability scenarios. As shown in Table 4-8, the market impacts are slightly greater (lower) under the lower (higher) profit rate scenario with very slight differences in social costs. However, the estimated number of product-line and facility closures is affected by the change in profit rate scenarios with more (less) product-lines and facilities closing under the lower (higher) profit rate scenario. Interestingly, the closing of less profitable product-lines and facilities under lower profit scenario results in higher aggregate profit gains by merchant facilities that continue to operate with regulation.4
This net gain results from their increased revenues associated with their gain in market share and the higher prices with regulation.
Table 4-8. Summary of Economic Impacts Under Range of Industry Profit Rates: Recommended Alternative
Industry Profit Rate
Economic Impact Measure
All Composites
Market price (percent change)
Market output (percent change)
Directly affected producers
Indirectly affected producers
Change in Pre-tax earnings ($106/yr)
Merchant facilities
Captive facilities
Closures
Merchant product lines
Merchant facilities
Captive facilities
Social costs ($106/yr)
4.8 New Source Analysis
3.0% 4.4% 6.5%
0.8% 0.7% 0.6%
–0.4% –0.4% –0.3%
–1.8% –1.7% –1.4%
0.8% 0.7% 0.6%
$6.0 $4.0 $2.0
–$10.0 –$10.0 –$10.0
96 89 81
44 36 35
17 10 6
$19.5 $19.8 $20.2
New suppliers of RPCs have an investment decision: whether to commit to a new facility of a given scale. They have no fixed factors and thus may select any technically feasible facility configuration. Of course, they may also elect not to make an investment in this industry. Economic theory suggests investors are expected to invest in a project when the discounted
4 Again, we emphasize this increase does not suggest all of these producers gain. To the contrary, the regulation creates winners and losers (see Section 4.5.2.1).
4-27
value of the expected stream of profits over the lifetime of the investment exceeds the costs of the investment, or alternatively when the internal rate of return (IRR) is greater than the opportunity cost of capital. Commodity prices and production costs are central to this decision.
The competitive model of price formation is provided in Figure 4-5. In the figure, the willingness of existing suppliers to produce alternative rates of RPCs is represented by SE and the demand for RPCs is shown as D0. The equilibrium market price, P0, is determined by the intersection of these curves. If this price exceeds the annualized capital costs discounted at the opportunity cost of capital for an investment in this risk class divided by the profit-maximizing output rate plus the unit cost of other inputs, the producer commits to a new facility; otherwise no investment occurs. Figure 4-5 shows a constant cost industry where market price is exactly equal to the unit cost of new facilities, SN.
$/lb
P0 = P1
D0
D1
SE
SN
Q0 Q1 lbs/year
Figure 4-5. Baseline Equilibrium without Regulation
In a growing industry, the demand for the commodity is shifting outward (e.g., to D1), placing upward pressure on prices and providing the incentive for investors to add new productive capacity.5 As new capacity enters the market, the new equilibrium price is P1, which is exactly equal to the unit cost of supply from new facilities. In this example, it is the same
5For simplicity, impacts are considered for one future time period.
4-28
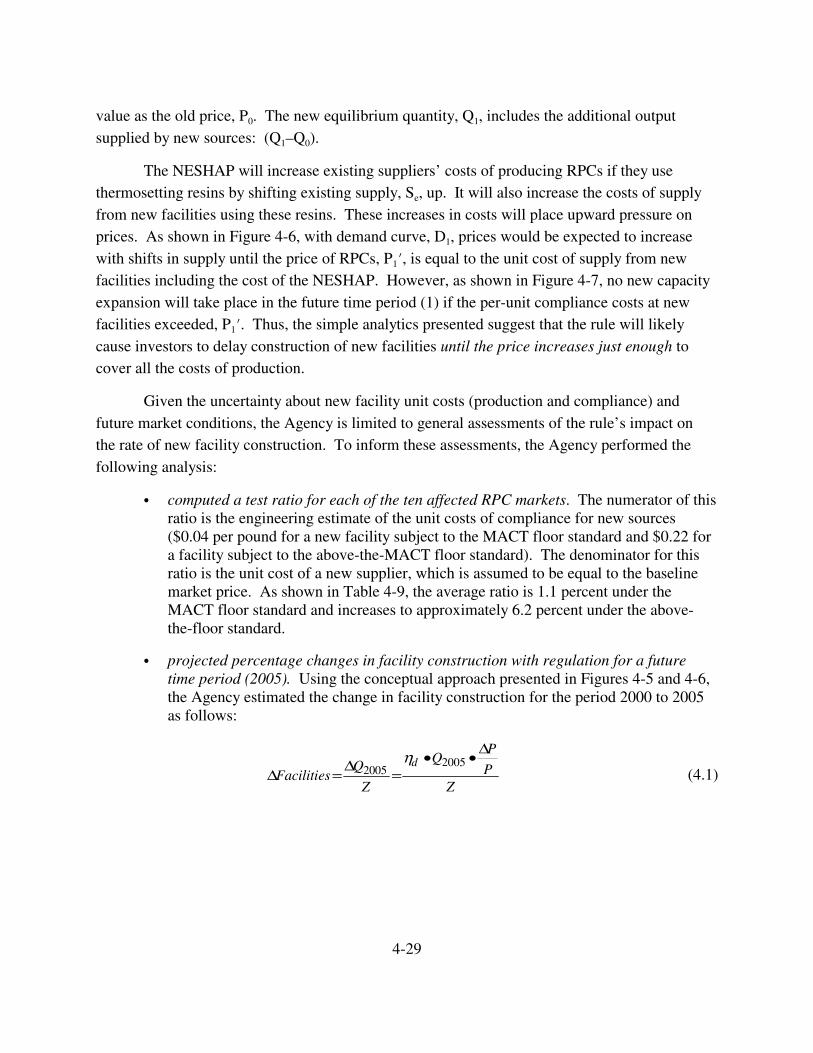
value as the old price, P0. The new equilibrium quantity, Q1
supplied by new sources: (Q1–Q0). , includes the additional output
The NESHAP will increase existing suppliers’ costs of producing RPCs if they use thermosetting resins by shifting existing supply, Se, up. It will also increase the costs of supply from new facilities using these resins. These increases in costs will place upward pressure on prices. As shown in Figure 4-6, with demand curve, D1, prices would be expected to increase with shifts in supply until the price of RPCs, P1�, is equal to the unit cost of supply from new facilities including the cost of the NESHAP. However, as shown in Figure 4-7, no new capacity expansion will take place in the future time period (1) if the per-unit compliance costs at new facilities exceeded, P1�. Thus, the simple analytics presented suggest that the rule will likely cause investors to delay construction of new facilities until the price increases just enough to cover all the costs of production.
Given the uncertainty about new facility unit costs (production and compliance) and future market conditions, the Agency is limited to general assessments of the rule’s impact on the rate of new facility construction. To inform these assessments, the Agency performed the following analysis:
� computed a test ratio for each of the ten affected RPC markets. The numerator of this ratio is the engineering estimate of the unit costs of compliance for new sources ($0.04 per pound for a new facility subject to the MACT floor standard and $0.22 for a facility subject to the above-the-MACT floor standard). The denominator for this ratio is the unit cost of a new supplier, which is assumed to be equal to the baseline market price. As shown in Table 4-9, the average ratio is 1.1 percent under the MACT floor standard and increases to approximately 6.2 percent under the above-the-floor standard.
� projected percentage changes in facility construction with regulation for a future time period (2005). Using the conceptual approach presented in Figures 4-5 and 4-6, the Agency estimated the change in facility construction for the period 2000 to 2005 as follows:
∆P
∆Facilities =∆Q2005 =
ηd •Q2005 • P (4.1)
Z Z
4-29
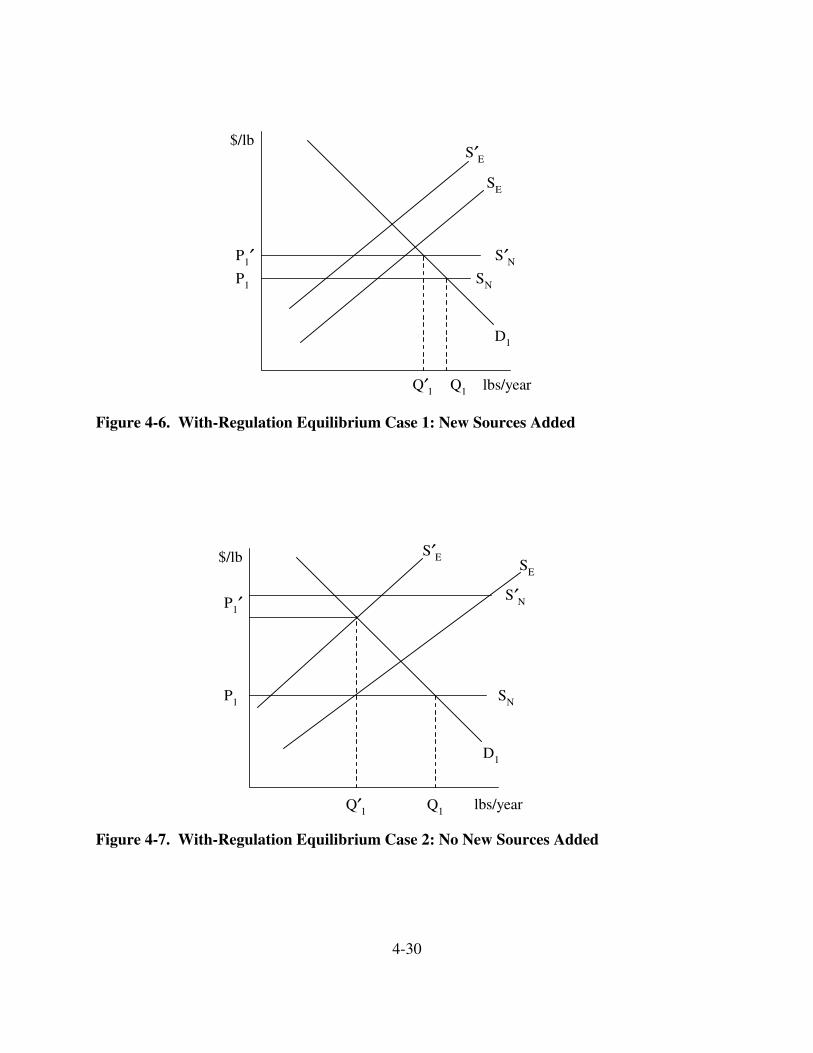
lbs/year
$/lb
Q1
P1
Q′ 1
D1
SE
SN
S′ NP1 ′
S′ E
Figure 4-6. rium Case 1: New Sources Added
lbs/year
$/lb
Q1
P1
D1
SE
SN
S′ N
Q′ 1
S′ E
P1 ′
Figure 4-7. ion Equilibrium Case 2: No New Sources Added
With-Regulation Equilib
With-Regulat
4-30
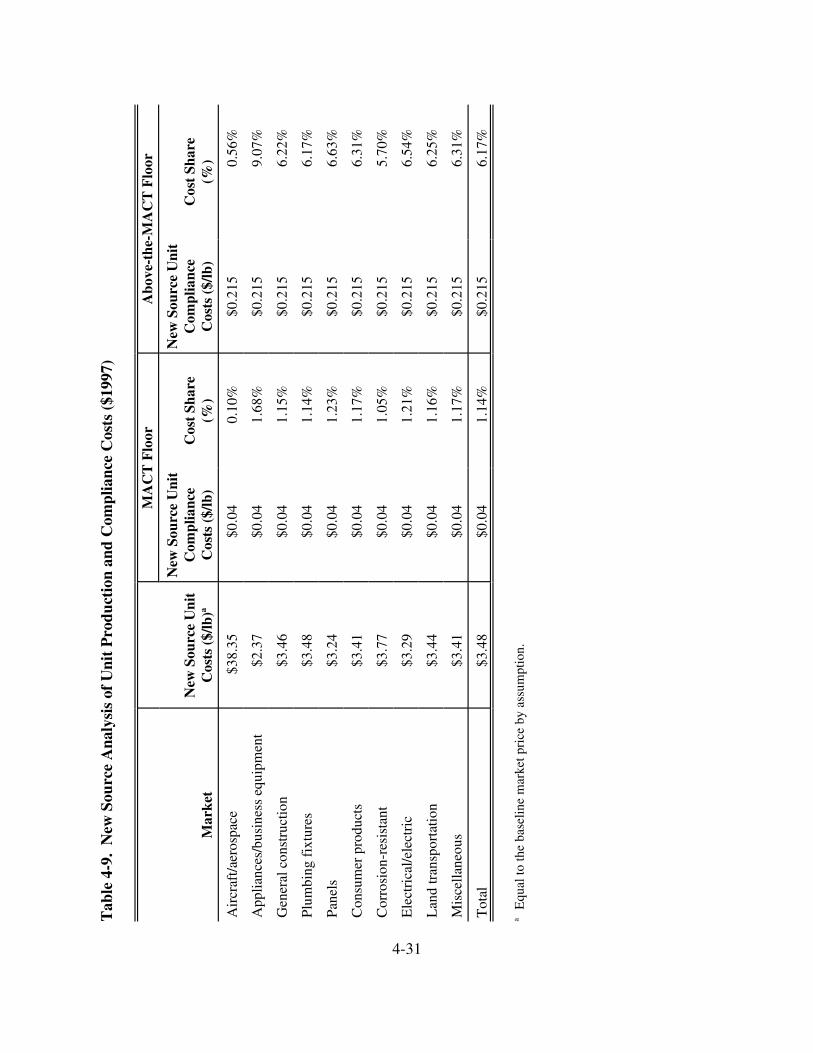
Tab
le 4
-9.
New
Sou
rce
Ana
lysi
s of
Uni
t P
rodu
ctio
n an
d C
ompl
ianc
e C
osts
($1
997)
MA
CT
Flo
or
Abo
ve-t
he-M
AC
T F
loor
New
Sou
rce
Uni
t N
ew S
ourc
e U
nit
New
Sou
rce
Uni
t C
ompl
ianc
e C
ost
Shar
e C
ompl
ianc
e C
ost
Shar
e M
arke
t C
osts
($/
lb)a
Cos
ts (
$/lb
) (%
) C
osts
($/
lb)
(%)
Air
craf
t/aer
ospa
ce
$38.
35
$0.0
4 0.
10%
$0
.215
0.
56%
App
lianc
es/b
usin
ess
equi
pmen
t $2
.37
$0.0
4 1.
68%
$0
.215
9.
07%
Gen
eral
con
stru
ctio
n $3
.46
$0.0
4 1.
15%
$0
.215
6.
22%
Plu
mbi
ng f
ixtu
res
$3.4
8 $0
.04
1.14
%
$0.2
15
6.17
%
Pan
els
$3.2
4 $0
.04
1.23
%
$0.2
15
6.63
%
Con
sum
er p
rodu
cts
$3.4
1 $0
.04
1.17
%
$0.2
15
6.31
%
Cor
rosi
on-r
esis
tant
$3
.77
$0.0
4 1.
05%
$0
.215
5.
70%
Ele
ctri
cal/e
lect
ric
$3.2
9 $0
.04
1.21
%
$0.2
15
6.54
%
Lan
d tr
ansp
orta
tion
$3.4
4 $0
.04
1.16
%
$0.2
15
6.25
%
Mis
cella
neou
s $3
.41
$0.0
4
$3.4
8 $0
.04
1.17
%
$0.2
15
$0.2
15
6.31
%
Tot
al
1.14
%
6.17
%
a E
qual
to th
e ba
selin
e m
arke
t pri
ce b
y as
sum
ptio
n.
4-31
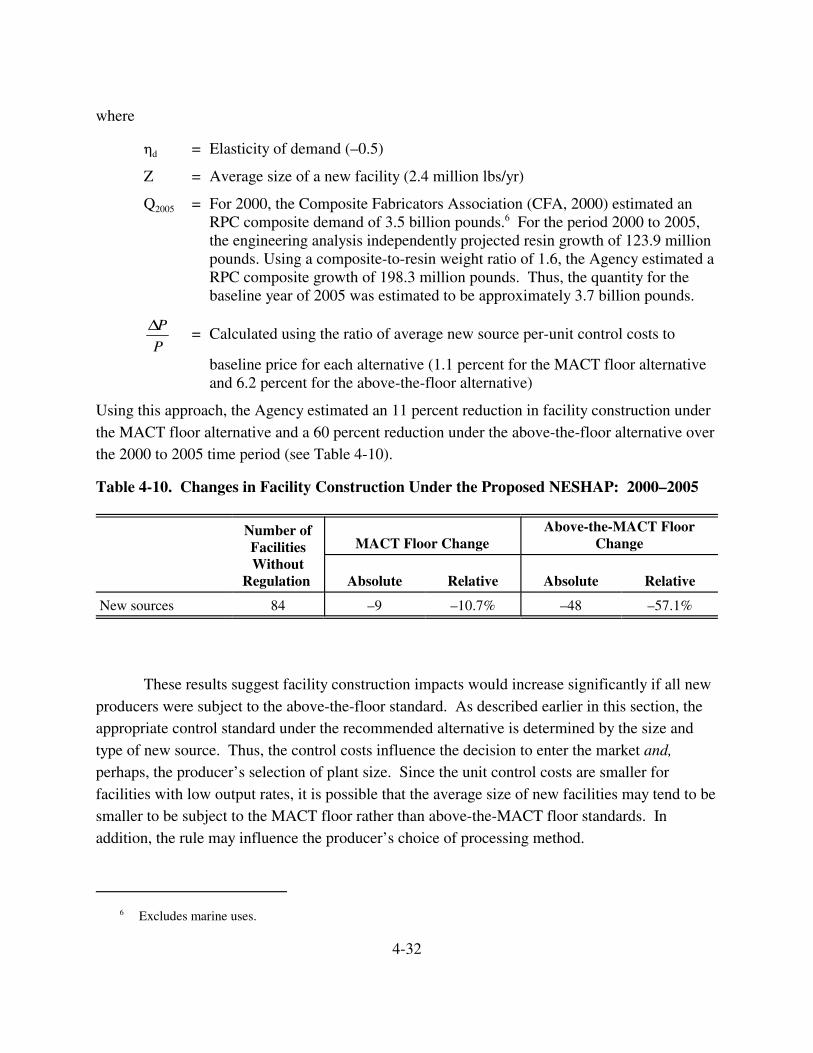
where
�d = Elasticity of demand (–0.5)
Z = Average size of a new facility (2.4 million lbs/yr)
Q2005 = For 2000, the Composite Fabricators Association (CFA, 2000) estimated an RPC composite demand of 3.5 billion pounds.6 For the period 2000 to 2005, the engineering analysis independently projected resin growth of 123.9 million pounds. Using a composite-to-resin weight ratio of 1.6, the Agency estimated a RPC composite growth of 198.3 million pounds. Thus, the quantity for the baseline year of 2005 was estimated to be approximately 3.7 billion pounds.
∆P = Calculated using the ratio of average new source per-unit control costs to
P baseline price for each alternative (1.1 percent for the MACT floor alternative and 6.2 percent for the above-the-floor alternative)
Using this approach, the Agency estimated an 11 percent reduction in facility construction under the MACT floor alternative and a 60 percent reduction under the above-the-floor alternative over the 2000 to 2005 time period (see Table 4-10).
Table 4-10. Changes in Facility Construction Under the Proposed NESHAP: 2000–2005
Number of Facilities MACT Floor Change
Above-the-MACT Floor Change
Without Regulation Absolute
–9
Relative Absolute
–48
Relative
New sources 84 –10.7% –57.1%
These results suggest facility construction impacts would increase significantly if all new producers were subject to the above-the-floor standard. As described earlier in this section, the appropriate control standard under the recommended alternative is determined by the size and type of new source. Thus, the control costs influence the decision to enter the market and, perhaps, the producer’s selection of plant size. Since the unit control costs are smaller for facilities with low output rates, it is possible that the average size of new facilities may tend to be smaller to be subject to the MACT floor rather than above-the-MACT floor standards. In addition, the rule may influence the producer’s choice of processing method.
6 Excludes marine uses.
4-32
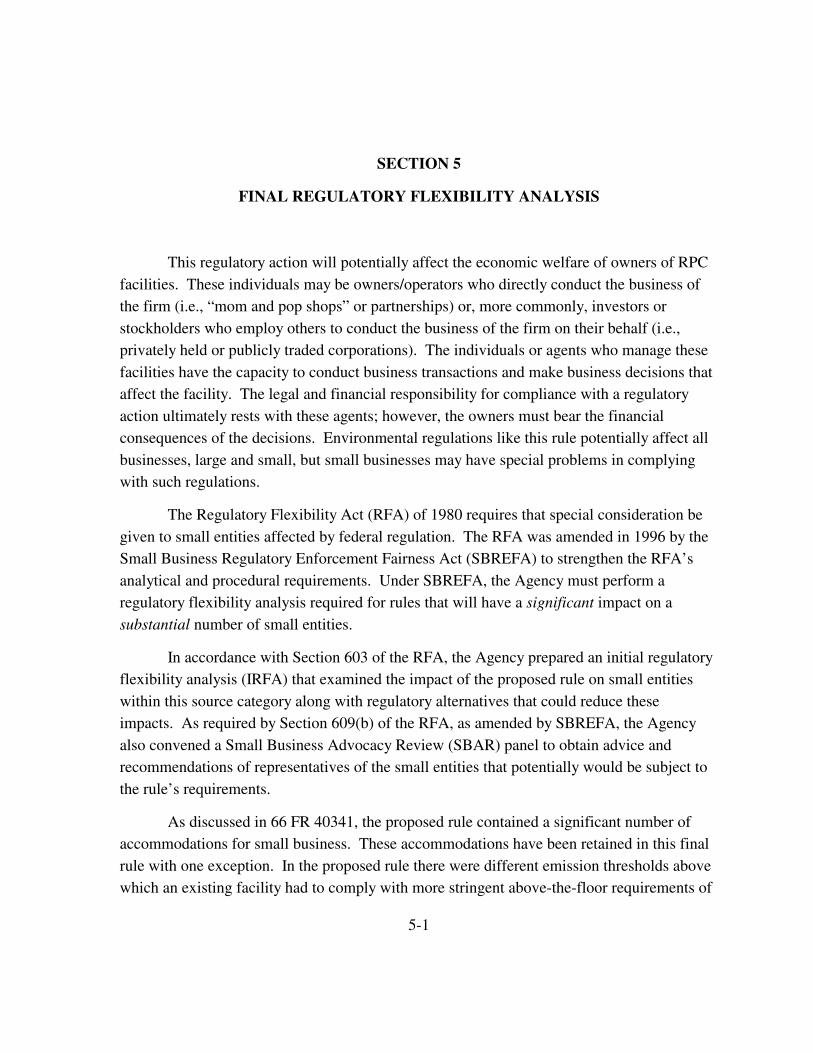
SECTION 5
FINAL REGULATORY FLEXIBILITY ANALYSIS
This regulatory action will potentially affect the economic welfare of owners of RPC facilities. These individuals may be owners/operators who directly conduct the business of the firm (i.e., “mom and pop shops” or partnerships) or, more commonly, investors or stockholders who employ others to conduct the business of the firm on their behalf (i.e., privately held or publicly traded corporations). The individuals or agents who manage these facilities have the capacity to conduct business transactions and make business decisions that affect the facility. The legal and financial responsibility for compliance with a regulatory action ultimately rests with these agents; however, the owners must bear the financial consequences of the decisions. Environmental regulations like this rule potentially affect all businesses, large and small, but small businesses may have special problems in complying with such regulations.
The Regulatory Flexibility Act (RFA) of 1980 requires that special consideration be given to small entities affected by federal regulation. The RFA was amended in 1996 by the Small Business Regulatory Enforcement Fairness Act (SBREFA) to strengthen the RFA’s analytical and procedural requirements. Under SBREFA, the Agency must perform a regulatory flexibility analysis required for rules that will have a significant impact on a substantial number of small entities.
In accordance with Section 603 of the RFA, the Agency prepared an initial regulatory flexibility analysis (IRFA) that examined the impact of the proposed rule on small entities within this source category along with regulatory alternatives that could reduce these impacts. As required by Section 609(b) of the RFA, as amended by SBREFA, the Agency also convened a Small Business Advocacy Review (SBAR) panel to obtain advice and recommendations of representatives of the small entities that potentially would be subject to the rule’s requirements.
As discussed in 66 FR 40341, the proposed rule contained a significant number of accommodations for small business. These accommodations have been retained in this final rule with one exception. In the proposed rule there were different emission thresholds above which an existing facility had to comply with more stringent above-the-floor requirements of
5-1

95 percent capture and control. This threshold was 250 tpy of HAP emissions for small businesses and only 100 tpy for large businesses. In this final rule, we have removed the above-the-floor capture and control requirements for existing facilities except for centrifugal casting and continuous lamination/casting and we have established a threshold of 100 tpy for all facilities. Based on our analysis, setting the threshold at 100 tpy for all facilities, rather than 100 tpy for large businesses and 250 tpy for small businesses, for these two process/product groupings does not result in any additional impacts on small business. However, it does simplify the rule.
As required by section 604 of the RFA, we prepared a final regulatory flexibility analysis (FRFA) for the final rule. The analysis includes:
� a statement of need and objectives of the rule,
� a description and estimate of the number of small businesses to which the rule will apply,
� an economic analysis to determine whether this rule is likely to impose a significant impact on a substantial number of the small businesses within this industry. The analysis employed is a “sales test,” which computes the annualized compliance costs as a share of sales for each company. In addition, we provide information about the impacts on small businesses after accounting for producer responses to the regulation and the resulting changes in market prices and output for RPC products.
� A description of the projected reporting, recordkeeping requirements and other federal rules that may apply to affected entities, and
� A summary of significant issues raised by the SBAR panel, the Agency’s responses, and changes made to minimize the impacts of the final rule.
5.1 Statement of Need and Objectives of the Rule
Section 112 of the CAA requires the Agency to list categories and subcategories of major sources and, in some cases, area sources of HAP and to then establish national emission standards. Reinforced Plastic Composites (RPC) production facilities that were major sources were included on the initial list of source categories. Major sources of HAP are those that have the potential to emit 10 tons per year (tpy) or more of any one HAP or 25 tpy or more of any combination of HAP. The HAP emitted by sources in this source category include styrene, methyl methacrylate, and methylene chloride. These HAP have
5-2
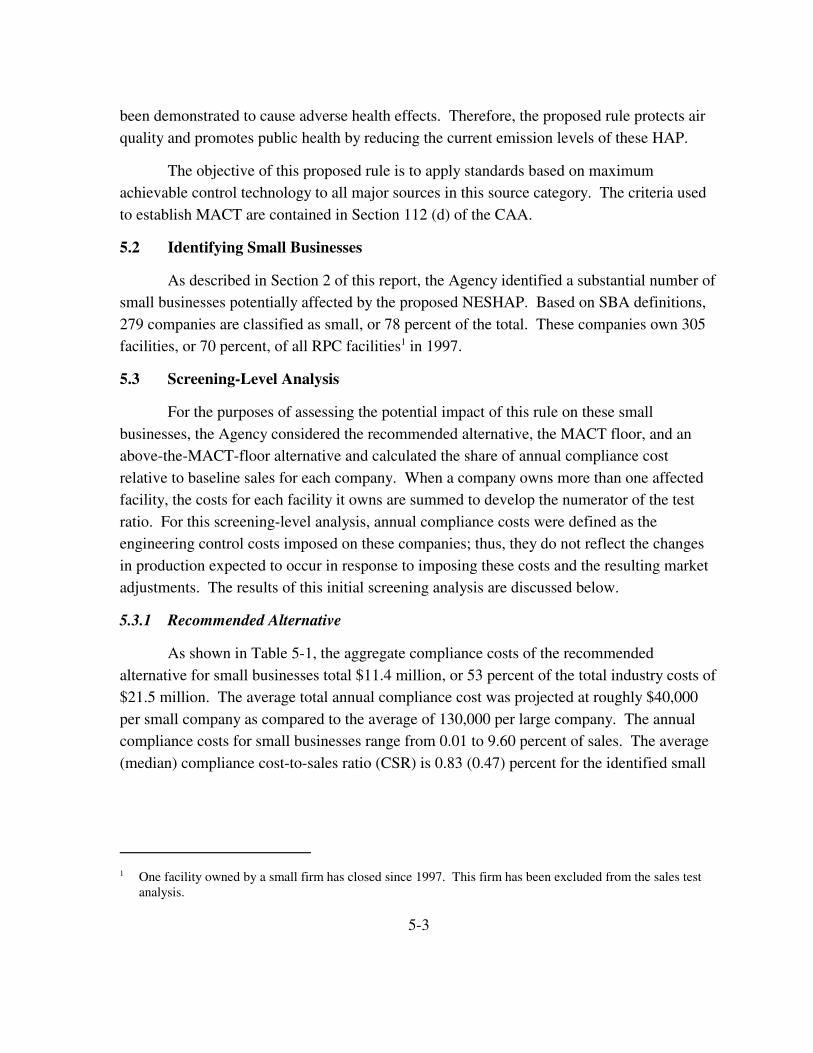
been demonstrated to cause adverse health effects. Therefore, the proposed rule protects air quality and promotes public health by reducing the current emission levels of these HAP.
The objective of this proposed rule is to apply standards based on maximum achievable control technology to all major sources in this source category. The criteria used to establish MACT are contained in Section 112 (d) of the CAA.
5.2 Identifying Small Businesses
As described in Section 2 of this report, the Agency identified a substantial number of small businesses potentially affected by the proposed NESHAP. Based on SBA definitions, 279 companies are classified as small, or 78 percent of the total. These companies own 305 facilities, or 70 percent, of all RPC facilities1 in 1997.
5.3 Screening-Level Analysis
For the purposes of assessing the potential impact of this rule on these small businesses, the Agency considered the recommended alternative, the MACT floor, and an above-the-MACT-floor alternative and calculated the share of annual compliance cost relative to baseline sales for each company. When a company owns more than one affected facility, the costs for each facility it owns are summed to develop the numerator of the test ratio. For this screening-level analysis, annual compliance costs were defined as the engineering control costs imposed on these companies; thus, they do not reflect the changes in production expected to occur in response to imposing these costs and the resulting market adjustments. The results of this initial screening analysis are discussed below.
5.3.1 Recommended Alternative
As shown in Table 5-1, the aggregate compliance costs of the recommended alternative for small businesses total $11.4 million, or 53 percent of the total industry costs of $21.5 million. The average total annual compliance cost was projected at roughly $40,000 per small company as compared to the average of 130,000 per large company. The annual compliance costs for small businesses range from 0.01 to 9.60 percent of sales. The average (median) compliance cost-to-sales ratio (CSR) is 0.83 (0.47) percent for the identified small
1 One facility owned by a small firm has closed since 1997. This firm has been excluded from the sales test analysis.
5-3

Thr
ee o
f th
ese
firm
s
100%
Sha
re
80%
15%
4%
All
Com
pani
es
0.66
%
0.31
%
9.60
%
<0.
01%
$0.0
6
$21.
5
357
Num
ber
354
283
54
14
CSR
s ca
nnot
be
com
pute
d fo
r th
ese
com
pani
es.
Tab
le 5
-1.
Sum
mar
y St
atis
tics
for
SB
RE
FA
Scr
eeni
ng A
naly
sis:
Rec
omm
ende
d A
lter
nati
ve
100%
Sha
re
96%
1%
0%
0.05
%
0.01
%
1.59
%
<0.
01%
Lar
ge
$0.1
3
$10.
1
78
Num
ber
78
75
have
als
o cl
osed
sin
ce 1
997.
All
six
fir
ms
have
bee
n ex
clud
ed f
rom
this
sal
es te
st a
naly
sis.
Not
e: A
ssum
es n
o m
arke
t res
pons
es (
i.e.,
pric
e an
d ou
tput
adj
ustm
ents
) by
reg
ulat
ed e
ntit
ies.
1 0
100%
Sha
re
76%
19%
5%
0.83
%
0.47
%
9.60
%
0.01
%
Ann
ual s
ales
dat
a w
ere
unav
aila
ble
for
thre
e ul
tim
ate
pare
nt c
ompa
nies
.
Smal
l
$0.0
4
$11.
4
279
Num
ber
276
208
53
14
Tot
al A
nnua
l Com
plia
nce
Cos
ts (
TA
CC
) ($
106 )
Com
plia
nce
cost
s ar
e �
1 to
3%
of
sale
s
Com
plia
nce
cost
s ar
e �
3% o
f sa
les
Com
plia
nce
cost
s ar
e <
1% o
f sa
les
Ave
rage
(T
AC
C)
per
com
pany
($1
06 )
Com
plia
nce
Cos
t-to
-Sal
es R
atio
s
Tot
al N
umbe
r of
Com
pani
es
Com
pani
es w
ith S
ales
Dat
aa
Max
imum
Min
imum
Ave
rage
Med
ian
a
5-4

businesses with sales data and 0.05 (<0.01) percent for the large businesses with sales data. As shown, 53 small companies (19 percent) are affected at the 1 percent to 3 percent level and 14 (5 percent) companies are affected at or above the 3 percent level. Thus, a total of 67 small companies, or 24 percent, are expected to incur costs greater than 1 percent of their sales. Furthermore, the distribution of the CSRs, as shown in Figures 5-1(a) and (b), demonstrate that small companies are disproportionally affected relative to large companies.
5.3.2 MACT Floor Alternative
As shown in Table 5-2, the aggregate compliance costs of the MACT floor alternative for small businesses total $11.4 million, which is (55 percent) of the total industry costs of $20.8 million. The annual compliance costs for small businesses range from 0.01 to 9.6 percent of sales. The average (median) compliance CSR is 0.83 (0.47) percent for the identified small businesses with sales data and 0.05 (<0.01) percent for the large businesses with sales data. As shown, 53 small companies (19 percent) are affected at the 1 percent to 3 percent level and 14 companies (5 percent) are affected at or above the 3 percent level. A total of 67 small companies, or 24 percent, are affected above the 1 percent test ratio. As shown in Figures 5-2(a) and (b), the relative impacts between small and large companies are similar to the recommended alternative.
5.3.3 Above-the-MACT Floor Alternative
As shown in Table 5-3, the aggregate compliance costs of the above-the-MACT floor alternative for small businesses total $135.8 million, or 63 percent of the total industry costs of $216.8 million. The annual compliance costs for small businesses range from 0.01 to 79.18 percent of sales. The average (median) compliance CSR is 12.03 (8.73) percent for the identified small businesses with sales data and 0.58 (0.07) percent for the large businesses with sales data. As shown, 34 small companies (12 percent) are affected at the 1 percent to 3 percent level and 216 companies (78 percent) are affected at or above the 3 percent level. Thus, a total of 250 small companies incur costs greater than 1 percent of their sales, which is four times the number affected under the recommended alternative. Figures 5-3(a) and (b) show that the disproportionate relative impact between small and large companies is even more pronounced than under the recommended alternative.
5-5
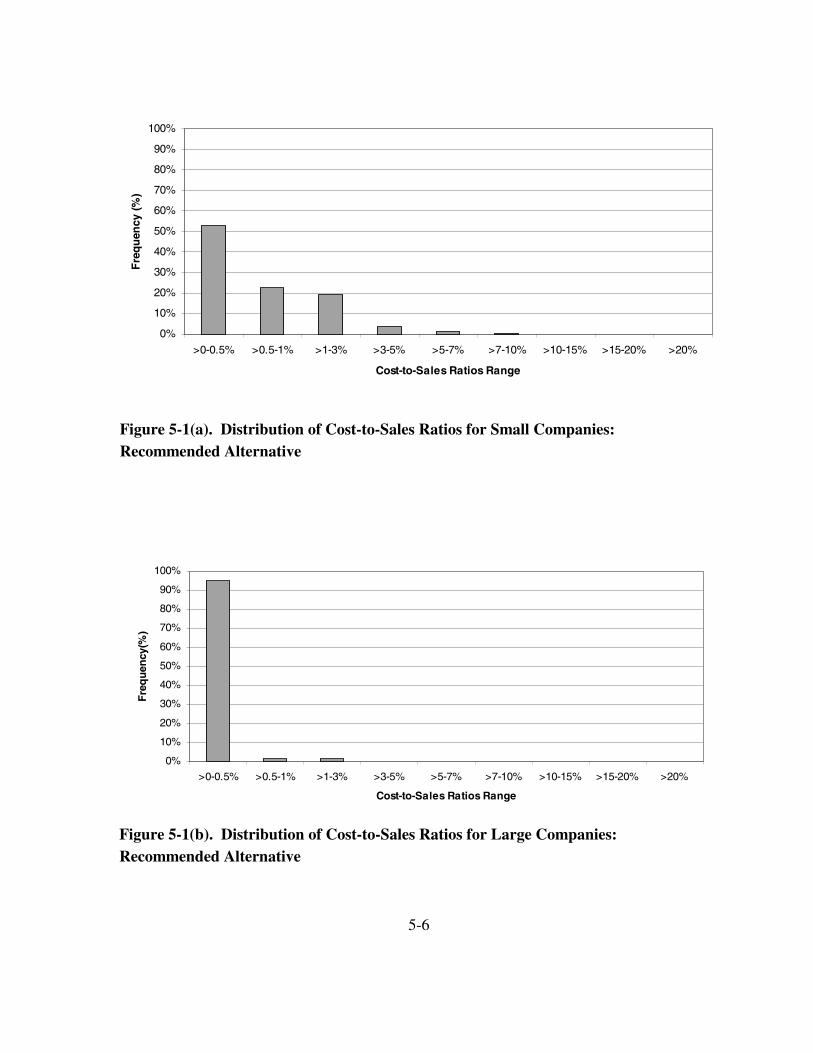
100%
90%
80%
70%
60%
50%
40%
30%
20%
10%
0%
>0-0.5% >0.5-1% >1-3% >3-5% >5-7% >7-10% >10-15% >15-20% >20%
Cost-to-Sales Ratios Range
Figure 5-1(a). Distribution of Cost-to-Sales Ratios for Small Companies: Recommended Alternative
100%
90%
80%
70%
60%
50%
40%
30%
20%
10%
0%
>0-0.5% >0.5-1% >1-3% >3-5% >5-7% >7-10% >10-15% >15-20% >20%
Cost-to-Sales Ratios Range
Figure 5-1(b). Distribution of Cost-to-Sales Ratios for Large Companies: Recommended Alternative
Fre
qu
ency
(%)
Fre
qu
ency
(%
)
5-6

Thr
ee o
f th
ese
firm
s
100%
Sha
re
80%
15%
4%
All
Com
pani
es
0.66
%
0.31
%
9.60
%
<0.
01%
$0.0
6
$20.
8
357
Num
ber
354
283
54
14
CSR
s ca
nnot
be
com
pute
d fo
r th
ese
com
pani
es.
Tab
le 5
-2.
Sum
mar
y St
atis
tics
for
SB
RE
FA
Scr
eeni
ng A
naly
sis:
MA
CT
Flo
or A
lter
nati
ve
100%
Sha
re
96%
1%
0%
0.05
%
0.01
%
1.59
%
<0.
01%
Lar
ge
$0.1
2
$9.4
78
Num
ber
78
75
have
als
o cl
osed
sin
ce 1
997.
All
six
fir
ms
have
bee
n ex
clud
ed f
rom
this
sal
es te
st a
naly
sis.
Not
e: A
ssum
es n
o m
arke
t res
pons
es (
i.e.,
pric
e an
d ou
tput
adj
ustm
ents
) by
reg
ulat
ed e
ntit
ies.
1 0
100%
Sha
re
75%
19%
5%
0.83
%
0.47
%
9.60
%
0.01
%
Ann
ual s
ales
dat
a w
ere
unav
aila
ble
for
thre
e ul
tim
ate
pare
nt c
ompa
nies
.
Smal
l
$0.0
4
$11.
4
279
Num
ber
276
208
53
14
Tot
al A
nnua
l Com
plia
nce
Cos
ts (
TA
CC
) ($
106 )
Com
plia
nce
cost
s ar
e �
1 to
3%
of
sale
s
Com
plia
nce
cost
s ar
e �
3% o
f sa
les
Com
plia
nce
cost
s ar
e <
1% o
f sa
les
Ave
rage
TA
AC
per
com
pany
($1
06 )
Com
plia
nce
Cos
t-to
-Sal
es R
atio
s
Tot
al N
umbe
r of
Com
pani
es
Com
pani
es w
ith S
ales
Dat
aa
Max
imum
Min
imum
Ave
rage
Med
ian
a
5-7
100%
90%
80%
70%
60%
50%
40%
30%
20%
10%
0%
>0-0.5% >0.5-1% >1-3% >3-5% >5-7% >7-10% >10-15% >15-20% >20%
Cost-to-Sales Ratios Range
Figure 5-2(a). Distribution of Cost-to-Sales Ratios for Small Companies: MACT Floor Alternative
100%
90%
80%
70%
60%
50%
40%
30%
20%
10%
0%
>0-0.5% >0.5-1% >1-3% >3-5% >5-7% >7-10% >10-15% >15-20% >20%
Cost-to-Sales Ratios Range
Figure 5-2(b). Distribution of Cost-to-Sales Ratios for Large Companies: MACT Floor Alternative
Fre
qu
ency
(%)
Fre
qu
ency
(%
)
5-8

Thr
ee o
f th
ese
firm
s
100%
Sha
re
26%
11%
62%
All
Com
pani
es
9.55
%
5.45
%
79.1
8%
<0.
01%
$216
.8
$0.6
357
Tab
le 5
-3.
Sum
mar
y St
atis
tics
for
SB
RE
FA
Scr
eeni
ng A
naly
sis:
Abo
ve-t
he-M
AC
T-F
loor
Alt
erna
tive
Num
ber
354
220
93
38
CSR
s ca
nnot
be
com
pute
d fo
r th
ese
com
pani
es.
100%
Sha
re
87%
5%
5%
0.58
%
0.07
%
15.5
7%
<0.
01%
Lar
ge
$81.
0
$1.0
78
Num
ber
78
68
have
als
o cl
osed
sin
ce 1
997.
All
six
fir
ms
have
bee
n ex
clud
ed f
rom
this
sal
es te
st a
naly
sis.
Not
e: A
ssum
es n
o m
arke
t res
pons
es (
i.e.,
pric
e an
d ou
tput
adj
ustm
ents
) by
reg
ulat
ed e
ntit
ies.
4 4
100%
Sha
re
12%
78%
9%
12.0
3%
8.73
%
79.1
8%
0.01
%
Ann
ual s
ales
dat
a w
ere
unav
aila
ble
for
thre
e ul
tim
ate
pare
nt c
ompa
nies
.
Smal
l
$135
.8
$0.5
279
Num
ber
276
216
25
34
Tot
al A
nnua
l Com
plia
nce
Cos
ts (
TA
CC
) ($
106 )
Com
plia
nce
cost
s ar
e �
1 to
3%
of
sale
s
Com
plia
nce
cost
s ar
e �
3% o
f sa
les
Com
plia
nce
cost
s ar
e <
1% o
f sa
les
Ave
rage
TA
CC
per
com
pany
($1
06 )
Com
plia
nce
Cos
t-to
-Sal
es R
atio
s
Tot
al N
umbe
r of
Com
pani
es
Com
pani
es w
ith S
ales
Dat
aa
Max
imum
Min
imum
Ave
rage
Med
ian
a
5-9

100%
90%
80%
70%
60%
50%
40%
30%
20%
10%
0%
>0-0.5% >0.5-1% >1-3% >3-5% >5-7% >7-10% >10-15% >15-20% >20%
Cost-to-Sales Ratios Range
Figure 5-3(a). Distribution of Cost-to-Sales Ratios for Small Companies: Above-the-MACT-Floor Alternative
100%
90%
80%
70%
60%
50%
40%
30%
20%
10%
0%
>0-0.5% >0.5-1% >1-3% >3-5% >5-7% >7-10% >10-15% >15-20% >20%
Cost-to-Sales Ratios Range
Figure 5-3(b). Distribution of Cost-to-Sales Ratios for Large Companies: Above-the-MACT-Floor Alternative
Fre
qu
ency
(%)
Fre
qu
ency
(%
)
5-10

5.4 Economic Analysis
The Agency also analyzed the economic impacts on small businesses under with-regulation conditions expected to result from implementing the proposed NESHAP. Unlike the screening-level analysis described above, this approach examines small business impacts in light of the expected behavioral responses of producers and consumers to the regulation. As shown in Table 5-4, net operating profits increase by $4 million. This is a result of two effects: 111 small facilities with lower per unit costs experience increase in profits ($10 million) due to price increases. The remaining 190 facilities experience profit losses of $6 million. Eighty-nine product lines and 36 facilities are projected to close under the MACT floor alternative and the recommended alternative, while 315 product lines and 179 facilities are projected to close under the above-the-MACT-floor alternative.
5.5 Assessment
Although any facility closures are cause for concern, the number of facilities at risk for closure would be the same if this proposed rule required only the MACT floor level of control for all facilities. The MACT floor is the least stringent level allowed by statute. As a result of the SBAR panel, this rule contains a significant number of accommodations for small business. The results presented here confirm that the mitigating measures employed by the Agency have minimized the potential negative impacts of the proposed rule on small businesses while still satisfying the objectives of the CAA. The share of small companies affected at less than 1 percent exceeds 75 percent under both the recommended alternative and the MACT floor alternative. Furthermore, only 5 percent of small companies are projected to be affected at or above the 3 percent level for both the recommended and MACT floor alternative, while 78 percent of the small companies exceed this level under the abovethe-MACT-floor alternative.
The economic analysis, which includes market responses to the regulation, provides the following results: 36 facilities (12 percent) owned by small businesses are projected to close under the recommended alternative and the MACT floor alternative. The number of facilities increases to 179 (60 percent) under the more stringent above-the-floor MACT alternative. These results are consistent with the industry’s profitability and characterization of cost curves and engineering costs provided in earlier sections. This industry is characterized by average profit margins of 3 to 4 percent (Dun and Bradstreet, 1997). Under baseline conditions, small facilities have higher per-unit costs of production, reflecting economies of scale in the production of RPC. In addition, analysis of the engineering costs
5-11
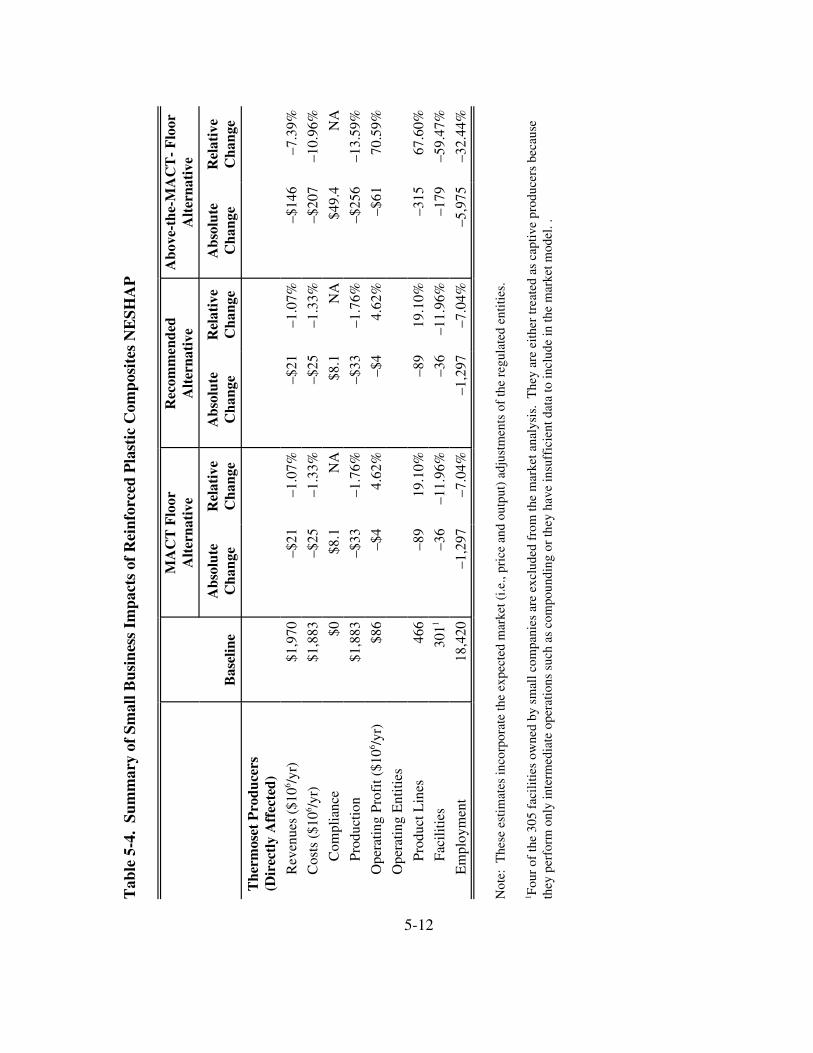
–7.3
9%
NA
70.5
9%
67.6
0%
Tab
le 5
-4.
Sum
mar
y of
Sm
all B
usin
ess
Impa
cts
of R
einf
orce
d P
last
ic C
ompo
site
s N
ESH
AP
Bas
elin
e
MA
CT
Flo
or
Alt
erna
tive
R
ecom
men
ded
Alt
erna
tive
A
bove
-the
-MA
CT
-F
loor
A
lter
nati
ve
Abs
olut
e C
hang
e R
elat
ive
Cha
nge
Abs
olut
e C
hang
e R
elat
ive
Cha
nge
Abs
olut
e C
hang
e R
elat
ive
Cha
nge
The
rmos
et P
rodu
cers
(D
irec
tly
Aff
ecte
d)
–10.
96%
–13.
59%
–59.
47%
–32.
44%
The
y ar
e ei
ther
trea
ted
as c
apti
ve p
rodu
cers
bec
ause
–5,9
75
–$14
6
–$20
7
$49.
4
–$25
6
–$61
–315
–179
they
per
form
onl
y in
term
edia
te o
pera
tions
suc
h as
com
poun
ding
or
they
hav
e in
suff
icie
nt d
ata
to in
clud
e in
the
mar
ket m
odel
. .
–1.0
7%
–1.3
3%
NA
–1.7
6%
4.62
%
19.1
0%
–11.
96%
–7.0
4%
Not
e: T
hese
est
imat
es in
corp
orat
e th
e ex
pect
ed m
arke
t (i.e
., pr
ice
and
outp
ut)
adju
stm
ents
of
the
regu
late
d en
titie
s.
–1,2
97
–$21
–$25
$8.1
–$33
–$4
–89
–36
1 Fou
r of
the
305
faci
liti
es o
wne
d by
sm
all c
ompa
nies
are
exc
lude
d fr
om th
e m
arke
t ana
lysi
s.
–1.0
7%
–1.3
3%
NA
–1.7
6%
4.62
%
19.1
0%
–11.
96%
–7.0
4%
18,4
20
–1,2
97
–$21
–$25
$8.1
–$33
–$4
–89
–36
$1,9
70
$1,8
83
$0
$1,8
83
$86
466
3011
Ope
ratin
g P
rofi
t ($1
06 /yr)
Rev
enue
s ($
106 /y
r)
Ope
ratin
g E
ntiti
es
Pro
duct
Lin
es
Cos
ts (
$106 /y
r)
Com
plia
nce
Pro
duct
ion
Em
ploy
men
t
Fac
ilitie
s
5-12

shows that these facilities also have higher per-unit compliance costs under with-regulation alternatives. Therefore, the economic impacts are likely to fall disproportionately on small facilities. However, as noted in Section 4, these entities may have contractual obligations that allow them to continue operation and potentially mitigate these impacts through terms that deal with contingencies.
The economic analysis also shows that producers using resins not directly affected by the regulation experience profit gains (e.g., $18.0 million gain under the recommended alternative). This occurs because the prices of the commodities they produce will increase, but they do not incur compliance costs. Given the distribution of small and large entities identified in the regulated segment, it is likely that a significant number of these producers may be small. Thus, a complete analysis of the small business impacts of the proposed rule would compute a net effect using the projected impacts on both directly (thermoset) and indirectly affected (thermoplastic) producers. Data limitations on the distribution of small businesses across the indirectly affected segment do not allow for quantitative estimates of net impacts. However, the qualitative analysis does suggest that small businesses using resins not directly affected by the rule will experience offsetting gains under with-regulation conditions.
We do not anticipate any impacts of the proposed NESHAP on small governments or small nonprofit organizations. We have no evidence that either small governments or nonprofit organizations own or operate sources that will be impacted by this proposed NESHAP.
5.6 Projected Reporting and Recordkeeping Requirements
The proposed reporting and recordkeeping requirements for these small businesses include initial notifications, startup notifications and compliance reports. These requirements were discussed in more detail under the discussion of the Paperwork Reduction Act above. We estimate that 304 existing facilities owned by small businesses will be impacted by these requirements, and 53 new facilities will be impacted in the first three years. The professional skills required to complete these reports include the ability to calculate emissions and resin use and read and follow report format guidance. All facilities impacted by this final rule should have personnel with the necessary skills because they would need these skills to comply with other regulatory requirements, such as Toxic Release Inventory (TRI) reporting.
5-13
Provisions to minimize the reporting and recordkeeping requirements on small business have been incorporated into this final rule. These provisions include allowing: the facility to substantiate resin and gel coat HAP contents with Material Safety Data Sheets rather then requiring testing of each resin and gel coat; use of resin purchase records to determine resin use; and exemption of facilities that can demonstrate that all their resin and gel coats comply with the required HAP content limits from the requirement to keep records of resin use and calculate emission factor averages. These provisions have also been extended to all companies subject to today’s proposed NESHAP.
5.7 Other Federal Rules That May Impact Reinforced Plastic Composite Production Facilities
These facilities may also be subject to the NESHAP being developed for plastic parts and products. There should be no duplication of effort as a result of this proposed rule and the Plastic Parts and Products NESHAP being developed because these NESHAP will cover different operations. Facilities subject to this final rule are also subject to emissions estimate reporting under the TRI requirements. In this final rule, we could determine no ways to combine TRI and the reporting requirements of the proposed NESHAP because the objectives and statutory authorities of these requirements are different.
5.8 Alternatives to the Proposed Rule
We have incorporated significant alternatives into the proposed rule to minimize the impact on small business but still meet the objectives of the CAA.
As required by section 609(b) of the RFA, EPA conducted outreach to small entities and convened a SBAR panel to review advice and recommendations from representatives of the small entities that potentially would be subject to the proposed rule requirements.
Consistent with RFA/SBREFA requirements, the panel evaluated the assembled materials and small-entity comments on issues related to the elements of the IRFA. A copy of the panel report is included in the docket as item II-J-27.
The panel considered numerous regulatory flexibility options in response to concerns raised by the SER. The major concerns included the affordability and technical feasibility of add-on controls, the resin and gel coat HAP contents required to meet some of the MACT floors, and the regulatory treatment of speciality products.
5-14
These are the major panel recommendations and EPA’s response in the final rule:
� Recommend setting higher thresholds than EPA had initially considered for requirements to use add-on controls.
Response: EPA has removed the requirements for add-on controls for existing open molding, pultrusion, SMC and BMC manufacturing, and mixing operations. We are retaining the requirement for centrifugal casting and continuous lamination/casting operations and setting a threshold of 100 tpy for all facilities. Setting a common threshold at 100 tpy does not increase the impacts on any small business. Also, the original reason for setting different thresholds were the impacts of the capital cost of add-on controls for open molding, pultrusion, SMC and BMC manufacturing, and mixing. Because existing facilities that have these operations are no longer subject to any add-on control requirements at any threshold, the original reason for the different thresholds no longer exists.
� Recommend setting the new source floor for small-owned sources at the level of the existing source floor.
Response: The final rule includes this provision.
� Recommend establishing separate floors for speciality products.
Response: The final rule includes provisions for special products.
� Explore pollution-prevention alternatives to add-on controls.
Response: The EPA did explore this possibility with industry sources. We could not devise a workable pollution-prevention alternative to include in the proposed rule and requested comment. The only comments received on a pollution-prevention alternative were for the pultrusion process/product grouping. In this final rule, we have incorporated a new pollution-prevention technology recommended in the comments as a compliance alternative for pultrusion operations.
� Recommend allowing individual facilities to use the same resin in all resin application processes.
Response: The final rule includes this provision.
� Reconsider the resin HAP content requirement for tooling resins.
Response: We requested additional information on tooling resins subsequent to proposal. Based on information we received, the floor for manual application of tooling resins was made less stringent. The available data still indicate that the floor for mechanical tooling resins in the proposed rule was appropriate.
5-15

� Recommend separate floors for white and non-white gel coats.
Response: The final rule includes this provision.
� Reconsider the Agency’s estimates of the cost of add-on controls.
Response: We conducted a thorough review of the Agency’s costs for add-on controls and made significant revisions to the cost estimates. As a result, the add-on control requirements have been removed for existing open molding, pultrusion, SMC and BMC manufacturing and mixing operations.
� Recommend grouping high-strength applications with corrosion-resistant operations.
Response: The final rule includes this provision.
Detailed information on all these recommendations is contained in the panel report in the docket for this proposed rule.
5-16
REFERENCES
American Business Information (ABI). 1999. American Business Disc [computer file].
Berglund, Lars. 1998. “Thermoplastic Resins.” Handbook of Composites, S.T. Peters, ed. New York: Chapman and Hall.
Composite Fabricators Association (CFA). 2000. “Industry Composites Demand for 1999–2000.” <http://www.cfa-hq.org>. As obtained on July 29, 2000.
Dialog Information Service. 1997. Standard and Poor’s Corporations [computer file]. Palo Alto, CA: Dialog Information Service.
Disclosure Incorporated. 1998. Worldscope [computer file]. Bethesda, MD: Disclosure Inc.
Dun & Bradstreet. 1998. Industry Norms & Key Business Ratios, Desk-Top Edition 1996-
97. Murray Hill, NJ: Dun & Bradstreet.
Dun & Bradstreet. 1998. Dun’s Market Identifiers [computer file]. New York, NY: Dialog Corporation.
Dun & Bradstreet. 1999. Million Dollar Directory: America’s Leading Public and Private
Companies. Bethlehem, PA: Dun & Bradstreet Corporation.
Gale Research, Inc. 1996. Manufacturing USA. Detroit, MI: Gale Research, Inc.
Gale Research, Inc. 1998. Ward’s Business Directory of U.S. Private and Public Companies. Detroit, MI: Gale Research, Inc.
Information Access Corporation. 1998. Business & Company ProFile [computer file]. Foster City, CA: Information Access Corporation.
LeFlam, Greg, and Melanie Proctor, PES Inc., memorandum to Madeleine Strum, U.S. Environmental Protection Agency. Industry Description Memorandum. October 17, 1995.
Lindsay, Karen F. 1996. “State of the Industry: 1995-96.” Composites Design and Application February.
R-1

Modern Plastics. “Resin Supply: What’s in the Pipeline for ‘93?” January 1993.
Modern Plastics. “Resin Supply: Plotting a Course for Global Supply.” January 1994.
Murphy, John. 1994. The Reinforced Plastics Handbook. Oxford, UK: Elsevier Advanced Technology.
Plastics News. “Resin Pricing.” Updated May 13, 1999. <http://www.plasticsnews.com>. As obtained on May 17, 1999.
Predicasts Basebook. November 1992. Foster City, CA: Information Access Corporation.
Rauch Associates. 1991. The Rauch Guide to the U.S. Plastics Industry. Bridgewater, NJ: Rauch Associates, Inc.
Schwartz, Mel. 1997. Composite Materials: Processing, Fabrication, and Applications. Upper Saddle River, NJ: Prentice Hall.
Shearer, Brent. April 15, 1996. “Carbon Fibers Adjusting to Changes.” Chemical
Marketing Reporter.
Society of the Plastics Industry, Inc. (SPI). 1994. Facts and Figures of the U.S. Plastics Industry. Washington, DC: SPI.
Society of the Plastics Industry, Inc. (SPI). 1998. Facts and Figures of the U.S. Plastics
Industry. Washington, DC: SPI.
Society of the Plastics Industry (SPI) Composites Institute. 1992. Introduction to Composites. Second Edition. Washington, DC: Society of the Plastics Industry, Inc.
Society of the Plastics Industry (SPI) Composites Institute. 1995. Introduction to
Composites. Third Edition. Washington, DC: Society of the Plastics Industry, Inc.
U.S. Bureau of Labor Statistics. 2000. Producer Price Index—Commodities: WPUSOP9200, Intermediate Materials less food and energy. 1990–2000. [online] <http://www.bls.gov>. Obtained January 20, 2000.
U.S. Environmental Protection Agency (EPA). 1993. “Survey of Reinforced Plastics Industry.” Washington, DC: U.S. Environmental Protection Agency.
U.S. Environmental Protection Agency, Office of Enforcement and Compliance Assurance. 1995. EPA Office of Compliance Sector Notebook Project: Profile of the Rubber and Plastics Industry. Washington, DC: U.S. Environmental Protection Agency.
R-2
U.S. Geological Survey. 1997. Minerals Yearbook: Clays. [online] <http://minerals.usgs.gov/minerals/pubs/commodity/myb>. Obtained January 21, 2000.
U.S. Geological Survey. 1997. Minerals Yearbook: Mica. [online] <http://minerals.usgs.gov/minerals/pubs/commodity/myb>. Obtained January 21, 2000.
U.S. Small Business Administration. 1996. Size Standards by SIC Industry. <http://www.sba.govgopher/Government-Contracting/Size/sizeall.txt>.
R-3
Appendix A
Summary Data for Companies Owning Reinforced Plastic Composite Facilities

Table A-1. Summary Data for Companies Reinforced Plastic Composite Facilities
Facilities Sales Small Company Name (#) ($106) Employment Business
20th Century Fiberglass Inc.
A. R. E., Inc.
A.F.P. Imaging
A.O. Smith Corporation
A-1 Fiberglass Inc.
ABC Industries, Inc.
Able Body Corporation
Accent Marble Company Inc.
Accra Industries Inc.
Accurate Glass Inc.
Acme Fiberglass Inc.
Acme Reinforced Plastics Inc.
Aero Transportation Corporation
Aeroquip Inoac Company
Agco Inc.
Aker Plastics Company Inc.
Alco Industries, Inc.
Allen Group (The)
Alliance Equipment Company Inc.
Allied Moulded Prods. Inc.
Altec Industries Inc.
American Acrylic Corporation
American Bluegrass Marble Company
American Marble Company Inc.
American Reinforced Plastics, Inc.
1 $95.0 800 No
2 $19.1 175 Yes
1 $37.0 190 Yes
2 $1,645.7 13,000 No
1 $5.1 50 Yes
3 $8.0 75 Yes
2 $35.0 475 Yes
1 $5.0 100 Yes
1 $1.9 15 Yes
1 $3.0 35 Yes
1 $2.5 25 Yes
1 $3.1 15 Yes
1 $5.8 76 Yes
1 $65.0 560 No
1 $2,317.5 7,800 No
3 $36.0 400 Yes
1 $225.0 2,000 No
1 $369.5 2,900 No
1 $1.2 20 Yes
1 $17.7 240 Yes
1 $250.0 1,800 No
1 $3.5 36 Yes
1 $2.9 63 Yes
1 $0.9 19 Yes
1 $1.2 25 Yes
American Slate & Marble of Hickory, Inc. 1 $1.7 33 Yes
American Standard Companies 1 $5,805.0 44,000 No
Americh Corporation 2 $10.0 50 Yes
Ameron International Corporation 1 $533.5 2,761 No
(continued)
A-1
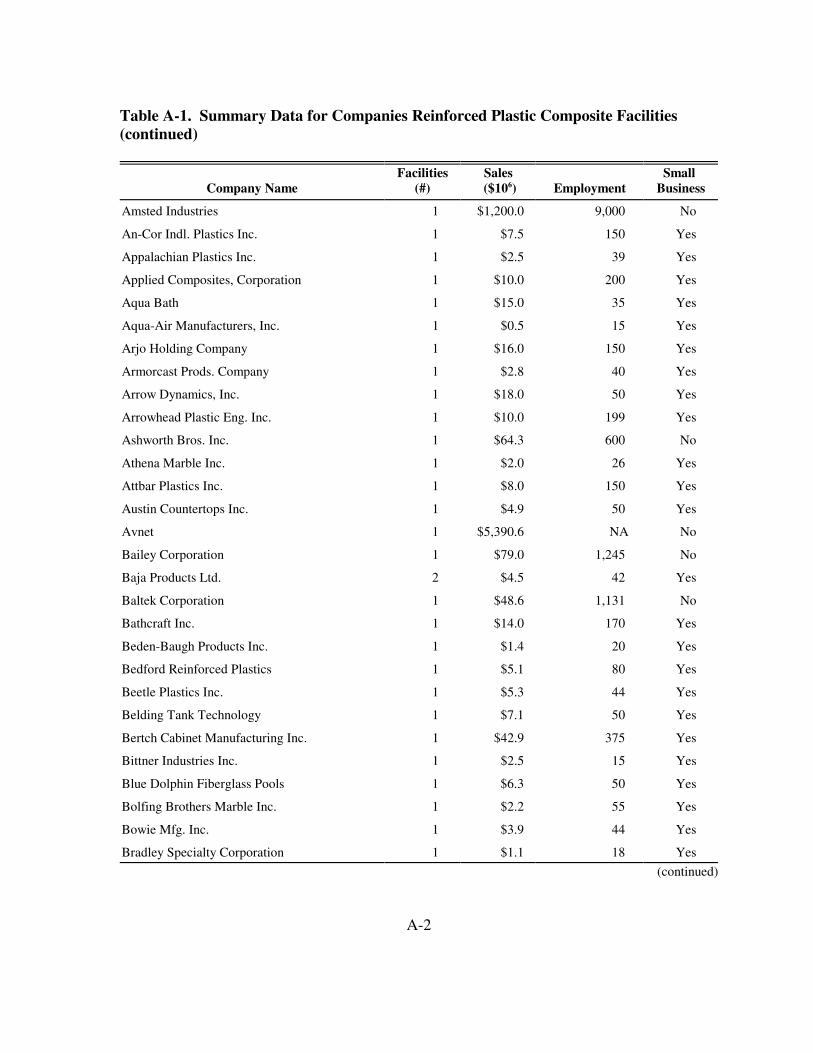
Table A-1. Summary Data for Companies Reinforced Plastic Composite Facilities (continued)
Facilities Sales Small Company Name (#) ($106) Employment Business
Amsted Industries
An-Cor Indl. Plastics Inc.
Appalachian Plastics Inc.
Applied Composites, Corporation
Aqua Bath
Aqua-Air Manufacturers, Inc.
Arjo Holding Company
Armorcast Prods. Company
Arrow Dynamics, Inc.
Arrowhead Plastic Eng. Inc.
Ashworth Bros. Inc.
Athena Marble Inc.
Attbar Plastics Inc.
Austin Countertops Inc.
Avnet
Bailey Corporation
Baja Products Ltd.
Baltek Corporation
Bathcraft Inc.
Beden-Baugh Products Inc.
Bedford Reinforced Plastics
Beetle Plastics Inc.
Belding Tank Technology
Bertch Cabinet Manufacturing Inc.
Bittner Industries Inc.
Blue Dolphin Fiberglass Pools
Bolfing Brothers Marble Inc.
Bowie Mfg. Inc.
Bradley Specialty Corporation
1 $1,200.0 9,000 No
1 $7.5 150 Yes
1 $2.5 39 Yes
1 $10.0 200 Yes
1 $15.0 35 Yes
1 $0.5 15 Yes
1 $16.0 150 Yes
1 $2.8 40 Yes
1 $18.0 50 Yes
1 $10.0 199 Yes
1 $64.3 600 No
1 $2.0 26 Yes
1 $8.0 150 Yes
1 $4.9 50 Yes
1 $5,390.6 NA No
1 $79.0 1,245 No
2 $4.5 42 Yes
1 $48.6 1,131 No
1 $14.0 170 Yes
1 $1.4 20 Yes
1 $5.1 80 Yes
1 $5.3 44 Yes
1 $7.1 50 Yes
1 $42.9 375 Yes
1 $2.5 15 Yes
1 $6.3 50 Yes
1 $2.2 55 Yes
1 $3.9 44 Yes
1 $1.1 18 Yes
(continued)
A-2
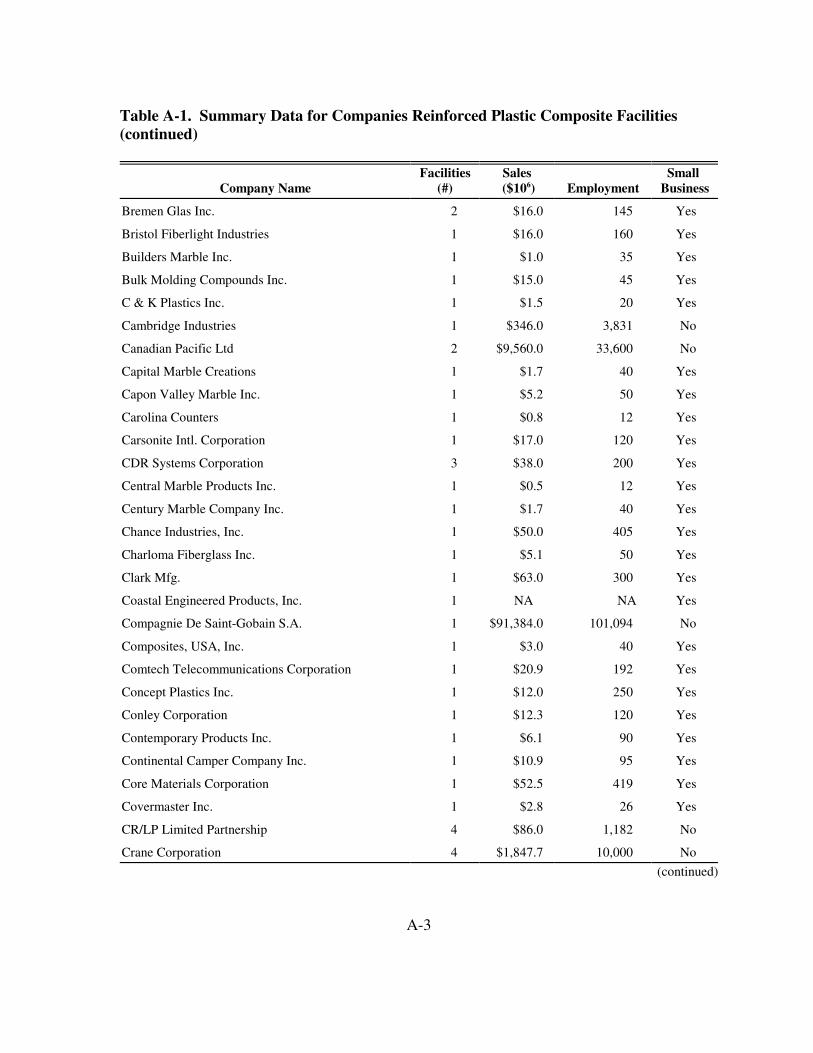
Table A-1. Summary Data for Companies Reinforced Plastic Composite Facilities (continued)
Facilities Sales Small Company Name (#) ($106) Employment Business
Bremen Glas Inc.
Bristol Fiberlight Industries
Builders Marble Inc.
Bulk Molding Compounds Inc.
C & K Plastics Inc.
Cambridge Industries
Canadian Pacific Ltd
Capital Marble Creations
Capon Valley Marble Inc.
Carolina Counters
Carsonite Intl. Corporation
CDR Systems Corporation
Central Marble Products Inc.
Century Marble Company Inc.
Chance Industries, Inc.
Charloma Fiberglass Inc.
Clark Mfg.
Coastal Engineered Products, Inc.
Compagnie De Saint-Gobain S.A.
Composites, USA, Inc.
2 $16.0 145 Yes
1 $16.0 160 Yes
1 $1.0 35 Yes
1 $15.0 45 Yes
1 $1.5 20 Yes
1 $346.0 3,831 No
2 $9,560.0 33,600 No
1 $1.7 40 Yes
1 $5.2 50 Yes
1 $0.8 12 Yes
1 $17.0 120 Yes
3 $38.0 200 Yes
1 $0.5 12 Yes
1 $1.7 40 Yes
1 $50.0 405 Yes
1 $5.1 50 Yes
1 $63.0 300 Yes
1 NA NA Yes
1 $91,384.0 101,094 No
1 $3.0 40 Yes
Comtech Telecommunications Corporation 1 $20.9 192 Yes
Concept Plastics Inc. 1 $12.0 250 Yes
Conley Corporation 1 $12.3 120 Yes
Contemporary Products Inc. 1 $6.1 90 Yes
Continental Camper Company Inc. 1 $10.9 95 Yes
Core Materials Corporation 1 $52.5 419 Yes
Covermaster Inc. 1 $2.8 26 Yes
CR/LP Limited Partnership 4 $86.0 1,182 No
Crane Corporation 4 $1,847.7 10,000 No
(continued)
A-3

Table A-1. Summary Data for Companies Reinforced Plastic Composite Facilities (continued)
Facilities Sales Small Company Name (#) ($106) Employment Business
Creative Pultrusions, Inc. 2 $1.8 270 Yes
Cultured Marble Products Ltd. 1 $1.0 13 Yes
Custom Fibreglass Mfg. Company 1 $18.0 150 Yes
Custom Fiberglass Moldings, Inc. 1 $0.8 26 Yes
Custom Marble Inc. 1 $1.0 29 Yes
Cytec Industries 1 $1,290.6 5,200 No
Dasco Pro, Inc. 1 $7.9 70 Yes
Delta Fiberglass & Environmental Products 1 $7.5 50 Yes
Delta Fiberglass Structures 1 $9.3 90 Yes
Denali Inc. 3 $71.1 743 No
Diamond Coach Corporation 1 $10.0 100 Yes
Diamond Fiberglass Fabricators, Inc. 1 $12.0 85 Yes
Dixie-Pacific Manufacturing Company 1 $27.0 250 Yes
Dom-Fab, Inc. 1 $6.4 50 Yes
Dow Chemical 1 $20,018.0 40,289 No
Dyson-Kissner-Moran Corporation 1 $500.0 4,500 No
Eagle Craft Inc. 1 $1.8 26 Yes
Eagle-Picher Industries Inc. 3 $848.5 7,500 No
Ebonite International 1 $16.0 250 Yes
Eckler Industries 1 $12.0 110 Yes
Ed Industries, Inc. 1 $5.6 60 Yes
Electric-Glass Inc. 1 $2.7 27 Yes
Eljer Industries 2 $397.4 3,700 No
Elmore Industries 1 $1.2 12 Yes
Emsig Mfg. Corporation 1 $25.0 300 Yes
Enuro Fiberglass Systems, Inc. 3 $35.0 1,500 No
Epoch Industries 1 $6.4 50 Yes
Escalade Inc. 1 $93.2 700 No
(continued)
A-4
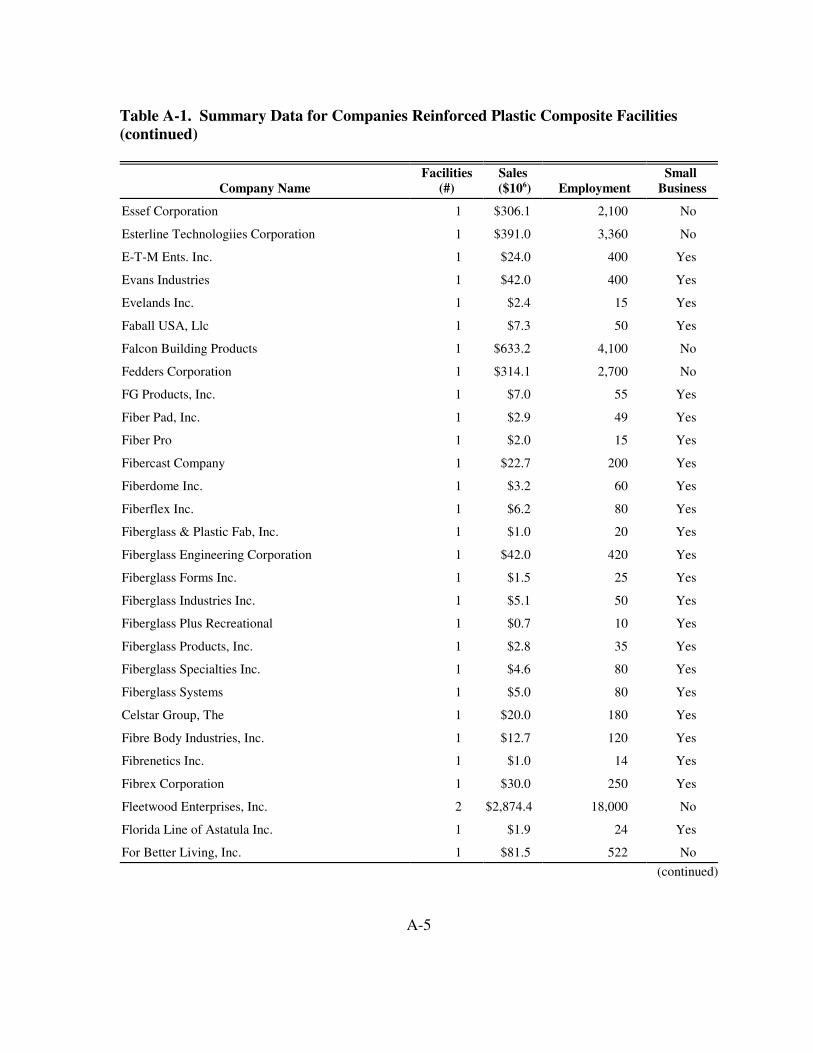
Table A-1. Summary Data for Companies Reinforced Plastic Composite Facilities (continued)
Facilities Sales Small Company Name (#) ($106) Employment Business
Essef Corporation
Esterline Technologiies Corporation
E-T-M Ents. Inc.
Evans Industries
Evelands Inc.
Faball USA, Llc
Falcon Building Products
Fedders Corporation
FG Products, Inc.
Fiber Pad, Inc.
Fiber Pro
Fibercast Company
Fiberdome Inc.
Fiberflex Inc.
Fiberglass & Plastic Fab, Inc.
Fiberglass Engineering Corporation
Fiberglass Forms Inc.
Fiberglass Industries Inc.
Fiberglass Plus Recreational
Fiberglass Products, Inc.
Fiberglass Specialties Inc.
Fiberglass Systems
Celstar Group, The
Fibre Body Industries, Inc.
Fibrenetics Inc.
Fibrex Corporation
Fleetwood Enterprises, Inc.
Florida Line of Astatula Inc.
For Better Living, Inc.
1 $306.1 2,100 No
1 $391.0 3,360 No
1 $24.0 400 Yes
1 $42.0 400 Yes
1 $2.4 15 Yes
1 $7.3 50 Yes
1 $633.2 4,100 No
1 $314.1 2,700 No
1 $7.0 55 Yes
1 $2.9 49 Yes
1 $2.0 15 Yes
1 $22.7 200 Yes
1 $3.2 60 Yes
1 $6.2 80 Yes
1 $1.0 20 Yes
1 $42.0 420 Yes
1 $1.5 25 Yes
1 $5.1 50 Yes
1 $0.7 10 Yes
1 $2.8 35 Yes
1 $4.6 80 Yes
1 $5.0 80 Yes
1 $20.0 180 Yes
1 $12.7 120 Yes
1 $1.0 14 Yes
1 $30.0 250 Yes
2 $2,874.4 18,000 No
1 $1.9 24 Yes
1 $81.5 522 No
(continued)
A-5

Table A-1. Summary Data for Companies Reinforced Plastic Composite Facilities (continued)
Facilities Sales Small Company Name (#) ($106) Employment Business
Foremost Interiors Inc.
Formica Corporation
Fowler Mfg. Inc.
G. W. Fiberglass Inc.
Gencorp Inc.
General Electric Company
General Motors Corporation
Gesmar Corporation
GHM Inc.
Gibbon Fiberglass
Glas Master Inc.
Glasforms Inc.
Glasgo Plastics Inc.
Global Glass Inc.
1 $1.4 26 Yes
1 $338.0 3,284 No
1 $6.1 50 Yes
1 $38.1 375 Yes
2 $1,568.0 9,460 No
1 $90,840.0 276,000 No
1 $164,000.0 647,000 No
1 $4.1 50 Yes
1 $1.0 50 Yes
1 $1.2 18 Yes
2 $5.5 50 Yes
2 $11.0 110 Yes
1 $15.0 35 Yes
1 $8.2 90 Yes
Goodyear Tire & Rubber Company 1 $13,155.0 95,302 No
Gorman-Rupp Company
Gould Inc.
GPI Corporation
Gpm Industries, Inc.
Grayson Tool Company
Gruber Sys. Inc.
H & R Ind. Inc.
Harsco Corporation
Hartzell Fan Inc.
Hasbrouck Plastics Inc.
Hella North America Ltd
Hemco Corporation
1 $150.8 960 No
1 $157.4 1,500 No
1 NA NA Yes
1 $6.3 50 Yes
1 $2.5 35 Yes
1 $20.0 160 Yes
1 $5.7 45 Yes
1 $1,629.0 14,200 No
1 $38.0 250 Yes
1 $1.3 10 Yes
1 $68.7 550 No
1 $3.0 30 Yes
Henderson, Black and Green, Inc. 1 $17.5 NA Yes
Heritage Marble of Ohio Inc. 1 $2.4 25 Yes
(continued)
A-6
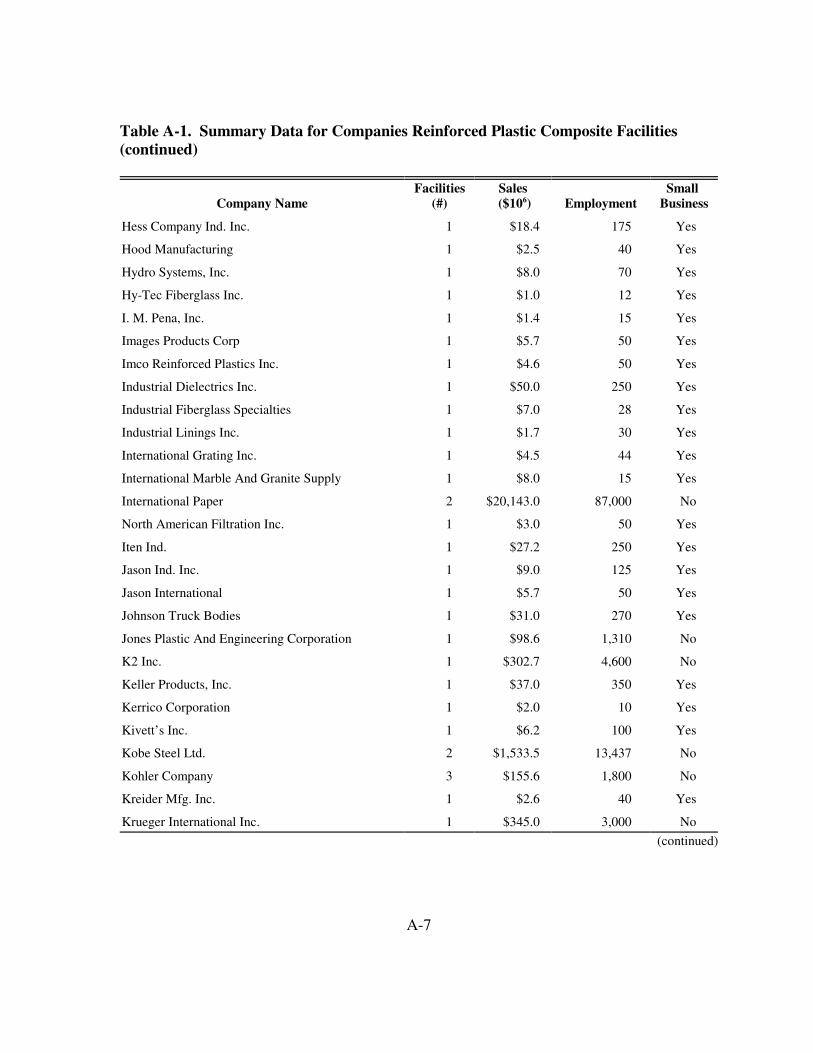
Table A-1. Summary Data for Companies Reinforced Plastic Composite Facilities (continued)
Facilities Sales Small Company Name (#) ($106) Employment Business
Hess Company Ind. Inc.
Hood Manufacturing
Hydro Systems, Inc.
Hy-Tec Fiberglass Inc.
I. M. Pena, Inc.
Images Products Corp
Imco Reinforced Plastics Inc.
Industrial Dielectrics Inc.
Industrial Fiberglass Specialties
Industrial Linings Inc.
International Grating Inc.
1 $18.4 175 Yes
1 $2.5 40 Yes
1 $8.0 70 Yes
1 $1.0 12 Yes
1 $1.4 15 Yes
1 $5.7 50 Yes
1 $4.6 50 Yes
1 $50.0 250 Yes
1 $7.0 28 Yes
1 $1.7 30 Yes
1 $4.5 44 Yes
International Marble And Granite Supply 1 $8.0 15 Yes
International Paper 2 $20,143.0 87,000 No
North American Filtration Inc. 1 $3.0 50 Yes
Iten Ind. 1 $27.2 250 Yes
Jason Ind. Inc. 1 $9.0 125 Yes
Jason International 1 $5.7 50 Yes
Johnson Truck Bodies 1 $31.0 270 Yes
Jones Plastic And Engineering Corporation 1 $98.6 1,310 No
K2 Inc. 1 $302.7 4,600 No
Keller Products, Inc. 1 $37.0 350 Yes
Kerrico Corporation 1 $2.0 10 Yes
Kivett’s Inc. 1 $6.2 100 Yes
Kobe Steel Ltd. 2 $1,533.5 13,437 No
Kohler Company 3 $155.6 1,800 No
Kreider Mfg. Inc. 1 $2.6 40 Yes
Krueger International Inc. 1 $345.0 3,000 No
(continued)
A-7
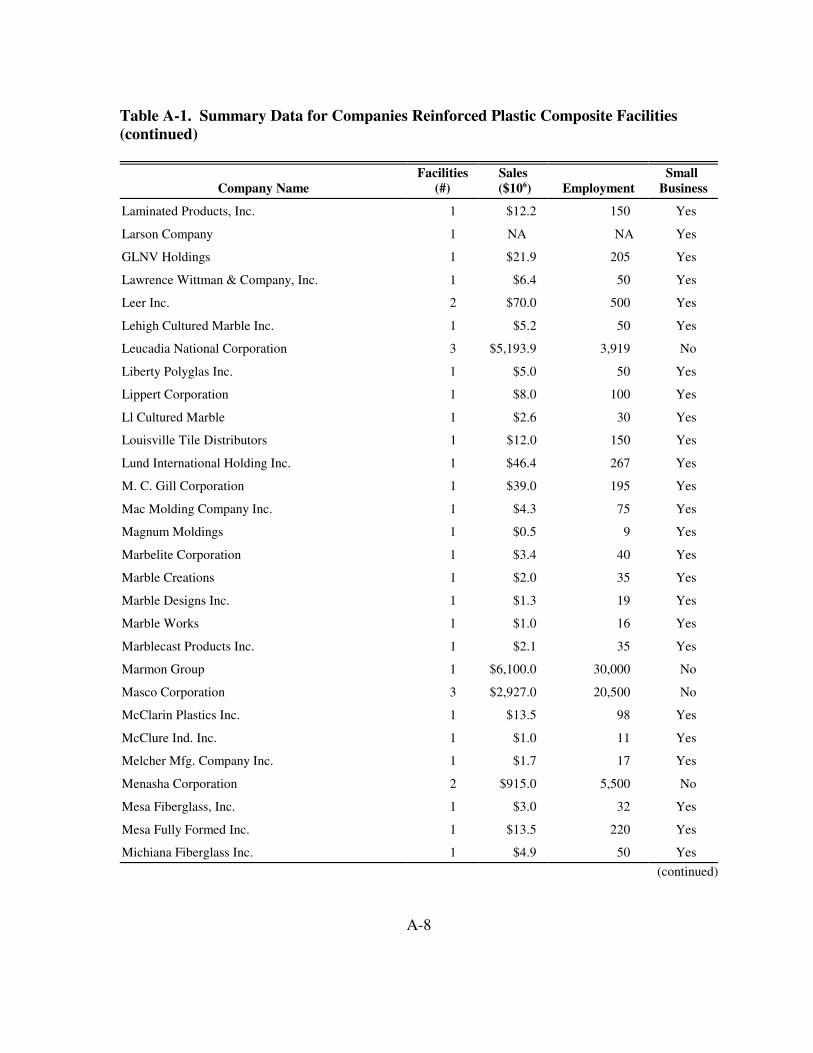
Table A-1. Summary Data for Companies Reinforced Plastic Composite Facilities (continued)
Facilities Sales Small Company Name (#) ($106) Employment Business
Laminated Products, Inc.
Larson Company
GLNV Holdings
Lawrence Wittman & Company, Inc.
Leer Inc.
Lehigh Cultured Marble Inc.
Leucadia National Corporation
Liberty Polyglas Inc.
Lippert Corporation
Ll Cultured Marble
Louisville Tile Distributors
Lund International Holding Inc.
M. C. Gill Corporation
Mac Molding Company Inc.
Magnum Moldings
Marbelite Corporation
Marble Creations
Marble Designs Inc.
Marble Works
Marblecast Products Inc.
Marmon Group
Masco Corporation
McClarin Plastics Inc.
McClure Ind. Inc.
Melcher Mfg. Company Inc.
Menasha Corporation
Mesa Fiberglass, Inc.
Mesa Fully Formed Inc.
Michiana Fiberglass Inc.
1 $12.2 150 Yes
1 NA NA Yes
1 $21.9 205 Yes
1 $6.4 50 Yes
2 $70.0 500 Yes
1 $5.2 50 Yes
3 $5,193.9 3,919 No
1 $5.0 50 Yes
1 $8.0 100 Yes
1 $2.6 30 Yes
1 $12.0 150 Yes
1 $46.4 267 Yes
1 $39.0 195 Yes
1 $4.3 75 Yes
1 $0.5 9 Yes
1 $3.4 40 Yes
1 $2.0 35 Yes
1 $1.3 19 Yes
1 $1.0 16 Yes
1 $2.1 35 Yes
1 $6,100.0 30,000 No
3 $2,927.0 20,500 No
1 $13.5 98 Yes
1 $1.0 11 Yes
1 $1.7 17 Yes
2 $915.0 5,500 No
1 $3.0 32 Yes
1 $13.5 220 Yes
1 $4.9 50 Yes
(continued)
A-8
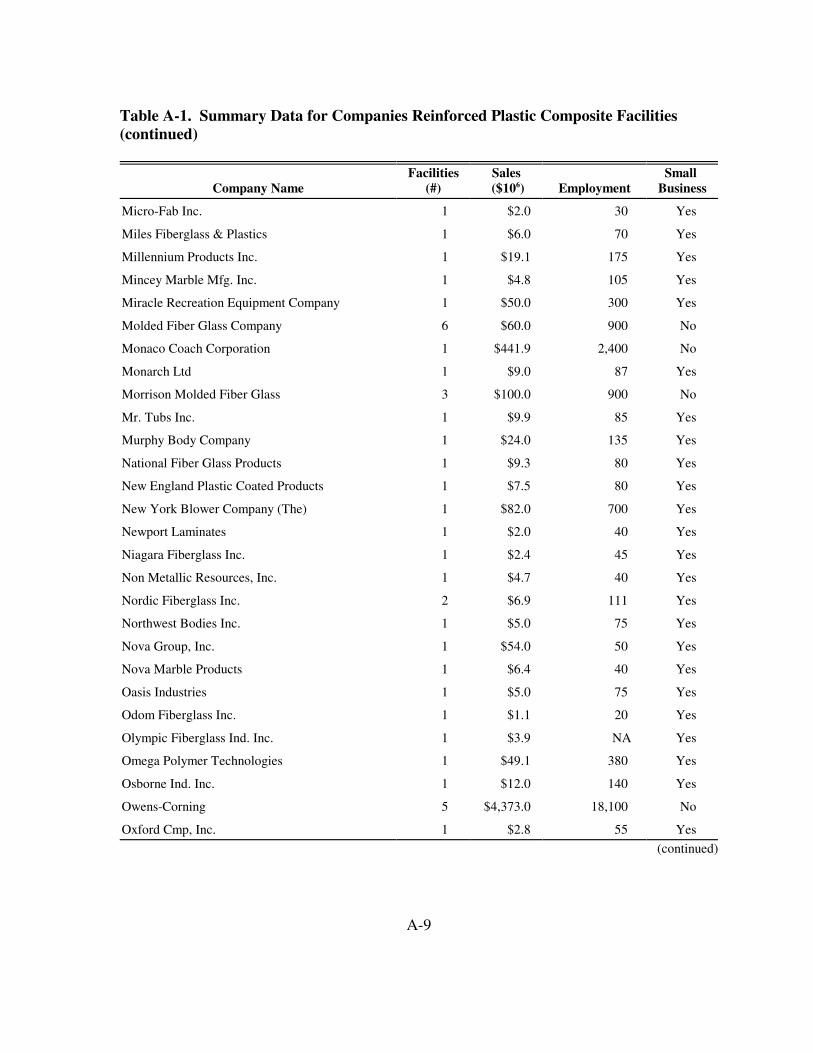
Table A-1. Summary Data for Companies Reinforced Plastic Composite Facilities (continued)
Facilities Sales Small Company Name (#) ($106) Employment Business
Micro-Fab Inc. 1 $2.0 30 Yes
Miles Fiberglass & Plastics 1 $6.0 70 Yes
Millennium Products Inc. 1 $19.1 175 Yes
Mincey Marble Mfg. Inc. 1 $4.8 105 Yes
Miracle Recreation Equipment Company 1 $50.0 300 Yes
Molded Fiber Glass Company 6 $60.0 900 No
Monaco Coach Corporation 1 $441.9 2,400 No
Monarch Ltd 1 $9.0 87 Yes
Morrison Molded Fiber Glass 3 $100.0 900 No
Mr. Tubs Inc. 1 $9.9 85 Yes
Murphy Body Company 1 $24.0 135 Yes
National Fiber Glass Products 1 $9.3 80 Yes
New England Plastic Coated Products 1 $7.5 80 Yes
New York Blower Company (The)
Newport Laminates
Niagara Fiberglass Inc.
Non Metallic Resources, Inc.
Nordic Fiberglass Inc.
Northwest Bodies Inc.
Nova Group, Inc.
Nova Marble Products
Oasis Industries
Odom Fiberglass Inc.
Olympic Fiberglass Ind. Inc.
Omega Polymer Technologies
Osborne Ind. Inc.
Owens-Corning
Oxford Cmp, Inc.
1 $82.0 700 Yes
1 $2.0 40 Yes
1 $2.4 45 Yes
1 $4.7 40 Yes
2 $6.9 111 Yes
1 $5.0 75 Yes
1 $54.0 50 Yes
1 $6.4 40 Yes
1 $5.0 75 Yes
1 $1.1 20 Yes
1 $3.9 NA Yes
1 $49.1 380 Yes
1 $12.0 140 Yes
5 $4,373.0 18,100 No
1 $2.8 55 Yes
(continued)
A-9
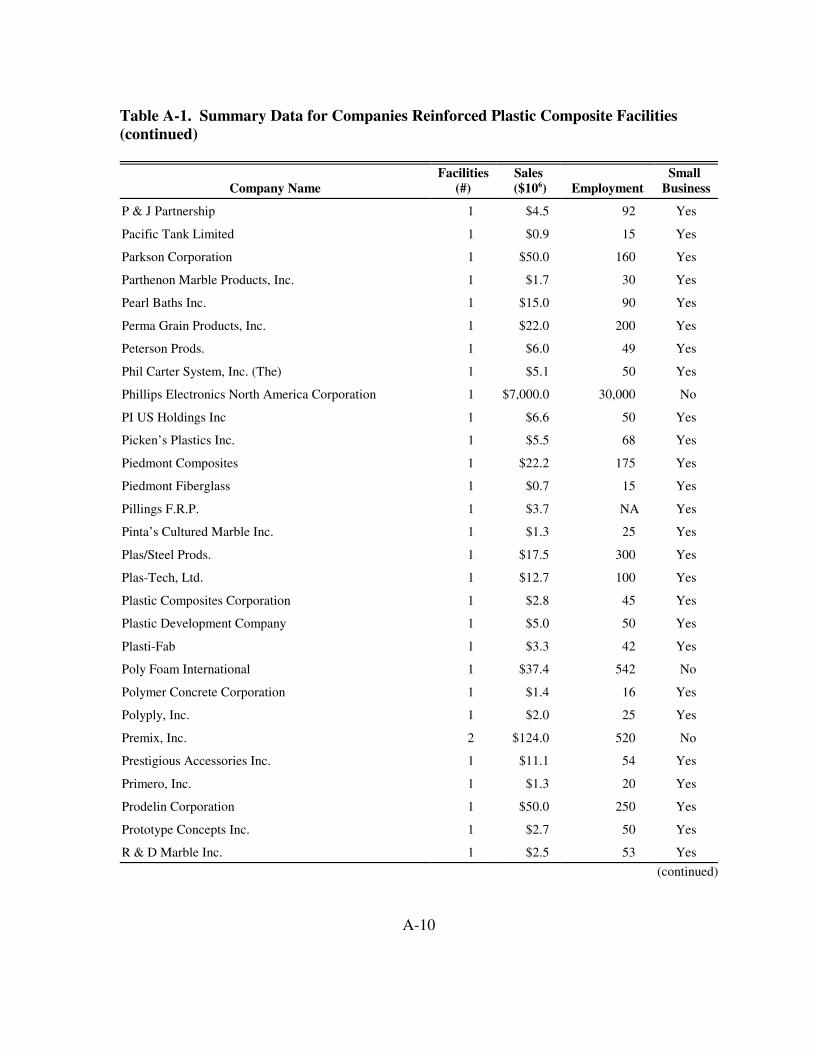
Table A-1. Summary Data for Companies Reinforced Plastic Composite Facilities (continued)
Facilities Sales Small Company Name (#) ($106) Employment Business
P & J Partnership
Pacific Tank Limited
Parkson Corporation
Parthenon Marble Products, Inc.
Pearl Baths Inc.
Perma Grain Products, Inc.
Peterson Prods.
Phil Carter System, Inc. (The)
1 $4.5 92 Yes
1 $0.9 15 Yes
1 $50.0 160 Yes
1 $1.7 30 Yes
1 $15.0 90 Yes
1 $22.0 200 Yes
1 $6.0 49 Yes
1 $5.1 50 Yes
Phillips Electronics North America Corporation 1 $7,000.0 30,000 No
PI US Holdings Inc
Picken’s Plastics Inc.
Piedmont Composites
Piedmont Fiberglass
Pillings F.R.P.
Pinta’s Cultured Marble Inc.
Plas/Steel Prods.
Plas-Tech, Ltd.
Plastic Composites Corporation
Plastic Development Company
Plasti-Fab
Poly Foam International
Polymer Concrete Corporation
Polyply, Inc.
Premix, Inc.
Prestigious Accessories Inc.
Primero, Inc.
Prodelin Corporation
Prototype Concepts Inc.
R & D Marble Inc.
1 $6.6 50 Yes
1 $5.5 68 Yes
1 $22.2 175 Yes
1 $0.7 15 Yes
1 $3.7 NA Yes
1 $1.3 25 Yes
1 $17.5 300 Yes
1 $12.7 100 Yes
1 $2.8 45 Yes
1 $5.0 50 Yes
1 $3.3 42 Yes
1 $37.4 542 No
1 $1.4 16 Yes
1 $2.0 25 Yes
2 $124.0 520 No
1 $11.1 54 Yes
1 $1.3 20 Yes
1 $50.0 250 Yes
1 $2.7 50 Yes
1 $2.5 53 Yes
(continued)
A-10
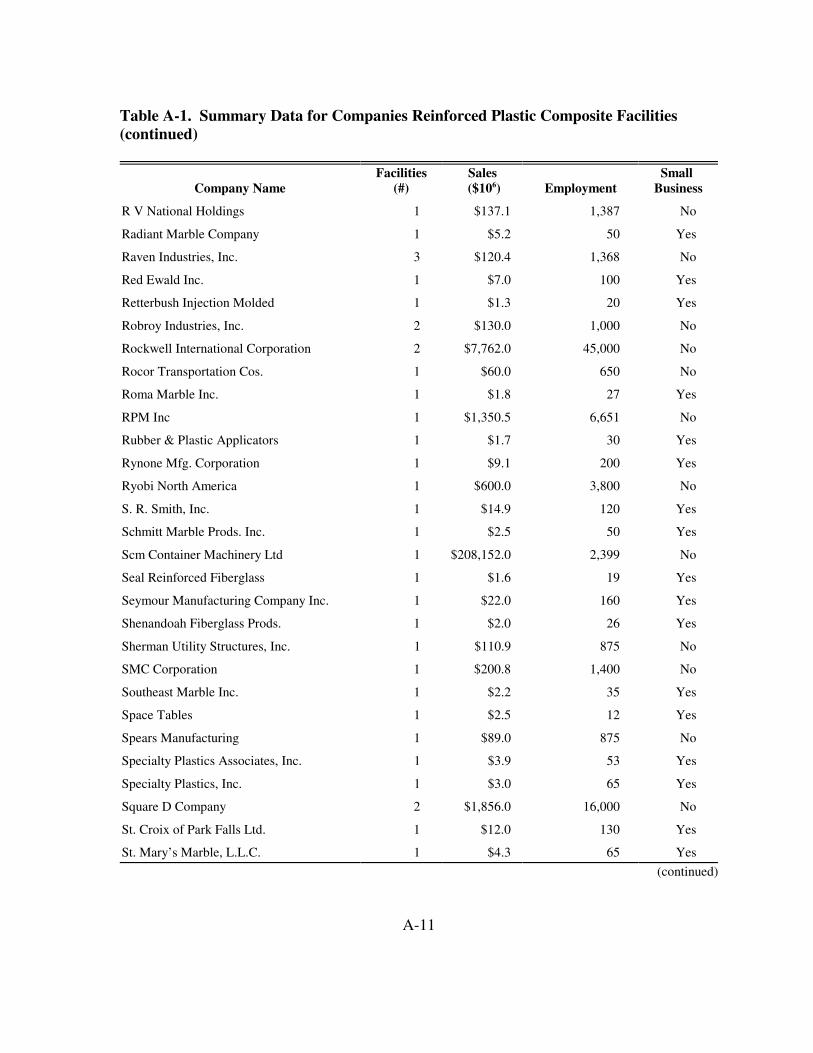
Table A-1. Summary Data for Companies Reinforced Plastic Composite Facilities (continued)
Company Name
R V National Holdings
Radiant Marble Company
Raven Industries, Inc.
Red Ewald Inc.
Retterbush Injection Molded
Robroy Industries, Inc.
Facilities Sales (#) ($106)
1 $137.1
1 $5.2
3 $120.4
1 $7.0
1 $1.3
Employment
1,387
50
1,368
100
20
1,000
45,000
650
27
6,651
30
200
3,800
120
50
2,399
19
160
26
875
1,400
35
12
875
53
65
16,000
130
65
Small Business
No
Yes
No
Yes
Yes
No
No
No
Yes
No
Yes
Yes
No
Yes
Yes
No
Yes
Yes
Yes
No
No
Yes
Yes
No
Yes
Yes
No
Yes
Yes
(continued)
Rockwell International Corporation
Rocor Transportation Cos.
Roma Marble Inc.
RPM Inc
Rubber & Plastic Applicators
Rynone Mfg. Corporation
Ryobi North America
S. R. Smith, Inc.
Schmitt Marble Prods. Inc.
Scm Container Machinery Ltd
Seal Reinforced Fiberglass
2 $130.0
2 $7,762.0
1 $60.0
1 $1.8
1 $1,350.5
1 $1.7
1 $9.1
1 $600.0
1 $14.9
1 $2.5
1 $208,152.0
1 $1.6
Seymour Manufacturing Company Inc. 1 $22.0
Shenandoah Fiberglass Prods.
Sherman Utility Structures, Inc.
SMC Corporation
Southeast Marble Inc.
Space Tables
Spears Manufacturing
Specialty Plastics Associates, Inc.
Specialty Plastics, Inc.
Square D Company
St. Croix of Park Falls Ltd.
St. Mary’s Marble, L.L.C.
1 $2.0
1 $110.9
1 $200.8
1 $2.2
1 $2.5
1 $89.0
1 $3.9
1 $3.0
2 $1,856.0
1 $12.0
1 $4.3
A-11
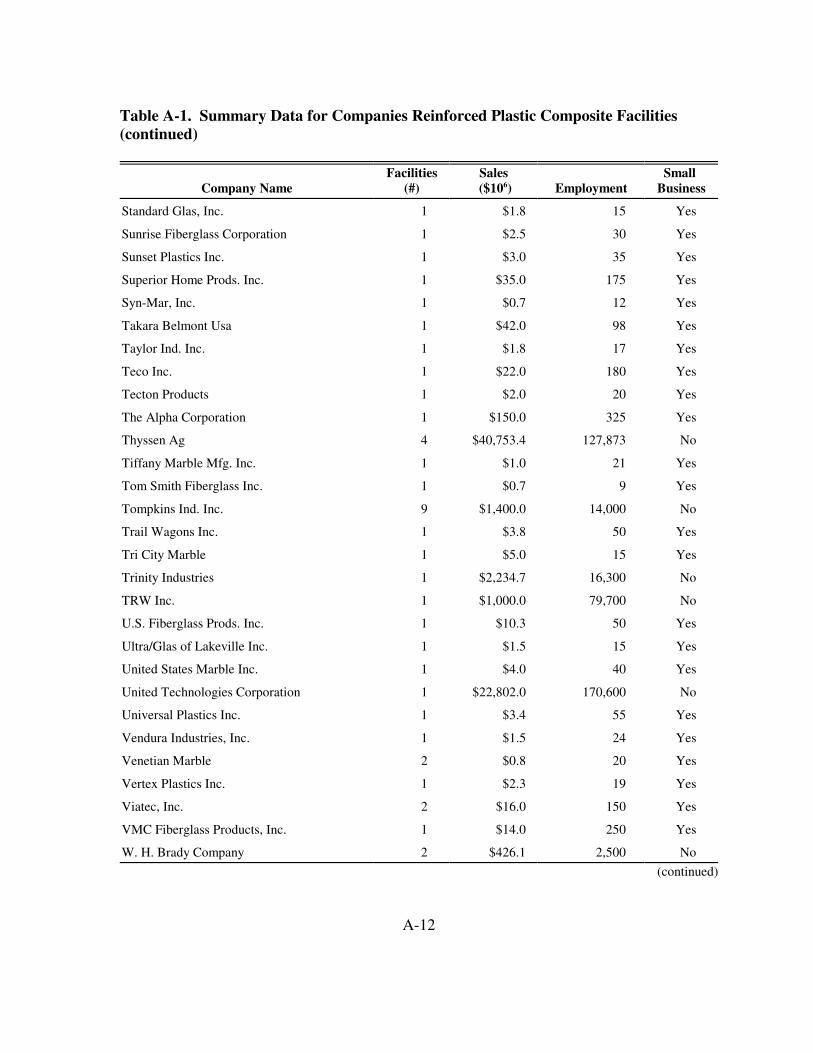
Table A-1. Summary Data for Companies Reinforced Plastic Composite Facilities (continued)
Facilities Sales Small Company Name (#) ($106) Employment Business
Standard Glas, Inc.
Sunrise Fiberglass Corporation
Sunset Plastics Inc.
Superior Home Prods. Inc.
Syn-Mar, Inc.
Takara Belmont Usa
Taylor Ind. Inc.
Teco Inc.
Tecton Products
The Alpha Corporation
Thyssen Ag
Tiffany Marble Mfg. Inc.
Tom Smith Fiberglass Inc.
Tompkins Ind. Inc.
Trail Wagons Inc.
Tri City Marble
Trinity Industries
TRW Inc.
U.S. Fiberglass Prods. Inc.
Ultra/Glas of Lakeville Inc.
United States Marble Inc.
United Technologies Corporation
Universal Plastics Inc.
Vendura Industries, Inc.
Venetian Marble
Vertex Plastics Inc.
Viatec, Inc.
VMC Fiberglass Products, Inc.
W. H. Brady Company
1 $1.8 15 Yes
1 $2.5 30 Yes
1 $3.0 35 Yes
1 $35.0 175 Yes
1 $0.7 12 Yes
1 $42.0 98 Yes
1 $1.8 17 Yes
1 $22.0 180 Yes
1 $2.0 20 Yes
1 $150.0 325 Yes
4 $40,753.4 127,873 No
1 $1.0 21 Yes
1 $0.7 9 Yes
9 $1,400.0 14,000 No
1 $3.8 50 Yes
1 $5.0 15 Yes
1 $2,234.7 16,300 No
1 $1,000.0 79,700 No
1 $10.3 50 Yes
1 $1.5 15 Yes
1 $4.0 40 Yes
1 $22,802.0 170,600 No
1 $3.4 55 Yes
1 $1.5 24 Yes
2 $0.8 20 Yes
1 $2.3 19 Yes
2 $16.0 150 Yes
1 $14.0 250 Yes
2 $426.1 2,500 No
(continued)
A-12

Table A-1. Summary Data for Companies Reinforced Plastic Composite Facilities (continued)
Facilities Sales Small Company Name (#) ($106) Employment Business
Walnut Investigation Company
Warminster Fiberglass Company
Wayne Mfg Company
Werner Ladder Company
Western Recreational Vehicles, Inc.
Wexco, Inc.
William Kreysler & Associates, Inc.
Wilson Marble Company
Xenon Company, Inc.
Xerxes
Yankee Plastic Company
Zane’s Fiberglass Shop, Inc.
Zehrco Plastics, Inc.
1 $6.3 50 Yes
2 $7.0 100 Yes
1 $6.0 150 Yes
1 $253.1 2,700 No
1 $20.0 400 Yes
1 $46.1 275 Yes
1 $2.0 20 Yes
1 $0.8 20 Yes
1 $1.0 9 Yes
7 $54.0 493 Yes
1 $0.8 8 Yes
1 $5.7 50 Yes
2 $20.1 190 Yes
438 $763,429.6 2,126,586 279
NA = not available
Sources: American Business Information (ABI). 1999. American Business Disc [computer file]. Disclosure Inc. 1998. Worldscope [computer file]. Bethesda, MD: Disclosure Inc.. Dun & Bradstreet. 1998. Dun’s Market Identifiers [computer file]. New York, NY: Dialog Corporation. Dun & Bradstreet. 1999. Million Dollar Directory: America’s Leading Public and Private Companies. Bethlehem, PA: Dun & Bradstreet Corporation. Gale Research, Inc. 1998. Ward’s Business Directory of U.S. Private and Public Companies. Detroit, MI. Gale Research, Inc. Gale Research, Inc. 1996. Manufacturing USA. Detroit, MI. Gale Research, Inc. Information Access Corporation. 1998. Business & Company ProFile [computer file]. Foster City, CA: Information Access Corporation. Selected Company 10-K Reports.
A-13
Appendix B
Economic Model of the Merchant Sector of the U.S. Reinforced Plastic Composites Industry

Implementation of the proposed NESHAP will affect the costs of production in the U.S. RPC industry for producers that use thermoset resins. Responses at the facility level to these additional costs collectively determine the market impacts of the regulation. Specifically, the cost of the regulation may induce some facilities to alter their current level of production or even to close. These choices affect, and in turn are affected by, the market price for each product. The economic impact analysis employs standard concepts in microeconomics to model the supply of each product and the impacts of the regulation on production costs and the output decisions of merchant facilities.1 The main elements of the analysis are as follows:
� characterize production of each product at the individual facility and market levels,
� characterize demand for each product, and
� develop the solution algorithm to determine the with-regulation equilibrium.
The following sections provide the supply and demand specifications for each product market as implemented in the EIA model and summarize the model’s solution algorithm.
B.1 Supply of Reinforced Plastics Products
Cost curves were constructed for each product line at existing RPC facilities using thermosetting resins. Facilities using thermoplastic resins are not subject to the proposed regulations and are treated as an aggregate producer. Therefore, for a particular end-use market, the market supply of RPCs can be expressed as
Qs = qD + qI. (B.1)
where qD is the supply from directly affected thermosetting facilities and qI is the supply from indirectly affected thermosetting and thermoplastic facilities.
B.1.1 Thermosetting Facilities (qD) (Directly Affected)
Existing merchant producers of RPCs have the ability to vary output in the face of production cost changes. Economic theory provides the rationale for believing that supply functions for existing suppliers are upward sloping. For this analysis, the generalized Leontief technology is assumed to characterize the production of RPCs at each facility. This technology is appropriate given the fixed-proportion material inputs (resins, filler, and reinforcements) and the primary variable-proportion inputs of labor and energy. Applying
1 As noted in Section 4, the impact of the regulation on captive producers is determined through a full-cost absorption approach that does not incorporate market changes and results in profits being reduced by the estimated compliance costs for these producers.
B-1
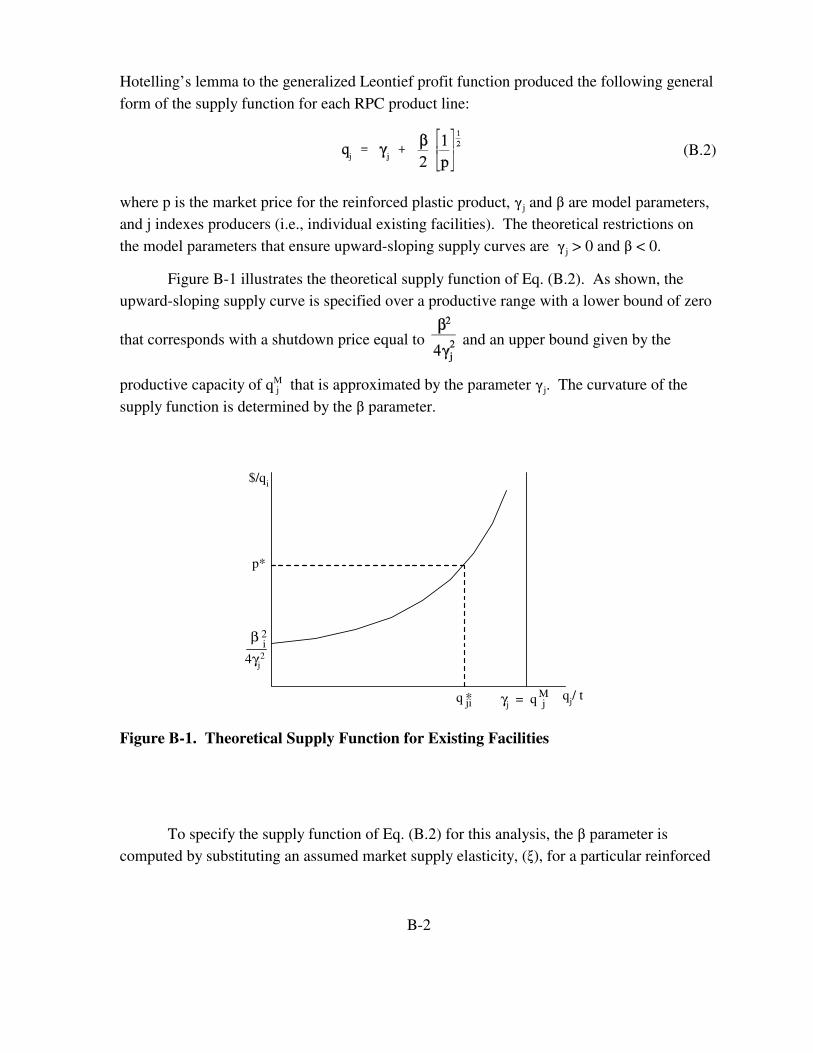
Hotelling’s lemma to the generalized Leontief profit function produced the following general form of the supply function for each RPC product line:
(B.2)
p*
q
β i 4γj
2
qj/ t
$/qi
* ji
2
γj = j M
Figure B-1. oretical Supply Function for Existing Facilities
where p is the market price for the reinforced plastic product, �j and � are model parameters, and j indexes producers (i.e., individual existing facilities). theoretical restrictions on the model parameters that ensure upward-sloping supply curves are �j > 0 and � < 0.
Figure B-1 illustrates the theoretical supply function of Eq. (B.2). upward-sloping supply curve is specified over a productive range with a lower bound of zero
that corresponds with a shutdown price equal to and an upper bound given by the
productive capacity of qM j that is approximated by the parameter �j.
supply function is determined by the � parameter.
To specify the supply function of Eq. (B.2) for this analysis, the � parameter is computed by substituting an assumed market supply elasticity, (�), for a particular reinforced
q
The
The
As shown, the
The curvature of the
B-2
plastic product, the market price of the product (p), and the production-weighted average annual production level of existing facilities (q) into the following equation:2
2 Equation B.3 is determined by 1) taking the derivative of the supply function (B.2) with respect to price, 2) multiplying the expression by p/q to yield a term for the supply elasticity, and 3) solve the resulting equation for the � parameter.
B-3
(B.3)
(B.4)
Absent literature estimates, the market-level supply elasticities were assumed to be 1 (unitary elasticity) (i.e., a 1 percent change in price leads to a 1 percent change in output). market prices of each product were derived as described in Section 4, and the average annual production level of each product for each facility was derived from the facility database. � parameter for each product was calculated by incorporating these values into Eq. (B.3).
The parameter, �j, approximates the productive capacity and varies across product lines at each facility. does not influence the facility’s production responsiveness to price changes as does the � parameter. hus, the parameter �j was used to calibrate the model so that each existing facility’s supply equation is consistent with the baseline production data.
Production decisions at the individual facilities are affected by the total annual variable compliance costs, cj, which are expressed per pound of reinforced plastics product. Each supply equation will be directly affected by these regulatory control costs, which enter as a net price change (i.e., pj - cj). ulation the supply function for each existing facility from Eq. (B.2) above becomes:
The total annual variable compliance costs per pound are projected given the annual production per facility and the regulatory cost estimates for each facility provided by the engineering analysis.
In evaluating the impacts of the proposed rule, we shift the individual supply curves by the variable portion of the compliance costs and then evaluate the closure decision with
The 1997
The
This parameter T
Thus, with the reg
the total compliance costs (fixed, or annual capital, costs plus variable costs associated with new production level). Therefore, our modeling approach addresses the economic viability of the product-line and evaluates whether it continues to cover variable costs with regulation as well as the economic viability of the plant and evaluates whether it continues to cover total costs (variable plus fixed) with regulation.
In order to evaluate the economic viability of the plant, the Agency determined baseline estimates of variable and fixed production costs. As noted above, applying the supply function specification to each directly affected producer generates an estimate of production, or variable, costs by taking the integral of the area under the curve corresponding to their production rate and market price. Lacking direct information from each facility, to approximate plant-level fixed costs, the Agency applied an industry average profit rate of 4.4 percent for each facility.3 Thus, fixed costs at each facility i were then derived as:
Fixed Costsi = Salesi - Variable Costsi - Profitsi
where Profitsi = 4.4% * Salesi. Given this baseline characterization of each facility, the Agency evaluated their economic viability with regulation and predicted a facility closures if profits were not positive, i.e., total revenues did not exceed total production costs and total regulatory costs.
B.1.2 Thermosetting and Thermoplastic Facilities (qI) (Indirectly Affected)
Because this industry segment is not directly affected by the regulation it was not necessary to model their supply at an individual facility level as was necessary for directly affected thermosetting facilities. EPA specified a single representative function to express the supply of RPCs from indirectly affected facilities, which allows them to increase their production in response to higher prices, i.e.,
(B.5)
where qI is the quantity supplied from indirectly unaffected facilities, AI is a positive constant, and �I is the supply elasticity. Absent literature or econometric estimates, the supply elasticity was assumed to have a value of one. The multiplicative supply parameter,
3 As applied for this analysis, this rate reflects the maximum profit rate for an individual facility, i.e., a threshold level of profitability. Those facilities whose total revenue minus production costs resulted in a return of less than 4.4 percent of revenues used the lower rate for determination of economic viability or regulation induced closure.
B-4
(B.6)
AI, is determined for each product by back solving Eq. (B.5) given the supply elasticity and baseline values for the market price and quantity supplied in each market segment.
The resulting RPC products from these facilities are modeled as perfect substitutes for RPC products from thermosetting facilities. supply at the same price for each end-use market which serves to dampen the ability of the directly affected producers to increase prices in response to regulation. lthough it may be more appropriate to model as imperfect substitutes with cross-price elasticities, the Agency did not have sufficient information to provide those model parameters and chose an option that would be a worst-case scenario for affected industry segment (i.e., conservative modeling approach).
B.2 Demand for Reinforced Plastics Products
A single equation expresses the demand for each reinforced plastic composites product,
where QD is the quantity demanded, BD is a positive constant, and �D is the demand elasticity. Absent literature or econometric estimates, the demand elasticity was assumed to have a value of –0.5. tive demand parameter, BD, was determined for each product by back solving Eq. (B.6) given the demand elasticity and baseline values for the market price and quantity demanded in each market segment.
B.3 With-Regulation Market Equilibrium Determination
Facility responses and market adjustments can be conceptualized as an interactive process. ace increased production costs due to compliance, which causes facility-specific production responses (i.e., output reduction). mulative effect of these responses leads to an increase in the market price that all producers (directly and indirectly affected) and consumers face, which leads to further responses by producers (directly and indirectly affected) as well as consumers and thus new market prices, and so on. equilibrium after imposing the regulation is the result of a series of iterations between producer and consumer responses and market adjustments until a stable market price arises where total market supply equals total market demand, that is QS = QD .
The algorithm for deriving the post-compliance equilibria in all markets can be generalized to five recursive steps:
Therefore, they
A
The multiplica
Facilities fThe cu
The new
B-5
1) Impose the control costs on each affected facility, thereby shifting inward their supply curve and reducing their production level at the given market price.
2) Recalculate the market supply of each reinforced plastic product by horizontal summation across all suppliers.
3) Determine the new prices for all product markets.
4) Recalculate the supply functions of all facilities with the new prices, resulting in a new market supply of each product. Evaluate market demand at the new prices.
5) Go to Step 3, resulting in new prices for each product. Repeat until equilibrium conditions are satisfied in all markets.
B.4 Economic Welfare Impacts
The economic welfare implications of the market price and output changes with the regulation can be examined using two slightly different tactics, each giving a somewhat different insight but the same implications: changes in the net benefits of consumers and producers based on the price changes and changes in the total benefits and costs of these products based on the quantity changes. This analysis focuses on the first measure—the changes in the net benefits of consumers and producers. Figure B-2 depicts the change in economic welfare by first measuring the change in consumer surplus and then the change in producer surplus. In essence, the demand and supply curves previously used as predictive devices are now being used as a valuation tool.
This method of estimating the change in economic welfare with the regulation divides society into consumers and producers. In a market environment, consumers and producers of the good or service derive welfare from a market transaction. The difference between the maximum price consumers are willing to pay for a good and the price they actually pay is referred to as “consumer surplus.” Consumer surplus is measured as the area under the demand curve and above the price of the product. Similarly, the difference between the minimum price producers are willing to accept for a good and the price they actually receive is referred to as “producer surplus” or profits. Producer surplus is measured as the area above the supply curve and below the price of
B-6
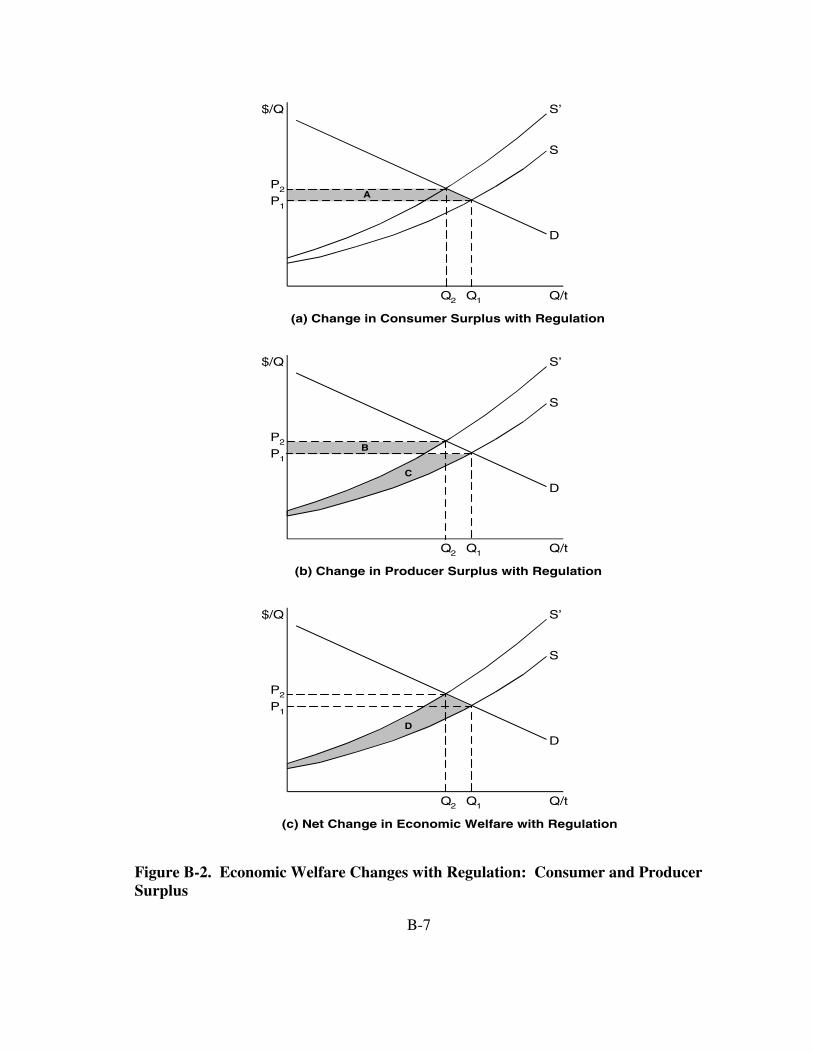
$/Q
S
S’
D
A P2
P1
Q2 Q1 Q/t
(a) Change in Consumer Surplus with Regulation
$/Q
P2
P1
S
S’
D
B
C
Q2 Q1 Q/t
(b) Change in Producer Surplus with Regulation
$/Q
P2
P1
S
S’
D D
Q2 Q1 Q/t
(c) Net Change in Economic Welfare with Regulation
Figure B-2. Economic Welfare Changes with Regulation: Consumer and Producer Surplus
B-7
the product. These areas can be thought of as consumers’ net benefits of consumption and producers’ net benefits of production, respectively.
In Figure B-2, baseline equilibrium occurs at the intersection of the demand curve, D, and supply curve, S. Price is Pl with quantity Ql. The increased cost of production with the regulation will cause the market supply curve to shift upward to S�. The new equilibrium price of the product is P2. With a higher price for the product, there is less consumer welfare, all else being unchanged as real incomes are reduced. In Figure B-2(a), area A represents the dollar value of the annual net loss in consumers’ benefits with the increased price. The rectangular portion represents the loss in consumer surplus on the quantity still consumed, Q2, while the triangular area represents the foregone surplus resulting from the reduced quantity consumed, Ql–Q2.
In addition to the changes in consumer welfare, producer welfare also changes with the regulation. With the increase in market price, producers receive higher revenues on the quantity still purchased, Q2. In Figure B-2(b), area B represents the increase in revenues due to this increase in price. The difference in the area under the supply curve up to the original market price, area C, measures the loss in producer surplus, which includes the loss associated with the quantity no longer produced. The net change in producer welfare is represented by area B–C.
The change in economic welfare attributable to the compliance costs of the regulation is the sum of consumer and producer surplus changes, that is, – (A) + (B–C). Figure B-2(c) shows the net (negative) change in economic welfare associated with the regulation as area D. However, this analysis does not include the benefits that occur outside the market (i.e., the value of the reduced levels of air pollution with the regulation). Including this benefit may reduce the net cost of the regulation or even make it positive.
B-8
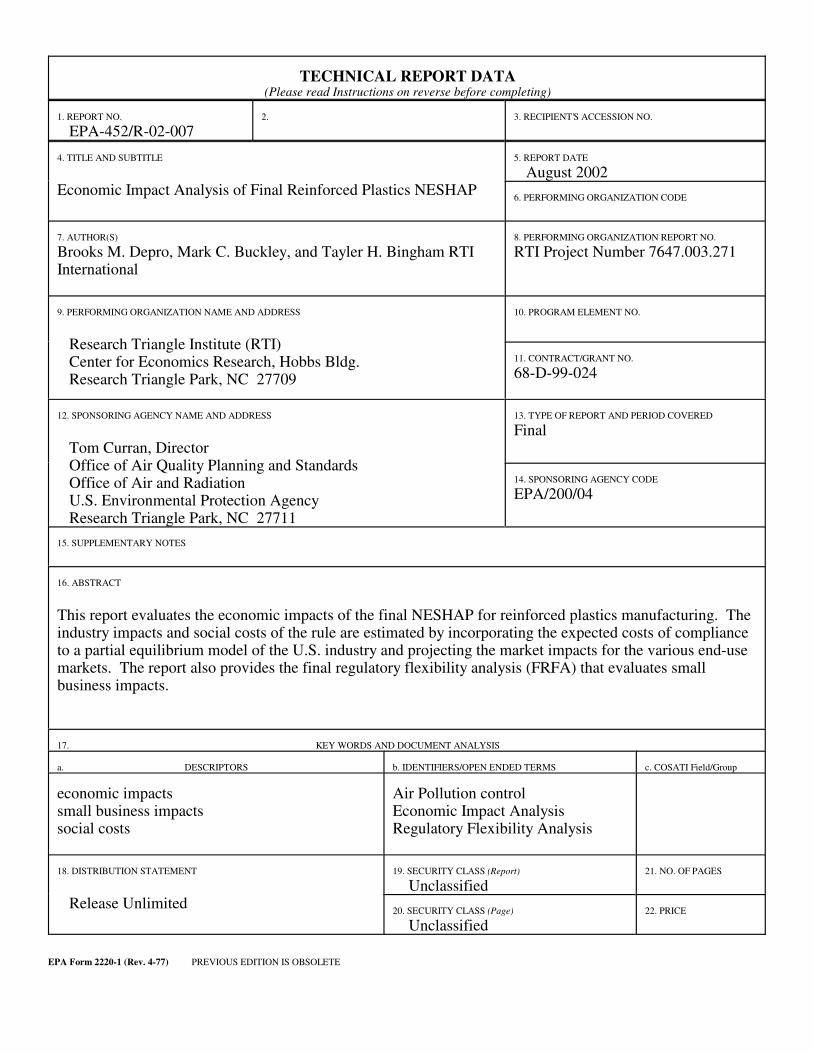
TECHNICAL REPORT DATA (Please read Instructions on reverse before completing)
1. REPORT NO.
EPA-452/R-02-007 2. 3. RECIPIENT’S ACCESSION NO.
4. TITLE AND SUBTITLE
Economic Impact Analysis of Final Reinforced Plastics NESHAP
5. REPORT DATE
August 2002
6. PERFORMING ORGANIZATION CODE
7. AUTHOR(S)
Brooks M. Depro, Mark C. Buckley, and Tayler H. Bingham RTI International
8. PERFORMING ORGANIZATION REPORT NO.
RTI Project Number 7647.003.271
9. PERFORMING ORGANIZATION NAME AND ADDRESS
Research Triangle Institute (RTI) Center for Economics Research, Hobbs Bldg. Research Triangle Park, NC
10. PROGRAM ELEMENT NO.
11. CONTRACT/GRANT NO.
68-D-99-024
12. SPONSORING AGENCY NAME AND ADDRESS
Tom Curran, Director Office of Air Quality Planning and Standards
13. TYPE OF REPORT AND PERIOD COVERED
Final
27709
Office of Air and Radiation U.S. Environmental Protection Agency Research Triangle Park, NC
14. SPONSORING AGENCY CODE
EPA/200/04
27711
15. SUPPLEMENTARY NOTES
16. ABSTRACT
This report evaluates the economic impacts of the final NESHAP for reinforced plastics manufacturing. The industry impacts and social costs of the rule are estimated by incorporating the expected costs of compliance to a partial equilibrium model of the U.S. industry and projecting the market impacts for the various end-use markets. report also provides the final regulatory flexibility analysis (FRFA) that evaluates small business impacts.
17. KEY WORDS AND DOCUMENT ANALYSIS
The
a. DESCRIPTORS b. IDENTIFIERS/OPEN ENDED TERMS c. COSATI Field/Group
economic impacts small business impacts social costs
Air Pollution control Economic Impact Analysis Regulatory Flexibility Analysis
18. DISTRIBUTION STATEMENT
Release Unlimited
19. SECURITY CLASS (Report)
Unclassified 21. NO. OF PAGES
20. SECURITY CLASS (Page)
Unclassified 22. PRICE
EPA Form 2220-1 (Rev. 4-77) PREVIOUS EDITION IS OBSOLETE

Pub
lica
tion
No.
EP
A 4
52/R
-02-
007
Aug
ust 2
002
Off
ice
of A
ir Q
uali
ty P
lann
ing
and
Sta
ndar
ds
Air
Qua
lity
Stra
tegi
es a
nd S
tand
ards
Div
isio
n R
esea
rch
Tri
angl
e P
ark,
NC
E
nvir
onm
enta
l Pro
tect
ion
Uni
ted
Stat
es
Age
ncy