ceria-based nanocomposite electrolyte for low-temperature ...278472/fulltext01.pdf · nanocomposite...
TRANSCRIPT

Ceria-based Nanocomposite Electrolyte for
Low-Temperature Solid Oxide Fuel cells
Ying Ma
Licentiate Thesis
Stockholm 2009
Division of Functional Materials
School of Information and Communication Technology
Royal Institute of Technology
Postal address Division of Functional Materials
School of Information and
Communication Technology
Royal Institute of Technology
Electrum 229
Isafjordsgatan 22
SE 164 40, Kista, Sweden
Supervisor Prof. Mamoun Muhammed
Email: [email protected]
Co-Supervisor Dr. Bin Zhu
Email: [email protected]
TRITA-ICT/MAP AVH Report 2009:11 ISSN 1653-7610 ISRN KTH/ICT-MAP/AVH-2009:11-SE ISBN 978-91-7415-497-9 © Ying Ma, 2009
Universitetsservice US AB, Stockholm 2009

Functional Materials Division, KTH, 2009 i
Abstract
Solid oxide fuel cells (SOFCs) have attracted much attention because of their potential of providing an efficient, environmentally benign, and fuel-flexible power generation system for both small power units and for large scale power plants. However, conventional SOFCs with yttria-stabilized zirconia (YSZ) electrolyte require high operation temperature (800-1000°C), which presents material degradation problems, as well as other technological complications and economic obstacles. Therefore, numerous efforts have been made to lower the operating temperature of SOFCs. The discovery of new electrolytes for low-temperature SOFCs (LTSOFCs) is a grand challenge for the SOFC community.
Nanostructured materials have attracted great interest for many different applications, due to their unusual or enhanced properties compared with bulk materials. As an example of enhanced property of nanomaterials, the enhancement of ionic conductivity in the nanostructured solid conductors, known as “nanoionics”, recently become one of the hottest fields of research related to nanomaterials, since they can be used in advanced energy conversion and storage applications, such as SOFC. So in this thesis, we are aiming at developing a novel nanocomposite approach to design and fabricate ceria-based composite electrolytes for LTSOFC. We studied two ceria-based nanocomposite systems with different SDC morphologies.
In the first part of the thesis, novel core-shell SDC/amorphous Na2CO3 nanocomposite was fabricated for the first time. The core-shell nanocomposite particles are smaller than 100 nm with amorphous Na2CO3 shell of 4~6 nm in thickness. The nanocomposite electrolyte shows superionic conductivity above 300 °C, where the conductivity reaches over 0.1 S cm-1. The thermal stability of such nanocomposite has also been studied based on careful XRD, BET, SEM and TGA characterization after annealing samples at various temperatures, which indicated that the SDC/Na2CO3 nanocomposite possesses better thermal stability on nanostructure than pure SDC. Such nanocomposite was applied in LTSOFCs with an excellent performance of 0.8 W cm-2 at 550 °C. The high performances together with notable thermal stability make the SDC/Na2CO3 nanocomposite as a potential electrolyte material for long-term SOFCs that operate at 500-600 °C.
In the second part of the thesis, we report a novel chemical synthetic route for the synthesis of samarium doped ceria (SDC) nanowires by homogeneous precipitation of lanthanide citrate complex in aqueous solutions as precursor followed by calcination. The method is template-, surfactant-free and can produce large quantities at low costs. To stabilize these SDC nanowires at high operation temperature, we employed the concept of “nanocomposite” by adding a secondary phase of Na2CO3, as inclusion which effectively hindered the grain growth of nanostructures. The SDC nanowires/Na2CO3 composite was compacted and sintered together with electrode materials, and was then tested for SOFCs performance. It is demonstrated that SOFCs using such SDC nanowires/Na2CO3 composite as electrolyte exhibited better performance compared with state-of-the-art SOFCs using conventional bulk ceria-based materials as electrolytes.

ii

Functional Materials Division, KTH, 2009 iii
LIST OF PAPERS
This thesis is based on following publications:
1. Ying Ma; Xiaodi Wang; Shanghua Li; Muhammet S. Toprak; Bin Zhu and Mamoun
Muhammed “Samarium-Doped Ceria Nanowires: Novel Synthesis and Application in
Low-temperature Solid Oxide Fuel Cells” Accepted for publication in Advanced
Materials
2. Ying Ma; Xiaodi Wang; Rizwan Raza; Mamoun Muhammed and Bin Zhu “Thermal
stability study of SDC/Na2CO3 nanocomposite electrolyte for low temperature SOFCs”
International Journal of Hydrogen Energy 2009, In press. doi:10.1016/j.ijhydene.200
9.03.052
3. Xiaodi Wang; Ying Ma; Rizwan Raza; Mamoun Muhammed and Bin Zhu “Novel
core-shell SDC/amorphous Na2CO3 nanocomposite electrolyte for low-temperature
SOFCs” Electrochemistry Communications 2008, 10 (11), 1617-1620
Other work not included:
1. Rizwan Raza; Ying Ma; Xiaodi Wang; Gao Zhan; Xiangrong Liu and Bin Zhu “Study
on nanocomposites based on carbonate@ceria” Accepted for publication in Journal of
Nanoscience and Naotechnology
2. Xiaodi Wang; Ying Ma; Mamoun Muhammed and Bin Zhu “On proton and oxygen
co-ion conduction behavior in SDC/Na2CO3 nanocomposite”, Manuscript

iv
Conference presentations
4. Ying Ma; Xiaodi Wang; Bin Zhu; Mamoun Muhammed "A Novel Chemical Route to
Synthesize CeO2 nanowires" (oral) 9th International Conference on Nanostructured
Materials, June 2-6, 2008, Rio de Janeiro/Brazil
5. Xiaodi Wang; Ying Ma; Bin Zhu; Mamoun Muhammed "A Novel Fabrication of
Nanochannels Metal Membrane" (oral) 9th International Conference on Nanostructured
Materials, June 2-6, 2008, Rio de Janeiro/Brazil
6. Ying Ma; Xiaodi Wang; Bin Zhu; Mamoun Muhammed "A Novel Chemical Synthesis of SDC
Nanowires - Low Temperature SOFC Electrolyte" (oral) HyForum 2008 - International
Hydrogen Forum, August 3-6, 2008, Changsha/China
7. Rizwan Raza; Ying Ma; Xiaodi Wang; Bin Zhu "Study on Nanocomposites based on
Carbonate @ Ceria" (oral) 3rd International Conference on Surfaces, Coating and
Nanostructured Materials (NanoSMat 2008), October 21-24, 2008, Barcelona/ Spain
8. Rizwan Raza; Zhan Gao; Ying Ma; Xiaodi Wang; Bin Zhu "Co-Doped SDC based
Nanocomposite Electrolytes” (oral) 3rd International Meeting on Developments in Materials,
Processes and Applications of Emerging Technologies (MPA-2009), July 21-23, 2009,
Manchester/United Kingdom

Functional Materials Division, KTH, 2009 v
Contributions of the author
Paper 1. Planning and performing the experiments, characterization of the samples, and
writing main parts of the manuscript.
Paper 2. Planning and performing all synthetic work, parts of characterization work,
evaluation of the results and writing main parts of the manuscript.
Paper 3. Participate in developing the idea, performing parts of the experiments, writing
parts of the manuscript.

vi
ABBREVIATIONS AND SYMBOLS
AFC Alkaline fuel cell
BET Brunauer−Emmett−Teller method
CeCit Cerium citrate
DCO Doped ceria DSC Differential scanning calorimetry
EDX Energy-dispersive X-rays analysis
EELS Electron energy loss spectroscopy
EIS Electrochemical impedance spectroscopy
FC Fuel cell FE-SEM Field-emission scanning electron microscope
GDC Gadolinium doped ceria
H3Cit Citric acid HRTEM High-resolution transmission electron microscopy
HTSOFC High-temperature solid oxide fuel cell
ITSOFC Intermediate-temperature solid oxide fuel cell
LSCF La1-xSrxCo1-yFeyO3-δ
LSGM La0.9Sr0.1Ga0.8Mg0.2O2.85
LSM La1-xSrxMnO3
LTSOFC Low-temperature solid oxide fuel cell
MCFC Molten carbonate fuel cell
MIECs Mixed ionic and electronic conductors
PAFC Phosphoric acid fuel cell
PEMFC Proton exchange membrane fuel cell
Rb Bulk resistance
Rgb Grain boundary resistance
SAED Selective area electron diffraction
SDC Samarium doped ceria
SOFC Solid oxide fuel cell
SSZ Scandia-stabilized zirconia
TEC Thermal expansion coefficient
TEM Transmission electron microscopy
TGA Thermogravimetric analysis
XRD X-ray diffraction
YDC Yttrium doped ceria
YSZ Yttria-stabilized zirconia
σb Bulk conductivity
σgb Grain boundary conductivity

Functional Materials Division, KTH, 2009 vii
Table of contents
ABSTRACT ................................................................................................................................................... I
LIST OF PAPERS ...................................................................................................................................... III
TABLE OF CONTENTS .......................................................................................................................... VII
1 INTRODUCTION ................................................................................................................................... 1
1.1 Fuel cell ............................................................................................................................. 2 1.2 Solid oxide fuel cell (SOFC) ............................................................................................. 4
1.2.1 General Introduction of SOFC ............................................................................................... 4 1.2.2 Materials for SOFC components ............................................................................................ 5 1.2.3 Challenges and limitations of SOFC ...................................................................................... 9
1.3 Development of low-temperature SOFC ........................................................................ 10 1.4 R&D of new electrolyte materials for LTSOFC ............................................................. 11
1.4.1 Nanotechnology approach .................................................................................................... 11 1.4.2 Composite approach ............................................................................................................. 12
1.5 Motivation and objectives ............................................................................................... 15
2 EXPERIMENTAL ................................................................................................................................. 16
2.1 Core-shell SDC/Na2CO3 nanocomposite ........................................................................ 16 2.1.1 Fabrication of core-shell SDC/Na2CO3 nanocomposite ....................................................... 16 2.1.2 Thermal stability test of core-shell SDC/Na2CO3 nanocomposite ....................................... 16
2.2 SDC nanowires based nanocomposite ............................................................................ 17 2.2.1 A novel synthetic route for SDC nanowires ......................................................................... 17 2.2.2 Fabrication of SDC nanowires/Na2CO3 nanocomposite ...................................................... 17
2.3 Characterization .............................................................................................................. 17 2.4 Single cell fabrication and electrochemical measurements ............................................. 19
2.4.1 Conductivity measurement ................................................................................................... 19 2.4.2 Fuel cell fabrication and performance test ........................................................................... 20
3 RESULTS AND DISCUSSION ............................................................................................................ 21
3.1 Core-shell SDC/Na2CO3 nanocomposite electrolyte ...................................................... 21 3.1.1 Morphology and structure studies ........................................................................................ 21 3.1.2 Thermal stability study ......................................................................................................... 22 3.1.3 Superionic conductivity........................................................................................................ 25 3.1.4 Fuel cell performance and durability test ............................................................................. 26
3.2 SDC nanowires/ Na2CO3 nanocomposite electrolyte ...................................................... 28 3.2.1 Synthesis Mechanism of SDC nanowires ............................................................................ 28 3.2.2 Characterization of lanthanide citrate precursor ................................................................... 30 3.2.3 Morphology and structure study of SDC nanowires ............................................................ 31 3.2.4 Characterization of SDC nanowires/Na2CO3 nanocomposite .............................................. 33 3.2.5 Fuel cell test and electrochemical study ............................................................................... 34
4 CONCLUSIONS .................................................................................................................................... 37
FUTURE WORK ......................................................................................................................................... 38
ACKNOWLEDGEMENTS ........................................................................................................................ 39
REFERENCES ............................................................................................................................................ 40

Functional Materials Division, KTH, 2009 1
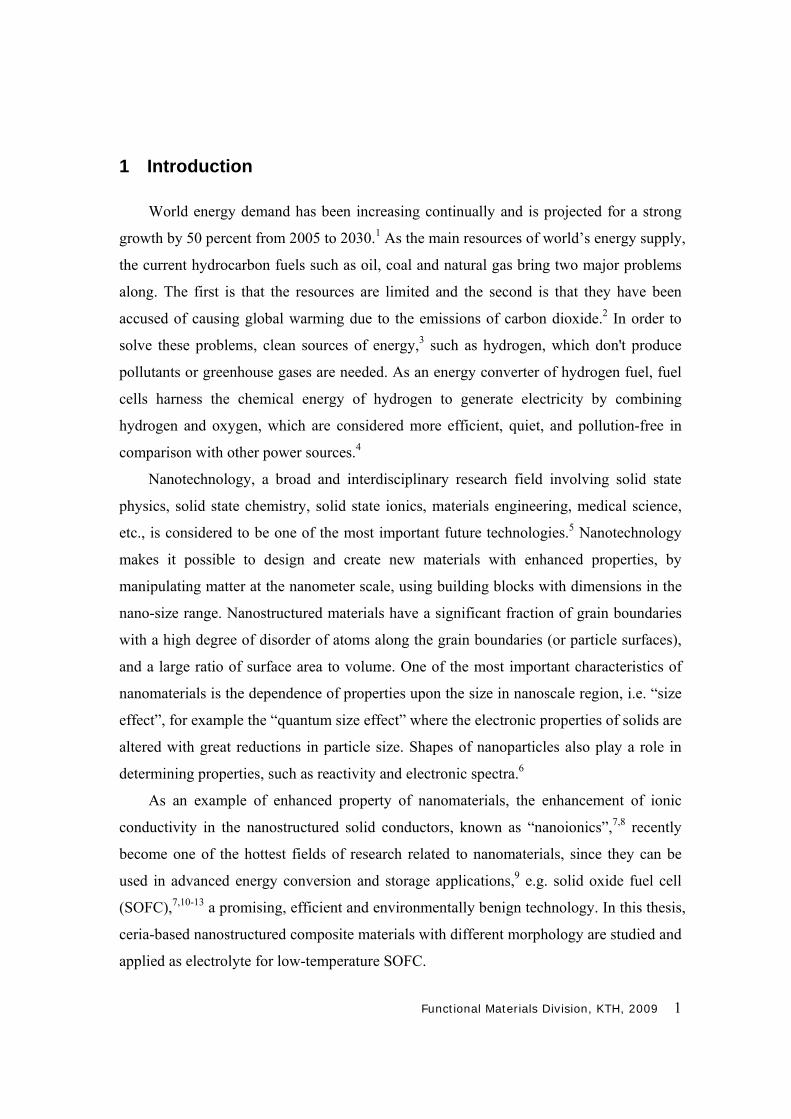
1 Introduction
World energy demand has been increasing continually and is projected for a strong
growth by 50 percent from 2005 to 2030.1 As the main resources of world’s energy supply,
the current hydrocarbon fuels such as oil, coal and natural gas bring two major problems
along. The first is that the resources are limited and the second is that they have been
accused of causing global warming due to the emissions of carbon dioxide.2 In order to
solve these problems, clean sources of energy,3 such as hydrogen, which don't produce
pollutants or greenhouse gases are needed. As an energy converter of hydrogen fuel, fuel
cells harness the chemical energy of hydrogen to generate electricity by combining
hydrogen and oxygen, which are considered more efficient, quiet, and pollution-free in
comparison with other power sources.4
Nanotechnology, a broad and interdisciplinary research field involving solid state
physics, solid state chemistry, solid state ionics, materials engineering, medical science,
etc., is considered to be one of the most important future technologies.5 Nanotechnology
makes it possible to design and create new materials with enhanced properties, by
manipulating matter at the nanometer scale, using building blocks with dimensions in the
nano-size range. Nanostructured materials have a significant fraction of grain boundaries
with a high degree of disorder of atoms along the grain boundaries (or particle surfaces),
and a large ratio of surface area to volume. One of the most important characteristics of
nanomaterials is the dependence of properties upon the size in nanoscale region, i.e. “size
effect”, for example the “quantum size effect” where the electronic properties of solids are
altered with great reductions in particle size. Shapes of nanoparticles also play a role in
determining properties, such as reactivity and electronic spectra.6
As an example of enhanced property of nanomaterials, the enhancement of ionic
conductivity in the nanostructured solid conductors, known as “nanoionics”,7,8 recently
become one of the hottest fields of research related to nanomaterials, since they can be
used in advanced energy conversion and storage applications,9 e.g. solid oxide fuel cell
(SOFC),7,10-13 a promising, efficient and environmentally benign technology. In this thesis,
ceria-based nanostructured composite materials with different morphology are studied and
applied as electrolyte for low-temperature SOFC.
2
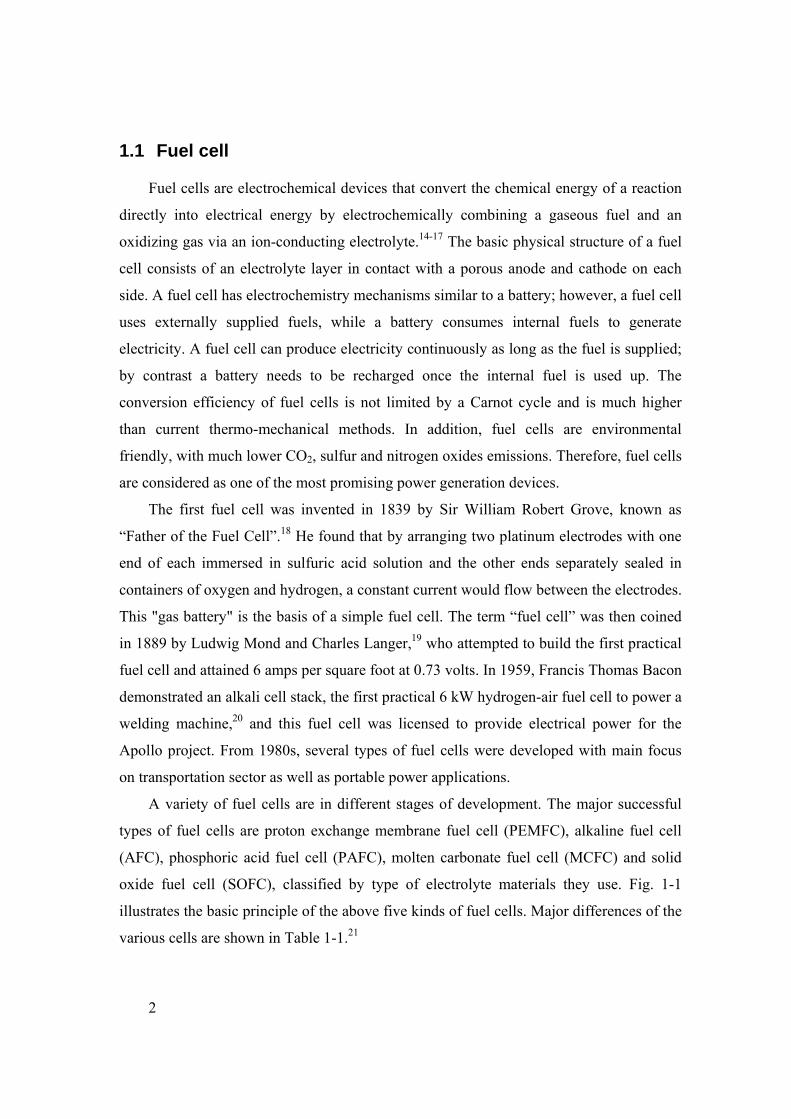
1.1 Fuel cell
Fuel cells are electrochemical devices that convert the chemical energy of a reaction
directly into electrical energy by electrochemically combining a gaseous fuel and an
oxidizing gas via an ion-conducting electrolyte.14-17 The basic physical structure of a fuel
cell consists of an electrolyte layer in contact with a porous anode and cathode on each
side. A fuel cell has electrochemistry mechanisms similar to a battery; however, a fuel cell
uses externally supplied fuels, while a battery consumes internal fuels to generate
electricity. A fuel cell can produce electricity continuously as long as the fuel is supplied;
by contrast a battery needs to be recharged once the internal fuel is used up. The
conversion efficiency of fuel cells is not limited by a Carnot cycle and is much higher
than current thermo-mechanical methods. In addition, fuel cells are environmental
friendly, with much lower CO2, sulfur and nitrogen oxides emissions. Therefore, fuel cells
are considered as one of the most promising power generation devices.
The first fuel cell was invented in 1839 by Sir William Robert Grove, known as
“Father of the Fuel Cell”.18 He found that by arranging two platinum electrodes with one
end of each immersed in sulfuric acid solution and the other ends separately sealed in
containers of oxygen and hydrogen, a constant current would flow between the electrodes.
This "gas battery" is the basis of a simple fuel cell. The term “fuel cell” was then coined
in 1889 by Ludwig Mond and Charles Langer,19 who attempted to build the first practical
fuel cell and attained 6 amps per square foot at 0.73 volts. In 1959, Francis Thomas Bacon
demonstrated an alkali cell stack, the first practical 6 kW hydrogen-air fuel cell to power a
welding machine,20 and this fuel cell was licensed to provide electrical power for the
Apollo project. From 1980s, several types of fuel cells were developed with main focus
on transportation sector as well as portable power applications.
A variety of fuel cells are in different stages of development. The major successful
types of fuel cells are proton exchange membrane fuel cell (PEMFC), alkaline fuel cell
(AFC), phosphoric acid fuel cell (PAFC), molten carbonate fuel cell (MCFC) and solid
oxide fuel cell (SOFC), classified by type of electrolyte materials they use. Fig. 1-1
illustrates the basic principle of the above five kinds of fuel cells. Major differences of the
various cells are shown in Table 1-1.21

Functional Materials Division, KTH, 2009 3
Fig. 1-1 Scheme of basic principle of different kinds of fuel cells.
Table 1-1 Comparison of Different Types of the Fuel Cell
PEMFC AFC PAFC MCFC SOFC
Electrolyte Ion Exchange Membranes
Mobilized or Immobilized
KOH
Immobilized Liquid H3PO4
Immobilized Liquid Molten
Carbonate Ceramic
Operating Temperature
40 – 80 °C 65°C – 220 °C 205 °C 650 °C 600 –
1000 °C
Charge Carrier
H+ OH– H+ CO32- O2-
Anode Pt on carbon Pt, transition
metals Pt on carbon Ni Ni/ceramics
Cathode Pt on carbon Pt, transition
metals Pt on carbon NiO perovskite
External Reformer for CH4 fuels
Yes Yes Yes No No
Product Water Management
Evaporative Evaporative Evaporative Gaseous Product
Gaseous Product
Product Heat Management
Process Gas + Liquid Cooling Medium
Process Gas + Electrolyte Circulation
Process Gas + Liquid cooling
medium or steam
generation
Internal Reforming + Process Gas
Internal Reforming + Process Gas
Load
Anode Electrolyte Cathode
SOFC
MCFC
AFC
PAFC
PEMFC
O2-
OH-
CO32-
H+
H+
AirFuel
Nitrogen,unconverted oxygen
unconverted combustion and reaction gasses
O2
CO2
O2
O2
O2
O2
H2O
H2OH2
COH2
H2
H2
H2
H2O
COH2OCO2
H2OCO2
600 - 1000 oC
650 oC
65 - 220 oC
205 oC
40 - 80 oC

4
The applications for fuel cells are mainly on mobile or stationary applications.15,17
The mobile applications primarily include transportation systems and portable electronic
equipment, while stationary applications primarily include combined heat and power
systems for both residential and commercial needs.15 On transportation application, all the
world leading car manufacturers have designed at least one prototype vehicle using fuel
cells. In addition, miniature fuel cells could replace batteries for electronic products such
as cellular telephones, portable computers, and video cameras. The primary stationary
application of fuel cell technology is for the combined generation of electricity and heat,
for buildings, industrial facilities or stand-by generators.
1.2 Solid oxide fuel cell (SOFC)
1.2.1 General Introduction of SOFC
Fig. 1-2 Scheme of the operating principle of a solid oxide fuel cell.
Solid oxide fuel cell (SOFC) is characterized by having a solid ceramic electrolyte
(hence the alternative name, ceramic fuel cell), which is usually a metallic oxide.16,22 The
basic components of SOFC are a cathode, an anode and an electrolyte. The cathode and
anode are electrodes where half-cell reactions take place. At the cathode, where oxidant,
normally oxygen in the air is supplied, oxygen is reduced to oxygen ions. Then the
oxygen ions are transported through the solid electrolyte under electrical load, to the
anode, where they react with the hydrogen fuel to form water. Thus the final products of
SOFC are electricity, heat and water. The process is shown schematically in Fig. 1-2. The
Anode
Solid electrolyteOxygen ion conductor
Cathode
Oxygen (Air), O2
electronse-
O2 + 4e- 2O2-
O2-
Hydrogen fuel, H2
H2 + O2- H2O + 4e-
load
Functional Materials Division, KTH, 2009 5
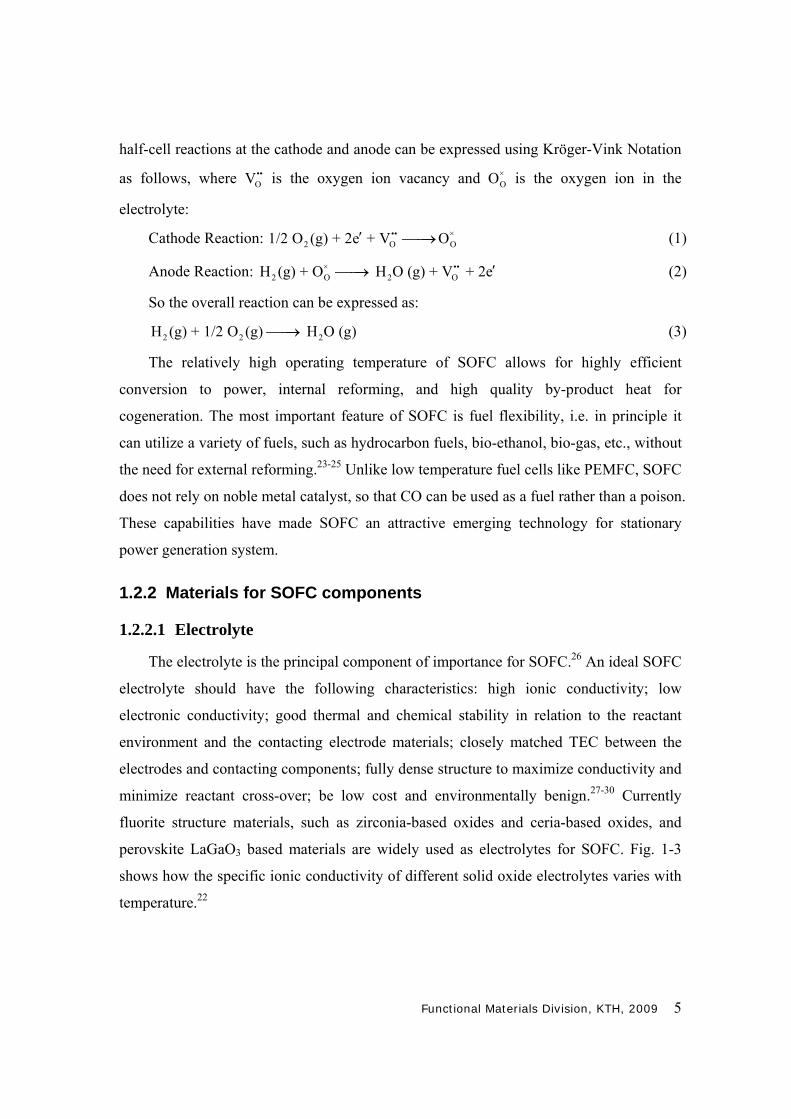
half-cell reactions at the cathode and anode can be expressed using Kröger-Vink Notation
as follows, where ••OV is the oxygen ion vacancy and ×
OO is the oxygen ion in the
electrolyte:
Cathode Reaction: •• ×
2 O O1/2 O (g) + 2e + V O (1)
Anode Reaction: × ••2 O 2 OH (g) + O H O (g) + V + 2e (2)
So the overall reaction can be expressed as:
2 2 2H (g) + 1/2 O (g) H O (g) (3)
The relatively high operating temperature of SOFC allows for highly efficient
conversion to power, internal reforming, and high quality by-product heat for
cogeneration. The most important feature of SOFC is fuel flexibility, i.e. in principle it
can utilize a variety of fuels, such as hydrocarbon fuels, bio-ethanol, bio-gas, etc., without
the need for external reforming.23-25 Unlike low temperature fuel cells like PEMFC, SOFC
does not rely on noble metal catalyst, so that CO can be used as a fuel rather than a poison.
These capabilities have made SOFC an attractive emerging technology for stationary
power generation system.
1.2.2 Materials for SOFC components
1.2.2.1 Electrolyte
The electrolyte is the principal component of importance for SOFC.26 An ideal SOFC
electrolyte should have the following characteristics: high ionic conductivity; low
electronic conductivity; good thermal and chemical stability in relation to the reactant
environment and the contacting electrode materials; closely matched TEC between the
electrodes and contacting components; fully dense structure to maximize conductivity and
minimize reactant cross-over; be low cost and environmentally benign.27-30 Currently
fluorite structure materials, such as zirconia-based oxides and ceria-based oxides, and
perovskite LaGaO3 based materials are widely used as electrolytes for SOFC. Fig. 1-3
shows how the specific ionic conductivity of different solid oxide electrolytes varies with
temperature.22

6
Fig. 1-3 Specific ion conductivities of selected solid oxide electrolytes. (Ref. 22)
Vacancies randomly distributed throughout the oxide sublattice are an essential
element required for oxygen-ion conduction in SOFC electrolyte materials.31 The fluorite
oxides are the classical oxygen ion conductors, with the general formula of AO2, where A
is a tetravalent cation. This structure is a face-centered cubic arrangement of cations with
oxygen ions occupying all the tetrahedral sites (shown in Fig. 1-4 a), leading to a large
number of octahedral interstitial voids. Thus this structure is a rather open one and rapid
ion diffusion might be expected.22 The addition of lower valence cations produces oxygen
vacancies, resulting in improved oxygen ion conductivity. Zirconia (ZrO2) has the fluorite
Fig. 1-4 (a) Crystal structure of the fluorite (AO2) oxide, the yellow spheres represent the oxygen sites; (b) The perovskite (ABO3) structure, where the red sphere represents A cation, the green spheres represent the B cations, and the small blue spheres are oxygen ions.
(a) (b)
Functional Materials Division, KTH, 2009 7
structure and has been studied extensively for SOFCs electrolytes.32,33 Yttria stabilized
zirconia (YSZ) is the most widely used electrolyte for SOFCs, which has good chemical
and physical stability as well as negligible electronic conductivity. Addition of 8 mol% of
yttria i.e. (ZrO2)0.92(Y2O3)0.08 (8YSZ) leads to the highest oxide ion conductivity. Scandia
stabilized zirconia (SSZ) also attracts some attention due to their improved conductivity.
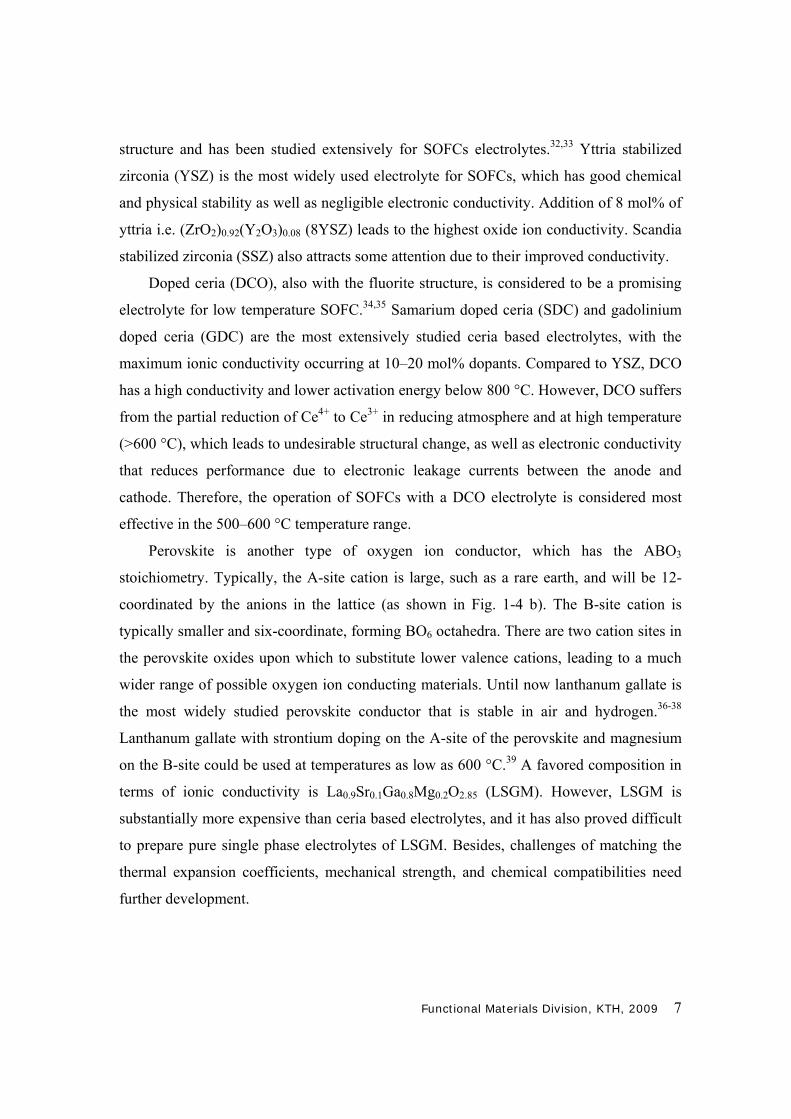
Doped ceria (DCO), also with the fluorite structure, is considered to be a promising
electrolyte for low temperature SOFC.34,35 Samarium doped ceria (SDC) and gadolinium
doped ceria (GDC) are the most extensively studied ceria based electrolytes, with the
maximum ionic conductivity occurring at 10–20 mol% dopants. Compared to YSZ, DCO
has a high conductivity and lower activation energy below 800 °C. However, DCO suffers
from the partial reduction of Ce4+ to Ce3+ in reducing atmosphere and at high temperature
(>600 °C), which leads to undesirable structural change, as well as electronic conductivity
that reduces performance due to electronic leakage currents between the anode and
cathode. Therefore, the operation of SOFCs with a DCO electrolyte is considered most
effective in the 500–600 °C temperature range.
Perovskite is another type of oxygen ion conductor, which has the ABO3
stoichiometry. Typically, the A-site cation is large, such as a rare earth, and will be 12-
coordinated by the anions in the lattice (as shown in Fig. 1-4 b). The B-site cation is
typically smaller and six-coordinate, forming BO6 octahedra. There are two cation sites in
the perovskite oxides upon which to substitute lower valence cations, leading to a much
wider range of possible oxygen ion conducting materials. Until now lanthanum gallate is
the most widely studied perovskite conductor that is stable in air and hydrogen.36-38
Lanthanum gallate with strontium doping on the A-site of the perovskite and magnesium
on the B-site could be used at temperatures as low as 600 °C.39 A favored composition in
terms of ionic conductivity is La0.9Sr0.1Ga0.8Mg0.2O2.85 (LSGM). However, LSGM is
substantially more expensive than ceria based electrolytes, and it has also proved difficult
to prepare pure single phase electrolytes of LSGM. Besides, challenges of matching the
thermal expansion coefficients, mechanical strength, and chemical compatibilities need
further development.
8
1.2.2.2 Anode
The role of an anode in SOFC is electro-oxidation of fuel by catalyzing the reaction,
and facilitating fuel access and product removal. Therefore, the anode materials should
meet several requirements:40-43
1) Stability in reducing environment;
2) Sufficient electronic and ionic conductivity;
3) Porous structure;
4) Thermal expansion coefficient (TEC) matching with electrolyte materials;
5) High catalytic activity.
These requirements together with elevated operating temperature limit the choice of
the anode materials to nickel and the noble metals. The vast majority of SOFCs have a
nickel anode because of its low cost compared to precious metals. The most commonly
used anode materials are cermet composed of nickel and solid electrolyte, such as Ni-YSZ,
Ni-SDC, aiming at maintaining porosity of anode by preventing sintering of the Ni
particles and giving the anode a TEC comparable to that of the solid electrolyte. The
threshold for electrical conductivity is about 30 vol% nickel.42 The conductivity of the
anode depends on its microstructure, in particular the size and particle size distribution of
the solid electrolyte and nickel particles, and the connectivity of the nickel particles in the
cermet. There is growing interest in developing ceramic anodes as alternatives to
cermets.44 Recently lanthanum-substituted strontium titanate (La-SrTiO3) with nominal
oxygen over-stoichiometry has been studied and shown to have very high electronic
conductivity and methane oxidation catalytic activity.45
1.2.2.3 Cathode
Cathode in SOFC carry out several roles: reduction of molecular oxygen, transport of
charged species to the electrolyte and distribution of the electrical current associated with
the oxygen reduction reaction.40,46-48 Therefore, the cathode materials should meet the
following requirement:
1) Stability in oxidizing environment;
2) Sufficient electronic and ionic conductivity;
3) Porous structure and stable at high temperature;
4) Comparable TEC to that of electrolyte materials;

Functional Materials Division, KTH, 2009 9
Numerous doped oxides have been studied as cathode materials for SOFC.
Strontium-doped lanthanum manganite (LSM), La1-xSrxMnO3, with intrinsic p-type
conductivity, is the most commonly used cathode material for YSZ based SOFC 49,50 The
conductivity of La1-xSrxMnO3 varies with strontium content, with an apparent optimum
strontium level. Another perovskite material that has been extensively studied as a
cathode material for SOFC is doped lanthanum cobaltite, LaCoO3.51 The conductivity can
be increased by substituting cations on the lanthanum and cobalt site. La1-xSrxCo1-yFeyO3-δ
(LSCF), for example, has been identified as promising materials in terms of both ionic
and electronic conductivity.52 Furthermore, there are a number of new materials that have
been proposed as cathode materials for SOFC operating at lower temperature. These
include perovskite-type materials [(Sm,Sr)CoO3, (Ba,Sr)(Co,Fe)O3-δ], layered perovskite-
related structures (Lan+1NinO3n+1) and double perovskites (GdBaCoO5+δ), all of which
have shown encouraging performance at lower temperatures.53
1.2.3 Challenges and limitations of SOFC
High temperature SOFC (HTSOFC), which operates in the temperature region of
850–1000 °C, has been successfully demonstrated by developers such as Siemens
Westinghouse and Rolls-Royce.22 However, this high temperature presents not only
material degradation problems, but also technological complications and economic
obstacles.54,55 From standpoint of cost, expensive high temperature alloys are used to
house the cell, and expensive ceramics are used for the interconnections, increasing the
cost of the SOFC substantially.55 Besides, material degradation is another critical issue so
that SOFC is prohibitive for broad commercialization. For example, the high operating
temperature leads to sintering of the nickel particles, which deteriorates the anode
porosity and catalytic activity.56 Therefore, reducing the operation temperature of SOFC
to the so-called intermediate temperature (IT) range of 600–800 °C, or even low
temperature range of below 600 °C, is a grand challenge in SOFC field.57-59
By lowering the temperature of operation, a wider range of materials can be used that
allow cheaper fabrication. Lower temperature operation also affords more rapid start-up
and shut-down, reduced corrosion rate of metallic components, improved durability, more

10
robust construction through the use of compressive seals and metallic interconnects as
well as the advantage of greatly simplified system requirements.57
1.3 Development of low-temperature SOFC
The development of intermediate-temperature SOFC (ITSOFC) or low-temperature
SOFC (LTSOFC) is now a world tendency for SOFC commercialization. However, with
decreased operating temperature, the internal resistance of SOFC increases tremendously,
which results in decrease on the performance of the cell. Therefore, how to decrease the
internal resistance of SOFC is the key point for LTSOFC. There are several factors
leading to SOFC internal resistance: first and foremost, it’s from the large resistance of
electrolyte, due to low oxygen ion conductivity of current electrolyte materials. Second,
polarization resistances of electrodes, especially cathode, are magnified with the decrease
of temperature.57
There are two main routes by which SOFCs can be operated at lower temperatures,
while still attaining comparable performance to the higher temperature technology. The
dimensional thickness of the electrolyte can be reduced, so reducing the area specific
resistance of the fuel cell, and/or materials development can bring about the same result
by improving the ionic conductivity of the electrolyte at lower temperatures and bring
about improvements in the performance of electrodes.57-59
In recent years, there has been an enormous increase in the application of thin film
technologies on SOFC to reduce its internal resistance in order to decrease the operation
temperature.60-65 There are several advantages on synthesizing SOFC electrolyte
components by thin film processes, e.g. ohmic losses can be reduced, sintering
temperature can be decreased and interfaces can be easily controlled. By using a thin
electrolyte layer, the electrolyte can no longer mechanically support the cell. Instead an
anode/substrate is usually used for supporting the cell. So far many work has been done to
deposit an yttria stabilized zirconia (YSZ) electrolyte film using various physical or
chemical thin film technologies, such as electrophoretic deposition (EPD),61 spin coating
method,62 radio-frequency (RF) sputtering,63 atomic layer deposition (ALD),64 pulsed
laser deposition (PLD),65 etc. However, there are still some drawbacks on these methods,
such as long production period, very high cost, difficulty on scaling up, as well as

Functional Materials Division, KTH, 2009 11
difficulties on control of film growing, which make it hard to realize the
commercialization of LTSOFC.
Another practical way to exploit LTSOFC is exploring new electrolyte materials with
enhanced ionic conductivity, as well as compatible anode and cathode materials, which is
the main topic of the thesis and will be well depicted in Chapter 1.4.
1.4 R&D of new electrolyte materials for LTSOFC
1.4.1 Nanotechnology approach
The conductivity of micro-sized polycrystalline electrolyte is contributed from both
grain-interior and grain-boundary. The specific grain-boundary resistivity is known to be
two to three orders of magnitude higher than the grain-interior resistivity. This blocking
effect comes from the oxygen vacancy depletion near the grain-boundary.66 Therefore,
many efforts have been taken on engineering of grain-boundary to lower its resistance,
thus to improve the performance of polycrystalline electrolytes.
However, ion transport across or along grain boundaries in solids with nanometer-
sized grains may differ distinctly from that in conventional polycrystalline solids.66,67
Nanostructured materials are distinguished from current polycrystalline materials by the
size of the structural units that compose them, which results in enhanced properties
compared with bulk materials. One important example is the enhancement of ionic
conductivity in the nanostructured solid electrolytes, known as “nanoionics”,7,8 which has
been rapidly recognized as an emerging new scientific area and widely applied on
rechargeable lithium-ion batteries, gas sensors and solid oxide fuel cells (SOFCs).9 The
enhancement of ionic conductivity in nanoionics was explained by predominance of
grain-boundary conductivity, because of faster diffusion than bulk and larger volume
fraction of grain boundary in nanostructured electrolytes.67
Some works have been done to study the enhanced oxide ion conductivity of
nanostructured electrolyte for SOFCs. For example, Martin G. Bellino et.al observed the
total ionic conductivity of nanostructured, heavily doped ceria solid electrolyte increases
about one order of magnitude compared to microcrystalline materials.11,12 Conductivity
enhancement has also been found in nanostructured YSZ materials; e.g. H. L. Tuller et.al
prepared YSZ thin films with nanometric sized grains and enhanced oxygen ion

12
conductivities were observed when compared to bulk YSZ.68 In addition, oxygen
diffusivity in the grain boundaries of YSZ was found to be about 3 orders of magnitude
higher than in single crystals.13 Nanoionics, as a combination of nanotechnology and
ionics, have pioneered a new direction in the solid state ionic research field.
Furthermore, from the point of view of morphology effect of nanomaterials, the grain
boundary of nanostructured ionic conductors can be tuned by manipulating their nano-
architecture. For example, as one of the attractive nanomaterials with unique chemical and
physical properties, 1D nanowires may achieve higher ionic conductivity compared to
their nanoparticles analogues, due to their longer continuous grain-boundary from high
aspect ratio. Therefore, study on performance of nanostructured electrolyte with respect to
the shape or size effect are of great significance and will open up a new area in R&D of
new electrolyte materials for LTSOFC.
However, in many ionic conductor applications, nanomaterials normally bear high
operating temperature or a consolidation stage to fabricate the dense specimen, especially
in SOFCs. So despite those beneficial properties, nanomaterials are usually quite unstable
at high temperature, since their high surface energy can lead to grain growth, which is the
main drawback that prevents nanomaterials to be used for high temperature devices. This
is also realized by other researchers and is the reason that measurement of conductivity
was conducted only at low temperature in their studies.11,12,68 Therefore, long-term
stability of nanostructured ionic conductor needs much consideration for applications .
1.4.2 Composite approach
Composite electrolytes are basically physical mixtures consisting of two or more
solid phases that possess different ionic conductivity properties.69 This kind of composite
materials usually show enhanced conductivity, but the effects are not simply additive;
rather they are synergistic in the sense that the overall conductivity is significantly higher
than in both of the constituent phases. The conductivity enhancement effects of composite
electrolyte were first reported on LiI:Al2O3 composite in 1973 by C. C. Liang,70 that the
incorporation of Al2O3 substantially increased almost 50 times of the Li+ ion conductivity
for LiI. Since then, enormous work has been done to study the enhancement effects of
diverse composite system, such as insulator-conductor systems (dispersing an insulating

Functional Materials Division, KTH, 2009 13
oxide like Al2O3, SiO2 in a moderate ion conductor like Li+, Cu+, and Ag-halides),71-76 or
conductor-conductor system (Ag+ conductivity enhancement in AgBr-AgI; nano-sized
ionic CaF2/BaF2 heterostructures).77-80 This conductivity enhancement, the so-called
composite effect, is suggested to be due to high ionic conductivity in the interface region
between components.81,82
In recent years, composite effect has also been utilized on developing new
electrolytes materials for LTSOFC. In 2000, Bin Zhu et al. reported for the first time the
ceria-based composite electrolyte for SOFC, since then plenty work has been done to
develop functional electrolytes for SOFC by composite approach.83-87 These composite
materials commonly consist of two-phases; host phase (ceria-based oxide) and second
phase (various salt, proton conductor, etc.). Many efforts have been made on various
ceria-based composite ceramics, such as SDC (samarium doped ceria), GDC (gadolinium
doped ceria) and YDC (yttrium doped ceria) etc. incorporated with different salts and
hydrates, such as chlorides, fluorites, carbonates, sulphates and hydrates (as shown in
Table 1-2).88-95 The ceria–based composite electrolyte has displayed high ionic
conductivity of 10−2–1 S cm−1 and excellent fuel cell performance of 300–1100 mW cm−2
at 400–600 °C, which increased about one to two magnitudes on conductivity compared
to conventional single-phase electrolyte, like YSZ, GDC, etc. Development on ceria–
based composite electrolyte has opened up a new horizon in the LTSOFCs research field.
Table 1-2 Conductivity and FC performance of ceria-based composite electrolyte
Doped Ceria Salt Conductivity
(S cm-1) Performance
(W cm-2) Temperature
(°C)
GDC 20wt%(1LiCl: 1 SrCl2) 0.015-0.21 0.10-0.58 400-660
GDC 15wt%NaOH 0.02-0.45 0.10-0.62 380-620
GDC 22wt%(2Li2CO3:1 Na2CO3) 0.01-0.80 0.20-0.78 400-660
SDC 20wt%(1LiCl: 1 SrCl2) 0.02-0.24 0.10-0.60 400-660
SDC 15wt%NaOH 0.03-0.50 0.20-0.66 380-620
SDC 22wt%(2Li2CO3:1 Na2CO3) 0.002-0.90 0.2-1.0 400-660
SDC 40mol%Li2SO4 0.01-0.40 0.20-0.54 450-650
YDC 20wt%(1LiCl: 1 SrCl2) 0.01-0.18 0.10-0.52 400-660
YDC 15wt%NaOH 0.02-0.40 0.20-0.58 380-620
YDC 22wt%(2Li2CO3:1 Na2CO3) 0.01-0.78 0.20-0.70 400-660
14
With the enhanced ionic conductivity, ceria–based composite electrolytes could
achieve good performance as long as electrode materials are compatible. So far the
mixture of NiO and composite electrolyte has been widely used as the anode materials;
while (La,Sr)CoO3, (Sm,Sr)CoO3, or lithiated NiO are commonly used cathode materials.
Table 1-2 gives the summary of the conductivity and the relevant FC performance for
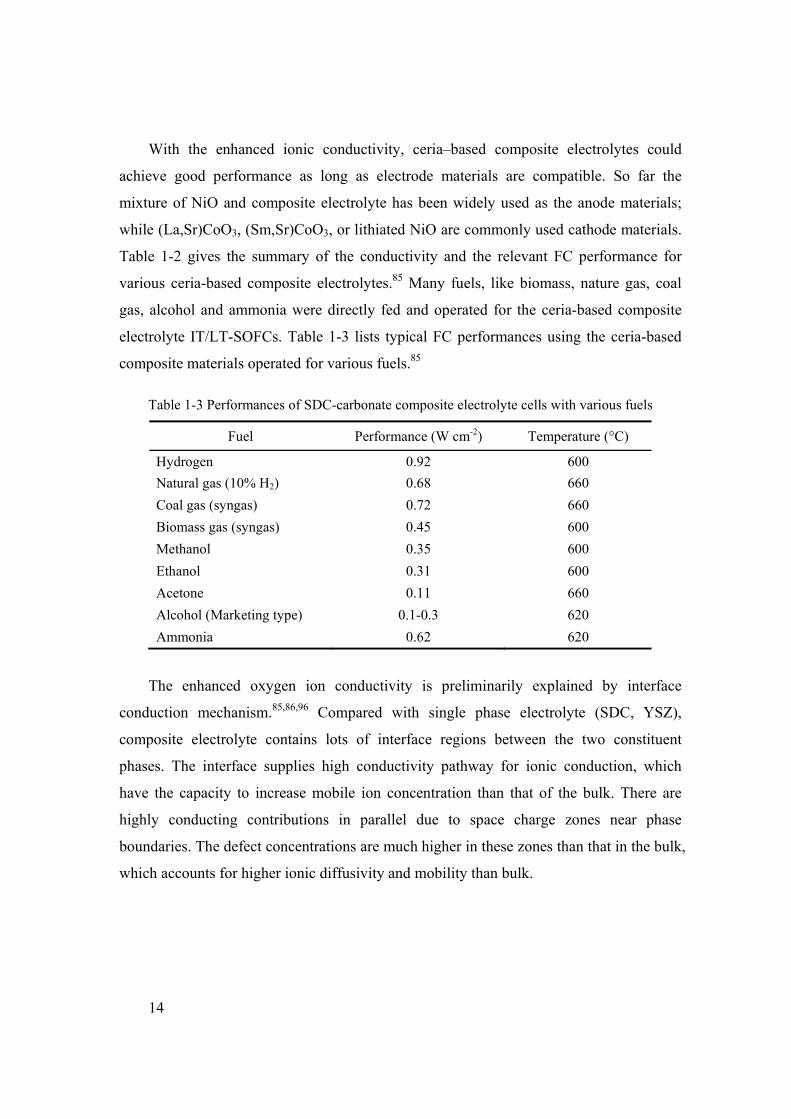
various ceria-based composite electrolytes.85 Many fuels, like biomass, nature gas, coal
gas, alcohol and ammonia were directly fed and operated for the ceria-based composite
electrolyte IT/LT-SOFCs. Table 1-3 lists typical FC performances using the ceria-based
composite materials operated for various fuels.85
Table 1-3 Performances of SDC-carbonate composite electrolyte cells with various fuels
Fuel Performance (W cm-2) Temperature (°C)
Hydrogen 0.92 600
Natural gas (10% H2) 0.68 660
Coal gas (syngas) 0.72 660
Biomass gas (syngas) 0.45 600
Methanol 0.35 600
Ethanol 0.31 600
Acetone 0.11 660
Alcohol (Marketing type) 0.1-0.3 620
Ammonia 0.62 620
The enhanced oxygen ion conductivity is preliminarily explained by interface
conduction mechanism.85,86,96 Compared with single phase electrolyte (SDC, YSZ),
composite electrolyte contains lots of interface regions between the two constituent
phases. The interface supplies high conductivity pathway for ionic conduction, which
have the capacity to increase mobile ion concentration than that of the bulk. There are
highly conducting contributions in parallel due to space charge zones near phase
boundaries. The defect concentrations are much higher in these zones than that in the bulk,
which accounts for higher ionic diffusivity and mobility than bulk.

Functional Materials Division, KTH, 2009 15
1.5 Motivation and objectives
As mentioned previously, nanotechnology approach and composite approach are two
important ways to develop new electrolyte materials with enhanced ionic conductivity for
low-temperature SOFC. Both of them have advantages and drawbacks: nanostructured
ionic conductors possess enhanced ionic conductivity due to predominance of grain
boundary, but their stability at high temperature is a serious issue; ceria-based composite
materials created a big breakthrough in LTSOFCs field while the detailed conduction
mechanism of composite materials is still not clear. However, if combining the
advantages of these two approaches, there will be a synergistic effect. For nanostructured
ionic conductors, grain growth can be effectively suppressed by putting another phase into
interparticle region; while for composite materials with nanostructure, the grain boundary/
interface conduction is dominant in overall transport, which will give rise to an enormous
conductivity enhancement. Therefore, nanocomposite approach will be a novel effective
way to develop electrolyte materials for LTSOFC, which will not only improve composite
electrolyte performance but also contribute to the study of conductivity mechanism.
So in this thesis, we are aiming at developing a novel nanocomposite approach to
design and fabricate ceria-based composite electrolytes for LTSOFC. Based on the grain
boundary/interfacial effect, both size and morphology of the host particles will influence
the volume of grain boundary/interface, which will further affect the ionic conductivity of
the composite electrolytes. For this purpose, we studied two ceria-based nanocomposite
systems with different SDC morphologies. First, core–shell nanocomposite consisting of
SDC nanoparticles and amorphous Na2CO3 shell were fabricated and applied as
electrolyte in low-temperature SOFC. Furthermore, the thermal stability of the core-shell
SDC/Na2CO3 nanocomposites was studied and its long-term durability was evaluated.
Second, a novel synthetic route for one dimensional SDC nanowires were developed, and
the detailed formation mechanism of SDC nanowires were investigated. Then low-
temperature SOFCs using SDC nanowires/Na2CO3 nanocomposite as electrolyte were
demonstrated.

16
2 Experimental
2.1 Core-shell SDC/Na2CO3 nanocomposite
2.1.1 Fabrication of core-shell SDC/Na2CO3 nanocomposite
The Ce0.8Sm0.2O1.9 (SDC) sample was synthesized via coprecipitation method using
sodium carbonate as the precipitant. All the chemicals are used as received without further
purification. The stock solution was made by dissolving the cerium nitrate hexahydrate
(Ce(NO3)3·6H2O, 99.9%, Chempur, Karlsruhe, Germany) and samarium nitrate
hexahydrate (Sm(NO3)3·6H2O, 99.9%, Sigma-Aldrich) in distilled water with a molar
ratio of Ce3+:Sm3+ = 4:1, and the total concentration of cation (Ce3+ and Sm3+) was 0.5 M.
Aqueous solutions of sodium carbonate (Na2CO3, 99.5%, Merck) with a concentration of
0.5 M were used as the precipitant.
In a typical synthetic procedure, 50 ml mixed salt solution was dripped at a speed of
5 ml min-1 into 150 ml precipitant solution under vigorous stirring at room temperature to
form a white precipitate. The resultant suspension, after homogenizing for 1 h, was
filtered via suction filtration. The precipitate cake was washed repeatedly with distilled
water, followed by drying at 80 °C to obtain SDC precursor.
The SDC/ Na2CO3 nanocomposite was prepared by a wet mixing method. As-
prepared SDC precursor was mixed with Na2CO3 solution (2 M) under vigorous stirring
with weight ratio of SDC:Na2CO3 = 4:1. The mixture slurry was dried at 80 °C in air for
24 h, calcined at certain temperature in air and immediately cooled to room temperature to
form SDC/Na2CO3 composite with Na2CO3 weight content of 20%.
2.1.2 Thermal stability test of core-shell SDC/Na2CO3 nanocomposite
The SDC precursor and its mixture with Na2CO3 were prepared as the above route.
Then the mixture of SDC precursor and Na2CO3 was calcined at 500 °C for 2 h and
quenched in air to room temperature to form SDC/Na2CO3 composite. As a reference,
pure SDC sample was also prepared by calcinations of precursor at 500 °C in air for 2 h.
The SDC/Na2CO3 composite sample was then annealed at 600 °C and 700 °C for 2 h
and 24 h for the thermal stability test, as well as pure SDC sample for comparison. The
Functional Materials Division, KTH, 2009 17
temperature was limited to 700 °C, since SOFCs based on the SDC/Na2CO3 composite
electrolyte are seldom operated above 700 °C. Crystallite sizes, particle sizes and surface
areas of the above annealed samples were calculated or measured by XRD, SEM, and
BET respectively, to compare the thermal stability of Na2CO3 coated and uncoated SDC
sample.
2.2 SDC nanowires based nanocomposite
2.2.1 A novel synthetic route for SDC nanowires
A novel chemical synthetic route for the synthesis of SDC nanowires was
demonstrated by homogeneous precipitation of lanthanide citrate complex as precursor
followed by calcination. Briefly, stoichiometric amounts of Ce(NO3)3·6H2O and
Sm(NO3)3·6H2O were dissolved in deionized water to obtain a 0.2 M solution (total moles
of cations per liter of solution); similarly 0.6 M citric acid solution was prepared. Equal
volumes of metal ion and citric acid solutions were mixed in a beaker, adjusting the pH
value to 2.0 by the addition of 5 M NaOH solution. Then the beaker was sealed and
heated to 90 °C in an oven. After 24 h reaction, some white deposit was formed in the
beaker. The deposit was then collected by centrifugation and washed with water and
ethanol for several times, followed by drying at 120 °C in vacumm oven overnight to
obtain a precursor. The precursor was then calcined at 400 °C for 3 h in a furnace to
obtain the SDC nanowires.
2.2.2 Fabrication of SDC nanowires/Na2CO3 nanocomposite
The SDC nanowires/Na2CO3 nanocomposite was prepared by a wet mixing method.
As-prepared SDC sample was mixed with Na2CO3 solution (2 M) under vigorous stirring
with Na2CO3 weight ratio of 20 wt%. The mixture slurry was dried at 80 °C in air for 24 h,
annealed at 600 °C in air for 2 h and immediately cooled to room temperature to form the
SDC nanowires/Na2CO3 composite.
2.3 Characterization
The materials at the different processing steps are characterized by different means of
characterization.

18
Thermodynamic modelling was performed by Medusa software to simulate aqueous
solution reaction.
Powder X-ray diffraction (XRD) patterns of the samples were collected on a Philips
X’pert pro super Diffractometer with Cu Kα radiation (λ=1.5418 Å). The average
crystallite size, D, can be evaluated from the peak broadening of the diffraction pattern,
based on the following Scherrer’s equation.
0.9
cosD
Where β is the pure diffraction line width, full width at half maximum, expressed in
radians in terms of 2θ at angle θ, and λ is the X-ray wavelength.
A Zeiss Ultra 55 digital field emission scanning microscope (FE-SEM) equipped
with energy-dispersed X-rays analysis (EDX) was used to examine the morphology, size
distribution and elemental composition of samples. The specimen was prepared by
dripping nanoparticle suspension in ethanol or acetone onto aluminum sample holder
followed by drying in a vacuum oven at 70 °C overnight. To view the inner texture of the
sample and perform the phase identification, transmission electron microscopy (TEM),
selective area electron diffraction (SAED), high-resolution transmission electron
microscopy (HRTEM) and electron energy loss spectroscopy (EELS) analysis were
performed on a JEOL JEM-2100F field-emission microscope using an accelerating
voltage of 200 kV. The specimen for TEM imaging was prepared by dropping the
suspension of nanoparticles on a carbon-coated 200 mesh copper grid, followed by drying
the sample under ambient conditions.
The precursor samples were subjected to thermogravimetric analysis (TGA) to study
the thermal decomposition process, with a heating rate of 10 °C min-1 in synthetic air
using TA TGA Q500. The differential scanning calorimetry (DSC) analyses were carried
out using TA DSC Q2000 to investigate thermal behavior of samples, at a heating rate of
10 °C min-1 in synthetic air atmosphere.
Surface areas of samples were determined using the Brunauer−Emmett−Teller (BET)
method from the low-temperature adsorption of nitrogen, performed at −196 °C after
degassed at 350 °C for 12 h.
Functional Materials Division, KTH, 2009 19
2.4 Single cell fabrication and electrochemical measurements
2.4.1 Conductivity measurement
For conductivity measurement, the composite electrolyte powder was uniaxially
pressed at 300 MPa to form a 13 mm diameter green pellets by a manual hydraulic press.
The green pellets were then sintered at 600 °C in air for 1 h. After sintering, both sides of
the disks were grounded and polished to obtain the desired thickness and to produce faces
that were flat and parallel to one another. Then, silver paste was applied as electrode onto
both sides of the pellets and heated at 600 °C for 40 min. Conductivity of samples was
measured by electrochemical impedance spectroscopy (EIS) in the temperature range
between 300 and 600 °C, using a two-electrode configuration. The measurements were
conducted in the frequency range from 5 Hz to 13 MHz using a computerized HP 4192A
LF Impedance Analyzer with an applied signal of 20 mV. A K-type thermocouple was
positioned adjacent to the sample in order to monitor sample temperature.
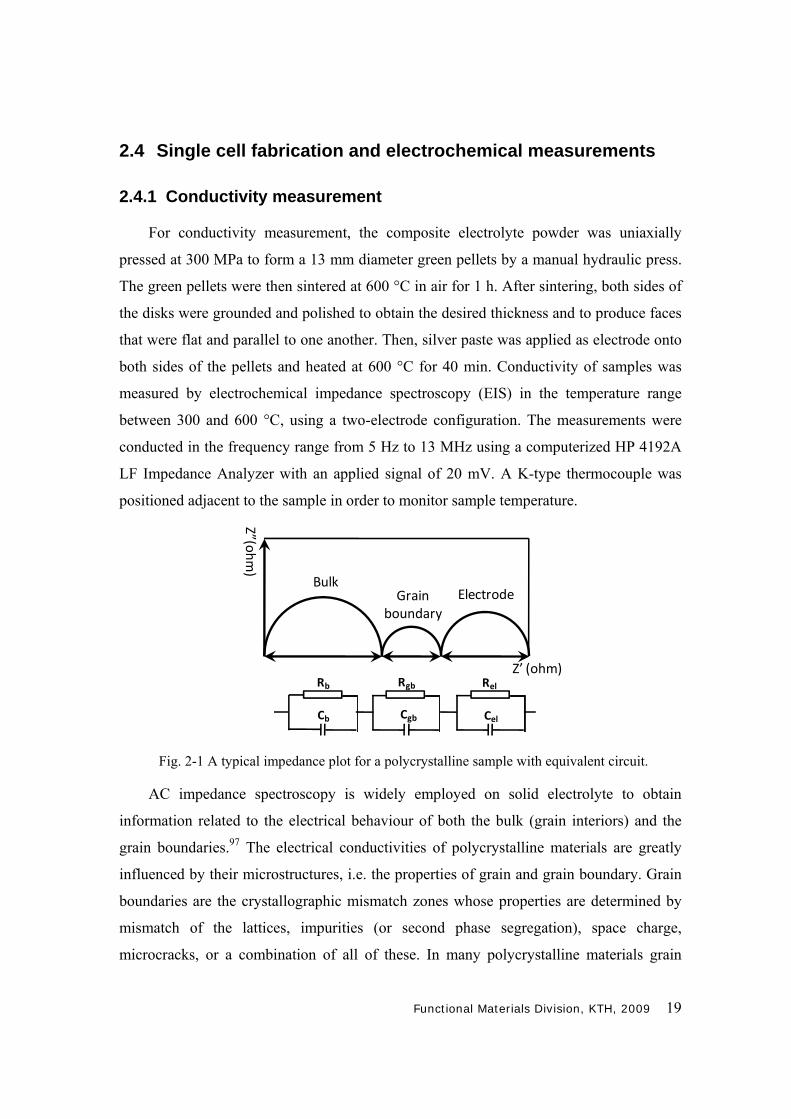
Fig. 2-1 A typical impedance plot for a polycrystalline sample with equivalent circuit.
AC impedance spectroscopy is widely employed on solid electrolyte to obtain
information related to the electrical behaviour of both the bulk (grain interiors) and the
grain boundaries.97 The electrical conductivities of polycrystalline materials are greatly
influenced by their microstructures, i.e. the properties of grain and grain boundary. Grain
boundaries are the crystallographic mismatch zones whose properties are determined by
mismatch of the lattices, impurities (or second phase segregation), space charge,
microcracks, or a combination of all of these. In many polycrystalline materials grain
BulkGrain
boundary
Electrode
Z”(ohm)
Z’ (ohm)Rb RelRgb
Cb Cgb Cel

20
boundaries provide a region of relatively rapid mass transport compared to the bulk
properties of the crystallites. A typical impedance plot for a polycrystalline sample with
equivalent circuit is illustrated in Fig. 2-1. For a sample with a length of L and cross
section area of A, the bulk conductivity, σb, and the grain boundary conductivity, σgb, can
be expressed as σb = L/ARb and σgb = L/ARgb, where Rb and Rgb are respectively the bulk
and grain boundary resistance. Then, the total electrical conductivity, σT, can be
calculated from equation 1/σT = 1/σb + 1/σgb.
2.4.2 Fuel cell fabrication and performance test
Fig. 2-2 Schematic of testing holder for fuel cell measurement.
The single cells were fabricated using the co-pressing process. Equal volume of
electrolyte and commercial NiO powder were first mixed to prepare anode material. The
cathode powder was composed of lithiated NiO (50 vol.%) mixed with electrolyte (50
vol.%). The anode, electrolyte and cathode were uniaxially pressed into a pellet with
diameter of 13 mm at a pressure of 300 MPa and then sintered at 600 °C for 30 min in air.
Finally, both anode and cathode surfaces were painted by silver paste as current collectors
for fuel cell measurements. In the fuel cell test procedure, a stainless steel sample holder
was used to test the cell at 450 to 600 °C, shown in Fig. 2-2. The effective working area of
the pellet was 0.64 cm2. Hydrogen and synthetic air were used as fuel and oxidant
respectively. The gas flow rates were controlled in the range of 80 to 120 ml min-1 at 1
atm pressure.
Functional Materials Division, KTH, 2009 21
3 Results and discussion
3.1 Core-shell SDC/Na2CO3 nanocomposite electrolyte
3.1.1 Morphology and structure studies
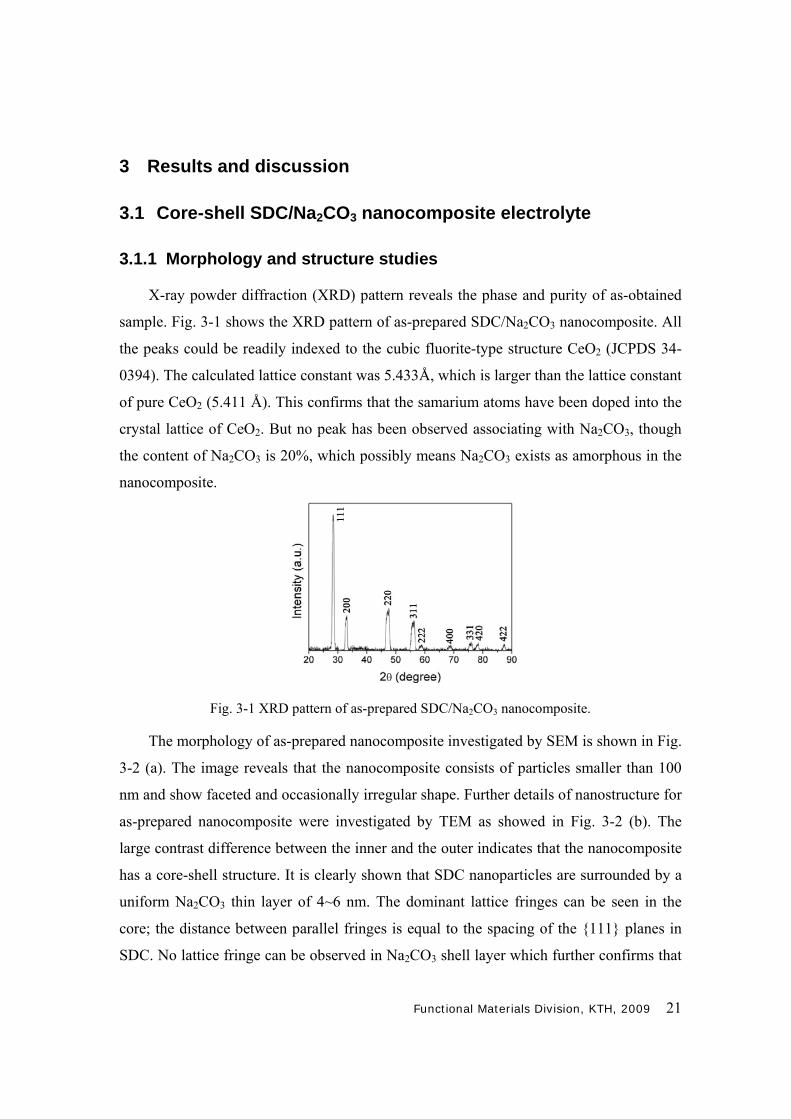
X-ray powder diffraction (XRD) pattern reveals the phase and purity of as-obtained
sample. Fig. 3-1 shows the XRD pattern of as-prepared SDC/Na2CO3 nanocomposite. All
the peaks could be readily indexed to the cubic fluorite-type structure CeO2 (JCPDS 34-
0394). The calculated lattice constant was 5.433Å, which is larger than the lattice constant
of pure CeO2 (5.411 Å). This confirms that the samarium atoms have been doped into the
crystal lattice of CeO2. But no peak has been observed associating with Na2CO3, though
the content of Na2CO3 is 20%, which possibly means Na2CO3 exists as amorphous in the
nanocomposite.
Fig. 3-1 XRD pattern of as-prepared SDC/Na2CO3 nanocomposite.
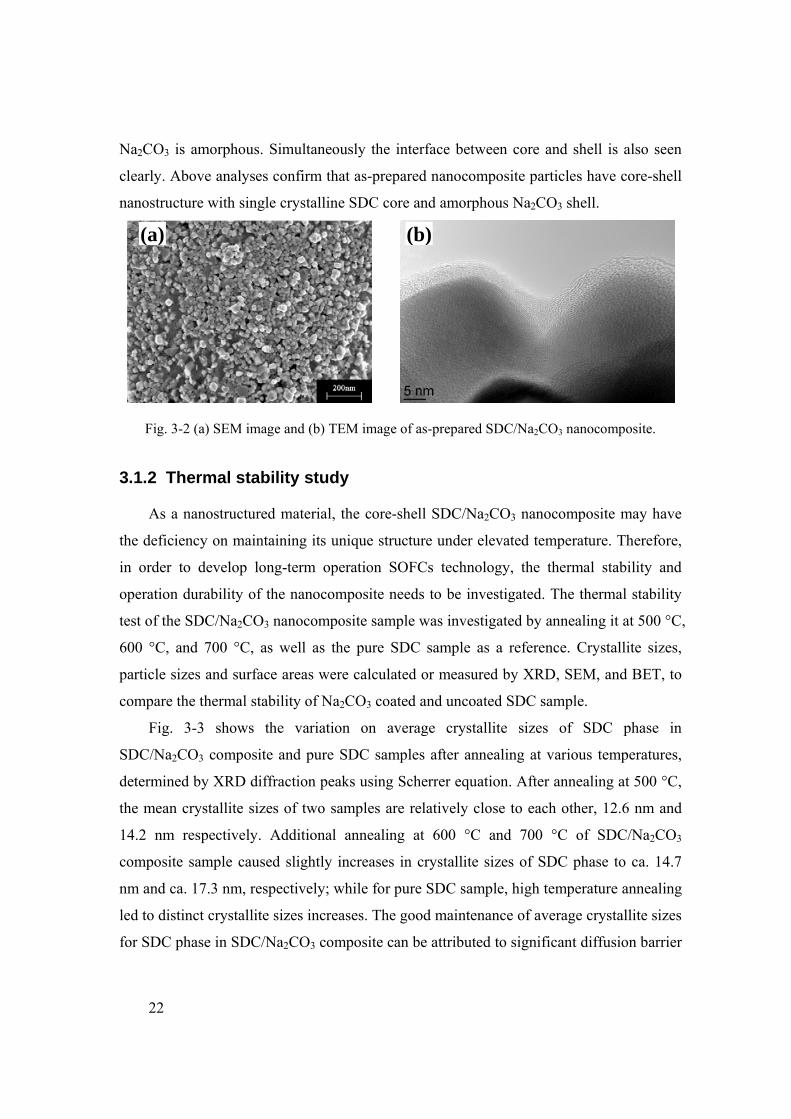
The morphology of as-prepared nanocomposite investigated by SEM is shown in Fig.
3-2 (a). The image reveals that the nanocomposite consists of particles smaller than 100
nm and show faceted and occasionally irregular shape. Further details of nanostructure for
as-prepared nanocomposite were investigated by TEM as showed in Fig. 3-2 (b). The
large contrast difference between the inner and the outer indicates that the nanocomposite
has a core-shell structure. It is clearly shown that SDC nanoparticles are surrounded by a
uniform Na2CO3 thin layer of 4~6 nm. The dominant lattice fringes can be seen in the
core; the distance between parallel fringes is equal to the spacing of the {111} planes in
SDC. No lattice fringe can be observed in Na2CO3 shell layer which further confirms that
22
Na2CO3 is amorphous. Simultaneously the interface between core and shell is also seen
clearly. Above analyses confirm that as-prepared nanocomposite particles have core-shell
nanostructure with single crystalline SDC core and amorphous Na2CO3 shell.
Fig. 3-2 (a) SEM image and (b) TEM image of as-prepared SDC/Na2CO3 nanocomposite.
3.1.2 Thermal stability study
As a nanostructured material, the core-shell SDC/Na2CO3 nanocomposite may have
the deficiency on maintaining its unique structure under elevated temperature. Therefore,
in order to develop long-term operation SOFCs technology, the thermal stability and
operation durability of the nanocomposite needs to be investigated. The thermal stability
test of the SDC/Na2CO3 nanocomposite sample was investigated by annealing it at 500 °C,
600 °C, and 700 °C, as well as the pure SDC sample as a reference. Crystallite sizes,
particle sizes and surface areas were calculated or measured by XRD, SEM, and BET, to
compare the thermal stability of Na2CO3 coated and uncoated SDC sample.
Fig. 3-3 shows the variation on average crystallite sizes of SDC phase in
SDC/Na2CO3 composite and pure SDC samples after annealing at various temperatures,
determined by XRD diffraction peaks using Scherrer equation. After annealing at 500 °C,
the mean crystallite sizes of two samples are relatively close to each other, 12.6 nm and
14.2 nm respectively. Additional annealing at 600 °C and 700 °C of SDC/Na2CO3
composite sample caused slightly increases in crystallite sizes of SDC phase to ca. 14.7
nm and ca. 17.3 nm, respectively; while for pure SDC sample, high temperature annealing
led to distinct crystallite sizes increases. The good maintenance of average crystallite sizes
for SDC phase in SDC/Na2CO3 composite can be attributed to significant diffusion barrier
(a) (b)

Functional Materials Division, KTH, 2009 23
effect98 of amorphous Na2CO3, which restrains interparticle diffusion of SDC particles,
demonstrating a notable thermal stability after Na2CO3 coating.
Fig. 3-3 Average crystallite sizes of SDC phase in SDC/Na2CO3 composite and pure SDC samples after annealing at various temperature
Surface area measured by BET is another evidence to confirm the thermal stability of
SDC/Na2CO3 composite. The BET characterization results of the coated and uncoated
SDC samples are summarized in Table 3-1. After annealing at 500 °C for 2 h, both
SDC/Na2CO3 composite and SDC samples remain high BET surface area of 92.4 m2 g-1
and 89.0 m2 g-1, respectively, due to decomposition reaction of precursor. Then surface
area of SDC sample drops sharply with increasing annealing temperature, due to
agglomeration of particles under high temperature. However, SDC/Na2CO3 composite
sample can still keep relatively high surface area of 81.6 m2 g-1 after annealing at 600 °C.
Additional annealing at 700 °C of SDC/Na2CO3 composite sample caused sharp decrease
on surface area, which is probably because soften process99 of amorphous Na2CO3
enhances the mobility of Na2CO3 phase and leads to filling of interparticle pores, but still
the surface area (34.1 m2 g-1) is almost two times higher than pure SDC sample.
Table 3-1 BET surface areas of SDC/Na2CO3 composite and SDC samples annealed at various temperatures.
Samples BET surface area (m2 g-1)
500 °C 600 °C 700 °C
SDC/ Na2CO3 92.4 81.6 34.1
SDC 89.0 53.5 19.2
24
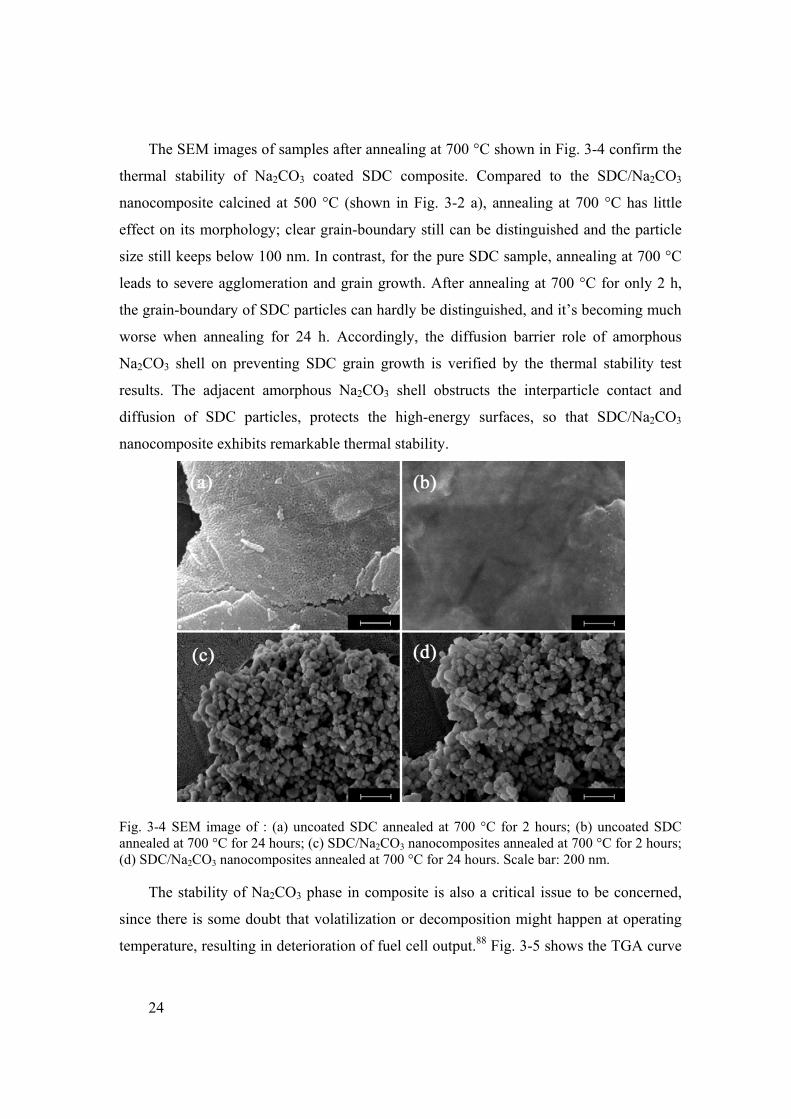
The SEM images of samples after annealing at 700 °C shown in Fig. 3-4 confirm the
thermal stability of Na2CO3 coated SDC composite. Compared to the SDC/Na2CO3
nanocomposite calcined at 500 °C (shown in Fig. 3-2 a), annealing at 700 °C has little
effect on its morphology; clear grain-boundary still can be distinguished and the particle
size still keeps below 100 nm. In contrast, for the pure SDC sample, annealing at 700 °C
leads to severe agglomeration and grain growth. After annealing at 700 °C for only 2 h,
the grain-boundary of SDC particles can hardly be distinguished, and it’s becoming much
worse when annealing for 24 h. Accordingly, the diffusion barrier role of amorphous
Na2CO3 shell on preventing SDC grain growth is verified by the thermal stability test
results. The adjacent amorphous Na2CO3 shell obstructs the interparticle contact and
diffusion of SDC particles, protects the high-energy surfaces, so that SDC/Na2CO3
nanocomposite exhibits remarkable thermal stability.
Fig. 3-4 SEM image of : (a) uncoated SDC annealed at 700 °C for 2 hours; (b) uncoated SDC annealed at 700 °C for 24 hours; (c) SDC/Na2CO3 nanocomposites annealed at 700 °C for 2 hours; (d) SDC/Na2CO3 nanocomposites annealed at 700 °C for 24 hours. Scale bar: 200 nm.
The stability of Na2CO3 phase in composite is also a critical issue to be concerned,
since there is some doubt that volatilization or decomposition might happen at operating
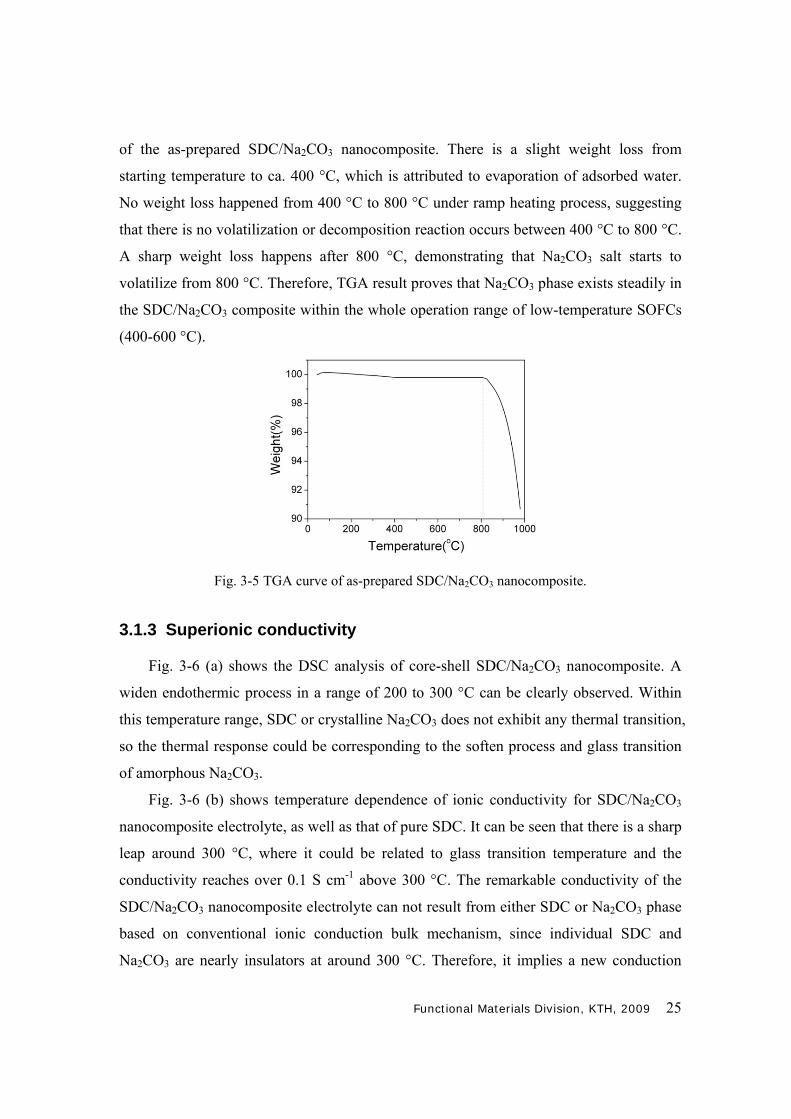
temperature, resulting in deterioration of fuel cell output.88 Fig. 3-5 shows the TGA curve
Functional Materials Division, KTH, 2009 25
of the as-prepared SDC/Na2CO3 nanocomposite. There is a slight weight loss from
starting temperature to ca. 400 °C, which is attributed to evaporation of adsorbed water.
No weight loss happened from 400 °C to 800 °C under ramp heating process, suggesting
that there is no volatilization or decomposition reaction occurs between 400 °C to 800 °C.
A sharp weight loss happens after 800 °C, demonstrating that Na2CO3 salt starts to
volatilize from 800 °C. Therefore, TGA result proves that Na2CO3 phase exists steadily in
the SDC/Na2CO3 composite within the whole operation range of low-temperature SOFCs
(400-600 °C).
Fig. 3-5 TGA curve of as-prepared SDC/Na2CO3 nanocomposite.
3.1.3 Superionic conductivity
Fig. 3-6 (a) shows the DSC analysis of core-shell SDC/Na2CO3 nanocomposite. A
widen endothermic process in a range of 200 to 300 °C can be clearly observed. Within
this temperature range, SDC or crystalline Na2CO3 does not exhibit any thermal transition,
so the thermal response could be corresponding to the soften process and glass transition
of amorphous Na2CO3.
Fig. 3-6 (b) shows temperature dependence of ionic conductivity for SDC/Na2CO3
nanocomposite electrolyte, as well as that of pure SDC. It can be seen that there is a sharp
leap around 300 °C, where it could be related to glass transition temperature and the
conductivity reaches over 0.1 S cm-1 above 300 °C. The remarkable conductivity of the
SDC/Na2CO3 nanocomposite electrolyte can not result from either SDC or Na2CO3 phase
based on conventional ionic conduction bulk mechanism, since individual SDC and
Na2CO3 are nearly insulators at around 300 °C. Therefore, it implies a new conduction

26
mechanism of the SDC/Na2CO3 nanocomposite beyond bulk conduction effects, which
accounts for several orders of magnitude higher conductivity than that of pure SDC
indicated in Fig. 3-6 (b).
Fig. 3-6 (a) DSC curve of as-prepared SDC/Na2CO3 nanocomposite and (b) temperature dependence of conductivities for as-prepared SDC/Na2CO3 nanocomposite compared to that of pure SDC.
The conduction mechanism of the SDC/Na2CO3 nanocomposite electrolyte may be
understood by solid state ionic theory. Compared with single phase electrolyte (SDC,
YSZ), composite electrolyte contains lots of interface regions between the two constituent
phases. The interface supplies high conductivity pathway for ionic conduction, which
have the capacity to increase mobile ion concentration than that of the bulk. A case study
of nanocomposite electrolyte has been taken to discuss interfacial ion interaction, the
interface electric field and the corresponding oxygen ion activation energy.96 The
theoretical value of activation energy for oxygen ion migration was calculated as 0.2 eV,
which is comparable with that obtained from the conductivity measurements of as-
prepared SDC/Na2CO3 nanocomposite as 0.3 eV (Fig. 3-6 b). The conductivity of
nanocomposite electrolyte is presumably dominated by interfacial oxygen ion conduction
rather than bulk conduction, which results in low activation energy and high oxygen ion
conductivity.
3.1.4 Fuel cell performance and durability test
I-V and I-P characteristics of a single cell using as-prepared core-shell SDC/Na2CO3
nanocomposite as electrolyte at various temperature are shown in Fig. 3-7 (a). Under
prerequisite of sufficient open circuit voltage of 1.0 V, the maximum power density of 0.8

Functional Materials Division, KTH, 2009 27
W cm-2 has been achieved at 550 °C. Compared with the thin-film SDC single cell
reported by Shao et al.,100 the core-shell SDC/Na2CO3 nanocomposite fuel cells show
better performances at 450-550 °C, indicating that the nanocomposite electrolyte has great
potential value for low-temperature SOFC technology.
Fig. 3-7 (a) I-V and I-P characteristics and (b) durability test of a single cell based on core-shell SDC/Na2CO3 nanocomposite electrolyte.
Fig. 3-7 (b) shows the durability test result of cell based on SDC/Na2CO3
nanocomposite as electrolyte. During the initial operation period, the fuel cell exhibited a
minimum performance; within 50 min operation the performance of the cell increases
gradually and then a relatively steady output was delivered, due to the activation of the
electrode catalysts and interfaces between the electrodes and electrolyte.88,89 Then the cell
was operated constantly at 550 °C for more than 12 h; despite a slight degradation after 12
h operation, an average power density output of 0.62 W cm-2 was delivered. This high
performance at low temperature depends mainly on the high ionic conductivity of the
composite electrolyte, which is realized by unique interfacial oxygen ion conduction of
two-phase composite materials. In conclusion, the notable durability not only verified
thermal stability of the SDC/Na2CO3 nanocomposite and its potential for low-temperature
SOFCs, but also demonstrated that nanocomposite approach is an effective and practical
approach to develop nanostructured fast ionic conductor for long-term SOFCs technology.
(a) (b)
28
3.2 SDC nanowires/ Na2CO3 nanocomposite electrolyte
3.2.1 Synthesis Mechanism of SDC nanowires
Citric acid (H3Cit) is an important reagent in our new synthetic route for SDC
nanowires. It is a polyprotic acid, which can take various deprotonated ionic forms (H2Cit-,
HCit2-, and Cit3-) in aqueous solution, depending on pH. Due to chelate formation, these
carboxylates are known to form stable coordination complexes with various metal ions.101
The stable metal ion precursor solutions are perfect to be used for generation of
homogeneous nucleation sites, leading to the growth of special nano-architectures.
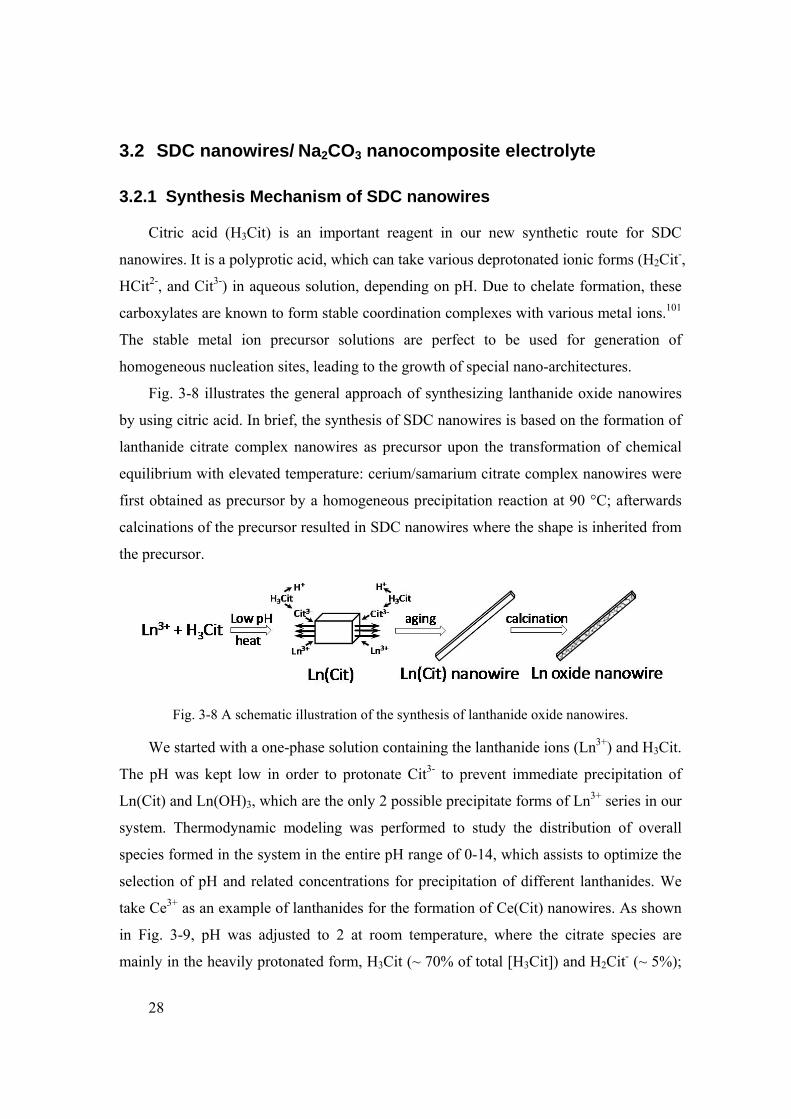
Fig. 3-8 illustrates the general approach of synthesizing lanthanide oxide nanowires
by using citric acid. In brief, the synthesis of SDC nanowires is based on the formation of
lanthanide citrate complex nanowires as precursor upon the transformation of chemical
equilibrium with elevated temperature: cerium/samarium citrate complex nanowires were
first obtained as precursor by a homogeneous precipitation reaction at 90 °C; afterwards
calcinations of the precursor resulted in SDC nanowires where the shape is inherited from
the precursor.
We started with a one-phase solution containing the lanthanide ions (Ln3+) and H3Cit.
The pH was kept low in order to protonate Cit3- to prevent immediate precipitation of
Ln(Cit) and Ln(OH)3, which are the only 2 possible precipitate forms of Ln3+ series in our
system. Thermodynamic modeling was performed to study the distribution of overall
species formed in the system in the entire pH range of 0-14, which assists to optimize the
selection of pH and related concentrations for precipitation of different lanthanides. We
take Ce3+ as an example of lanthanides for the formation of Ce(Cit) nanowires. As shown
in Fig. 3-9, pH was adjusted to 2 at room temperature, where the citrate species are
mainly in the heavily protonated form, H3Cit (~ 70% of total [H3Cit]) and H2Cit- (~ 5%);
Fig. 3-8 A schematic illustration of the synthesis of lanthanide oxide nanowires.

Functional Materials Division, KTH, 2009 29
and complexed with Ce3+ (~ 25%). Although Ce citrate complex also include other
complex series than Ce(Cit), such as [Ce(HCit)]+, [Ce(Cit)2]3-, and [Ce(HCit)2]
-, etc.,102
only Ce(Cit) is considered here to simplify the study since it is the dominant complex
form. This pH value was specifically chosen in order to keep Ce(Cit) in a proper
concentration close to saturation. When the temperature was elevated to 90 °C, the
endothermic deprotonation process for citrate was favored according to the Van’t Hoff
law (Eq. 1), resulting in formation of more dissociated Cit3- and proton. The pH drop of
the resultant solution from 2.0 to ca. 1.2 has been monitored, confirming the dissociation
mechanism during aging process at 90 °C.
2
1 2 1
1 1ln
K H
K R T T
(1)
When the concentration of Ce(Cit) exceeded the saturation concentration, nucleation
began which further promoted the equilibrium towards the precipitation in Eq. 2.
3 3- ( )( )Ce Cit Ce Cit s (2)
The formation mechanism of these precursor nanowires is probably due to highly
anisotropic structure of Ce(Cit).103 Then, by calcinations of lanthanide citrate nanowires
precursor, oxide nanowires are obtained accordingly where the shape is inherited from the
precursor.
Fig. 3-9 Thermodynamic modeling diagram showing the distribution of the fraction of citrate species as a function of pH at 25 oC. (Initial conditions are: [Ce3+] = 0.1 M, total [H3Cit] =0.3 M).

30
3.2.2 Characterization of lanthanide citrate precursor
Phase identification of the citrate precursor was carried out using typical XRD (Fig.
3-10). The XRD pattern of cerium/samarium citrate complex shows a very complicated
phase structure, but there is no direct crystallographic data on cerium citrate. However, as
cerium is chemically and structurally very similar to La, by analogy we might consider
cerium citrate isostructural with La citrate. A recent paper on La citrate reports a
monoclinic crystal structure.101 XRD pattern of as-synthesized Sm doped cerium citrate
precursor shows very high resemblance to that of La citrate indicating a similar
monoclinic crystal structure. More detail crystallography structure will be investigated.
Fig. 3-11 SEM image of (a) Ce/Sm citrate complex nanowires. (b) A single citrate nanowire.
Scanning electron microscopy (SEM) image of the precursor reveals quite uniform
1D nanowires structure of the citrate complex with very high aspect ratio. It can be clearly
seen that the length of all the citrate nanowires are more than 15 μm, as shown in Fig.
Fig. 3-10 XRD pattern of Sm doped cerium citrate complex precursor.
(a) (b)
Functional Materials Division, KTH, 2009 31
3-11 (a). A closer SEM image of a single nanowire indicates the diameter of the citrate
complex nanowires is approximately 200 nm. As suggested previously, the formation
mechanism of these precursor nanowires is probably due to highly anisotropic structure of
lanthanide citrate.
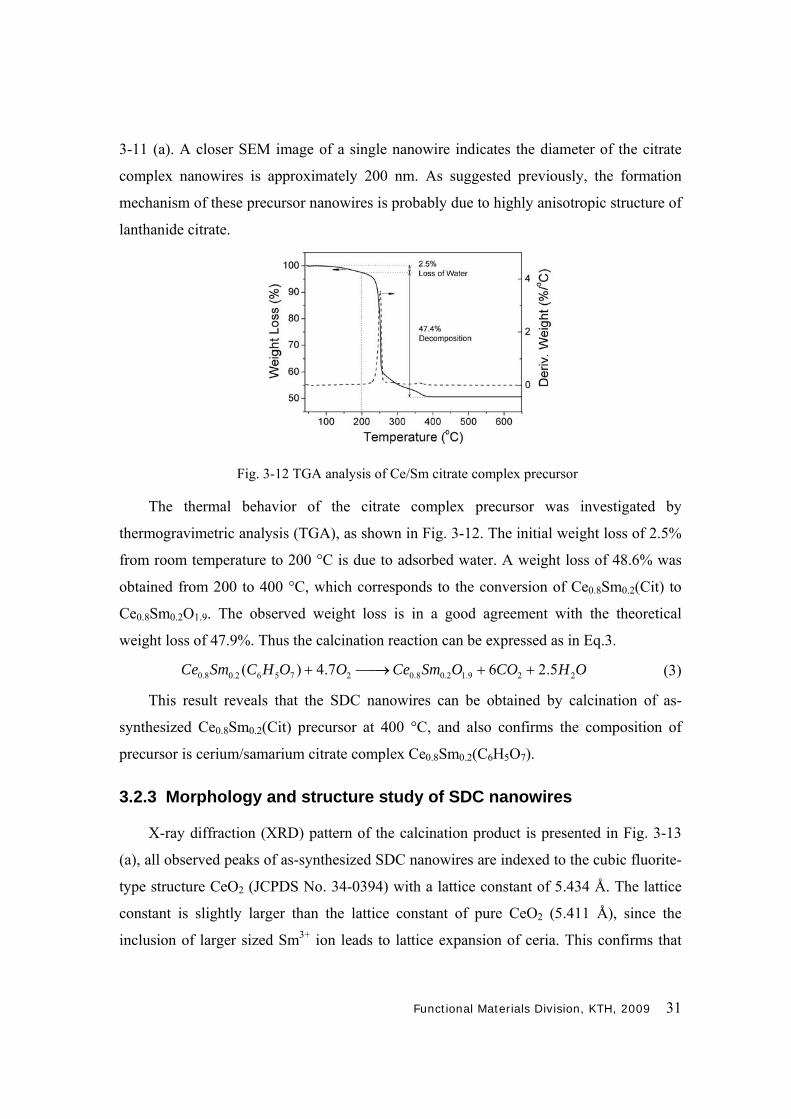
Fig. 3-12 TGA analysis of Ce/Sm citrate complex precursor
The thermal behavior of the citrate complex precursor was investigated by
thermogravimetric analysis (TGA), as shown in Fig. 3-12. The initial weight loss of 2.5%
from room temperature to 200 °C is due to adsorbed water. A weight loss of 48.6% was
obtained from 200 to 400 °C, which corresponds to the conversion of Ce0.8Sm0.2(Cit) to
Ce0.8Sm0.2O1.9. The observed weight loss is in a good agreement with the theoretical
weight loss of 47.9%. Thus the calcination reaction can be expressed as in Eq.3.
0.8 0.2 6 5 7 2 0.8 0.2 1.9 2 2( ) 4.7 6 2.5Ce Sm C H O O Ce Sm O CO H O (3)
This result reveals that the SDC nanowires can be obtained by calcination of as-
synthesized Ce0.8Sm0.2(Cit) precursor at 400 °C, and also confirms the composition of
precursor is cerium/samarium citrate complex Ce0.8Sm0.2(C6H5O7).
3.2.3 Morphology and structure study of SDC nanowires
X-ray diffraction (XRD) pattern of the calcination product is presented in Fig. 3-13
(a), all observed peaks of as-synthesized SDC nanowires are indexed to the cubic fluorite-
type structure CeO2 (JCPDS No. 34-0394) with a lattice constant of 5.434 Å. The lattice
constant is slightly larger than the lattice constant of pure CeO2 (5.411 Å), since the
inclusion of larger sized Sm3+ ion leads to lattice expansion of ceria. This confirms that

32
the Sm3+ ions have been doped into the crystal lattice of CeO2. The average crystallite size
of SDC nanowires calculated by Scherrer’s equation is ~7 nm.
Fig. 3-13 Phase identification and morphology characterization of SDC nanowires. (a) XRD pattern of the as-prepared SDC nanowires. (b) SEM image of the as-prepared SDC nanowires. (c) HRTEM image of inner zone of SDC nanowires and the inset of (c) is the SAED pattern of an individual nanowire. (d) EELS spectra of SDC nanowires showing energy loss edges of Sm (N4,5), Ce (N1, M4,5) and O (K).
Scanning electron microscopy (SEM) image (Fig. 3-13 b) reveals that as-synthesized
SDC nanowires are uniform with a high aspect ratio. The length of nanowires is more
than 10 µm and the diameter ranges from 100 nm to 200 nm. High-resolution TEM
(HRTEM) micrograph taken from inner zone of the nanowire (Fig. 3-13 c) shows the
texture of a single nanowire as poly-crystalline with recognizable boundaries or voids.
The average crystallite size is calculated as 7±1 nm from several HRTEM micrographs,
which matches well with that calculated from XRD. The selected area electron diffraction
(SAED) pattern recorded on a single nanowire verifies the poly-crystalline nature (shown
in inset of Fig. 3-13 c). Electron energy loss spectroscopy (EELS) results, shown in Fig.
3-13 d, confirms that the nanowires are comprised of only Sm (N4,5), Ce (N1, M4,5) and O
(K). The intensity of Ce (M4) line is observed to be higher than that of Ce (M5), indicating
that the oxidation state of cerium in the SDC nanowires is mainly +4, according to the
analysis of the fine structure of M4 and M5 lines of cerium by Manoubi et al.104

Functional Materials Division, KTH, 2009 33
3.2.4 Characterization of SDC nanowires/Na2CO3 nanocomposite
In chapter 3.1.2, it has been clearly demonstrated that SDC nanostructures have been
well-preserved even at 700 °C by adding an amorphous Na2CO3 as inclusion, which
means that “nanocomposite” strategy allows some nanostructures, which are thermally
unstable to be applied in high temperature applications such as SOFC. Here, the same
inclusion material, Na2CO3 at 20 wt% content, was added to stabilize SDC nanowires at
elevated temperature. The SDC nanocomposites were then annealed at 600 °C for 2 h and
fast-cooled for the formation of amorphous Na2CO3. The XRD pattern of SDC
nanowires/Na2CO3 nanocomposite is shown in Fig. 3-14. There is no extra peak than SDC
phase, indicating the amorphous nature of Na2CO3 in the nanocomposite as planned.
Fig. 3-14 XRD pattern of as-prepared SDC nanowires/Na2CO3 nanocomposite
The composition of as-prepared SDC nanowires/Na2CO3 nanocomposite determined
by energy dispersive X-ray spectroscopy (EDX) is shown in Fig. 3-15. Na, Ce, Sm, C and
O elements were detected, without any other impurities. The calculated atomic ratio of Na:
Fig. 3-15 EDX analysis of as-prepared SDC nanowires/Na2CO3 nanocomposite.

34
Ce: Sm by EDX element analysis is 38: 37: 9, which confirms the composition and the
content of SDC (80 wt%) and Na2CO3 (20 wt%), fitting well with the designed/targeted
composition.
3.2.5 Fuel cell test and electrochemical study
Fig. 3-16 A schematic illustration of the SOFC showing materials and thickness of each component, and a picture of a real SOFC.
A single fuel cell was fabricated using as-synthesized SDC nanowires/Na2CO3
nanocomposite as electrolyte to evaluate its electrochemical performance. The SDC
nanowires/Na2CO3 nanocomposite (electrolyte) was compacted together with common
commercial NiO powder (anode) and lithiated NiO powder (cathode) by a co-pressing
process, followed by sintering at 700 °C to get a well-adhered trilayer pellet, as shown in
Fig. 3-16. The thickness of each layer could be readily controlled by varying the amounts
of materials used. Fig. 3-17 (a) shows a typical cross-section SEM micrograph of as-
fabricated single cell. The electrolyte layer of the SDC nanowires/Na2CO3 nanocomposite
is about 200 μm thick and appears to be fully dense without noticeable connected pores,
while the anode and cathode layer displays distinctly porous structure. As shown in Fig.
3-17 (b), the electrolyte layer is comprised of dense clusters of almost parallel SDC
nanowires, indicating that the nanostructure of SDC nanowires have been well-preserved
even after annealing at 600 °C, co-pressing under pressure and sintering at 700 °C.
Another function of amorphous Na2CO3 inclusion, as described in previously, is the
softening effect of amorphous Na2CO3 under fuel cell operation temperature, which could
further enhance densification of solid electrolyte layer to prevent any gas leakage.

Functional Materials Division, KTH, 2009 35
Fig. 3-17 (a) Cross section SEM image of a single cell based on SDC nanowires/Na2CO3 nanocomposite electrolyte and (b) a closer view of the electrolyte layer.
Fig. 3-18 I-V and I-P characteristics of a single cell based on SDC nanowires/Na2CO3 composite electrolyte with a thickness of 200 μm at various temperatures.
Fig. 3-18 exhibits the current-voltage characteristics and corresponding power
densities for a single cell based on the SDC nanowires/Na2CO3 nanocomposite electrolyte
at various temperatures. The maximum power densities (Pmax) of 160, 316, 417 and 522
mW cm-2 have been achieved for the fuel cell at 450, 500, 550 and 600 °C, respectively.
The performance of as-fabricated SOFC based on SDC nanowires/Na2CO3
nanocomposite electrolyte is much better than the single cell based on the state-of-the-art
Gd-doped ceria (GDC) electrolyte of similar thickness (Pmax of 130 mW cm-2 at 550 °C,
220 mW cm-2 at 600 °C).105,106 The mechanism of the better performance can be ascribed
to enhanced ionic conductivity of nanocomposite. The conductivity enhancement of
nanocomposite is not simply additive; rather it is a synergistic effect in the sense that the
overall conductivity is significantly higher than both of the constituent phases, a
surprising finding which can be ascribed to interfacial conduction. The interface supplies

36
high conductivity pathway for ionic conduction, which have the capacity to increase
mobile ion concentration than that of the bulk. Furthermore, the notable performances
verify that that nanocomposite is an effective way to design promising electrolyte
materials for low-temperature SOFCs.
However, the grain-boundary/interface of the SDC nanowires determined by their
structure needs to be further optimized by aligning these nanowires, since they are now
randomly assembled. This may explain the slightly lower performance of the SDC
nanowires/Na2CO3 electrolyte as compared to the core-shell SDC/amorphous Na2CO3
nanocomposite electrolyte (chapter 3.1.4). Furthermore, the power density output of
single cell made of SDC nanowires/Na2CO3 composite electrolyte will be further
improved by decreasing thickness of electrolyte layer.
Functional Materials Division, KTH, 2009 37
4 Conclusions
In conclusion, nanocomposite approach has been successfully applied to develop
solid electrolyte materials with enhanced ionic conductivity for low-temperature SOFC.
Firstly, novel core-shell SDC/amorphous Na2CO3 nanocomposite has been
successfully fabricated with the particle size smaller than 100 nm. The thickness of
amorphous Na2CO3 shell is 4~6 nm. Superionic conductivity was observed for the
nanocomposite electrolyte, where the conductivity reaches over 0.1 S cm-1 above 300 °C.
Notable thermal stability of such nanocomposite has also been confirmed, since the
crystallite sizes, BET surface areas, and morphology of SDC/Na2CO3 maintained much
better than pure SDC sample. The nanocomposite was applied in LTSOFC with an
excellent performance of 0.8 W cm-2 at 550 °C, and good durability of 0.62 W cm-2steady
output at 550 °C over 12 h operation, which is much improved compared to the current
single phase electrolyte. The high performances together with notable thermal stability
make the SDC/Na2CO3 nanocomposite as a potential electrolyte material for long-term
SOFC that operate at 500-600 °C.
Secondly, SDC nanowires have been successfully synthesized by a novel economical
method, using citric acid as precipitating/complexing agent for direct formation of
nanowires in aqueous solutions. The synthesis mechanism has been well investigated, and
this template and surfactant-free method which can produce large quantities of nanowires,
can be regarded as a new synthetic strategy for fabrication of nanostructured lanthanide
compounds. The “nanocomposite” approach using Na2CO3 has been successfully adopted
to enhance the thermal stability of SDC nanowires at high operation temperature of SOFC.
The single SOFC based on SDC 1D nano-architectures has been fabricated and
demonstrated for the first time. The maximum power densities of 417 and 522 mW cm-2
at 550 and 600 °C have been achieved, which is much better than SOFC using
conventional bulk ceria-based materials as electrolytes, demonstrating its great potential
for low-temperature SOFC applications.

38
Future work
In the future, there are mainly two parts of work need to be investigated, regarding to
electrolyte and electrode materials for low-temperature SOFC.
On electrolyte materials, future work will be focused on how size and morphology of
host particles (SDC) affects the properties of nanocomposite. Based on the interfacial
effect, size and morphology of the host particles will influence the volume of interface.
Particles with different size require different amount of second phase material to obtain
optimized volume of interface. Therefore, three or even more orders of host particle size
will be synthesized and studied. The influence of host particles with varied morphology
will be studied in the same way. The aim of this part is to fabricate larger volume of
superionic conductivity path, i.e. interface, through size and morphology of host phase,
which will not only increase electrolyte performance but also prove the mechanism.
On electrodes, compatible electrode materials for nanocomposite electrolyte will be
developed for low-temperature SOFC, either through development of new materials or
fabrication of improved structures. For example, ceria-based matrix with porous structure
will be synthesized as electrodes and catalyst materials like NiO, CuO will be loaded to
matrix then, since porous structure of mixed conducting electrodes are desirable for fast
transport of ionic and electronic defects through the solid phase, rapid flow of gases
through the pores, and for efficient electrochemical reactions at the interface.
Functional Materials Division, KTH, 2009 39
Acknowledgements
First and foremost, I would like to express profound gratitude to my supervisor, Prof.
Mamoun Muhammed, for giving me the opportunity to join the Functional Materials
Division in KTH, and for his invaluable support, encouragement, supervision and useful
suggestions throughout this research work. His continuous guidance enabled me to carry
on my work successfully.
Zillions of thanks to my co-supervisor, Dr. Bin Zhu, for all his supervision,
cooperation, even criticism on research work and enormous help on my life in Sweden.
Without him, I wouldn’t have chance to study in Sweden. I wish him a great success in
the scientific career and best of the best for all his family.
I would like to thank Rizwan Raza, my research partners from Department of Energy
Technology, KTH, for his tremendous help and fruitful discussions.
Thousands of thanks to Dr. Muhammet S. Toprak and Dr. Shanghua Li, for their
tremendous help, discussion, incredible patience and continuous encouragement. I wish
them the best for their future profession. Many thanks to Sylvan, Andrea, Fei, Carmen,
Sverker, Abhi, Salam and all other members in Functional Materials Division for their
priceless friendship. I wish all the best to them, both for their research and for their life.
Special thanks to Chinese Scholarship Council (CSC), which financially supported
my PhD study in Sweden for three years. Thanks should also go to my home university,
Harbin Engineering University, China, which made it possible for me to work on my PhD
project in KTH as profession training during these years.
I would like to deeply thank my family thousands of miles apart, my parents, my
sister, my brother, whose constant care and concern helped me to go through these years.
Finally, I owe my deepest gratitude to the most important person in my life, Xiaodi
Wang, my research partner on work and soul mate in life. Xiaodi has been a true and great
supporter and has unconditionally loved me during my good and bad times. These past
several years have not been an easy ride, both academically and personally. I truly thank
Xiaodi for sticking by my side, even when I was irritable and depressed. I feel that what
we both learned about life strengthened our commitment and determination to each other.
We surely will live our lives to the fullest in the future.
40
References 1 International Energy Outlook 2009, Energy Information Administration , Washington
DC, 2009; http://www.eia.doe.gov/oiaf/ieo/ 2 Greenhouse Gases, Climate Change and Energy, Energy Information Administration,
Washington DC, 2008;
http://www.eia.doe.gov/bookshelf/brochures/greenhouse/Chapter 1.htm 3 Renewable and Alternative Fuels Basics, Energy Information Administration,
Washington DC, 2008; http://www.eia.doe.gov/basics/renewalt_basics.html 4 Busby, R. L. Hydrogen and fuel cells: a comprehensive guide. New York. PennWell
Corp. 2005. 5 Wilson, M., Kannangara, K., Smith, G., Simmons, M., Raguse, B. Nanotechnology:
Basic Science and Emerging Technologies. New York. Chapman & Hall/CRC. 2002. 6 Gogotsi, Y. Nanomaterials handbook. Boca Raton. CRC Press. 2006. 7 Maier, J. Nat. Mater. 2005, 4, 805 8 Despotuli, A. L., Nikolaichik, V. I. Solid State Ionics 1993, 60, 275 9 Arico, A. S., Bruce, P., Scrosati, B., Tarascon, J., Schalkwijk, W. Nat. Mater. 2005, 4,
366 10 Ruiz-Trejo, E., Santoyo-Salazar, J., Vilchis-Morales, R., Benitez-Rico, A., Gomez-
Garcia, F., Flores-Morales, C., Chavez-Carvayar, J., Tavizon, G. J. Solid State Chem.
2007, 180, 3093 11 Bellino, M. G., Lamas, D. G., Walsoe de Reca, N. E. Adv. Funct. Mater. 2006, 16, 107 12 Bellino, M. G., Lamas, D. G., Walsoe de Reca, N. E. Adv. Mater. 2006, 18, 3005 13 Knöner, G., Reimann, K., Röwer, R., Södervall, U., Schaefer, H. E. PNAS 2003, 100,
3870 14 EG&G Technical Services, I. Fuel cell handbook (6th edn). West Virginia. National
Energy Technology Laboratory. 2002. 15 Kordesch, K., Simader, G. Fuel Cell and Their applications. New York. VCH
Publishers Inc. 1996. 16 Ormerod, R. M. Chem. Soc. Rev. 2003, 32, 17 17 Carrette, L., Friedrich, K. A., Stimming, U. Fuel Cells 2001, 1, 5 18 Grove, W. R. Phil. Mag. Ser. 1839, 14, 127
Functional Materials Division, KTH, 2009 41
19 Mond, L., Langer, C. Proc. R. Soc. London 1889, 46, 296 20 Francis Thomas Bacon, Encyclopædia Britannica, 2009; http://www.britannica.com/
EBchecked/topic/48160/Francis-Thomas-Bacon 21 EG&G Technical Services, I. Fuel cell handbook (7th edn). West Virginia. National
Energy Technology Laboratory. 2004. 22 Singhal, S. C., Kendall, K. High-temperature Solid Oxide Fuel Cells: Fundamentals,
Design and Applications. Oxford, UK. Elsevier Advanced Technology. 2003. 23 McIntosh, S., Gorte, R. J. Chem. Rev. 2004, 104, 4845 24 Mogensen, M., Kammer, K. Annu. Rev. Mater. Res. 2003, 33, 321 25 Lu, C., Worrell, W. L., Wang, C., Park, S., Kim, H., Vohs, J. M., Gorte, R. J. Solid
State Ionics 2002, 152-153, 393 26 Steele, B. C. H. Solid State Ionics 2000, 134, 3 27 Yokokawa, H., Sakai, N., Horita, T., Yamaji, K., Brito, M. E. MRS Bull. 2005, 30, 591 28 Goodenough, J. B. Annu. Rev. Mater. Res. 2003, 33, 91 29 Fergus, J. W. J. Power Sources 2006, 162, 30 30 Kharton, V. V., Marques, F. M. B., Atkinson, A. Solid State Ionics 2004, 174, 135 31 Kimpton, J., Randle, T. H., Drennan, J. Solid State Ionics 2002, 149, 89 32 Kawada, T., Mizusaki, J. Handbook of Fuel Cells—Fundamantals, Technology and
Applications. New Jersey, USA. John Wiley & Sons. 2003. 987 33 Skinner, S. J., Kilner, J. A. Mater. Today 2003, 6, 30 34 Inaba, H., Tagawa, H. Solid State Ionics 1996, 83, 1 35 Steele, B. C. H. Solid State Ionics 2000, 129, 95 36 Ishihara, T., Matsuda, H., Takata, Y. J. Am. Chem. Soc. 1994, 116, 3801 37 Feng, M., Goodenough, J. B. Eur. J. Solid State Inorg. Chem. 1994, 31, 663 38 Ishihara, T., Honda, M., Shibayama, T., Minami, H., Nishiguchi, H., Takita, Y. J.
Electrochem. Soc. 1998, 145, 3177 39 Ishihara, T. Handbook of Fuel Cells—Fundamantals, Technology and Applications.
New Jersey, USA. John Wiley & Sons. 2003. 1109 40 Gauckler, L. J., Beckel, D., Buergler, B. E., Jud, E., Muecke, U. P., Prestat, M., Rupp,
J. L. M., Richter, J. Chimia 2004, 58, 837 41 Tao, S., Irvine, J. T. S. Chem. Rec. 2004, 4, 83

42
42 Jiang, S. P., Chan, S. H. J. Mater. Sci. 2004, 39, 4405 43 Gorte, R. J., Kim, H., Vohs, J. M. J. Power Sources 2002, 106, 10 44 Atkinson, A., Barnett, S., Gorte, R. J., Irvine, J. T. S., McEvoy, A. J., Mogensen, M.,
Singhal, S. C., Vohs, J. Nat. Mater. 2004, 3, 17 45 Ruiz-Morales, J. C., Canales-Vazquez, J., Savaniu, C., Marrero-Lopez, D., Zhou, W.,
Irvine, J. T. S. Nature 2006, 439, 568 46 Tietz, F., Fu, Q., Haanappel, V. A. C., Mai, A., Menzler, N. H., Uhlenbruck, S. Int. J.
Appl. Ceram. Technol. 2007, 4, 436 47 Jiang, S. P. J. Solid State Electrochem. 2006, 11, 93 48 Vohs, J. M., Gorte, R. J. Adv. Mater. 2009, 21, 943 49 Jiang, S. P. Proc. - Electrochem. Soc. 2003, 2002-26, 145 50 Mogensen, M., Skaarup, S. Solid State Ionics 1996, 86-88, 1151 51 Ohno, Y., Nagata, S., Sato, H. Solid State Ionics 1981, 3-4, 439 52 Anderson, H. U., Tai, L., Chen, C. C., Nasrallah, M. M., Huebner, W. Proc. -
Electrochem. Soc. 1995, 95-1, 375 53 Skinner, S. J. Int. J. Inorg. Mater. 2001, 3, 113 54 Steele, B. C. H., Heinzel, A. 2001, 414, 345 55 Stambouli, A. B., Traversa, E. Renew. Sust. Energ. Rev. 2002, 6, 433 56 Simwonis, D., Tietz, F., Stöver, D. Solid State Ionics 2000, 132, 241 57 Brett, D. J. L., Atkinson, A., Brandon, N. P., Skinner, S. J. Chem. Soc. Rev.
2008, 37, 1568 58 Huijser, A., Schoonman, J. Environ. Eng. Manage. J. 2005, 4, 293 59 Sammes, N. M. in AIChE Spring Natl. Meet., Conf. Proc. 2004. 60 Beckel, D., Bieberle-Huetter, A., Harvey, A., Infortuna, A., Muecke, U. P., Prestat, M.,
Rupp, J. L. M., Gauckler, L. J. J. Power Sources 2007, 173, 325 61 Hosomi, T., Matsuda, M., Miyake, M. J. Eur. Ceram. Soc. 2007, 27, 173 62 Chen, Y., Wei, W. J. Solid State Ionics 2006, 177, 351 63 Huang, H., Nakamura, M., Su, P., Fasching, R., Saito, Y., Prinz, F. B. J. Electrochem.
Soc. 2007, 154, B20 64 Shim, J. H., Chao, C., Huang, H., Prinz, F. B. Chem. Mater. 2007, 19, 3850 65 Kokai, F., Amano, K., Ota, H., Ochiai, Y., Umemura, F. J. Appl. Phys. 1992, 72, 699

Functional Materials Division, KTH, 2009 43
66 Guo, X., Sigle, W., Fleig, J., Maier, J. Solid State Ionics 2002, 154-155, 555 67 Tuller, H. L. Solid State Ionics 2000, 131, 143 68 Jung, W., Hertz, J. L., Tuller, H. L. Acta Materialia 2009, 57, 1399 69 Schober, T. Electrochem. Solid-State Lett. 2005, 8, A199 70 Liang, C. C. J. Electrochem. Soc. 1973, 120, 1289 71 Bhattacharyya, A. J., Maier, J. Adv. Mater 2004, 16, 811 72 Chung, R. W. J. M., Leeuw, S. W. Solid State Ionics 2004, 175, 851 73 Hariharan, K., Maier, J. J. Electrochem. Soc. 1995, 142, 3469 74 Lee, J., Adams, S., Maier, J. J. Electrochem. Soc. 2000, 147, 2407 75 Maier, J., Reichert, B. Ber. Bunsen-Ges. Phys. Chem. 1986, 90, 666 76 Maier, J. J. Phys. Chem. Solids 1985, 46, 309 77 Jin-Phillipp, N. Y., Sata, N., Maier, J., Scheu, C., Hahn, K., Kelsch, M., Ruhle, M. J.
Chem. Phys. 2004, 120, 2375 78 Maier, J. Ber. Bunsen-Ges. Phys. Chem. 1985, 89, 355 79 Sata, N., Eberman, K., Eberl, K., Maler, J. Nature (London) 2000, 408, 946 80 Shahi, K., Wagner, J. B. Appl. Phys. Lett. 1980, 37, 757 81 Maier, J. Solid State Ionics 2004, 175, 7 82 Tuller, H. L. Solid State Ionics 2000, 131, 143 83 Zhu, B., Mat, M. D. Int. J. Electrochem. Sci. 2006, 1, 383 84 Zhu, B. in Int. Conf. Fuel Cell Sci., Eng. Technol., 2nd. 2004. 85 Zhu, B. Key Eng. Mater. 2005, 280-283, 413 86 Zhu, B. Solid State Ionics 2001, 145, 371 87 Zhu, B. Ionics 1998, 4, 435 88 Huang, J., Yang, L., Gao, R., Mao, Z., Wang, C. Electrochem. Commun. 2006, 8, 785 89 Zhu, B., Liu, X., Sun, M., Ji, S., Sun, J. Solid State Sci. 2003, 5, 1127 90 Zhu, B., Liu, X., Zhou, P., Zhu, Z., Zhu, W., Zhou, S. J. Mater. Sci. Lett. 2001, 20, 591 91 Huang, J., Mao, Z., Liu, Z., Wang, C. Electrochem. Commun. 2007, 9, 2601 92 Zhu, B., Liu, X., Zhou, P., Yang, X., Zhu, Z., Zhu, W. Electrochem. Commun. 2001, 3,
566 93 Zhu, B., Albinsson, I., Mellander, B. Solid State Ionics 2000, 135, 503 94 Zhu, B., Liu, X., Schober, T. Electrochem. Commun. 2004, 6, 378
44
95 Huang, J., Mao, Z., Liu, Z., Wang, C. J. Power Sources 2008, 175, 238 96 Zhu, B., Li, S., Mellander, B. Electrochem. Commun. 2008, 10, 302 97 Hui, S., Roller, J., Yick, S., Zhang, X., Deces-Petit, C., Xie, Y., Maric, R., Ghosh, D. J.
Power Sources 2007, 172, 493 98 Vollath, D., Szab, D. V., Hau, J. J. Eur. Ceram. Soc. 1997, 17, 1317 99 Wang, X., Ma, Y., Raza, R., Muhammed, M., Zhu, B. Electrochem. Commun. 2008, 10,
1617 100 Shao, Z., Haile, S. M. Nature 2004, 431, 170 101 Vanhoyland, G., Pagnaer, J., D'Haen, J., Mullens, S., Mullens, J. J. Solid State Chem.
2005, 178, 166 102 Sal'nikov, Y. I., Zhuravleva, N. E. Zh. Neorg. Khim. 1986, 31, 873 103 Xia, Y., Yang, P., Sun, Y., Wu, Y., Mayers, B., Gates, B., Yin, Y., Kim, F., Yan, H.
Adv. Mater. 2003, 15, 353 104 Manoubi, T., Colliex, C., Rez, P. J. Electron Spectrosc. Relat. Phenom. 1990, 50, 1 105 Ying, L., Zha, S., Liu, M. Adv. Mater. 2004, 16, 256 106 Zha, S., Rauch, W., Liu, M. Solid State Ionics 2004, 166, 241