central nervous system tumor distribution at a tertiary ... · pdf filecentral nervous system...
TRANSCRIPT

Forum
Central Nervous System Tumor Distribution at a Tertiary Referral Center in Uganda
Jeffrey Hatef1, Cory Adamson3, Oscar Obiga2, Blessing Taremwa2, Hussein Ssenyojo2, Michael Muhumuza2,
Michael Haglund3, Kristin Schroeder4
INTRODUCTION
ancer has become the leading cause of death anddisability in the developing world, with more than 55% of
Cthe 12.7 million known cancer cases globally and 64% ofthe known 7.6 million cancer related deaths worldwide occurringin lower- and middle-income countries (LMICs) (43). Of thesecancer diagnoses, up to 20% are central nervous system (CNS)tumors. Significant variation exists between the reported inci-dence of primary CNS tumors in the United States and other high-income countries (HICs) and LMIC worldwide: 20.1 per 100,000and 3.2�3.9 per 100,000 respectively (3, 7, 15).Although there is known geographic variation in cancer incidence,
the 5-fold lower comparative rate for global CNS tumors is likely anunderestimate because of limited diagnostic health infrastructure inmany LMICs (37). In East Africa, there is 1 neurosurgeon per 9millionpeople, compared with 1 per 62,500 people in the United States, witheven fewer pathologists and radiation oncologists (9). In Uganda,before 2007 only 5 neurosurgeonswere available to serve a populationof more than 36 million people (12, 17, 22). With restricted neuro-surgical services, CNS tumor biopsies are not routinely performed,contributing to the limited availability of epidemiologic data andtreatment options in the East African Population.In 2007, a collaborative effort between Duke University
Department of Neurosurgery and Mulago Hospital in Kampala,Uganda, expanded neurosurgical capabilities with delivery ofsurplus equipment and establishment of neurosurgical trainingcamps. As a result, Mulago Hospital began to offer more complexsurgical treatment for patients, including an increased number ofcraniotomies for intracranial tumors (17). It is now the onlyneurosurgical referral center in Uganda, treating patients from all13 municipalities, providing a more comprehensive patient pop-ulation to evaluate CNS tumor distribution.This study is a retrospective review of clinically diagnosed
neurosurgical masses at Mulago Hospital in Kampala, Uganda from
Key words- Brain neoplasm- Developing countries- Neurosurgery- Uganda
Abbreviations and AcronymsCNS: Central nervous systemHIC: High-income countryIQR: Interquartile rangeLMIC: Lower- and middle-income countryNOS: Not otherwise specified
258 www.SCIENCEDIRECT.com WORLD NEU
2009 to 2012. We describe the distribution of identified masses bydemographics, location, clinical diagnosis, and surgical treatment.This study identified key differences in CNS tumor distributionbetween the United States and Mulago Hospital and highlights theneed for the development of a comprehensive CNS tumor registry.
METHODS
Admission records, clinic registries, and surgery registries from2009�2012 were reviewed for patients seen in the Mulago Hospitalneurosurgery clinic or admitted to Mulago National Referral Hos-pital in Kampala, Uganda. Individual medical records were furtherreviewed for patients identified as having intracranial or spinal cordmasses presumed to be neoplastic, including the search terms“posterior fossa mass,” “intracranial tumor,” “brain tumor ormass” or “spinal tumor or mass.” Extracted data were thenanalyzed to determine the frequency of CNS tumors in the patientpopulation at Mulago Hospital. Recorded data were deidentifiedbut included demographic (age and sex), diagnosis, and treatmentreceived. The presence of tumor was determined radiographically,and diagnoses were recorded as written in the medical record, withbiopsy confirmation when available. These data were not availablefor every patient, with incomplete data for sex in 30% (n ¼ 123),age in 2% (n ¼ 10/411), and tumor location in 22% (n ¼ 91/411).Descriptive statistical analysis was performed on the dataset todetermine the distribution of CNS tumors by sex, age, and year,and analyzed using the Pearson’s c2 test (JMP Pro v10; SAS Insti-tute, Cary, North Carolina, USA). Additional analysis included thedistribution of clinical diagnoses and tumor localization.
RESULTS
A total of 419 patients treated at Mulago National Referral Hospitalfrom 2009 to 2012 had radiographically identified intracranial andspinal cord masses. Five patients initially suspected of having CNS
From the 1Duke University School of Medicine, Durham, North Carolina, USA;2Department of Surgery, Mulago Hospital, Kampala, Uganda; 3Division of
Neurosurgery, Department of Surgery, and 4Division of Hematology-Oncology,Department of Pediatrics, Duke University Medical Center, Durham,North Carolina, USA
To whom correspondence should be addressed: Kristin Schroeder, M.D., M.P.H.[E-mail: [email protected]]
Citation: World Neurosurg. (2014) 82, 3/4:258-265.http://dx.doi.org/10.1016/j.wneu.2014.06.040
Journal homepage: www.WORLDNEUROSURGERY.org
Available online: www.sciencedirect.com
1878-8750/$ - see front matter ª 2014 Elsevier Inc. All rights reserved.
ROSURGERY, http://dx.doi.org/10.1016/j.wneu.2014.06.040

Table 2. Distribution of Central Nervous System Tumors byDiagnosis
Clinical/Histologic Diagnosis Number %
Unspecified brain tumor 141 34.3
Meningioma 98 23.8
Parasellar 44 10.7
Pituitary 32 7.8
Craniopharyngioma 12 2.9
Gliomas 49 11.9
NOS 26 6.3
FORUM
JEFFREY HATEF ET AL. CNS TUMOR DISTRIBUTION IN UGANDA
tumors were later found to have an acute or chronic infection andwere excluded from further analysis. In addition, developmentalabnormalities including 1 case each of myelomeningocele,epidermoid cyst, and fibrous dysplasia were similarly excluded.The remaining 411 patients were included in this analysis.
Tumor LocationA total of 23.6% (n ¼ 97) of the tumors did not record a location;32.1% (n ¼ 132) tumors were extra-axial, 25.1% (n ¼ 103) supra-tentorial, 13.9% (n ¼ 57) infratentorial, and 5.3% (n ¼ 22) spinalcord. Data were further divided by sublocation and is listed inTable 1.
Clinical and Histologic DiagnosisIncomplete records limited available diagnostic information, with34.8% (n ¼ 143) of the cases not identifying diagnosis beyond thegeneric term “brain tumor” or “brain mass.” Meningioma was themost commonly identified diagnosis (23.8%), followed by pitui-tary adenoma (7.8%), glioma not otherwise specified (NOS)(6.3%), and spinal cord tumor NOS (4.1%). Additional diagnosesare listed in Table 2.
Table 1. Central Nervous System Tumor Distribution byLocation
Location Number % Median Age (IQR) % Male
Supratentorial 103 25.1
Hemispheric 45 10.9 28 (14e47) 42.1
Sellar 33 8.0 30 (16e46) 47.4
Suprasellar/parasellar 14 3.4 33.5 (17.25e38) 75.0
Pineal 4 1.0 16 (13e28.5) 80.0
Orbit 3 0.7 16 (11.5e39) 50.0
Ventricular 4 1.0 24.5 (17e38) 25.0
Infratentorial 57 13.9
Posterior fossa NOS 54 13.1 14 (6.5e31) 66.1
Brainstem 3 0.7 27 (19e30) 100.0
Spinal cord 22 5.4
NOS 17 4.1 26 (15.5e48) 31.3
Sacrococcygeal 3 0.7 2 weeks 0.0
Extraaxial 2 0.5 28.5 (18.39) 100.0
Mesenchymal 132 32.1
Meninges 96 23.4 40 (30e46) 42.9
Soft tissue and bone 28 6.8 33.5 (17.25e48) 66.6
Peripheral nerve 8 1.9 32 (16e43) 50.0
Not specified 97 23.5
Parenchymal 96 23.3 37 (20e49) 57.3
Other 1 0.2 17 (3.25e31.5) 100.0
Total 411 100
IQR, interquartile range; NOS, not otherwise specified.
WORLD NEUROSURGERY 82 [3/4]: 258-265, SEPTEMBER/OCTOBER 2
Age and SexThe median age of diagnosis for the entire cohort was 31.5 years(interquartile range [IQR] 15�45) (Figure 1). Median ages of themost common diagnosis were 22 years for brain tumor NOS (IQR11�40), 39 years for meningioma (IQR 30�46), 30 years for
Low grade 9 2.2
Pilocytic astrocytoma 3 0.7
Oligodendroglioma 1 0.2
Diffuse astrocytoma 1 0.2
Ependymoma 4 1.0
High grade 14 3.4
Anaplastic 2 0.5
GBM 12 2.9
Other 27 6.6
Extraaxial sarcoma 14 3.4
Lipoma 7 1.7
Hemangioma 4 1.0
Hemangioblastoma 1 0.2
Lymphoma 1 0.2
Spinal cord tumor 19 4.6
Germ cell tumor 13 3.2
Dermoid cyst 10 2.4
Sacrococcygeal teratoma 3 0.7
Tumor of nerve sheath/peripheral nerve 9 2.2
Neurofibroma 7 1.7
Neurilemoma 1 0.2
PNST 1 0.2
Pineal tumor NOS 4 1.0
PNET/medulloblastoma 4 1.0
Metastatic 3 0.7
Total 411 100
NOS, not otherwise specified; GBM, glioblastoma multiforme; PNST, peripheral nervesheath tumor; PNET, primitive neuroectodermal tumor.
014 www.WORLDNEUROSURGERY.org 259

Figure 1. Distribution of patients with central nervoussystem tumors by age at Mulago Hospital from 2009to 2012.
Figure 3. Rate ratios by sex for central nervous system tumor diagnosisand location. GBM, glioblastoma multiforme; NOS, not otherwisespecified.
FORUM
JEFFREY HATEF ET AL. CNS TUMOR DISTRIBUTION IN UGANDA
pituitary adenoma (IQR 22e38), and 26 years for spinal cordtumor NOS (IQR 17�48) (Figure 2). A total of 129 patients (31.3%)were younger than 20 years of age.A total of 139 patients were female (48.1%) versus 150 male
(51.9%). A statistically significant difference was seen in sexdistribution for infratentorial parenchymal tumors: 33 male versus19 female, P < 0.05. There were also trends that did not meetsignificance for male dominance for craniopharyngioma andglioma NOS and female dominance for spinal cord tumors NOSand supratentorial parenchymal tumors (Figure 3).
Pediatric TumorsThere were 129 pediatric patients (0�19 years) with a diagnosis ofCNS tumor from 2009 to 2012. Of these, 47.2% (n ¼ 61) had anunidentified tumor diagnosis and were classified as NOS (47.2%,n ¼ 61). The most common clinically confirmed diagnoses werepituitary tumor NOS (9.3%, n ¼ 12), meningioma (6.9%, n ¼ 9),and craniopharyngioma (4.7%, n ¼ 6). Other diagnoses are listed
Figure 2. Median age and interquartile range of central nervous systemtumor by diagnosis at Mulago Hospital from 2009 to 2012. PNET,primitive neuroectodermal tumor.
260 www.SCIENCEDIRECT.com WORLD NEU
in Table 3. 27.1% of the tumors were infratentorial (n ¼ 35), with23.3% supratentorial (n ¼ 30) (Figure 4).
Operative TreatmentMost patients did not receive operative treatment for their CNStumor. Collectively, more than 64% of patients were treatednonoperatively: 28.7% (n ¼ 118) were admitted only withoutfurther intervention and 35.5% (n ¼ 149) were seen only in theoutpatient clinic. A total of 105 patients (25.5%) were brought tothe operating room for resection and an additional 5 (1.2%) had abiopsy only. Palliative shunting for hydrocephalus was performedin 34 patients (8.2%) (Figure 5A). Diagnostic tissue confirmationwas available for only 35.5% (n ¼ 39) of the 105 patients whounderwent tumor resection or biopsy. In 9 cases, the results oftissue confirmation were non-neoplastic. Of patients treated withsurgical resection, the median patient age was 33 (IQR 17e45),whereas the median patient age for a shunting procedure was 13.5(IQR 5.25�25) (Figure 5B).Cases were analyzed by year of diagnosis. A total of 108 cases
were diagnosed in 2009 (25.5%), 117 in 2010 (27.5%), 110 in 2011(26.8%), and 78 in 2012 (20.1%). Tissue diagnoses were availablefor 7 patients in 2009, 8 patients in 2010, 12 patients in 2011, and12 patients in 2012. Between 2011 and 2012, fewer patients wereadmitted or seen in the clinic without a subsequent surgicalintervention. Overall trends in treatments by year are displayed inFigure 6.
DISCUSSION
This study represents the largest review of combined adult andpediatric patients presenting with suspected CNS tumors inUganda. Previously published reports have focused on the inci-dence of all cancer diagnoses with minimal mention of CNStumors, with the only complete published review evaluatingpediatric patients with CNS tumors from the CURE children’sHospital (36, 39, 40). Mulago Hospital in Kampala is the largesthospital in the country (>1500 beds) and is home to 4 of the 5neurosurgeons practicing in Uganda, making it the main neuro-surgical referral hospital for a country of 36 million people (8).
ROSURGERY, http://dx.doi.org/10.1016/j.wneu.2014.06.040

Table 3. Distribution of Pediatric Central Nervous SystemTumors by Diagnosis
Clinical/Histologic Diagnosis Number %
Unspecified brain tumor 61 47.2
Parasellar 18 14.0
Pituitary 12
Craniopharyngioma 6
Germ cell tumor 10 7.8
Dermoid cyst 7
Sacrococcygeal teratoma 3
Meningioma 9 6.9
Other 9 6.9
Extraaxial sarcoma 4
Lipoma 2
Hemangioma 3
Gliomas 7 5.4
NOS 1
Low grade 6
Pilocytic astrocytoma 3
Ependymoma 3
Spinal cord tumor 5 3.9
Tumor of nerve sheath/peripheral nerve 4 3.1
Neurofibroma 2
Neurilemoma 1
PNST 1
PNET/medulloblastoma 4 3.1
Pineal tumor NOS 2 1.6
Total 129 100
NOS, not otherwise specified; PNST, peripheral nerve sheath tumor; PNET, primitiveneuroectodermal tumor.
Figure 4. Pediatric (0�19 years) central nervous system tumors byrecorded location. NOS, not otherwise specified.
FORUM
JEFFREY HATEF ET AL. CNS TUMOR DISTRIBUTION IN UGANDA
Patients who present to Mulago with symptoms concerning forCNS tumor receive neuroimaging and a tentative radiographicdiagnosis, with only 34.3% of patients being documented ashaving tumors NOS as the result of ambiguous radiographiccharacteristics. Of all patients with documented CNS tumors whopresented to Mulago Hospital, only 34% received surgicaltreatment.Similar to other LMIC, the limited diagnostic infrastructure in
Uganda—availability of trained radiologists, neurosurgeons, andpathologists—prevents pathologic diagnosis for many CNStumors. Epidemiologic data on the incidence of biopsy confirmedCNS neoplasms in Uganda are limited to a single population-based cancer registry for Kyadondo County administered by theDepartment of Pathology at Makerere University. Although thiscovers a catchment area of 1.2 million including Kampala, itcannot be extrapolated to the whole country (39, 40). However, the
WORLD NEUROSURGERY 82 [3/4]: 258-265, SEPTEMBER/OCTOBER 2
Kampala Cancer Registry reports CNS tumor rates of 1.3 per100,000, which is approximately one-third the rates seen in theUnited States and well below what we would estimate from ourreview (32). This mismatch is likely caused at least in part bythe limited number of craniotomies and CNS tumor biopsiesperformed, coupled with incomplete medical records.
Diagnostic ResultsThe most commonly defined CNS tumor diagnosis in adults atMulago was meningioma. A total of 30% of the patients olderthan the age of 20 were found to have meningiomas; the medianage of diagnosis was 39 (IQR 30�46). A similar percentage ofmeningioma cases have been reported in both the United Statesand in other African countries at 35.5% and 31.8%�35%, respec-tively (10, 14, 18-20, 25-27, 29).However, not all published series of African patients have
reported such high prevalence of meningioma. In a small series(n ¼ 30) of patients from Ghana with histologically proven CNSneoplasms, high-grade astrocytoma was the most frequent tumor,totaling 23% of diagnoses (4). In addition, a series published fromIbadan, Nigeria, ranked gliomas, particularly astrocytomas, asthe most common intracranial diagnosis, with meningiomasaccounting for only 11.4% of tumors (28, 29). Some authors havecommented that apparent epidemiologic disparities may be mostattributable to commonplace omissions, clerical errors, andrecordkeeping issues in developing countries (26). In our series,54% (n ¼ 224) of the cases had at least one data omission, eitherdemographic or diagnostic.Of particular interest in our series is the lack of a female pre-
dominance for meningioma. In US and European populations,meningiomas are more than twice as common in female than inmale patients (10). However, this was not seen in the currentseries. Equal sex distribution has been previously reported in aseries of Nigerian patients (26). The sex predominance of me-ningioma has been theorized to stem from the tumor’s over-expression of hormone receptors, including estrogen receptor andprogesterone receptor, and multiple aspects of the epidemiologyof meningioma imply a dependence on the female hormonalmilieu (6). Meningiomas have been associated with breast cancerand the menstrual cycle, and 80%�90% of spinal meningiomasoccur in women (11, 41). Although patients presenting with
014 www.WORLDNEUROSURGERY.org 261
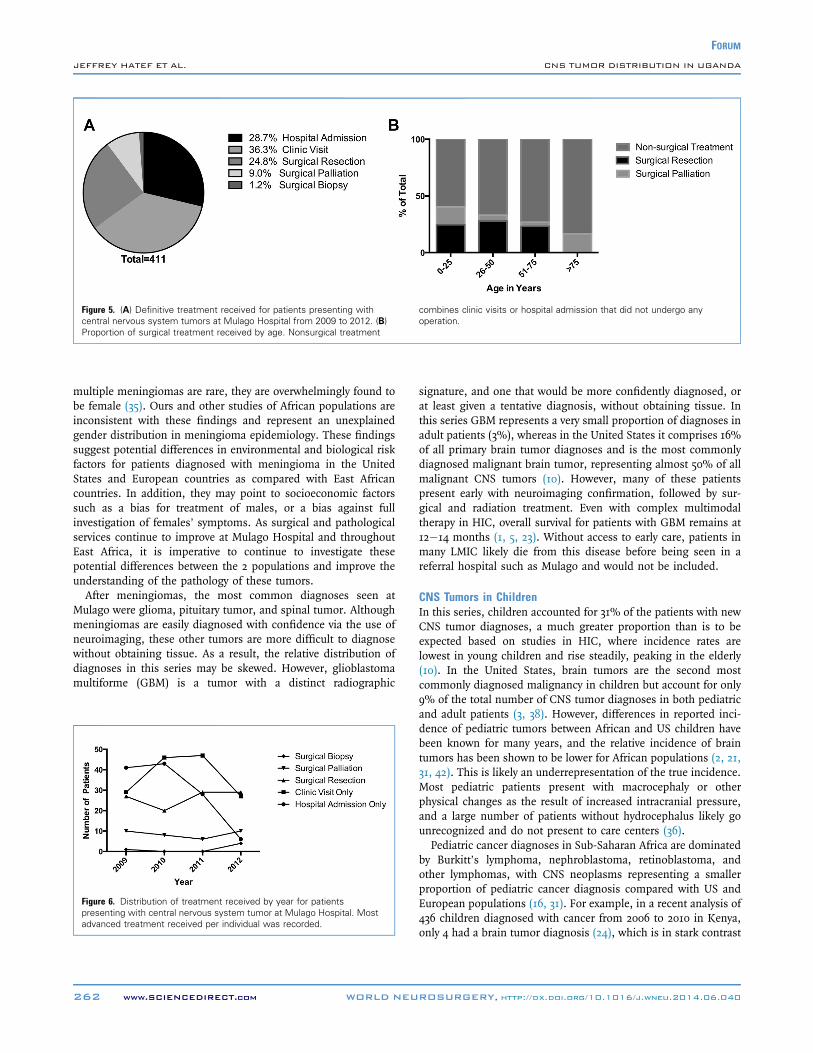
Figure 5. (A) Definitive treatment received for patients presenting withcentral nervous system tumors at Mulago Hospital from 2009 to 2012. (B)Proportion of surgical treatment received by age. Nonsurgical treatment
combines clinic visits or hospital admission that did not undergo anyoperation.
FORUM
JEFFREY HATEF ET AL. CNS TUMOR DISTRIBUTION IN UGANDA
multiple meningiomas are rare, they are overwhelmingly found tobe female (35). Ours and other studies of African populations areinconsistent with these findings and represent an unexplainedgender distribution in meningioma epidemiology. These findingssuggest potential differences in environmental and biological riskfactors for patients diagnosed with meningioma in the UnitedStates and European countries as compared with East Africancountries. In addition, they may point to socioeconomic factorssuch as a bias for treatment of males, or a bias against fullinvestigation of females’ symptoms. As surgical and pathologicalservices continue to improve at Mulago Hospital and throughoutEast Africa, it is imperative to continue to investigate thesepotential differences between the 2 populations and improve theunderstanding of the pathology of these tumors.After meningiomas, the most common diagnoses seen at
Mulago were glioma, pituitary tumor, and spinal tumor. Althoughmeningiomas are easily diagnosed with confidence via the use ofneuroimaging, these other tumors are more difficult to diagnosewithout obtaining tissue. As a result, the relative distribution ofdiagnoses in this series may be skewed. However, glioblastomamultiforme (GBM) is a tumor with a distinct radiographic
Figure 6. Distribution of treatment received by year for patientspresenting with central nervous system tumor at Mulago Hospital. Mostadvanced treatment received per individual was recorded.
262 www.SCIENCEDIRECT.com WORLD NEU
signature, and one that would be more confidently diagnosed, orat least given a tentative diagnosis, without obtaining tissue. Inthis series GBM represents a very small proportion of diagnoses inadult patients (3%), whereas in the United States it comprises 16%of all primary brain tumor diagnoses and is the most commonlydiagnosed malignant brain tumor, representing almost 50% of allmalignant CNS tumors (10). However, many of these patientspresent early with neuroimaging confirmation, followed by sur-gical and radiation treatment. Even with complex multimodaltherapy in HIC, overall survival for patients with GBM remains at12�14 months (1, 5, 23). Without access to early care, patients inmany LMIC likely die from this disease before being seen in areferral hospital such as Mulago and would not be included.
CNS Tumors in ChildrenIn this series, children accounted for 31% of the patients with newCNS tumor diagnoses, a much greater proportion than is to beexpected based on studies in HIC, where incidence rates arelowest in young children and rise steadily, peaking in the elderly(10). In the United States, brain tumors are the second mostcommonly diagnosed malignancy in children but account for only9% of the total number of CNS tumor diagnoses in both pediatricand adult patients (3, 38). However, differences in reported inci-dence of pediatric tumors between African and US children havebeen known for many years, and the relative incidence of braintumors has been shown to be lower for African populations (2, 21,31, 42). This is likely an underrepresentation of the true incidence.Most pediatric patients present with macrocephaly or otherphysical changes as the result of increased intracranial pressure,and a large number of patients without hydrocephalus likely gounrecognized and do not present to care centers (36).Pediatric cancer diagnoses in Sub-Saharan Africa are dominated
by Burkitt’s lymphoma, nephroblastoma, retinoblastoma, andother lymphomas, with CNS neoplasms representing a smallerproportion of pediatric cancer diagnosis compared with US andEuropean populations (16, 31). For example, in a recent analysis of436 children diagnosed with cancer from 2006 to 2010 in Kenya,only 4 had a brain tumor diagnosis (24), which is in stark contrast
ROSURGERY, http://dx.doi.org/10.1016/j.wneu.2014.06.040

FORUM
JEFFREY HATEF ET AL. CNS TUMOR DISTRIBUTION IN UGANDA
to the United States, where more than 25% of pediatric cancerdiagnoses are brain tumors (3). The current series also contrastswith the results from Kenya, with six times as many children withbrain cancer diagnosed at Mulago Hospital in this study. Thisfinding is striking, as the Kenyan series enrolled patients over a 10year period, whereas the current review analyzed children fromonly 4 years of enrollment. It is unclear whether the Kenyan serieshas underreported brain tumors or whether the incidence isindeed dramatically greater in Uganda than its neighbor. Mostertet al. (24) suggested that scarcity of access to neuroimaging islikely a key factor. It is additionally unclear why there are suchgreat intercontinental and even intracontinental variations inincidence of pediatric brain tumors. Although differences inincidence have hypothesized to be influenced by viral and bacterialinfections, ionizing radiation, and other environmental factors, itis clear that there are many unanswered questions regarding theepidemiology of pediatric cancer in East Africa (16, 20).A review of diagnoses in US children places low-grade astrocy-
toma and medulloblastoma as the number 1 and 2 diagnoses,respectively (10, 34). Results of series of pediatric brain tumors fromNorthern Africa (Morocco and Egypt) have been consistent withthat of US series, with only minor differences (13, 20, 21, 31). In thecurrent series, 47% (n ¼ 60) did not have a confirmed diagnosis.Although the actual diagnoses in Uganda may not be known withcertainty, the distribution of diagnoses is somewhat unusual. Inthis series, meningiomas are the third most common tumor inchildren, whereas they are rare in pediatric patients in HIC. Inchildren younger than 15, meningiomas at Mulago Hospitalcomprise more than 5% compared with 1.8% in the UnitedStates (10).As in the United States, infratentorial tumors were more com-
mon than supratentorial tumors in our series (33). The overallabundance of posterior fossa tumors is a trend of pediatric braintumors in most populations, but rarity of medulloblastoma as adiagnosis is unusual. The infratentorial predominance contrastswith the recent review by Stagno et al. (36) in which they evaluated172 pediatric patients at CURE hospital, a pediatric specificneurosurgical referral center in Uganda and found supratentorialtumors to comprise 62.2% of brain tumors. The data are likelyskewed, however, because most cases of hydrocephalus or skulldeformity in pediatric patients in Uganda are referred to thishospital that specializes in pediatric neurosurgery, conferring apossible selection bias.In both the adult and pediatric populations, it is difficult to
make generalizations about the relative impact of the typical“common” diagnoses when so many patients were categorized ashaving undefined tumors. However, there are clearly epidemio-logic differences between patients seen at Mulago Hospital andsimilar cohorts in HIC. Given the potential different environ-mental and biological differences between the 2 populations, thisis not unexpected, and it is imperative that epidemiologic datacontinues to be collected and analyzed.
Differential ConsiderationsInfectious processes are always on the differential diagnoses forthe various intracranial and spinal neoplasms discussed here (30).However, in many LMIC, imaging is not routinely available,limiting diagnostic capability. In the current series, 5 patients
WORLD NEUROSURGERY 82 [3/4]: 258-265, SEPTEMBER/OCTOBER 2
thought to have brain tumors were found to have an infectiousprocess on biopsy. In all cases, surgical retrieval of tissueconfirmed a non-neoplastic diagnosis. Given the infrequency withwhich tissue was obtained in this series and the relative prevalenceof infection in developing countries, it is likely that other patientsmay have been harboring acute or chronic infections as well. Inan environment in which tissue diagnosis may not always bepossible, clinical signs and symptoms must often be relied uponmore heavily than is seen in HIC, and empirical treatmentnecessarily must be used more often. As practicing neurosurgeonsin Africa continue to advance the quality of care delivered to theirpatients, potentially treatable diseases such as infection must beaggressively sought after, diagnosed, and treated.Cystic lesions were common in the retrospective review—10
dermoid, 1 epidermoid, and 1 arachnoid cyst were included in thedata collection. Although magnetic resonance imaging is availableat large hospitals in LMIC, images are often of lower quality thanin HIC, and advanced sequences may not be available. This isparticularly important for the diagnosis of benign cysts that maybe cured with resection and possibly cerebrospinal fluid shunting.Similarly, low-grade tumors are far more likely to be cured withsurgical resection than are high-grade tumors. Facilities withlimited resources must make every attempt to identify patientswith non-neoplastic or low-grade lesions and should prioritize thetreatment of those patients, as they are most likely to benefit fromsurgical services.
Surgical TreatmentIn 2007, the Duke University Medical Center and Mulago Hospital inUganda developed a twinning programwith donated surplus surgicaland anesthesia equipment, combined with comprehensive surgicaltraining camps. Two years after the program began, the number ofneurosurgical cases performed increased by 180% (17). In this seriesfrom 2009 to 2012, the number of cases that were admitted or seen inclinic only without surgical intervention decreased from 65% to 43%;however, despite the increased proportion of surgical resection orbiopsy performed, only 35% (n ¼ 39) had available diagnostic pa-thology. Along with improved diagnostic abilities, critical improve-ments are needed in data collection and medical records to improvethe accuracy of future epidemiologic studies.
Establishment of the Prospective DatabaseTo address this problem, future collaborative efforts will include thedevelopment of a prospective database at Mulago Hospital. Anintake questionnaire was designed in collaboration with the Kam-pala Cancer Registry to collect prospective epidemiologic infor-mation for all patients seen at Mulago Hospital with radiologic CNStumor diagnosis. Data collected via questionnaire will include bio-logic data, location of tumor evaluation, presentation and durationof symptoms, treatment history, and limited past medical, family,and social history. Any collected data will be included in the existingKampala Cancer Registry, and patient outcomes will be monitoredevery 3 months per current protocol. Pathology reports will beincluded if available. As more data are collected, hopefully thelandscape of tumors treated by the neurosurgical team at MulagoHospital will be more fully elucidated.
014 www.WORLDNEUROSURGERY.org 263

FORUM
JEFFREY HATEF ET AL. CNS TUMOR DISTRIBUTION IN UGANDA
CONCLUSIONS
The results of this retrospective review are the first published analysiscombining both pediatric and adult CNS tumors in Uganda. Theseinitial data from our prospective analysis offer further evidence thatCNS tumors in Sub-Saharan Africamay differ epidemiologically fromthose seen inHIC. The comparatively younger patient age and uniquediagnosis distribution by sex suggest potential differences in tumorbiology. In tumors with available diagnostic information, meningi-oma is the most common diagnosis in Ugandan adults, and they arealso quite common in children. A diagnosis of GBM is rare comparedwith that in HICs. Of particular interest for Uganda is adequate un-derstanding of pediatric brain tumors, whichmade up an astounding31% of this series. A proper understanding of the biology of the pe-diatric tumors is far from complete, and characterizing the popula-tion will be an important next step.The present series has provided evidence to support the
hypothesis that African brain tumors are indeed very different than
264 www.SCIENCEDIRECT.com WORLD NEU
tumors found in the HIC, and as neurosurgery at Mulago Hospitalcontinues to improve, clearly identifying the epidemiologic, bio-logic, and genetic characteristics of CNS tumors in Ugandanswill be of utmost importance. Going forward, elucidating andcharacterizing these differences will help surgeons, oncologists,pathologists, and radiologists practicing at Mulago Hospital andother hospitals throughout Eastern Africa improve overall out-comes for patients with CNS tumors.
ACKNOWLEDGMENTS
We thank Isaac Wakiro and Amitoz Manhas, MD for their assis-tance in the data collection. We would also like to thank DrsLynette Tumwine, Robert Lukande, and Asafu Munema fromMakerere University Department of Pathology for their assistancein pathology review.
REFERENCES
1. Adamson C, Kanu OO, Mehta AI, Di C, Lin N,Mattox AK, Bigner DD: Glioblastoma multiforme:a review of where we have been and where we aregoing. Expert Opin Invest Drugs 18:1061-1083,2009.
2. Akang EEU: Tumors of Childhood in Ibadan,Nigeria (1973-1990). Fetal Pediatr Pathol 16:791-800, 1996.
3. American Cancer Society: Cancer Facts andFigures 2014. Atlanta: American Cancer Society;2014.
4. Andrews NB, Ramesh R, Odjidja T: A preliminarysurvey of central nervous system tumors in Tema,Ghana. West African J Med 22:167-172, 2003.
5. Babu R, Adamson DC: Rindopepimut: an evi-dence-based review of its therapeutic potential inthe treatment of EGFRvIII-positive glioblastoma.Core Evid 7:93-103, 2012.
6. Bondy M, Lee Ligon B: Epidemiology and etiologyof intracranial meningiomas: a review.J Neurooncol 29:197-205, 1996.
7. Bondy ML, Scheurer ME, Malmer B, Barnholtz-Sloan JS, Davis FG, Il’yasova D, Kruchko C,McCarthy BJ, Rajaraman P, Schwartzbaum JA,Sadetzki S, Schlehofer B, Tihan T, Wiemels JL,Wrensch M, Buffler PA: Brain tumor epidemi-ology: consensus from the Brain Tumor Epide-miology Consortium. Cancer 113:1953-1968, 2008.
8. Central Intelligence Agency. The World Factbook2013�14: Central Intelligence Agency, 2013.Available at: https://www.cia.gov/library/publications/the-world-factbook/index.html. AccessedDecember 2, 2013.
9. Dechambenoit G: Action Africa! World Neurosurg73:251-253, 2010.
10. Dolecek TA, Propp JM, Stroup NE, Kruchko C:CBTRUS statistical report: primary brain andcentral nervous system tumors diagnosed in theUnited States in 2005e2009. Neuro-Oncol 14(suppl 5):v1-v49, 2012.
11. Donnell MS, Meyer GA, Donegan WL: Estrogen-receptor protein in intracranial meningiomas.J Neurosurg 50:499-502, 1979.
12. El Khamlichi A: African neurosurgery part II:current state and future prospects. Surg Neurol49:342-347, 1998.
13. El-Gaidi MA: Descriptive epidemiology of pediat-ric intracranial neoplasms in Egypt. Pediatr Neu-rosurg 47:385-395, 2011.
14. Eyenga VC, Ngah JE, Atangana R, Etom E,Ngowe MN, Bassong Y, Oyono JL, Sosso M:Central nervous system tumours in Cameroon:histopathology and demography [in French].Sante (Montrouge, France) 18:39-42, 2008.
15. Ferlay J, Shin HR, Bray F, Forman D, Mathers C,Parkin DM: Estimates of worldwide burden ofcancer in 2008: GLOBOCAN 2008. Int J Cancer127:2893-2917, 2010.
16. Hadley LG, Rouma BS, Saad-Eldin Y: Challenge ofpediatric oncology in Africa. Semin Pediatr Surg21:136-141, 2012.
17. Haglund MM, Kiryabwire J, Parker S, Zomorodi A,MacLeod D, Schroeder R, Muhumuza M,Merson M: Surgical capacity building in Ugandathrough twinning, technology, and trainingcamps. World J Surg 35:1175-1182, 2011.
18. Ibebuike K, Ouma J, Gopal R: Meningiomasamong intracranial neoplasms in Johannesburg,South Africa: prevalence, clinical observations andreview of the literature. Afr Health Sci 13:118-121,2013.
19. Idowu O, Akang EEU, Malamo A: Symptomaticprimary intracranial neoplasms in Nigeria, WestAfrica. J Neurol Sci [Turk] 24:212-218, 2007.
20. Idowu OE, Idowu MA: Environmental causes ofchildhood brain tumours. Afr Health Sci 8:1-4,2008.
21. Karkouri M, Zafad S, Khattab M, Benjaafar N,El Kacemi H, Sefiani S, Kettani F, Dey S,Soliman AS: Epidemiologic profile of pediatric
ROSURGERY, http://
brain tumors in Morocco. Childs Nerv Syst 26:1021-1027, 2010.
22. Kiryabwire JW: Neurosurgery in Uganda. Neuro-surgery 20:664-665, 1987.
23. Li J, Di C, Mattox AK, Wu L, Adamson DC: Thefuture role of personalized medicine in the treat-ment of glioblastoma multiforme. Pharmacoge-nomics Pers Med 3:111-127, 2010.
24. Mostert S, Njuguna F, Kemps L, Strother M,Aluoch L, Buziba G, Kaspers G: Epidemiology ofdiagnosed childhood cancer in Western Kenya.Arch Dis Child 97:508-512, 2012.
25. Mwang’ombe NJ, Ombachi RB: Brain tumours atthe Kenyatta National Hospital, Nairobi. EastAfrican Med J 77:444-447, 2000.
26. Odebode TO, Akang EE, Shokunbi MT,Malamo AO, Ogunseyinde AO: Factors influ-encing visual and clinical outcome in Nigerianpatients with cranial meningioma. J Clin Neurosci13:649-654, 2006.
27. Odeku EL, Adeloye A: Cranial meningiomas in theNigerian African. Afr J Med Sci 4:275-287, 1973.
28. Olasode BJ, Shokunbi MT, Aghadiuno PU: Intra-cranial neoplasms in Ibadan, Nigeria. East AfrMed J 77:4-8, 2000.
29. Olasode BJ: A pathological review of intracranialtumours seen at the University College Hospital,Ibadan between 1980 and 1990. The Nigerianpostgraduate medical journal 9:23-28, 2002.
30. Omuro AMP, Leite CC, Mokhtari K, Delattre J-Y:Pitfalls in the diagnosis of brain tumours. LancetNeurol 5:937-948, 2006.
31. Parkin DM, Stiller CA, Draper GJ, Bieber CA: Theinternational incidence of childhood cancer. Int JCancer 42:511-520, 1988.
32. Parkin DM, Nambooze S, Wabwire-Mangen F,Wabinga HR: Changing cancer incidence inKampala, Uganda, 1991-2006. Int J Cancer 126:1187-1195, 2010.
dx.doi.org/10.1016/j.wneu.2014.06.040

FORUM
JEFFREY HATEF ET AL. CNS TUMOR DISTRIBUTION IN UGANDA
33. Pollack IF: Brain Tumors in Children. N Engl JMed 331:1500-1507, 1994.
34. Pollack IF: Pediatric brain tumors. Semin SurgOncol 16:73-90, 1999.
35. Sheehy JP, Crockard HA: Multiple meningiomas: along-term review. J Neurosurg 59:1-5, 1983.
36. Stagno V, Mugamba J, Ssenyonga P, Kaaya BN,Warf BC: Presentation, pathology, and treatmentoutcome of brain tumors in 172 consecutivechildren at CURE Children’s Hospital of Uganda.The predominance of the visible diagnosis and theuncertainties of epidemiology in sub-SaharanAfrica. Child Nerv Syst 30:137-146, 2014.
37. Stiller CA, Parkin DM: Geographic and ethnicvariations in the incidence of childhood cancer.Br Med Bull 52:682-703, 1996.
38. Surawicz TS, McCarthy BJ, Kupelian V, Jukich PJ,Bruner JM, Davis FG: Descriptive epidemiology of
WORLD NEUROSURGERY 82 [3/4]: 258-2
primary brain and CNS tumors: results from theCentral Brain Tumor Registry of the United States,1990-1994. Neuro-oncology 1:14-25, 1999.
39. Wabinga HR, Parkin DM, Wabwire-Mangen F,Nambooze S: Trends in cancer incidence inKyadondo County, Uganda, 1960-1997. Br J Cancer82:1585-1592, 2000.
40. Wabinga HR, Parkin DM, Nambooze S: Kampalacancer registry report for the period 2007-2009;Available at: http://afcrn.org/attachments/article/115/Kampala%20CR%202007-9%20Report_.pdf;2012; Accessed June 30, 2014 2012.
41. Wiemels J, Wrensch M, Claus E: Epidemiologyand etiology of meningioma. J Neurooncol 99:307-314, 2010.
42. Williams AO: Tumors of childhood in Ibadan,Nigeria. Cancer 36:370-378, 1975.
65, SEPTEMBER/OCTOBER 2014 ww
43. World Health Organization: Cancer FactSheet: World Health Organization; Available at:http://www.who.int/mediacentre/factsheets/fs297/en/;2014; Accessed March, 4 2014 2014.
Conflict of interest statement: This work was supported by aDuke Global Health Travel Grant.
Jeffrey Hatef and Cory Adamsonare coefirst authors.
Received 9 June 2014; accepted 14 June 2014
Citation: World Neurosurg. (2014) 82, 3/4:258-265.http://dx.doi.org/10.1016/j.wneu.2014.06.040
Journal homepage: www.WORLDNEUROSURGERY.org
Available online: www.sciencedirect.com
1878-8750/$ - see front matter ª 2014 Elsevier Inc.All rights reserved.
w.WORLDNEUROSURGERY.org 265