central laboratory for radiological protection konwaliowa...
TRANSCRIPT
1
Activity report 2008-2009
CENTRAL LABORATORY FOR RADIOLOGICAL PROTECTION
KONWALIOWA ST. 7, PL 03-194 WARSAW, POLAND
tel.: (+48 22) 8110011 fax.: (+48 22) 8111616
Web site: www.clor.waw.pl
2
CONTENTS
ARTICLES 1. DOSE ASSESSEMENTS RADIOLOGICAL MODELS VALIDATION STUDY TEST SCENARIO 7
2. THE MICRONUCLEUS ASSAY IN HUMAN PERIPHERAL BLOOD LYMPHOCYTES FOR DETERMINATION INDIVIDUAL SENSITIVITY TO IONISING RADIATION WITH APPLICATIBILITY IN BIOLOGICAL MONITORING 18 3. CYTOGENETIC INVESTIGATION OF ACCIDENTAL OVEREXPOSURES TO AN INDUSTRIAL
4. GAMMA RADIOGRAPHY SOURCE IN GDANSK 23
5. THE RADON CONCENTRATION INVESTIGATIONS IN DWELLINGS OF RZESZÓW AREA WITH THE AIM OF COMPLETING MISSING DATA IN RADON ATLAS OF POLAND 25 6. MONITORING OF 137Cs CONCENTRATION IN SOIL, 2008-2009 32
7. ANNUAL EFFECTIVE DOSE (2008) 34
8. THE COMPLEXITY MEASUERMENTS USED FOR ESTIMATION OF RADIOLOGICAL SITUATION IN SURROUNDINGS OF WASTES REPOSITORY (KSOP) IN RÓŻAN 35 9. THE COMPLEXITY MEASUERMENTS USED FOR ESTOMATION OF RADIOLOGICAL SITUATION IN SURROUNDING OF ŚWIERK CENTRE 39 10. RADIATION SAFETY & SECURITY AND RADIATION PROTECTION. NEW CONCEPTS 42
SCIENTIFIC AND TECHNICAL REPORTS 2008
RADIATION HYGIENE DEPARTMENT 1. ACCREDITATION FOR A RADIOCHEMICAL AND SPECTROMETRIC ANALYSES LABORATORY 48 2. MONITORING OF RADIOACTIVE CONTAMINATION OF SURFACE WATERS AND BOTTOM SEDIMENTS IN 2006 -2008 50 3. COMPARATIVE MEASUREMENTS REGARDING CS-137 AND SR-90 ISOTOPES
DETERMINATION BY BASIC UNITS PERFORMING RADIOACTIVE CONTAMINATION MEASUREMENTS WITHIN THE FRAMEWORK OF RADIATION MONITORINGOF THE COUNTRY 52

3
4. DETERMINATION OF RADIOACTIVITY OF DRINKING WATER IN LARGE URBAN AGGLOMERATIONS AND DOSE ASSESSMENT FROM ITS CONSUMPTION 54 5. EVALUATION OF DOSES FOR STANDARD ORGANISMS CHARACTERISTIC FOR LAND AND AQUATIC ENVIRONMENT IN POLAND 55 6. DETERMINATION OF URANIUM AND PLUTONIUM REFERENCE LEVELS IN MEN’S URINUM TO ESTIMATE INTERNAL CONTAMINATION OF PERSONS HAVING CONTACT WITH FISSLE MATERIALS 57 7. DOSE ASSESSMENT DUE TO INTAKE OF CS-137 IN MILK IN DIFFERENT GROUP OF AGE 59 8. DOSE ASSESSMENT FOR CHILDREN IN VARIOUS AGES DUE TO INTAKE OF CS-137 AND SR-90 IN MEALS 60 9. MONITORING OF RADIOACTIVE CONTAMINATION OF THE BALTIC SEA IN 2008 62
10. STUDIES ON THE VERTICAL DISTRIBUTION OF RADIOACTIVE ISOTOPES IN BALTIC SEA BOTTOM SEDIMENTS AND ESTIMATION OF CONTAMINATION SOURCES. ESTIMATION OF SEDIMENTATION RATES IN THE SOUTHERN BALTIC SEA REGION 64
DOSIMETRY DEPARTMENT 1. ACCREDITATION OF THE RESEARCH LABORATORY – NATURAL RADIOACTIVITY LABORATORY OF THE DOSIMETRY DEPARTMENT OF CLOR IN THE SCOPE OF THE INVESTIGATION OF THE NATRURAL RADIOACTIVITY IN RAW AND BUILDING MATERIALS 66 2. ANALYSIS AND EVALUATION OF THE ACTIVITY OF RAW AND BUILDING MATERIALS USED IN POLAND IN YEARS 1980-2007 68
TRAINING AND INFORMATION DEPARTMENT 1. TRAINING, INFORMATION AND STANDARDIZATION 73
DEPARTMENT OF PERSONNEL MONITORING AND CALIBRATION 1. PRODUCING DOSE-RESPONSE CALIBRATION RELATIONSHIP FOR BIOLOGICAL DOSIMETRY IN CASES OF ACCIDENTAL HIGH-DOSE EXPOSURES TO GAMMA – RAYS 76 2. ASSURANCE AND SUPPORT OF THE QUALITY SYSTEM IN RADON DOSIMETRY LABORATORY AT SCOPE OF RADON AND RADON PROGENY DETECTORS AND DEVICES CALIBRATION 79 3. THE ASSURANCE AND MAINTENANCE OF THE QUALITY SYSTEM IN LABORATORY OF PERSONAL AND ENVIRONMENTAL DOSES FOR RADIOLOGICAL PROTECTION 81 4. THE ASSURANCE AND MAINTENANCE OF THE QUALITY SYSTEM AT THE CALIBRATION LABORATORY - SECONDARY STANDARD DOSIMETRY LABORATORY (DLWW) FOR THE PURPOSES OF RADIOLOGICAL PROTECTION 83
4
SCIENTIFIC AND TECHNICAL REPORTS 2009
RADIATION HYGIENE DEPARTMENT 1. ACCREDITATION FOR A RADIOCHEMICAL AND SPECTROMETRIC ANALYSES LABORATORY 86 2. DOSE ASSESSMENT DUE TO INTAKE OF CS-137 IN MILK IN DIFFERENT GROUP OF AGE 89 3. DOSE ASSESSMENT FOR CHILDREN IN VARIOUS AGES DUE TO INTAKE OF CS-137 AND SR-90 IN MEALS 90 4. CONCENTRATION OF CS-137 AND SR-90IN FOOD PRODUCTS AND MEALS IN 2009 92 5. DETERMINATION OF RADIOLOGICAL PARAMETERS OF DRINKING WATER IN LARGE CITIES, AND EVALUATION OF DOSES RECEIVED BY ITS CONSUMPTION 94 6. DETERMINATION OF URANIUM AND PLUTONIUM REFERENCE LEVELS IN MEN’S URINUM TO ESTIMATE INTERNAL CONTAMINATION OF PERSONS HAVING CONTACT WITH FISSLE MATERIALS 95 7. EVALUATION OF ABSORBED DOSES FOR STANDARD ORGANISMS
CHARACTERISTC FOR LAND AND AQUATIC ENVIRONMENT IN POLAND 97 8. COMPERATIVE MEASUREMENTS REGARDING CS-137 ISOTOPE DETERMINATION
BY BASIC UNITS PERFORMING RADIOACTIVE CONTAMINATION MEASUREMENTS
WITHIN THE FRAMEWORK OF RADIATION MONITORING OF THE COUNTRY 100
DOSIMETRY DEPARTMENT 1. THE QUALITY ASSURANCE SYSTEM IN THE ACCREDITED NATURAL RADIOACTIVITY LABORATORY REGARDING THE RESEARCH OF THE RADIUM RA-226, THORIUM TH-228 AND POTASSIUM K-40 REFERENCE SOURCE 103 2. THE ORGANIZATION AND PROCEEDING OF THE INTERCOMPARISON MEASUREMENTS OF THE NATURAL RADIONUCLIDES CONTENT IN RAW AND BUILDING MATERIALS 105 3. ANALYSIS AND EVALUATION OF THE RADIOACTIVITY OF RAW AND BUILDING MATERIALS USED IN POLAND IN YEARS 1980-2009 112 4. MONITORING OF 137Cs CONCENTRATION IN SOIL, 2008-2009 116
5. OPERATION OF HIGH SENSITIVITY ASS-500 STATIONS NETWORK 118
TRAINING AND INFORMATION DEPARTMENT 1. TRAINING, INFORMATION AND STANDARDIZATION 122
2. ANNUAL EFFECTIVE DOSE (2009) 124
DEPARTMENT OF PERSONNEL MONITORING AND CALIBRATION 1. DRAWING UP METHODOLOGY ESSENTIAL TO START THE BETA SECONDARY
STANDARD TYPE 2 (BSS 2) 127 2. PERSONNEL MONITORING CARRIED OUT BY CLOR IN YEARS 2008 AND 2009 129
3. CALIBRATION OF DOSIMETRIC INSTRUMENTS USED FOR RADIOLOGICAL PROTECTION IN 2009 131

5
4. MAINTENANCE OF THE QUALITY MANAGEMENT SYSTEM AT THE RADON DOSIMETRY LABORATORY 132 5. THE ASSURANCE AND MAINTENANCE OF THE QUALITY SYSTEM AT THE CALIBRATION LABORATORY - SECONDARY STANDARD DOSIMETRY LABORATORY (DLWW) FOR THE PURPOSES OF RADIOLOGICAL PROTECTION 139 6. THE ASSURANCE AND MAINTENANCE OF THE QUALITY SYSTEM IN
LABORATORY OF PERSONNEL MONITORING FOR RADIOLOGICAL PROTECTION 141

6
ARTICLES

7
DOSE ASSESSEMENTS RADIOLOGICAL MODELS VALIDATION STUDY TEST SCENARIOS
Grażyna Krajewska NAEA AGREEMENT N# 7/SP/2007
ABSTRACT
In 2002, the computer modules RODOS FCDM i ARGOS FCDM (Food-Chain and Dose Module) were implemented in the Radiation Emergency Centre (CEZAR) NAEA, served as decision support tools. It prompted to perform documented tests and evaluate these modules predictive performance for conditions of specific Poland ecosystem.
Since 2006, eight data test scenarios were elaborated assuming different period of releases (acute or long term) particular radionuclides of 131I, 134Cs, 137Cs. These scenarios considered various radiological conditions, with respect of parameters typical for Poland environment, including agricultural structure, climatic conditions, soil proprieties, diet of different social and age groups etc.
INTRODUCTION
An accident of IV Block of NPP in Chernobyl, which occurred on 26 April 1986, has
revealed urgent need of developing computer models that make possible rapid
assessments of radiation doses to population. These computer codes could be designed
as decision support tools in a case of radioactive release to environment. Such
recommendations have been issued in International Atomic Energy Agency IAEA report
[1] and also in the report of the Governmental Commission for Assessment of Nuclear
Radiation and Prophylactic Measures [2]. One could understand the environmental
computer model (code) as mathematical procedures used to predict expected effects in
environment as a result of man activity, especially, procedures applied to predict
enhancement of radiation levels in particular environment’s components, due to
accidental or routine releases of radioactive substances. Although, diversity of
phenomena in ecosystem and involvedness of processes and its features could result in
significant complication of mathematical models and yield long time calculations; on the
other hand, simplification of mathematical description as well as applying
phenomenological parameters leads to increasing uncertainty of predicted values.
Usually, computer models are compromise between a requirement of real description of

8
features and processes and the requirement of rapid assessments of population hazard
from radiation. Moreover, using contemporary computer techniques one can decrease
the time of data processing and thus use more complex models to reach better
precisions of predictions [3, 4].
Since last decade, several international programs coordinated by the IAEA have focused
on improvement accuracy and validation of computers models predictions i.e.: VAMP
(VALIDATION OF ENVIRONMENTAL MODELS PREDICTIONS) I BIOMOVS (BIOSPHERIC
MODEL VALIDATION STUDY), EMRAS (ENVIRONMENTAL MODELS RADIATION STUDY)
[5-9]. Since 2002 NAEA’s Radiation Emergency Centre (CEZAR) has implemented
modules of RODOS FCDM i ARGOS FCDM (Food-Chain and Dose Module), as decisions
support tools in a case of radiation accidents when countermeasures action would be
considered. Intense efforts have been performed to adopt data base parameters of
above modules to the environmental conditions in Poland i.e.: (climate conditions, agro-
technical conditions: cultivation and farming structure, types of soils, land coverage etc.
Since 2006, the project on FCDM modules validation has started, aimed to investigate
modules responds to different scenarios of radioactive releases to environment and
evaluate the modules performance for polish conditions.
1. INITIAL CONTAMINATION CONSIDERED IN THE TESTS SCENARIOS
In 2007 two scenarios have been prepared, each scenario for different radionuclide:
1.1 SCENARIO FOR RADIOACTIVE IODINE 131I:
1.1.1 The standardized radioiodine concentration in air (100 Bqm-3), which lasts for 8 days and that occurs in different seasons i.e. from 27-04-2007 to 7-05-2007 and from 30-09-2007 to 10-10-2007.
1.1.2 The scenario encompasses different variants of countermeasures, introduced in order to minimize committed dose to thyroid, these countermeasures include: administration of stable iodine tablets and/or ban of dairy cows pasturage on a fresh grass.
1.1.3 Meteorological conditions and partition of different radioiodine fraction were selected to express most probable variant of air contamination (release distance of about 800 km) and ensure somewhat conservative approach i.e.: 50% aerosol borne radioiodine, 50% of elemental I2 radioiodine, log-normal aerosol distribution AMAD = 0.6 and SD (AMAD) 4 um, intensive rains lasted from 29 April 2007 up to 7 May 2007 (see Table 1). It corresponds to dry deposition
velocity of 0.3 cms-1 (for aerosol born radioiodine) and 1.3 cms-1 for elemental
radioiodine as well as 2104 md-1 aerosols washout ratio and 1.7105 md-1 elemental radioiodine washout ratio.

9
1.2 SCENARIO FOR RADIOACTIVE CAESIUM 137CS:
1.2.1 Test scenario for radioactive cesium 137Cs, with standardized radiocesium
concentration in air (1 Bqm-3), that occurred from 28-04-2007 to 5 -05-2007 over areas of different soil proprieties.
1.2.2 Meteorological conditions and aerosol bound radioceasium fraction were selected to express most probable variant of air contamination (release distance of about 800 km) and ensure somewhat conservative approach i.e.: 100% aerosol bound radiocaesium, log-normal aerosol distribution AMAD = 0.6 and SD(AMAD) 4 um, intensive rains lasted from 30-04-2007 up to 7 May 2007 (see Table 2). It
corresponds to dry deposition velocity of 0.3 cms-1 and 2104 md-1 aerosols washout ratio.
1.2.3 Long-term researches of radioactive cesium migration from soil to plant (usually described quantitatively by transfer factor (the ratio of isotope concentration in dry mass of plant to isotope concentration in dry mass of soil) have shown around 1000 folds variation of this factor depending on soil type and plant species [10-11]. Generally it is known that following factors have influence on quantity of radiocaesium uptake by root system to plant:
a. Potassium content in soil, particularly content of exchangeable ions K+ decreases uptake of radiocaesium by plant root system,
b. Presence of greater amount of organic matter increases radiocaesium uptake,
c. Presence of lilt minerals (so called clay i.e. particles of diameter less than 0.002 mm) decreases radiocaesium uptake.
1.2.4 In the radioecological sub-module of RODOS FCDM NEMED ECOSYS, different radiocesium transfer factors TF have been included depending on soil types classified base on granular classification1 and the kind of agricultural plants i.e.: (grass, grains, root vegetables, potatoes, leafy vegetables etc.) The exemplary values of transfer factors from soil to grass, used in calculations, are show in Table 3. Concerning all values of transfer factors TF that were applied in calculations, the values of TF for selected plants were used. The plant selection has been done base on items listed as monitoring objects in the DECREE OF CABINET COUNCIL'S of 17 December 2002 r. on posts for early detection and monitoring of radioactive contaminations (Polish Journal of Laws, No.239 item 2030, 2002 (in polish).
1 according to the SOIL GEOGRAPHICAL DATABASE OF EUROPE (SGDBE) - 1993

10
2. RESULTS OF CALCULATIONS – TEST OUTPUT DATA
DEPOSITION
2.1 The first test data set encompasses dry, wet and total radioactive deposition due to lasting air contamination. For air contamination by radioiodine and meteorological conditions described in the first chapter, the 131I dry deposition of
568 kBqm-2 , 131I wet deposition of 840 kBqm-2 and total deposition of 131I equal
to 1402 kBqm-2 have been obtained.
2.1.1 For deposition of 137Cs the values of 1.8 kBqm-2, 2.4 kBqm-2 and 4.2 kBqm-2; for dry , wet and total deposition have been obtained, respectively.
2.2 GRASS CONTAMINATION
2.2.1 The second test data set includes: predicted 131I concentrations in grass in the period of 29 April – 16 June 2007 and 30 September – 30 October 2007 as well as 137Cs concentrations in grass in the period of 28 April – 30 November 2011, The
biomass of grass in the 1 May 2007 equal to2 0.45±0.15 kgfresh. massm-2 has been assumed. The washout of 131I from grass by rain has been taken in to account, but migration of radioiodine from soil to grass was neglected because of short half-life of this radionuclide. In calculations of 137Cs concentrations in grass, both washout and soil to grass transfer factors have been taken in to account with respect of different soil types.
2.3 MILK CONTAMINATION
2.3.1 The third test data set consists of 131I concentrations in milk for the period of 29 April – 16 June 2007 calculated for several variants of start grazing times of dairy cows i.e. (grazing start from 1, 5, 10, 15, 25, 30 May respectively). The time when cows start grazing on a pasture is critical parameter having significant influence on the level of radionuclide in milk and consequently internal exposure of peoples drinking milk. Standard parameters used by RODOS FCDM has been assumed as follow: cows diet - 45 kg grass (fresh mass) per day and iodine
transfer factor grass-milk equal to 3×10⁻³ dkg-1. Figure 1 exemplifies results.
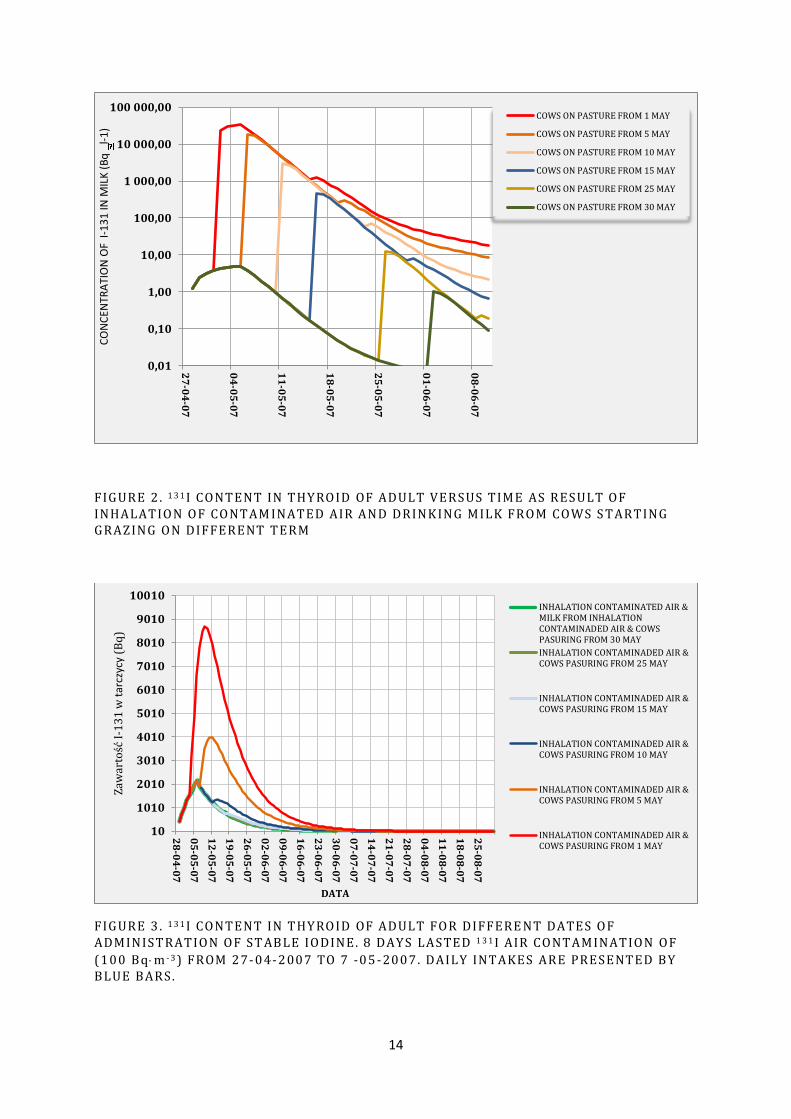
2.4 PREDICTED CONTENTS OF 131I IN THYROID
2.4.1 Inhalation of contaminated air and milk consumption result in radioiodine levels in thyroid. Predicted contents of 131I in thyroid for adult in the period of 30 April-30 June 2007 for six variants of time grazing are shown in Figure 2. In calculations, standard parameters describing iodine metabolic in human body have been used [12] and also, 16 hours/per 24 hours staying indoor for single family house (filtration factor3 0.4).
2.4.2 The forth test data set refers to the effectiveness of stable iodine blocking dose (60 mg for adult) administrated in various times relatively to the initial occurrence of air contamination (29.04), thus in 30.04.2007, 1.05.2007, 5.05.2007, 10.05.2007. (See Figure 5).
2 Standard grass development acc. FCDM RODOS 3 Filtration factor - ratio of average radionuclide concentration in indoor air to an average radionuclide
concentration in outdoor air

11
2.5 COMMITTED DOSES TO THYROID FROM 131I
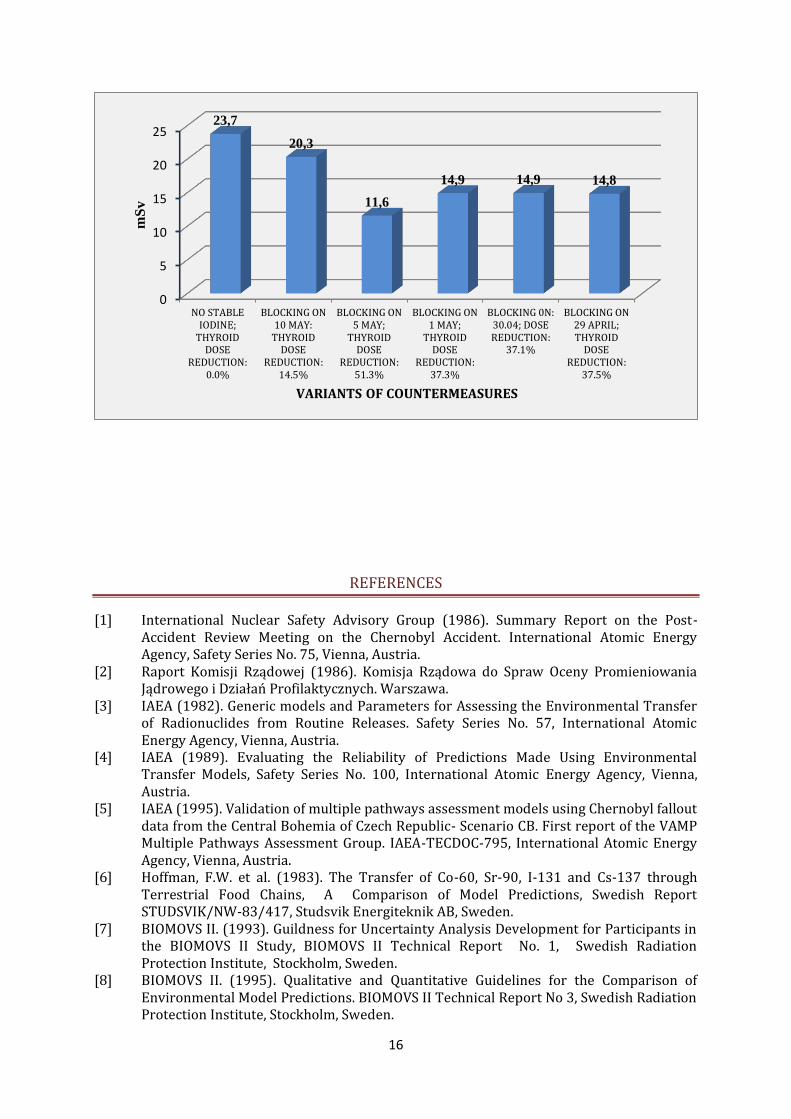
2.5.1 The fifth test data set consists of committed doses to thyroid as a result of countermeasures described in the previous sections i.e. delay in cows pasturing on a fresh grass and stable iodine blocking doses administered in various day. The doses values and dose reduction factors have been given in order to facilitate validation procedures for modules FCDM RODOS and FCDM ARGOS.
2.5.2 One can conclude that for air contamination by 131I : 2.5.2.1 Two weeks delay in cows pasturing since 131I air contamination
occurred i.e. 29.04 2007 results in 80% dose reduction, remaining dose of 4 mSv comes from inhalation (for assumed air contamination of 100
Bq m-3 ; see section 1), 2.5.2.2 The highest dose to thyroid reduction of 50% one can achieve when
administration of stable iodine is applied in 5-May, i.e. in the time of maximum intakes of radioiodine originated both from inhalation and consumption contaminated milk.
2.6 COMMITTED EFFECTIVE DOSES FROM 137CS
2.6.1 The sixth test set gives average committed effective doses due to consumption of contaminated products for adults living in areas of different soil types (see Table 4). For validation purposes the doses have been determined in the 3x3 km squares raster net. Calculations have been performed using SAVEC software [13].
3. CONCLUSIONS
1. In 2007 2 scenarios for radioisotopes 131I and 137Cs was prepared, These scenarios enable to perform documented tests of modules RODOS FCDM i ARGOS FCDM (food-chain and dose module).
2. Scenarios of 131I describe various radiological situations at 8-day lasted air contamination when specific countermeasures were introduced: iodine tablets and dairy cows pasturing ban. 131I concentrations in essential agricultural components as grass and milk, 131I contents in thyroid and committed doses to thyroid are given as test data.
3. Scenarios of 137Cs refer to the radiological situations at 8-days lasted air contamination over areas of different soil types that result in different radiocaesium levels in food products. Both 137Cs concentrations in agricultural components as cereals, leafy and root vegetables, grass, milk, meat and committed effective doses are given as test data.
4. Research on documented tests of RODOS FCDM i ARGOS FCDM module are continued in 2008. Additionally, based on predictions, Derived Radionuclides Levels (DRL) in selected environmental components will be evaluated. The DLR values make possible to quick assessments of radiological impact in emergency situation throughout comparison evaluated values with intervention levels recommended in Decree of Council of Ministers on 27 April 2004.

12
TABLE 1 . INITIAL CONDITIONS OF AIR CONTAMINATION BY 1 3 1 I AND METEOROLOGICAL CONDI TIOS
TestN#
DATE
13
1I C
ON
CE
NT
RA
TIO
NN
in
AIR
AE
RO
SOL
F
RA
CT
ION
EL
AM
NT
AL
FR
AC
TIO
N
I2
DAE
SD (DAE)
WIND VELOCITY
RAIN INTENSITY
PR
EC
IPIT
AT
ION
HE
IGH
OF
MIX
ING
LA
YE
R
[Bq·m-3] [%] [%] [µm] [µm] [ms-1] [mm h-1] [mm d-1] [km]
1
27-04-2007 0.0 50% 50% 0.6 4.0 5.0 0.0 0.0 1
28-04-2007 100.0 50% 50% 0.6 4.0 5.0 0.0 0.0 1
29-04-2007 100.0 50% 50% 0.6 4.0 5.0 0.0 0.0 1
30-04-2007 100.0 50% 50% 0.6 4.0 5.0 1.5 15.0 1
01-05-2007 100.0 50% 50% 0.6 4.0 5.0 1.5 15.0 1
02-05-2007 100.0 50% 50% 0.6 4.0 5.0 1.5 15.0 1
03-05-2007 100.0 50% 50% 0.6 4.0 5.0 1.5 15.0 1
04-05-2007 100.0 50% 50% 0.6 4.0 5.0 1.5 15.0 1
05-05-2007 100.0 50% 50% 0.6 4.0 5.0 1.5 15.0 1
06-05-2007 0.0 50% 50% 0.6 4.0 5.0 1.5 15.0 1
07-05-2007 0.0 50% 50% 0.6 4.0 5.0 1.5 15.0 1
2
30-09-2007 0.0 50% 50% 0.6 4.0 5.0 0.0 0.0 1
01-10-2007 100.0 50% 50% 0.6 4.0 5.0 0.0 0.0 1
02-10-2007 100.0 50% 50% 0.6 4.0 5.0 0.0 0.0 1
03-10-2007 100.0 50% 50% 0.6 4.0 5.0 1.5 15.0 1
04-10-2007 100.0 50% 50% 0.6 4.0 5.0 1.5 15.0 1
05-10-2007 100.0 50% 50% 0.6 4.0 5.0 1.5 15.0 1
06-10-2007 100.0 50% 50% 0.6 4.0 5.0 1.5 15.0 1
07-10-2007 100.0 50% 50% 0.6 4.0 5.0 1.5 15.0 1
08-10-2007 100.0 50% 50% 0.6 4.0 5.0 1.5 15.0 1
09-10-2007 0.0 50% 50% 0.6 4.0 5.0 1.5 15.0 1
10-10-2007 0.0 50% 50% 0.6 4.0 5.0 1.5 15.0 1
TABLE 2 . INITIAL CONDITIONS OF AIR CONTAMINATION BY RADIOACTIVE CESIU M 1 3 7 CS AND METEOROLOGICA L CONDITIOS
TestN#
DATE
13
1I C
ON
CE
NT
RA
TIO
NN
in
AIR
AE
RO
SOL
F
RA
CT
ION
DAE
SD (DAE)
WIND VELOCITY
RAIN INTENSITY
PR
EC
IPIT
AT
ION
HE
IGH
OF
MIX
ING
LA
YE
R
[Bq·m-3] [%] [µm] [µm] [ms-1] [mm h-1] [mm d-1] [km]
1
27-04-2007 0.0 100% 0.6 4.0 5.0 0.0 0.0 1
28-04-2007 1.0 100% 0.6 4.0 5.0 0.0 0.0 1
29-04-2007 1.0 100% 0.6 4.0 5.0 0.0 0.0 1
30-04-2007 1.0 100% 0.6 4.0 5.0 1.5 15.0 1
01-05-2007 1.0 100% 0.6 4.0 5.0 1.5 15.0 1
02-05-2007 1.0 100% 0.6 4.0 5.0 1.5 15.0 1
03-05-2007 1.0 100% 0.6 4.0 5.0 1.5 15.0 1
04-05-2007 1.0 100% 0.6 4.0 5.0 1.5 15.0 1
05-05-2007 1.0 100% 0.6 4.0 5.0 1.5 15.0 1
06-05-2007 0.0 100% 0.6 4.0 5.0 1.5 15.0 1
07-05-2007 0.0 100% 0.6 4.0 5.0 1.5 15.0 1

13
TABLE 3 . RADIOCESIUM TRANSFER FACTORS FROM SOIL TO GRASS FOR DIFFERE NT TYPES OF SOILS (USED IN RODOS SYSTEM).
TABLE 4 . 1 3 7 CS EFFECTIVE COMMITED DOSES FROM ANNUAL INTAKES AS RESULTS OF CONSUMPTION OF CONTAMIANTED FOOD PRODUCTS BY ADULTS LIVING IN AREAS OF PARTICULAR SOIL TYPES
137CS EFFECTIVE
COMMITED DOSES FROM
ANNUAL INTAKES [µSv]
STANDARD MAN Soil type
COARSE (SAND) soil-grass
transfer factor
TF= 0.15
Soil type
MEDIUM FINE (LOAM) soil-grass
transfer factor
TF= 0.08
Soil type
ORGANIC ( PIT) soil-grass
transfer factor
TF= 2.2
2007 13.3 6.7 400
2008 11.5 5.8 345
2009 0.27 0.13 8.0
2010 0.23 0.12 7.0
2011 0.20 0.10 6.0
FIGURE 1 . CONCENTRATION OF 1 3 1 I IN MILK, COWS START GRAZING FROM 1 , 5 , 10 , 15 , 25 , 30 MAY
Granular class of soil acc. FAO 1998
TF [Bq kg-1 grass]/[Bq kg-1 soil]
MEAN MIN MAX
Pit (organic) 2.2 0.5 5.2
Coarse (sand) 0.15 0.02 0.5
Medium (sandy-clay) 0.12 0.004 0.5
Medium fine (loam) 0.08 0.03 0.12
Fine (clay) 0.09 0.004 0.4
TOTAL 0.2 0.004 5.2
14
FIGURE 2 . 1 3 1 I CONTENT IN THYROID OF ADULT VERSUS TIME AS RESULT OF INHALATION OF CONTAM INATED AIR AND DRINK ING MILK FROM COWS S TARTING GRAZING ON DIFFERENT TERM
FIGURE 3 . 1 3 1 I CONTENT IN THYROID OF ADULT FOR DIFFERE NT DATES OF ADMINISTRATION OF ST ABLE IODINE. 8 DAYS LASTED 1 3 1 I AIR CONTAMINATION OF
(100 Bq m - 3 ) FROM 27-04-2007 TO 7 -05-2007. DAILY INTAKES ARE PRESENTED BY BLUE BARS.
0,01
0,10
1,00
10,00
100,00
1 000,00
10 000,00
100 000,00
27
-04
-07
04
-05
-07
11
-05
-07
18
-05
-07
25
-05
-07
01
-06
-07
08
-06
-07
CO
NC
ENTR
ATI
ON
OF
I-1
31
IN M
ILK
(B
q
l-1
) COWS ON PASTURE FROM 1 MAY
COWS ON PASTURE FROM 5 MAY
COWS ON PASTURE FROM 10 MAY
COWS ON PASTURE FROM 15 MAY
COWS ON PASTURE FROM 25 MAY
COWS ON PASTURE FROM 30 MAY
10
1010
2010
3010
4010
5010
6010
7010
8010
9010
10010
28
-04
-07
05
-05
-07
12
-05
-07
19
-05
-07
26
-05
-07
02
-06
-07
09
-06
-07
16
-06
-07
23
-06
-07
30
-06
-07
07
-07
-07
14
-07
-07
21
-07
-07
28
-07
-07
04
-08
-07
11
-08
-07
18
-08
-07
25
-08
-07
Zaw
arto
ść I
-13
1 w
tar
czyc
y (B
q)
DATA
INHALATION CONTAMINATED AIR &MILK FROM INHALATIONCONTAMINADED AIR & COWSPASURING FROM 30 MAY
INHALATION CONTAMINADED AIR &COWS PASURING FROM 25 MAY
INHALATION CONTAMINADED AIR &COWS PASURING FROM 15 MAY
INHALATION CONTAMINADED AIR &COWS PASURING FROM 10 MAY
INHALATION CONTAMINADED AIR &COWS PASURING FROM 5 MAY
INHALATION CONTAMINADED AIR &COWS PASURING FROM 1 MAY

15
Figure 4. DOSE TO THYROID REDUCTION DEPENDING ON THE START OF DAIRY COW PASTURING
FIGURE 5: 1 3 1 I THYROID DOSE REDUC TION (DOSE BLOCADE ON DAY/DOSE WITHOUT BLOCKADE) DEPENDING ON DATE OF ADMINISTRATION OF ST ABLE IODINE
0
1000
2000
3000
4000
5000
6000
7000
8000
9000
10000
28-0
4-0
7
30-0
4-0
7
02-0
5-0
7
04-0
5-0
7
06-0
5-0
7
08-0
5-0
7
10-0
5-0
7
12-0
5-0
7
14-0
5-0
7
16-0
5-0
7
18-0
5-0
7
20-0
5-0
7
22-0
5-0
7
24-0
5-0
7
26-0
5-0
7
28-0
5-0
7
30-0
5-0
7
01-0
6-0
7
03-0
6-0
7
05-0
6-0
7
07-0
6-0
7
09-0
6-0
7
11-0
6-0
7
13-0
6-0
7
15-0
6-0
7DAILY INTAKE OF I-131 [Bq/d]: INHALATION ANDINGESTION - MILK FRO COW PASTURINF FROM 1MAYINHALATION+MILK FROM COW PASTURIND FROM 1MAY [NO STABLE IODINE]
INHALATION+MILK FROM COW PASTURIND FROM 1MAY [STABLE IODINE ON 10 MAY]
INHALATION+MILK FROM COW PASTURIND FROM 1MAY [STABLE IODINE ON 5 MAY]
INHALATION+MILK FROM COW PASTURIND FROM 1MAY [STABLE IODINE ON 1 MAY]
0
5
10
15
20
25
INHALATION OFCONTAMINATEDAIR&INGESTIONOF MILK FROMCOW ON THE
PASTURE FROM30 MAY (80%)
INHALATION OFCONTAMINATEDAIR&INGESTIONOF MILK FROMCOW ON THE
PASTURE FROM25 MAY(80%)
INHALATION OFCONTAMINATEDAIR&INGESTIONOF MILK FROMCOW ON THE
PASTURE FROM15 MAY (79%)
INHALATION OFCONTAMINATEDAIR&INGESTIONOF MILK FROMCOW ON THE
PASTURE FROM10 MAY (75%)
INHALATION OFCONTAMINATEDAIR&INGESTIONOF MILK FROMCOW ON THE
PASTURE FROM5 MAY (51%)
INHALATION OFCONTAMINATEDAIR&INGESTIONOF MILK FROMCOW ON THE
PASTURE FROM1 MAY (0%)
4,7 4,7 4,9 5,9
11,6
23,7
DO
SE
TO
TH
YR
OID
(m
Sv
)
VARIANT OF COUNTERMEASURES
16
REFERENCES
[1] International Nuclear Safety Advisory Group (1986). Summary Report on the Post-Accident Review Meeting on the Chernobyl Accident. International Atomic Energy Agency, Safety Series No. 75, Vienna, Austria.
[2] Raport Komisji Rządowej (1986). Komisja Rządowa do Spraw Oceny Promieniowania Jądrowego i Działań Profilaktycznych. Warszawa.
[3] IAEA (1982). Generic models and Parameters for Assessing the Environmental Transfer of Radionuclides from Routine Releases. Safety Series No. 57, International Atomic Energy Agency, Vienna, Austria.
[4] IAEA (1989). Evaluating the Reliability of Predictions Made Using Environmental Transfer Models, Safety Series No. 100, International Atomic Energy Agency, Vienna, Austria.
[5] IAEA (1995). Validation of multiple pathways assessment models using Chernobyl fallout data from the Central Bohemia of Czech Republic- Scenario CB. First report of the VAMP Multiple Pathways Assessment Group. IAEA-TECDOC-795, International Atomic Energy Agency, Vienna, Austria.
[6] Hoffman, F.W. et al. (1983). The Transfer of Co-60, Sr-90, I-131 and Cs-137 through Terrestrial Food Chains, A Comparison of Model Predictions, Swedish Report STUDSVIK/NW-83/417, Studsvik Energiteknik AB, Sweden.
[7] BIOMOVS II. (1993). Guildness for Uncertainty Analysis Development for Participants in the BIOMOVS II Study, BIOMOVS II Technical Report No. 1, Swedish Radiation Protection Institute, Stockholm, Sweden.
[8] BIOMOVS II. (1995). Qualitative and Quantitative Guidelines for the Comparison of Environmental Model Predictions. BIOMOVS II Technical Report No 3, Swedish Radiation Protection Institute, Stockholm, Sweden.
0
5
10
15
20
25
NO STABLEIODINE;
THYROIDDOSE
REDUCTION:0.0%
BLOCKING ON10 MAY:
THYROIDDOSE
REDUCTION:14.5%
BLOCKING ON5 MAY;
THYROIDDOSE
REDUCTION:51.3%
BLOCKING ON1 MAY;
THYROIDDOSE
REDUCTION:37.3%
BLOCKING 0N:30.04; DOSEREDUCTION:
37.1%
BLOCKING ON29 APRIL;THYROID
DOSEREDUCTION:
37.5%
23,7
20,3
11,6
14,9 14,9 14,8
mS
v
VARIANTS OF COUNTERMEASURES

17
[9] BIOMOVS II. (1996). Uncertainity and Validation: Effect of Model Complexity on Uncertainty Estimates. BIOMOVS II Technical Report No. 16, Swedish Radiation Protection Institute, Stockholm, Sweden.
[10] IAEA (1994). Handbook of Parameter Values for the Prediction of Radionuclide Transfer in Temperate Environments. Technical Reports Series No 364, International Atomic Energy Agency, Vienna, Austria.
[11] Van Bergeijk, K.E., Noordijk, H., Lembrechts, J., Frissel, M.J. (1992). Influence of pH, Soil Type and Soil Organic Matter Content On Soil-to-Plant Transfer of Radiocesium and -Strontium as Analyzed by a Nonparametric Method, Journal of Environmental Radioactivity, 15, 265-276.
[12] ICRP 56 (1989). Age-dependent Doses to Member of the Public from Intake of Radionuclides, Part 1. ICRP Publication 56, International Commission on Radiological Protection.
[13] S.M. Wright, A.G. Gillett, R.C. Creamer, A.L. Sanchez, N.M.J. Crout, P. Krajewski, I. Malatova, R. Mirchi, B. Kanyár, A. Nenyei And B.J. Howard, Development Of Critical Loads Maps For Radiocaesium For Czech Republic, Hungary And Poland , Deliverable For The Spatial Analysis Of Vulnerable Areas In Central Europe, Project Eu Contract Number: Erb Ic15-Ct98-0206, November 1999
18
THE MICRONUCLEUS ASSAY IN HUMAN PERIPHERAL BLOOD LYMPHOCYTES FOR DETERMINATION OF INDIVIDUAL SENSITIVITY TO IONISING RADIATION
WITH APPLICATIBILITY IN BIOLOGICAL MONITORING
Maria Kowalska, Monika Szymańska, Kamil Szewczak
INTRODUCTION
Individuals differ in their sensitivity to ionizing radiation. There are radiosensitive sub-groups with hypersensitivity to early and late cytotoxic effects of radiation and with increased susceptibility to cancer [1]. The individual radiation response may result from mutations or polymorphisms of genes encoding DNA repair pathways or processing and/or signaling of radiation-induced DNA damage [2],[3].The micronucleus assay after in vitro irradiation of peripheral blood lymphocytes represents a useful test in measuring individual radiosensitivity since it reflects non-repaired DNA beaks at the time of cell division The objective of this study was to indicate that an increased yield of radiation-induced micronuclei could be an indicator of individual radiosensitivity and cancer predisposing genes. Identification of individuals in normal population with increased inherent radiosensitivity is of relevance for their protection from the adverse effects of radiation, with applicatibility in the monitoring of occupational or environmental radiation exposure. The prediction of a cancer patient’s radiosensitivity can also facilitate the individualization of radiation therapy protocols.
MATERIAL AND METHODS
Blood samples and irradiation conditions The study was performed with heparinized blood samples taken from 10 healthy female and male donors and 4 cancer patients. Irradiations of whole blood samples with 0 (non-irradiated control) and 1 Gy was carried out at room temperature using a Pantak X-ray machine operating at 243 kV, 10 mA with 1,62 mm Cu and 4 mm Al filters at a dose rate of 0,35 Gy/min. Before every X-irradiation the dose value was measured by PTW-UNIDOS electrometer with 0,6 cc volume ionization chamber. 1 Micronucleus assay The micronucleus (MN) assay in peripheral blood lymphocytes was based on the cytochalasin-B-blocked micronucleus method described by Fenech and Morley [4]. Irradiated and control lymphocytes were cultured in RPMI medium at 37oC in a 95% air plus 5% CO2 incubator. After 48 h of stimulation with phytohemagglutinin, lymphocytes were treated for 24 h with 6l/ml of cytochalasin-B in order to block cytokinesis. Thereafter, cells were submitted to hypotonic stress (0.075M KCl) for 20 minutes, and

19
fixed three times in 3:1(v/v) methanol/acetic acid. Preparations were finally dropped on preclined-wet slides, air-dried for at least 24 h and stained with 2 % Giemsa solution for 10 minutes. Micronuclei were scored in binucleated cells with well-preserved cytoplasm, using a Nikon light microscope (Figure 1). Micronuclei were considered if their dimension did not exceed one third of the diameter of the main nucleus, with the exception micronuclei touching the main nuclei as well as free-lying nuclei. For each subject and at a given dose, micronucleus (MN) frequency was determined on 1000 binucleated cells.
Figure 1. Two micronuclei after 1 Gy of X-irradiation of peripheral blood lymphocytes from a
healthy donor.
RESULTS AND DISCUSSION
The number of micronuclei at 0 and 1 Gy per binucleated cell in 10 healthy donors and 4 cancer patients are presented in Tables 1a and 1b. The frequency of micronuclei at 0 Gy (MN0) provides an index of cumulative damage occurring during the life span of circulating lymphocytes, whereas the induction of micronuclei after 1 Gy of X-irradiation (MN1 minus MN0) reflects the chromosomal radiosensitivity of human lymphocytes. The ratio of highest/lowest values of micronucleus frequency is also given as an indication of the range of individual variability (Tables 1a and 1b). As may be seen, MN0 frequency is heterogeneous between individuals, varying about 12-fold for highest/lowest ratio in 10 healthy blood donors (Table 1a). The ratio of highest/lowest values of MN0 frequency for 4 cancer patients is 5,4 (Table 1b). The frequency of radiation-induced micronuclei (MN1 minus MN0) shows the same but less pronounced variations. The ratio is 1,8 or 1,6 in healthy donors and cancer patients, respectively.

20
Table 1a. Radiosensitivity of 10 healthy blood donors assessed by the micronucleus assay
Donor No. Sex Age
MN0 MN1 MN1-N0
1 F 27 0,007±0,0031 0,049±0,007 0,042 2 F 45 0,016±0,004 0,079±0,009 0,063 3 F 60 0,020±0,004 0,078±0,008 0,058 4 M 52 0,015±0,003 0,075±0,008 0,060 5 M 59 0,018±0,004 0,079±0,009 0,061 6 M 55 0,019±0,004 0,072±0,008 0,053 7 M 26 0,004±0,002 0,056±0,007 0,052 8 M 55 0,048±0,007 0,124±0,011 0,076 9 M 50 0,035±0,006 0,107±0,010 0,072 10 M 40 0,010±0,003 0, 086±0,009 0,076 The ratio of highest/lowest values 12 2,5 1,8 1SD=√number of micronuclei/number of binucleated cells, standard deviation of the mean.

21
Table 1b. Radiosensitivity of 4 cancer patients assessed by the micronucleus assay
Patient No. Sex Age
MN0 MN1 MN1-N0
1 M 40 0,038±0,0061 0,174±0,013 0,136 2 M 47 0,024±0,005 0,141±0,012 0,117 3 F 30 0,010±0,003 0,095±0,009 0,085 4 M 38 0,007±0,002 0,127±0,001 0,120 The ratio of highest/lowest values 5.4 1,8 1,6 1SD=√number of micronuclei/number of binucleated cells.
The inter-individual variation in radiosensitivity of 10 healthy donors is described by a normal distribution with a mean value of MV=0,062 micronuclei per cell and a standard deviation of 0.011. To classify donors and cancer patients according to their radiosensitivity, we used following criteria: resistant when MN1-MN0 < MV-SD, normal when MN1-MN0 = MV±SD and sensitive when MN1-MN0 > MV+SD. According to these criteria, one of 10 donors was classified as resistant, seven as normal and two as sensitive. Using the same classification, all cancer patients were classified as sensitive. The variations in radiosensitivity measured by the micronucleus (MN) assay are shown in Figure 2.

22
Fig. 2. Inter-individual variation in radiosensitivity of 10 healthy blood donors and 4 cancer patients as measured with MN-assay
In conclusion, our study indicate that increased yield of radiation-induced
micronuclei is a reliable indicator of individual radiosensitivity and cancer predisposing genes. Therefore, the proposed methodology may provide a simple predictive assay for the assessment of individual radiosensitivity what seems to be an important aspect in radiological protection and medical uses of ionizing radiation.
REFERENCES 1. Hoeller,U. Borgmann, K. Bonacker, M. Kuhlmey, A. Bajrovic, A. Jung, H. Alberti, W.
Dikomey, E. Individual radiosensitivity measured with lymphocytes may be used to predict the risk of fibrosis after radiotherapy for breast cancer. Radiotherapy and Oncology, 2003; 69: 137-144.
2. Bentomane MA. Molecular aspects of individual radiosensitivity. Journal of Biological Regulators and Homeostatic Agents 2004; 18: 357-362.
3. Pichierri, P. Franchitto, A. Palitti, F. Predisposition to cancer and radiosensitivity. Genetics and Molecular Biology 2000; 23 (4): 1101- 1105.
4. Fenech, M. Morley, A.A. Cytokinesis-block micronucleus method in human lymphocytes: effect of in vivo ageing and low dose X- irradiation. Mutation Research., 1986; 161: 193-198.
23
CYTOGENETIC INVESTIGATION OF ACCIDENTAL OVEREXPOSURES TO AN INDUSTRIAL GAMMA RADIOGRAPHY SOURCE IN GDANSK
Maria Kowalska, Monika Szymańska
This cytogenetic investigation was required to estimate radiation doses received by two radiographers who were irradiated by gamma rays from a 2.63 TBq iridium-192 industrial radiography source, which had become detached from its wind-out cable. They had taken their own decision to retrieve the source to the shielding container by manually grapping the guide tube. Finally the source has been returned back to the Gammamat TSI-3 apparatus but the radiographer, designated R1, suffered radiation burns on his hands, suggesting an acute non-uniform exposure. His colleague, designated R2, had no clinical symptoms of radiation injury. The incident occurred on 27 July 2009 on an area of the Lotos refinery in Gdańsk. However the company released information about it on 28 September, when the radiation burns of R1 became advanced. Because personal dosemeters have not been worn, doses received by R1 and R2 were estimated by blood lymphocyte chromosomal analysis by the conventional dicentric assay and physical calculations combined with reconstruction of the event by involved workers.
Measurement of chromosomal aberrations yields, particularly the dicentrics in cultured peripheral blood lymphocytes has been used to assess the equivalent whole-body dose of individuals accidentally exposed to ionising radiation [1,2]. Since the yield of dicentrics is changing in time depending on: the dose, cell turnover and status of health of an exposed person, the utility of the lymphocyte dicentric assay is limited in time after irradiation, and may be applied only in a few months after exposure [3,4,5]. To provide enough dicentric chromosomes for estimating the dose, blood samples should be taken as soon as possible after exposure. It is especially important in cases of non-uniform localised exposure, because chromosomal damage is potentially shown only by a small fraction of irradiated lymphocytes.
The lymphocyte dicentric assay was performed on blood samples collected at the CLOR on October 5, 2009. In the case of R2 we randomly assessed 1400 metaphase cells and found 5 dicentrics and 1 tricentric, counted as 2 dicentrics. The absorbed dose was estimated from the dicentric frequency (7/1400=0.005) by inverse interpolation from an in vitro produced dose-response calibration curve using a freely available PC program called CABAS ( Chromosomal Aberration Calculation Software) [6]. Since a dose-response curve for iridium-192 gamma rays was not available, calibration dose-response curves generated for cobalt-60 gamma rays and 250 kVp X rays at dose rates 0,35 Gy/min were used for dose estimation. Based on inverse interpolation from the 60Co calibration dose response curve ( Y= 0,0010+0,0119D+0,0557D2) we have estimated W2 received no more than 0.316 Gy (95% upper confidence limit) and no less than 0.065 Gy (95% lower confidence limit) with a mean whole-body dose 0.182 Gy. Using the 250 kVp X-ray calibration curve (Y= 0,0010+0,0341D+0,0643D2), the estimate
24
of whole-body dose was no more than 0.197 Gy (95% upper confidence limit) and no less than 0.026 Gy (95% lower confidence limit) and its mean value was 0.097 Gy. Due to the energy of iridium-192 gamma-rays, the dose-response curve for this isotope should lie between X and gamma radiation curves. For this reason, the minimum value of the biological estimate of dose to which R2 was exposed from the iridium-192 source must be between 26 and 65 mGy and the maximum one between 197 and 316 mGy.
Unfortunately, in the blood sample collected from R1 on October 5, only 198 metaphases were available and in this material we did not find any dicentric. It suggested that the frequency of dicentrics per cell was smaller than expected and much more cells must be analysed to provide a reliable dose estimate. The next blood sample was received on November 2. We assessed 1802 cells and found only 1 dicentric corresponding to a dose of 0 Gy on our laboratory dose-response curves. Therefore was not possible to estimate by cytogenetic the dose to which this radiographer had been exposed 99 days before.
Based on the physical calculations [7], the average dose to the whole body of R1 and R2 was estimated to have approximately the same value of 91 mGy. In the light of many uncertainties in physical and cytogenetic dosimetry, the agreement with cytogenetic dose assessment can be considered as reasonably good. Calculated doses to the left hand and the right hand of R1, who retrieved the source with his bare hands, were 3 Gy and 12.4 Gy, respectively. For R2 physical calculations revealed the dose of 1.2 Gy to each his hand.
REFERENCES
1. IAEA: Biological Dosimetry: Chromosomal Aberration Analysis for Dose Assessment. Technical Reports Series No. 260, INTERNATIONAL ATOMIC ENERGY AGENCY, Vienna, 1986.
2. IAEA: Cytogenetic Analysis for Radiation Dose Assessment. A Manual. Technical Reports Series No. 405, INTERNATIONAL ATOMIC ENERGY AGENCY, Vienna, 2001.
3. IAEA: The Radiological Accident in Goiania. INTERNATIONAL ATOMIC ENERGY AGENCY, Vienna, 1988.
4. IAEA: The Radiological Accident in San Salvador. INTERNATIONAL ATOMIC ENERGY AGENCY, Vienna, 1990.
5. IAEA: The Radiological Accident in Yanango. INTERNATIONAL ATOMIC ENERGY AGENCY, Vienna, 2000.
6. Deperas J., Szłuińska M., Deparas-Kamińska M., Edwardas A., Lloyd D., Lindholm C., Romm H., Roy L., Moss R., Morand J., Wójcik A.: CABAS: a freely available PC program for fitting calibration curves in chromosome aberration dosimetry. Radiat Prot Dosimetry (2007) 124 (2): 115-123).
7. Białkowski T. Zdarzenie radiacyjne w Gdańsku. Bezpieczeństwo Jądrowe i Ochrona Radiologiczna. Nr1 (79)/2010.

25
THE RADON CONCENTRATION INVESTIGATIONS IN DWELLINGS OF RZESZÓW AREA WITH THE AIM OF COMPLETING MISSING DATA IN RADON ATLAS OF
POLAND
Olga Stawarz, Krzysztof Isajenko, Paweł Lipiński, Kalina Mamont-Cieśla
INTRODUCTION
The Central Laboratory for Radiological Protection in cooperation with the Radiation Measurements Laboratory in Sanok (department of SANEPID in Rzeszów) performed the measurements of radon concentration in seventy dwellings in the Rzeszów area. The results of radon concentration measurements in dwellings in the Rzeszów area will be used to complete the radon map of Poland for the European Atlas of Natural Radioactivity, as well as the Polish radon database. The results are stored in the MS Excel file, according to Radioactivity Environmental Monitoring, Joint Research Centre (JRC) guidelines.
METHOD OF MEASUREMENTS
The track detector method with the CR-39 foil at the bottom of diffusion chambers was applied. The CR-39 detectors are considered the most suitable method for indoor radon measurements. The polymer CR-39 has been used in the manufacture of eye-glasses lenses since1947. Earlier it was used by Americans during the WWII to cover the fuel tanks of B-17 bomber aircrafts, to make them more durable. The name comes from „Columbia Resin #39”, because it was 39th formula for the thermosetting plastic, elaborated within the Columbia Resins program (1940).
At the beginning of 1960s the group: R.L. Fleisher, P.B. Price and R.M. Walker discovered that strongly ionizing particles, for example the particles, damage chemical bonds when they pass through CR-39 foil. In such a way a latent image of the particle track emerges. Upon the etching process in a caustic solution of sodium hydroxide the damaged regions become enlarged and visible and can be counted using the conventional optical microscope (Fig.1).

26
Fig.1. Visible particles’ tracks as a result of etching process.
The CR-39 detectors register particles within the energy range from 0.1 MeV to more than 20 MeV. They are not sensitive to and radiation or to temperature and relative humidity changes in the environmental range. Unfortunately, the atmospheric pressure may influence the track density because of the dependence of the particle range on the air density. An inverse relationship of the track density with the air pressure (direct with the altitude) was observed – for an altitude of 1500m above the sea level the track density is increased by about 40%.
It has to be mentioned that, as recently discovered, the plastic chambers absorb radon which diffuses out of the plastic when chambers are stored in a lower radon concentration, which causes significant measurement uncertainty. If the CR-39 foils are not separated from chambers after the exposure and stored in a closed environment the radon released during storage produces additional tracks in the foils, and thus may generate an overexposure error of the measurement. Thus, it is recommended that the films should be separated from the chambers immediately after the intended exposure.
The CR-39 track detectors integrate over almost any time of exposure method. The exposure may last even a year or longer but in dwellings it should not be shorter than one month.
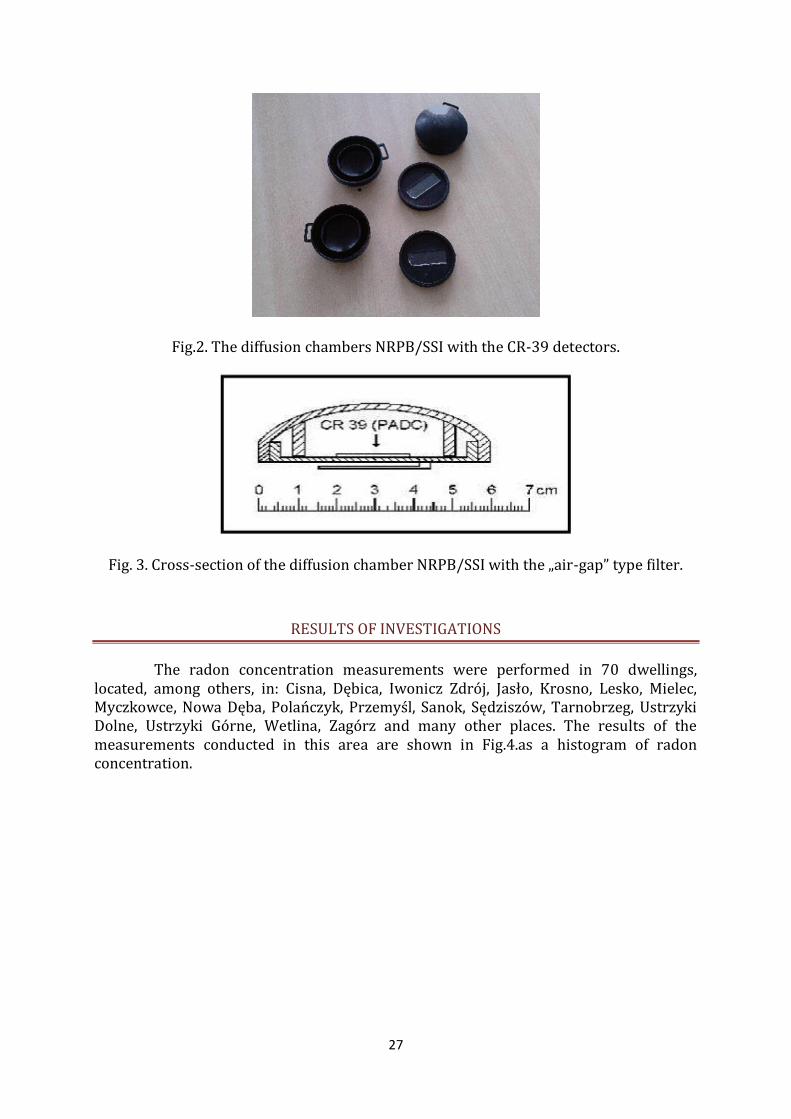
In dwellings of Rzeszów area diffusion chambers of the type NRPB/SSI made of conducting plastic (Fig.2) were used to perform the measurements. In Fig.3. an „air-gap” type filter used in the diffusion chamber is shown. Cut and numbered tiles of CR-39 foil were bought in TASL, UK. The etching was performed in 40% NaOH solution, at 70oC, during 7 hours. The own track counting system was used to count the tracks. The area of counting was 78 mm2, calibration factor wk=50,7 kBq h m-3/(tracks/mm2) and low limit of detection of exposure LLD=80 kBq h/m3 (±20%). From that it can be calculated that
low limit of detection of radon concentration for 200 days exposure is 16 Bq/m3.The chambers, three in each dwelling, were exposed on the first floor of buildings since April to October 2009 (about 200 days).
27
Fig.2. The diffusion chambers NRPB/SSI with the CR-39 detectors.
Fig. 3. Cross-section of the diffusion chamber NRPB/SSI with the „air-gap” type filter.
RESULTS OF INVESTIGATIONS
The radon concentration measurements were performed in 70 dwellings, located, among others, in: Cisna, Dębica, Iwonicz Zdrój, Jasło, Krosno, Lesko, Mielec, Myczkowce, Nowa Dęba, Polańczyk, Przemyśl, Sanok, Sędziszów, Tarnobrzeg, Ustrzyki Dolne, Ustrzyki Górne, Wetlina, Zagórz and many other places. The results of the measurements conducted in this area are shown in Fig.4.as a histogram of radon concentration.

28
Fig. 4. Histogram of radon concentration values in dwellings in the Rzeszów area.
The basic statistical parameters for the results of the radon concentration measurements in Rzeszów area are the following: arithmetic mean: 49 Bq/m3, geometric mean: 40 Bq/m3, median: 42 Bq/m3, maximum value: 188 Bq/m3, minimum value: 16 Bq/m3. The results of the radon concentration measurements in dwellings were placed on the maps of Rzeszów area (Fig. 5a and 5b).
Fig. 5a. Radon map - dwellings in the Rzeszów area.

29
Fig. 5b. Radon map - dwellings in the Rzeszów area.
RADON MAPS OF POLAND
The results of the measurements collected during many years by the Medical Academy (at present – Medical University) in Białystok, the Central Laboratory for Radiological Protection in Warszawa, the Central Mining Institute in Katowice, the Nuclear Physics Institute PAN in Kraków, the Institute of Occupational Medicine in Łódź and the Building Research Institute in Warszawa were used to prepare the radon concentration map for dwellings in Poland.
The measurements were performed by two methods: CR-39 or LR-115 track detector method (time of exposure: 3-12 months) and charcoal detector (PicoRad) method (time of exposure: 2-4 days).
The maps of the concentration of radon in dwellings in Poland were prepared using MapInfo v.9.2 software (Fig. 6a, 6 b and 6c).
The maps were prepared using the data from Excel files. The MapInfo software was used to present the geographical distribution of the data on the maps. Simple latitude/longitude projection was used.
SUMMARY
The concentration measurements performed in Rzeszów area made it possible to fill in the blank areas of southeastern part in the map of Poland.
The arithmetic mean value of radon concentration for all measurements in Poland, which were taken to create the map is 86 Bq/m3, the geometric mean is equal to 43 Bq/m3 and the median amounts to 40 Bq/m3. The maximum value of radon concentration is 3229 Bq/m3. The number of the results increased from 3235 to 3305, and the number of filled 10x10 km cells increased from 6.2% to 7.0%. The arithmetic

30
mean concentration of radon for Rzeszów area is 49 Bq/m3, the geometric mean – 40 Bq/m3, the median – 42 Bq/m3 and the maximum value – 188 Bq/m3.
We hope to extend the database of Polish results including the results of the radon concentration measurements in dwellings in western and northwestern Poland in the future.
Fig. 6a. The concentration of radon in dwellings in Poland.
Fig. 6b. The concentration of radon in dwellings in Poland – raster map.

31
Fig. 6c The concentration of radon in dwellings in Poland.

32
MONITORING OF 137Cs CONCENTRATION IN SOIL, 2008-2009
Krzysztof Isajenko, Barbara Piotrowska, Magdalena Kuczbajska, Adam Ząbek Dosimetry Department
This project was supported by the National Environmental Protection and Water Management Fund.
The investigations of radioactive contaminations of soil are performed in the frame of Polish National Environmental Monitoring System. The soil sampling is carried out at the premises of the network of meteorological stations of the Institute of Meteorology and Water Management.
The results of the measurements of soil samples are used for the all-country computerized radiological data base and for preparation of radiological maps of Poland produced in MapInfo 8.0 PL system. This system visualizes results of the investigation at the sampling points as circle cartodiagrams or extrapolates results of the point measurements to the whole area of Poland.
In the 254 points soil samples were collected to determine concentration of the caesium 137Cs and natural radionuclides (radium 226Ra, actinium 228Ac and potassium 40K) by means of the spectrometric analysis.
In each point the samples of soil were taken in October 2008 with a knife-edge pipe of 7 cm diameter from the 10 cm thick surface layer at six places, at the circumference of the circle of 2 m radius, and in the centre of the circle. The measurements of radionuclide concentrations in soil samples were made using spectrometers with HPGe detectors, located in low-background lead shielding houses. The time of each measurement was 80000 s.
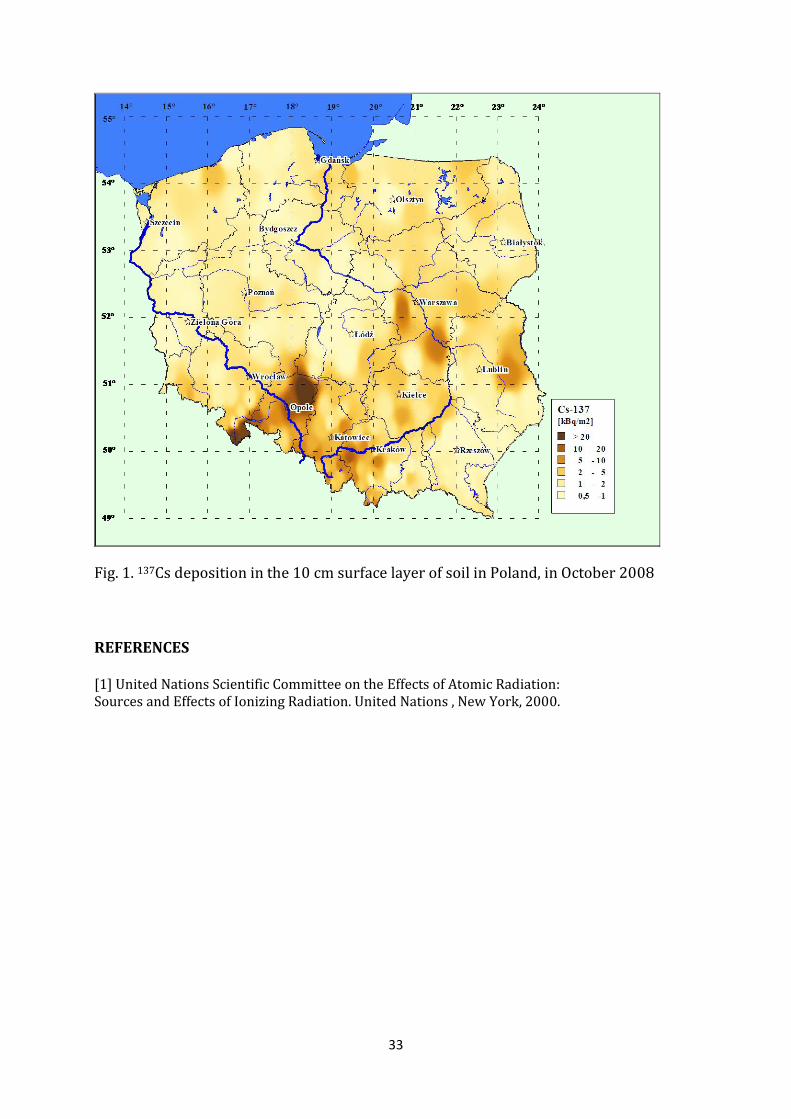
The mean value of 137Cs deposition density in Poland is 2.10 kBqm-2, ranging from 0.02 to 26.79 kBqm-2. The radiological map of 137Cs deposition density (raster map) is presented in Fig.1. Such distribution of 137Cs was mainly due to the weather conditions - in particular rainfall - in Poland in May 1986, i.e. in the period immediately after the Chernobyl accident. All results refer to soil samples taken in October 2008.
The mean values of concentrations of natural radionuclides in soil in Poland are:
for 226Ra - 25.8, for 228Ac - 24.3 and for 40K – 416 Bqkg-1, i.e. lower than the mean world concentrations of 33, 45 and 420 Bqkg-1, respectively [1].
The highest mean concentrations of 226Ra and 228Ac occur in the southern parts of Poland, depending on the geological structure of the country. For instance in a soil sample taken in Szklarska Poręba the concentrations are: 143,2 Bqkg-1 of 226Ra and 125,0 Bqkg-1 of 228Ac.
33
Fig. 1. 137Cs deposition in the 10 cm surface layer of soil in Poland, in October 2008 REFERENCES [1] United Nations Scientific Committee on the Effects of Atomic Radiation: Sources and Effects of Ionizing Radiation. United Nations , New York, 2000.

34
ANNUAL EFFECTIVE DOSE ( 2008 )
Janusz Henschke
The population of Poland is at present subject to ionizing radiation from natural and artificial sources at levels not much different from those in other European countries. Ionizing radiation of natural origin consists of cosmic radiation and radiation of natural radionuclides present in the environment and in various types of products and materials such as building materials, food, water and air. Man-made ionizing radiation consists of radiation used in medical diagnostics and, to a much lesser extent, of radiation emitted by radioactive fallout from former nuclear tests and from accident in nuclear power plant in Chernobyl. The average annual effective dose from natural and man-made sources, estimated according to the recommendation of UNSCEAR 2000*), amounted in 2008 to 3,35 mSv for the statistical inhabitant of Poland. The most considerable contribution to this value, 74% (2,48 mSv/year), is from radiation of the natural radionuclides. Among them the highest individual dose arises from radon exposure (40,6% or 1,36 mSv/year). Cosmic radiation contributes only 8,5% (about 0,28 mSv/year). The man-made sources contribute to the average annual total effective dose about 0,87 !mSv/year, i.e. 26%, most of which comes from ionising radiation used in medical diagnostics (25,4% or 0,85 mSv/year). The average annual effective doses for inhabitants of Poland from various sources of radiation are shown in Figures 1 and 2. The annual dose limit for public exposure according to regulations is 1 mSv. The dose limit does not include irradiation from cosmic rays and from natural radioactive elements presented in the environment or in human organism in physiological conditions. The investigations carried out by the Central Laboratory for Radiological Protection allow to estimate the value of the annual effective dose, caused by radiation of man-made sources (excluding medical exposure), for an statistical inhabitant of Poland in 2008 to be 0,016 mSv. This value contains the dose due to external gamma radiation and the dose from radiation of radionuclides incorporated to the body through alimentary and respiratory tracts. Comparing the value of 0,016 mSv to the annual dose limit for public (1 mSv) and to the average effective dose (3,35 mSv) can be stated that in 2008 this value reached 1,6% of the dose limit and 0,5% of the average annual effective dose to which the statistical inhabitant of Poland was exposed. ________________________ *)United Nations Scientific Committee on the Effects of Atomic Radiation: Sources and Effects of Ionizing Radiation. United Nations, New York, 2000.

35
Fig 2. Average annual individual effective dose from different radiation
sources in Poland in 2008
0 0,2 0,4 0,6 0,8 1 1,2 1,4
Others
Nuclear accidents
Medical
Internal
Thoron
Cosmic
Gamma outdoors
Gamma indoors
Radon outdoors
Radon indoors
mSv
Toron 3,0% 0,101 mSv
Radon 1,361 mSv
Gamma 0,462 mSv
Internal 0,272 mSv
Cosmic 0,284 mSv
Medical 25,4% 0,850 mSv
Nuclear accidents 0,2% 0,007 mSv
Others 0,3% 0,009 mSv
Fig 1. Contribution of different radiation sources to the average annual individual effective dose in Poland, 2008 (3,35 mSv)
13,8%
26,0%
40,6%
8,1% 8,5%
Natural sources (74%) Man-made sources (26%) 2,48 mSv 0,87 mSv
0,865 mSv

36
THE COMPLEXITY MEASUERMENTS USED FOR ESTIMATION OF
RADIOLOGICAL SITUATION IN SURROUNDINGS OF WASTES REPOSITORY (KSOP) IN RÓŻAN
Ludwika Kownacka, Krzysztof Isajenko, Paweł Krajewski, Paweł Lipiński, Irena Radwan,
Jarosław Rychlicki, Alfred Żak, Adam Adamczyk, Andrzej Boratyński, Edward Chrzanowski, Roman Czekała, Magdalena Kuczbajska, Adam Ząbek
Project supported by the National Atomic Energy Agency
The Central Laboratory for Radiological Protection performed in 2008 the measurements of levels of environmental radioactivity in the surroundings of KSOP-Różan (National Repository of Radioactive Wastes in Różan). These programme started in CLOR in 2001. The purpose of this surveillance programme is to collect data on the existing levels of radioactivity and to detect their changes, thus providing a full control of the radiological situation. In the vicinity of KSOP-Różan the following samples were collected: - river water (r. Narew) - twice a year from two control points, - well water - twice a year from two control points, - spring water - twice a year from tree control points, - ground water - three times a year from eight control points, - soil – twice a year from five control points, - grass - twice a year from five control points, - corns - once a year from four control points, - atmospheric aerosol - twice a year from two points (leeward of KSOP-Różan)
In the 20 litre samples of river, well and spring water, after evaporation to 220 ml, the preliminary gamma spectra analyses were performed. Later, using the radiochemical method, the activity concentrations of radiocaesium, and in well water also activity concentrations of strontium-90 in comprehensive sample, were determined. In 1 litre water samples from the same places the activity concentrations of tritium were determined. In the ground water samples the gross beta and the activity concentrations of tritium were determined. In the samples of soil, grass, corns and atmospheric aerosol the gamma spectra analyses were performed.
Around this repository also the gamma dose rates were controlled (twice a year in five control points). All sampling (except sampling of atmospheric aerosol) and measurements were conducted according to procedures in “The measurement technique applied in control survey for estimation of radiological situation in surrounding of Centre Świerk and KSOP-Różan”, prepared in CLOR in 2003 end confirmed by President of the National Atomic Energy Agency.

37
2
Z -spring water
Sampling points of:
P -ground water
G -well water
W - river water
MD -dose rate, soil, grass
Zb - corn
N
KSOP
A - aerosol
A2
A
Fig.1. Map of KSOP-Różan with environmental sampling points. Thick arrow indicates the direction of ground water flow.
The concentrations of measured radionuclides in all samples collected in 2008 were in the low levels. The mean concentrations of radiocaesium were: Narew river water samples – 0,0020 Bq/dm3, up-stream KSOP – 0,0018, below KSOP-0,0023 Bq/dm3, wells water samples – 0,0010 Bq/dm3 and were from 0,0007 to 0,0014 Bq/dm3, springs water samples – 0,0020 Bq/dm3 and were from 0,0015 to 0,0025 Bq/dm3. The mean concentrations of tritium were: Świder river water samples – 1,2 Bq/dm3, up-stream KSOP – 1,05, below KSOP-1,4 Bq/dm3, wells water samples – 1,5 Bq/dm3 and were from 1,0 to 1,4 Bq/dm3, springs water samples – 1,5 Bq/dm3 and were from 0,8 to 2,3 Bq/dm3. The mean concentrations of strontimu-90 in the wells water samples - 0,0034 Bq/dm3. The mean gross activity in the samples of ground water - 0,098 Bq/dm3 and were from 0,030 to 0,258 Bq/dm3 The mean concentration of tritium in ground water samples - 1,7 Bq/dm3 and were from 0,7 to 2,7 Bq/dm3 . In one control point (2p) the concentration was always higher and mean values in 2008 was 21,5 Bq/dm3 and were from 19,3 to 25,2 Bq/dm3. The mean concentration of 137Cs measured by gamma spectrometric method in: soil samples - 5,3 kBq/m2 and were from 2,35 to 21,05 kBq/m2, grass samples - 7,6 Bq/kg s.m. and were from 1,3 to 20,5 Bq/kg s.m., corns samples- <0,60 Bq/kg and were from 0,09 to <0,6 Bq/kg, atmospheric aerosol samples - spring – <1,8 Bq/m3, autumn – <1,9 Bq/m3 ( the mean concentrations in all regions Poland, in the same times, were respectively 0,8 and 1,2 Bq/m3).

38
In gamma spectrometric method, for the measuring this four types of samples, we received also the concentrations of natural izotopes as 7Be, 40K, 210Pb, 226Ra, 228Ac. Their concentrations were in the same levels as it were measured in previous years. The mean of gamma dose rates (including cosmic radiations) were 99 Gy/h, change from 88 to 112 and were in the same levels as it were measured in the other regions in Poland.

39
THE COMPLEXITY MEASUERMENTS USED FOR ESTOMATION OF RADIOLOGICAL SITUATION IN SURROUNDING OF ŚWIERK CENTRE
Ludwika Kownacka, Krzysztof Isajenko, Paweł Krajewski, Paweł Lipiński, Irena Radwan,
Jarosław Rychlicki, Alfred Żak, Adam Adamczyk, Edward Chrzanowski, Magdalena Kuczbajska, Adam Ząbek
Project supported by the National Atomic Energy Agency
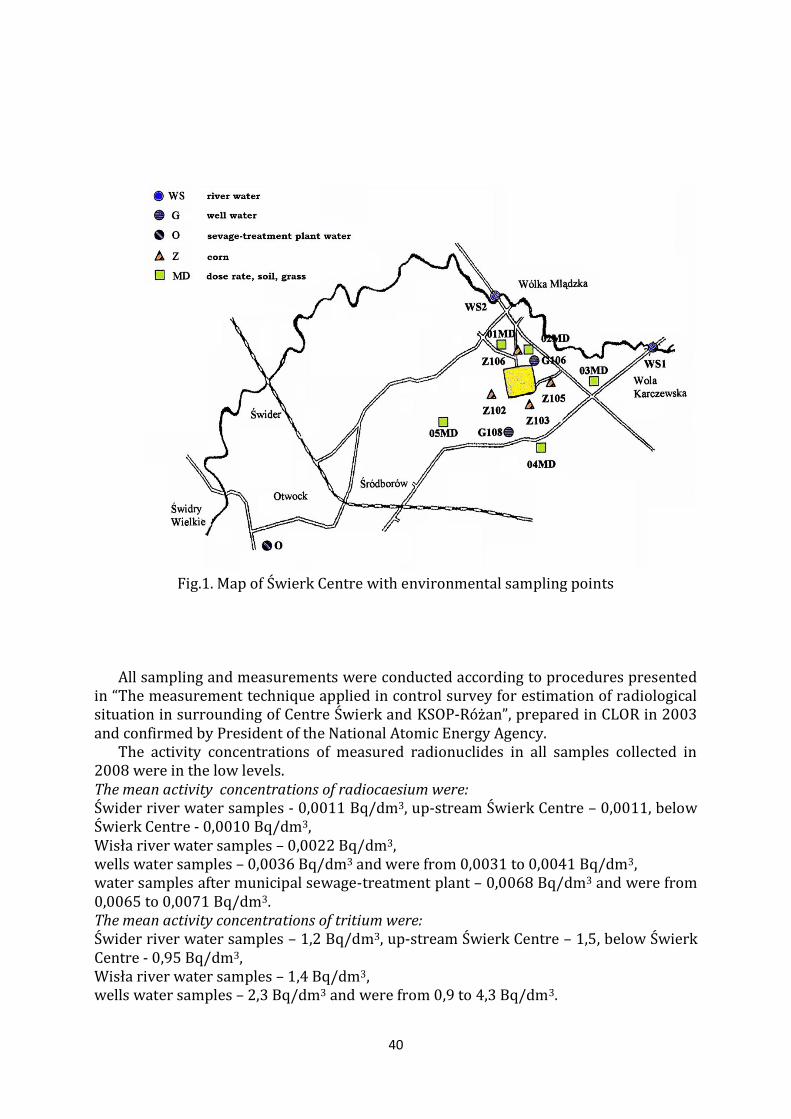
Since 2001 Central Laboratory for Radiological Protection surveyed the radiological situation in the surroundings of Świerk Centre. In this document we present the results obtained in 2008. The purpose of this surveillance programme is to collect data on the existing levels of radioactivity and to detect their changes, thus providing a full control of the radiological situation. Following samples were collected in the vicinity of Świerk Centre: - river water (r. Świder) – twice a year from two control points, - river water (r. Wisła) – once a year from one control point, - well water – twice a year from the two control points, - water after municipal sewage-treatment plant – twice a year from one control point, - soil – once a year from five control points, - grass – once a year from five control points, - corn – once a year from four control points,
In the 20 litre sample of water, after evaporation to 220 ml, the preliminary gamma
spectrometric analyses were performed. Then, the activity concentration of radiocaesium and tritium were determined with a radiochemical method. In 1 litre water samples from the river and wells the activity concentrations of tritium were determined – only since 2005. In the soil, grass and corn samples the gamma spectrometric analyses were performed.
Around the Świerk Centre the gamma dose rates were controlled - twice a year in five control points.
40
Fig.1. Map of Świerk Centre with environmental sampling points
All sampling and measurements were conducted according to procedures presented in “The measurement technique applied in control survey for estimation of radiological situation in surrounding of Centre Świerk and KSOP-Różan”, prepared in CLOR in 2003 and confirmed by President of the National Atomic Energy Agency.
The activity concentrations of measured radionuclides in all samples collected in 2008 were in the low levels. The mean activity concentrations of radiocaesium were: Świder river water samples - 0,0011 Bq/dm3, up-stream Świerk Centre – 0,0011, below Świerk Centre - 0,0010 Bq/dm3, Wisła river water samples – 0,0022 Bq/dm3, wells water samples – 0,0036 Bq/dm3 and were from 0,0031 to 0,0041 Bq/dm3, water samples after municipal sewage-treatment plant – 0,0068 Bq/dm3 and were from 0,0065 to 0,0071 Bq/dm3. The mean activity concentrations of tritium were: Świder river water samples – 1,2 Bq/dm3, up-stream Świerk Centre – 1,5, below Świerk Centre - 0,95 Bq/dm3, Wisła river water samples – 1,4 Bq/dm3, wells water samples – 2,3 Bq/dm3 and were from 0,9 to 4,3 Bq/dm3.

41
The mean activity concentrations of strontimu-90 in the wells water samples were 0,0107 Bq/dm3 and waried from 0,0050 to 0 0165 Bq/dm3. The mean activity concentration of 137Cs measured by gamma spectrometric method in: soil samples – 1,63 kBq/m2 and were from 1,07 to 2,89 kBq/m2, grass samples – 3,24 Bq/kg s.m. and were from 1,5 to 5,5 Bq/kg s.m., corn samples - <0,17 Bq/kg and were from <0,06 to <0,17 Bq/kg. In gamma spectrometric method, for the measuring this three types of samples, we revised also the concentrations of natural isotopes as 7Be, 40K, 210Pb, 226Ra, 228Ac. Their concentrations were in the same levels as it has been measured in previous years. The mean of gamma dose rates (including cosmic radiations) were 72 Gy/h, change from 60 to 82 and were in the same levels as it has been measured in the other regions in Poland.

42
RADIATION SAFETY & SECURITY AND RADIATION PROTECTION. NEW CONCEPTS
Tadeusz Musiałowicz
INTRODUCTION
Safety, Security and Protection the quantities in ionizing radiation usage domain, are often differently interpreted. Is the radiation safety culture the same as radiation protection culture? Radiation protection officer and radiation safety officer need to have the same or different qualifications?
The safety it is a state which must be assured for the people and environment and the protection is the fundamental mean for achieving this aim. Radiation protection alone is not sufficient for proper radiation safety. There are also needed quality assurance of materials and installations, adequate law system, personnel training, safe handling of radiation sources, adequate supervision and control, prevention of accidents and mitigation of their consequences, physical protection of radiation sources and criticality safety in case of significant quantities of nuclear material. May all these entities be included in the broad definition of radiation protection? If yes, then radiation safety culture and radiation protection culture will mean exactly the same.
International regulations usually define safety and security as “ the actions related to...” such definition is rather adequate to the protection. Except for criticality issue, the term nuclear safety” is often used in general meaning of “radiation safety”, and differently defined in different international regulations. This term should not be used in general sense for all kinds of radiation, for example not for X rays which are not of nuclear origin. The best thing would be to restrict the term nuclear safety to nuclear materials and installations. In the IAEA catalogue [1] and some IAEA publications [2] nuclear and radiation safety are correctly treated separately.
PRESENT DEFINITIONS IN INTERNATIONAL REGULATIONS
Radiation (radiological) Safety Definition not known. Nuclear Safety EURATOM
Nuclear Safety means the achievement of proper operating conditions, prevention of accidents and mitigation of accident consequences, resulting in protection of workers and the general public from dangers arising from ionizing radiations from nuclear installations [10].

43
WIKIPEDIA
Nuclear Safety covers the actions taken to prevent nuclear and radiation accidents or
to limit their consequences. This covers nuclear power plants as well as the other nuclear
facilities, the transportation of nuclear materials and the use and storage of nuclear materials
for medical, power, industrial and military uses.
ISO (International Standard Organization)[3]
Nuclear Safety: Actions related to the protection of people and property from the deleterious effects of radioactive contamination, exposure to ionizing radiation and criticality. NOTE – The term ionizing radiation may or may not include X- radiation produced by an X- ray machine according to national usage. IAEA (International Atomic Energy Agency) [4]
Nuclear Safety: The achievement of proper operating conditions, prevention of accidents, or mitigation of accidents consequences, resulting in protection of workers, the public and the environment from undue radiation hazards. IEC (International Electrotechnical Commission) [5]
Nuclear Safety: Set of arrangements taken at all stages of design, construction, operation and, finally the definitive closure of a nuclear power plant in order to forestall accidents and limit their effects. Safety ICRP (International Commission on Radiological Protection) [6]
Safety: The achievement of proper operating conditions, prevention of accidents, or mitigation of accident consequences. (The meaning is assigned to ICRP recommendations) IAEA [7]
Safety (of radiation sources): Measures intended to minimize the likelihood of accidents with radiation sources and should an accident occur, to mitigate its consequences. (The meaning is assigned to IAEA code) Nuclear Security IAEA [4]
Nuclear security: The prevention and detection of and response to, theft, sabotage, unauthorized access, illegal transfer, or other malicious acts involving nuclear material, other radioactive substances, or their associated facilities.
Security of radioactive sources: Measures to prevent unauthorized access or damage to, and loss, theft or unauthorized transfer of radioactive source.

44
IAEA [7] Security (of radioactive material): Measures to prevent unauthorized access, theft
and unauthorized transfer of radioactive sources IEC [8]
Nuclear security (in nuclear power plants): Arrangements to avoid unauthorized
access to equipment, software or radioactive substances. Nuclear Criticality Safety ISO [3]
Nuclear Criticality Safety: Nuclear safety related to accidental criticality. Radiation Protection ISO [3]
Radiation Protection (radiological protection): Measures associated with the limitation of harmful effects of ionizing radiation on people, such as limitation of external exposure to such radiation and of bodily incorporation of radionuclides, and prophylactic limitation of bodily injury resulting of either of these. Physical Protection ISO [3]
Physical Protection: Methods and measures for preventing unauthorized removal of nuclear material or for detection of such removal as it occurs. IAEA [4]
Physical Protection (of nuclear material): Measures for the protection of nuclear material or authorized facilities, designed to prevent unauthorized access or removal of fissile material or sabotage with regard to safeguard, as for example, in the Convention of the Physical Protection of Nuclear Material. Protection and Safety IAEA [9]
Protection and Safety: The protection of people against exposure to ionizing radiation or radioactive material and the safety of sources, including the means of achieving this, and the means of preventing accidents and mitigating the consequences of accidents should they occur.

45
PROPOSED NEW DEFINITIONS
Radiation Safety (radiological safety)
Radiation Safety: The state of being safe from harm of ionizing radiation. This state can be achieved by proper operating conditions of radiation sources, prevention of accidents and mitigation of their consequences, physical protection of radioactive sources, other entities influenced on the safety resulting in preventing of workers, the public and the environment from undue radiation exposure. In case of significant quantities of fissile material, for proper radiation safety, criticality safety requirements shall be observed. Nuclear Safety
Nuclear Safety: Radiation safety related to nuclear materials and facilities, it is the state of being safe from harm of nuclear materials. Criticality Safety
Criticality Safety: The state which shall be assured in order to avoid uncontrolled, self-sustaining nuclear chain reaction of fissile material. Security (in the domain of nuclear energy usage)
Security: The state in which nuclear materials other radioactive sources and their associated facilities are properly protected against any action of unauthorized persons. Security can be achieved by the adequate application of physical protection. Radiation Protection (radiological protection)
Radiation Protection: Assuring of radiation safety by limitation of harmful effects of ionizing radiation on people and environment, such as limitation of radioactive contamination, external exposure of people, and of bodily incorporation of radio nuclides, and prophylactic of bodily injury resulting from either of these. Radiation protection may include: quality assurance of materials and installations, adequate law system, personnel training, safe handling of radiation sources, supervision and control, prevention of accidents and mitigation of their consequences and other entities as far as they are important for radiation safety. Other words: all measures necessary to assure the radiation safety. Physical Protection (of radioactive sources)
Physical Protection: Prevention and detection of and response to, theft, sabotage, unauthorized access, illegal transfer, or other malicious acts involving radioactive materials, or their associates facilities”.

46
REFERENCES [1] Publications Catalogue IAEA 2009 [2] A. J. Gonzalez Radiation & Nuclear Safety IAEA Bulletin Vol. 40 No.2, 1998 [3] Nuclear Vocabulary ISO 921,1997 [4] Safety Glossary IAEA 2007 [5] International Standard IEC 60050-393, 1996 [6] ICRP Publication 103, 2007 [7] Code of Conduct on the Safety and Security of Radioactive Sources IAEA 2000 [8] International Standard IEC 60050-393 Amendment 1, 2000 [9] IAEA Safety Standards Draft 3.0, January 2010 [10] Council Directive 2009/71/EURATOM

47
SCIENTIFIC AND TECHNICAL
REPORTS
2008
RADIATION HYGIENE
DEPARTMENT

48
ACCREDITATION FOR A RADIOCHEMICAL AND SPECTROMETRIC ANALYSES LABORATORY
Ewa Starościak, Walenty Kurowski, Wojciech Muszyński, Irena Radwan,
Lidia Rosiak, Barbara Rubel
A study on „Accreditation for a Radiochemical and Spectrometric Analyses
Laboratory" was carried out in the Radiation Hygiene Department of the Central Laboratory for Radiological Protection (CLOR) in 2008. The study was devoted to tasks covered by Contracts No 4/SP/2008 and No 6/SP/2008. The following products were developed within the framework of tasks specified in the Contracts: - a Quality Manual containing the quality policy of Laboratory management system related to quality together with the quality policy declaration; - Procedures and General Instructions to ensure correct operation of the research Laboratory management system; - Model forms, cards and stipulations to ensure efficient functioning of the management system in the Laboratory; - Research Procedures for determining the activity concentration of radioactive isotopes in samples of food, environment and in urine. The procedures have been validated. They contain a description of spectrometric and radiochemical method to determine the activity concentration of radionuclides and the requirements to be satisfied by apparatus, equipment and reagents.
Quality Manual, Procedures and General Instructions as well as Research Procedures satisfy the requirements of standards PN-EN ISO/IEC 17025:2005 and PN-ISO 10012-1:1998.
Documents of the Laboratory management system (i.e. the Quality Manual as well as Procedures and General Instructions) were subject to internal audit carried out in the fourth quarter of 2008. The internal audit resulted in amendments and supplements to the management system documents.
Documents developed in the fourth quarter of 2008 (the Quality Manual as well as Procedures and General Instructions) were delivered to the Polish Accreditation Centre (PAC) with an application for accreditation and with the required forms.
To meet the requirements of PN-EN-ISO/IEC 17025:2005 standard, premises of the Laboratory, connected with research covered by accreditation, have been modernized. Premises for spectrometric and radiochemical measurements, for preparation and storage of samples were renovated. The Laboratory staff participated in accreditation-related trainings delivered by the Polish Accreditation Centre (PAC) and the Office for the Management of Quality, Environment and Occupational Safety and Health (Quality Management Office, QMO): - the head of the Laboratory participated in a training on „Internal audit in a laboratory" (QMO)

49
- a manager for quality assurance participated in a training on „Laboratory management system. Tasks of a manager for quality assurance and of technical management" (PAC) - the manager for quality assurance and a member of the Laboratory staff participated in a training on „Methods of quality assurance and measurement uncertainty assessment" (QMO) Following the PAC recommendations on participation in proficiency tests and intercomparisons (DA – 05), the Laboratory participated in 2008 in international intercalibration exercises organized by IAEA, PROCORAD and the European Commission (JRC IRMM). The intercalibration exercises were inter alia aimed at testing the activity concentration of isotopes of uranium - 234 and uranium - 238 in mineral waters as well as at identification and measurement of activity concentrations of selected artificial radionuclides in samples of soil, water and urine. Besides, the Laboratory has participated in intercalibration exercise organized by the Institute for Nuclear Chemistry and Technology, as ordered by the National Atomic Energy Agency. Tests were aimed to determine activity concentration of Cs-137 in liquid milk. The Laboratory has also declared its readiness to participate in two subsequent international intercalibration exercises organized by the International Atomic Energy Agency (IAEA), inter alia aimed to determine activity concentration of tritium, uranium - 234 and uranium - 238 as well as total alpha and beta radioactivity in water. Pursuant to the arrangements with the Polish Accreditation Centre, the PAC experts will carry out an initial inspection of the Radiochemical and Spectrometric Analyses Laboratory in the beginning of May 2009.

50
MONITORING OF RADIOACTIVE CONTAMINATION OF SURFACE WATERS AND BOTTOM SEDIMENTS
IN 2006 -2008
Z. Pietrzak-Flis, L. Rosiak, E. Starosciak, E. Chrzanowski, A. Fulara The work has been financed by the National Fund of Environmental Protection
and Water Management.
In 2008 determinations of 137Cs and 90Sr in waters, 137Cs and 239,240Pu, 238Pu in bottom sediments were performed according to the monitoring programme.
Samples of water and bottom sediments were collected two times - in spring and in autumn from two main rivers of Poland: the Vistula river with the tributaries of Bug and Narew (7 sampling points), and from the Odra river with the tributary Warta (5 sampling points). Water and bottom sediments were also collected from six lakes localized in main lake districts of the country. Water (20-l samples) from the rivers was taken from the main streams, whereas water from the lakes was taken from platforms. Bottom sediments were collected from stream beds near the shore line. At each location three sub-samples were taken at points 30 m to 50 m apart, to form the averaged sample. The total mass of such a sample was approximately 1 kg. 137Cs and 90Sr in waters and plutonium isotopes in bottom sediments was determined by radiochemical methods, whereas 137Cs in bottom sediments was determined with the gamma spectrometry method.
Average annual activity concentrations of 137Cs in water of rivers was in the range from 1.47 mBq/l in the Narew to 3.65 mBq/l in the Odra (Chałupki) and in the lakes from 1.39 mBq/l in Wigry to 6.87 mBq/l in Rogóżno. Activity concentration of 90Sr in water of rivers and lakes was distinctly higher than that of 137Cs. Average annual concentration of 90Sr in the Vistula river ranged from 2.70 mBq/l in Warsaw up to 4.09 mBq/l in Kraków Tyniec. In the lakes the range of 90Sr activity concentrations was broader, being from 1.87 mBq/l in water collected in Niesłysz up to 8.70 mBq/l in Rogóżno.
Average values of the 90Sr to 137Cs activity ratio in the Vistula river with its tributaries was equal to 1.76, being about 40% higher than that in the Odra with Warta (1.25) and in the lakes (1.22). These differences resulted from lower concentrations of 137Cs in the Vistula with tributories in comparison to the Odra with Warta river and lakes. Values of this ratio in water samples differed in a broad range, what can result from different leaching of the isotopes from soil.
Average annual concentration of 137Cs in bottom sediments of the rivers ranged from 0.82 Bq/kg in the Vistula at Płock to 40.7 Bq/kg in the Odra at Głogów. In bottom sediments of the lakes average annual concentration of 137Cs ranged from 6.10 Bq/kg in Wigry do 32.9 Bq/kg in Rogóżno. The level of this radionuclide in lakes was rather stable, though in Rogóżno lake high activity concentration of 137Cs was observed in a sample collected in spring (53.8 Bq/kg). The concentration of 137Cs in bottom sediments has been controlled systematically since 1994. In this period the concentration level of 137Cs slowly decreases.
Activity concentration of 239,240Pu in bottom sediments of the rivers was in the range of 8.02 mBq/kg in the Bug river to 86.7 mBq/kg in the Odra at Chałupki. In the lakes it was from 4,68 mBq/kg in Partęczyny to 40,8 mBq/kg in Rogóżno. The highest
51
activity concentration of 239,240Pu was observed in the Odra and Warta and the lowest in the lakes. The contribution of plutonium, which originated from the Chernobyl accident, was in the upper and middle course of the Vistula river from 21 to 48 per cent of total 239,240Pu, in the Narew river - about 35%, in the Odra river (at Głogów and Chałupki) - from about 15 to 60%, in Wigry – 56%, and in Rogóżno - from about 14 to 42%.
The results of this work show that the concentration of surface waters with 137Cs i 90Sr and of bottom sediments with 137Cs and 239,240Pu remains at low level.

52
COMPARATIVE MEASUREMENTS REGARDING CS-137 AND SR-90 ISOTOPES DETERMINATION BY BASIC UNITS PERFORMING RADIOACTIVE
CONTAMINATION MEASUREMENTS WITHIN THE FRAMEWORK OF RADIATION MONITORING OF THE COUNTRY
W. Kurowski, W. Muszyński, B. Rubel
The study financed by the National Atomic Energy Agency. (Contract No. 20/OR/2008 of 21 March 2008)
The study was aimed to perform comparative measurements regarding Cs-137 and Sr-90 isotopes determination in samples of control materials by basic units performing radioactive contamination measurements in Poland. Potatoes were used as a control material. A batch of potatoes was prepared to satisfy the following requirements:
the same variety (Hermes variety) coming from one field (field A 2/2) coming from Opole region (voivodship) (plantation - Biernacice Górne, Głubczyce
community) Calibration of gamma spectrometers (Canberra spectrometers with HPGe
detectors and Genie 2000 software) and beta measurement system (Low-level β-multicounter – Risoe, Denmark) was checked.
Calibration accuracy was also checked by means of international comparisons „Radiotoxicology Intercomparisons 2008” organized by PROCORAD, France.
Potatoes have been carefully washed and then dried. 65 potato samples were prepared (3 kg each). 6 samples were randomly collected from the prepared control samples, to determine activity concentration of Cs-137 by means of a radiochemical method. There have been also randomly selected 10 samples to determine activity concentration of Sr-90 by means of a radiochemical method.
On this basis activity concentration values have been determined as the reference values.
42 samples, covered with agro-nonwoven, were packed in carton boxes. They have been shipped via DHL to basic units performing radioactive contamination measurements within the framework of radiation monitoring of the country. 30 units performing only Cs-137 determination received one sample each and 6 units performing Cs-137 and Sr-90 determination received two samples each.
Each parcel was accompanied with blank forms to enter data regarding a given Laboratory and persons performing the measurements, information on determination methods and data on apparatus.
Results of control samples' measurements were received from 36 units. The units determined 49 activity concentrations of Cs-137 (13 units by means of two methods: spectrometry and radiochemistry).

53
All measurement results were recorded and analyzed. Measurements' results were compared to reference values. With the use of Dixon, Grubbs and t-Student tests, uncertain results were rejected and other results were subject to statistical analysis.
A number of results in the range of +25% of reference values equals 1 (2% of a total number of received). The accuracy and precision of determination results sent by the above mentioned units was assessed based on MAEA criteria. The result is acceptable if it meets both criteria. Two results satisfy this requirement. "Z" parameter was determined. Its absolute value is: Z < 2 for 12 results which means that the result does not significantly differ from the reference value. Results of comparative measurements of activity concentration of Sr-90 were analyzed. None of the results is in the limits of +25% of reference value.

54
DETERMINATION OF RADIOACTIVITY OF DRINKING WATER IN LARGE URBAN AGGLOMERATIONS
AND DOSE ASSESSMENT FROM ITS CONSUMPTION
I. Radwan, A. Fulara, A. Adamczyk, E.Chrzanowski, Z.Pietrzak-Flis The work has been performed in the contract of the Polish Atomic Agency
(Contract 23/OR/2008)
The study of tap water radioactivity was performed in large urban agglomerations of south-west and north-east regions of Poland in 2008. The 20-liter samples of water were taken from each sampling point. 137Cs and 90Sr were determined in 15 liters of the sample, whereas tritium and gross alpha and beta radioactivity were determined in the remaining 5 liters.
The results of the 137Cs and 90Sr determinations in drinking water collected in 12 cities have indicated that concentrations of these isotopes were at a low level, ranging from values below the detection limit (<0.41 mBq/l) to 3.51 0.44 mBq/l. Activity concentrations of 90Sr ranged from <0.36 mBq/l to 2.780.51 mBq/l.
The majority of water samples originated fom deep underground wells. The concentrations of 137Cs were in surface water and deep wells water similar, whereas the concentrations of 90Sr were in the deep wells water much lower than those in the surface water.
The activity concentration of gross beta radioactivity of water samples was very low, ranging from 0.06 0.01 Bq/l to 0.46 0.05 Bq/l. The activity concentration of gross alpha radioactivity was higher than detection limit only in eight samples. Tritium concentration in drinking water ranged from 0.7 Bq/l to 2.1 Bq/l.
These concentrations indicate that the waters comply with the radiological requirements of the Ordinance of the Minister of Health of March 29, 2007 (Official Journal No. 61, item 417) on the quality of water for human consumption. Ttritium concentration in drinking water should not exceed 100 Bq/l, while the total indicative dose (TID) is 0.1 mSv/y . The latter dose is not exceeded if the activity concentration of gross alpha radioactivity does not exceed 0.1 Bq/l and activity concentration of gross beta radioactivity does not exceed 1 Bq/l.
The committed effective doses from the annual intake of 137Cs with water for the 12 urban agglomerations are in the range of 0.005 Sv/y for children aged 1-10 years, to 0.013 Sv/y for adults. For annual intakes of 90Sr these doses are from 0.023 Sv/y for children aged 1-10 years and for adults, and to 0.064 Sv/y for children below 1 year. These results show that the doses from 90Sr are by a dozen times higher than those from 137Cs. These doses are negligibly low.

55
EVALUATION OF DOSES FOR STANDARD ORGANISMS CHARACTERISTIC FOR LAND AND AQUATIC ENVIRONMENT IN POLAND
Lidia Rosiak, Paweł Krajewski
The subject is a continuation of work carried on since 2003. In 2008 concentrations of Ra-226, K-40 and Cs-137 were measured in 35 samples of fresh-water fishes. The samples were collected from river Skawa (different fishes – roaches, crucian carps, carps and tenches), from the Lake – Dgal (one year old sturgeons and pikes). In 8 samples of fishes from the Zegrze Bay Ra –226 was measured. Activity concentrations of other radionuclides were measured preceding year. Fishes are on the list of reference organisms (recommended by ICRP and also in EU).Results of measurements are shown in table 1. Table 1
Place
Number of samples
Fresh weight [g]
Mean Range
min - max
Ra-226 [Bq/kg f.w.]
Mean Range
min - max
Cs-137 [Bq/kg f.w.]
Mean Range
min - max
K-40 [Bq/kg f.w.]
Mean Range
min - max
Zegrze Bay
8
194 76,6 - 272
0,10 0,03 0,28
0,54a
0,31 - 0,77
87,8a
42,0 - 125
Skawa- river Zator
21
238 113 - 586
0,12 0,05 - 0,19
0,47 0,13 - 1,08
75,7 12,0 - 133
Dgal – Lake (pikes)
8 271 144 - 377
0,10 0,02 - 0,27
0,27 0,13 - 0,37
97,0 55,0 - 159
Dgal – Lake (sturgeons)
13 279 234 - 331
0,05 0,03 - 0,06
0,23 0,07 - 0,70
36,1 10,0 - 56
TOTAL
43
245 76,6 - 586
0,09 0,02 - 0,28
0,38 0,07 - 1,08
79,0 12,0 - 159
a measurements –2007
Activity concentrations of Ra - 226 oscillated in range from 0.02 to 0,28 Bq/kg fr. wg. The highest average activity concentration of Ra-226 was observed in the samples of fishes from Skawa river, where the concentration of this radionuclide in water was the lowest and in bottom sediment were the highest from all the places the samples were taken (1.45 mBq/l and 23.4 Bq/kgdry.wg respectively).The activity concentrations of Ra-226 in pikes from Dgal Lake were, in average, two times higher than concentrations of this radionuclide in sturgeons living at the same place. In fishes from Zegrze Bay a linear correlation with the weight of fish samples was observed. The bigger fish the higher concentration of Ra - 226. Concentrations of K-40 considerably
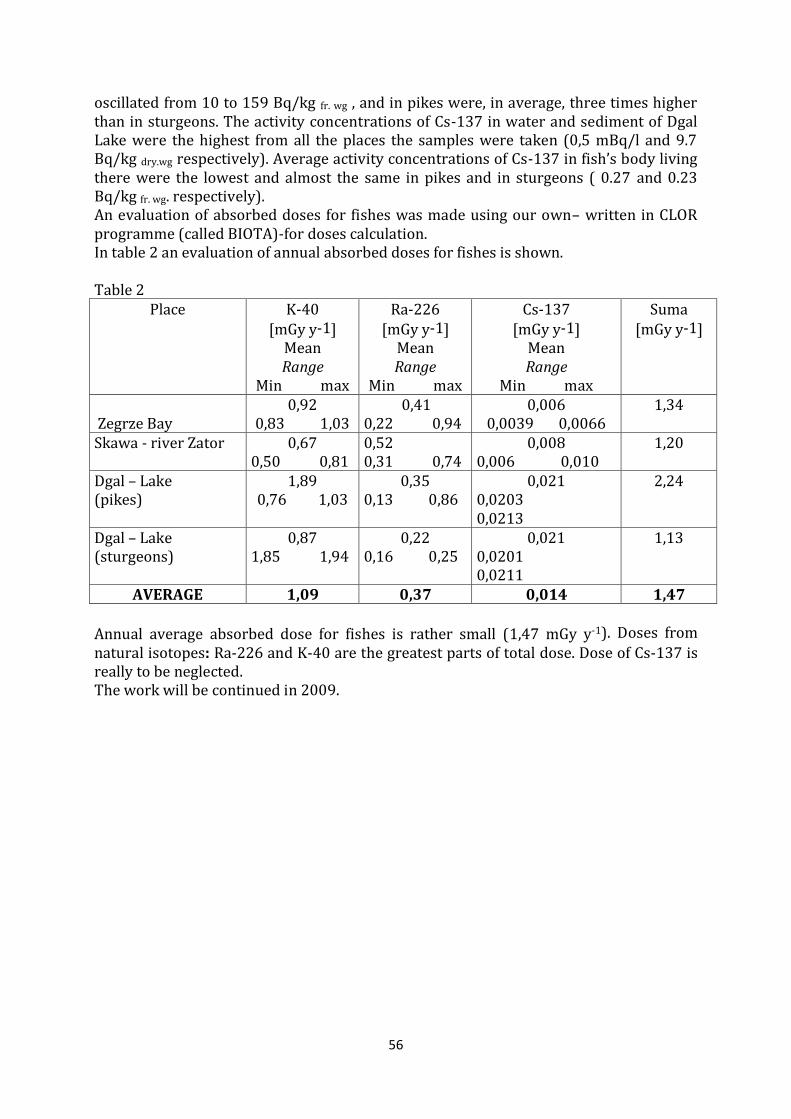
56
oscillated from 10 to 159 Bq/kg fr. wg , and in pikes were, in average, three times higher than in sturgeons. The activity concentrations of Cs-137 in water and sediment of Dgal Lake were the highest from all the places the samples were taken (0,5 mBq/l and 9.7 Bq/kg dry.wg respectively). Average activity concentrations of Cs-137 in fish’s body living there were the lowest and almost the same in pikes and in sturgeons ( 0.27 and 0.23 Bq/kg fr. wg. respectively). An evaluation of absorbed doses for fishes was made using our own– written in CLOR programme (called BIOTA)-for doses calculation. In table 2 an evaluation of annual absorbed doses for fishes is shown. Table 2
Place K-40 [mGy y-1]
Mean Range
Min max
Ra-226 [mGy y-1]
Mean Range
Min max
Cs-137 [mGy y-1]
Mean Range
Min max
Suma [mGy y-1]
Zegrze Bay
0,92 0,83 1,03
0,41 0,22 0,94
0,006 0,0039 0,0066
1,34
Skawa - river Zator 0,67 0,50 0,81
0,52 0,31 0,74
0,008 0,006 0,010
1,20
Dgal – Lake (pikes)
1,89 0,76 1,03
0,35 0,13 0,86
0,021 0,0203 0,0213
2,24
Dgal – Lake (sturgeons)
0,87 1,85 1,94
0,22 0,16 0,25
0,021 0,0201 0,0211
1,13
AVERAGE 1,09 0,37 0,014 1,47 Annual average absorbed dose for fishes is rather small (1,47 mGy y-1). Doses from
natural isotopes: Ra-226 and K-40 are the greatest parts of total dose. Dose of Cs-137 is really to be neglected. The work will be continued in 2009.

57
DETERMINATION OF URANIUM AND PLUTONIUM REFERENCE LEVELS IN MEN’S URINUM TO ESTIMATE INTERNAL CONTAMINATION
OF PERSONS HAVING CONTACT WITH FISSLE MATERIALS
Lidia Rosiak, Ewa Starościak
Uranium and plutonium are radioactive elements of special meaning. In connection with cases of illegal turnover of fissle materials and more and more frequent using of depleted uranium in military and civilian sector exists a danger of absorbing these elements by inhalation and ingestion way in case of radiation incident. This exposure concerns not only workers and services , but also people of population – inhabitants of region surrounding . Estimation of exposure could be done knowing an internal contamination. This internal exposure could be determined by the knowlage of results of measurements of uranium and plutonium activity in daily samples of urine and metabolic parameters of these elements in a human body. We could then estimate an effective dose (ICRP Publications ). The aim of this work is to adapt uranium and plutonim determination method in the same environmental sample to determine these radionuclides in daily urine samples of non-occupationally exposed people.
Daily samples of urine were taken from 9 healthy Warsaw inhabitants (5 women and 4 men), age from 22 to 59 years. These persons never worked with uranium or/and plutonium compounds.
In 1liter samples of urine Pu –238, Pu–239 and Pu–240 with Pu-242 as a tracer and U-235, U-234 and U-238 with U-232 as a tracer were determined. Radiochemical method of uranium and plutonium determination depends, at great simplification, on separation of these isotopes in chromatography column - uranium is eluated with nitric acid, thorium isotopes are eluated with concentrated hydrochloric acid, plutonium stays in the column. Plutonium from chromatography column is eluted with solution of ammonium iodide in hydrochloric acid . Uranium from eluate is extracted with the solution of tributylphosphate in kerosene then extraction from organic to aqueous phase is carried out with nitric acid first and then with distilled water. Further analysis is identical for both elements. Electro-deposition on stainless steel discs is carried out and alpha activity is measured.
This method is too little sensitive to determine activity concentration of plutonium in 1 liter urine samples. Concentration of plutonium in all 9 samples was below detection limit -0.2 mBq/l.
It was also impossible with this method to determine activity concentration of U-235 in 1 l samples. In all cases activity concentration of U-235 was below the limit of detection - 0.5 mBq/l.
Activity concentration of U-234 in urine samples oscillated in range 8.87±0.95 – 15.40±2.60 mBq/l ( average:12.0±2.6 mBq/l), and activity concentration of U-238 in range 5.28±0.93 – 10.3±1.7 mBq/l (average: 7.00±1.57 mBq/l). An average volume of daily urine sample was 1.79 l, so average daily U-234 excretion with urine could be determined as 20.0±7.2 mBq/d, and U-238 12.0±3.2 mBq/d. Daily excretion with urine both of determined isotopes was lower for women than for men. In case of men not very high correlation of daily excreted uranium with age of a person was observed.

58
The fallowing assumptions were made to calculate annual effective dose from chronic ingestion results of daily uranium excretion with urine:
Uranium absorbed to blood from gastrointestinal tract is close to equilibrium with uranium level in the human body
The whole uranium from the body is excreted through the renal system fU =1 Daily excretion of uranium with urine is proportional to its concentration in the
body f1 =2% for all components of the diet DCF intake by ingestion:
for 234U =4.9x10⁻⁸ Sv/Bq
for 238U =4.5x10⁻⁸ Sv/Bq Calculated average daily and annual U-234 i U-238 intakes were 20.0 mBq/d and
7.3 Bq/y and 12.0mBq/d and 4.45 Bq/y respectively. Prof Z. Pietrzak_Flis and her team calculated uranium intakes with food and drinking water (for Central Poland – 8.08 Bq/y ). In this work estimated intake was about two times lower.
Average effective doses were, for U-234 - 0.36 µSv/y and for U-238 – 0.20 µSv/y. So the total from uranium is 0.56 µSv/y. This dose is 0.2% of annual dose from natural environment.
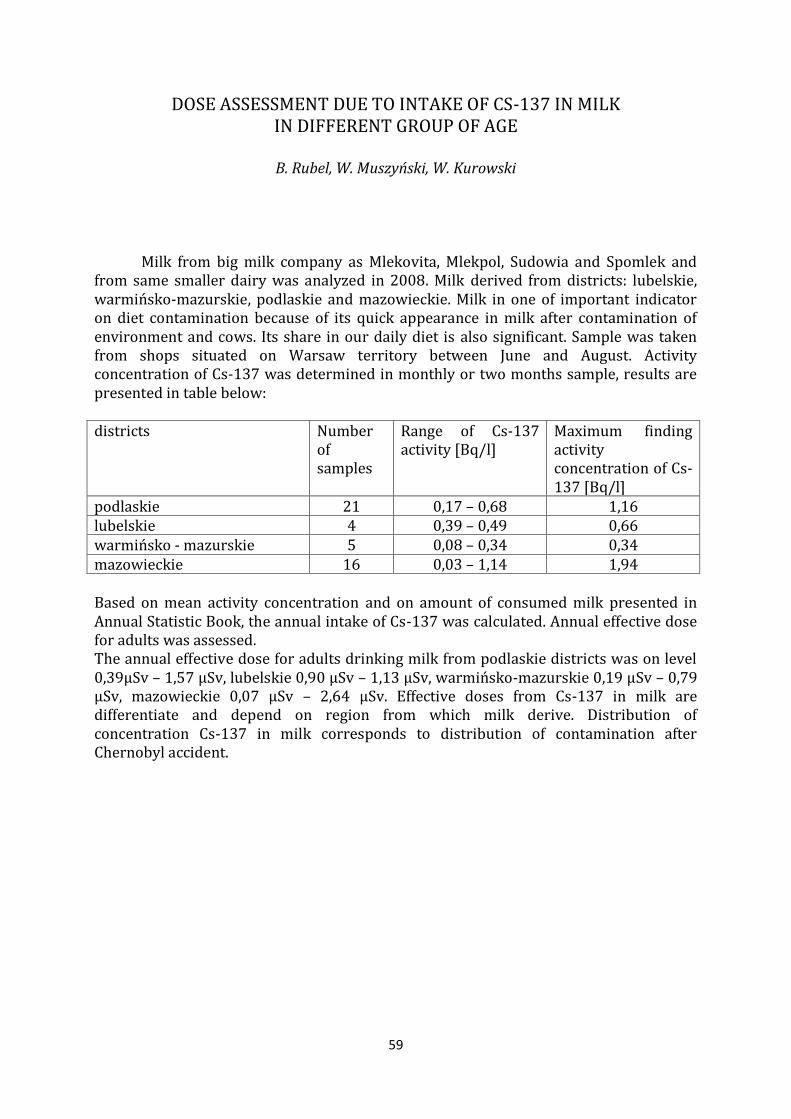
59
DOSE ASSESSMENT DUE TO INTAKE OF CS-137 IN MILK IN DIFFERENT GROUP OF AGE
B. Rubel, W. Muszyński, W. Kurowski
Milk from big milk company as Mlekovita, Mlekpol, Sudowia and Spomlek and from same smaller dairy was analyzed in 2008. Milk derived from districts: lubelskie, warmińsko-mazurskie, podlaskie and mazowieckie. Milk in one of important indicator on diet contamination because of its quick appearance in milk after contamination of environment and cows. Its share in our daily diet is also significant. Sample was taken from shops situated on Warsaw territory between June and August. Activity concentration of Cs-137 was determined in monthly or two months sample, results are presented in table below:
districts Number
of samples
Range of Cs-137 activity [Bq/l]
Maximum finding activity concentration of Cs-137 [Bq/l]
podlaskie 21 0,17 – 0,68 1,16 lubelskie 4 0,39 – 0,49 0,66 warmińsko - mazurskie 5 0,08 – 0,34 0,34 mazowieckie 16 0,03 – 1,14 1,94
Based on mean activity concentration and on amount of consumed milk presented in Annual Statistic Book, the annual intake of Cs-137 was calculated. Annual effective dose for adults was assessed. The annual effective dose for adults drinking milk from podlaskie districts was on level 0,39µSv – 1,57 µSv, lubelskie 0,90 µSv – 1,13 µSv, warmińsko-mazurskie 0,19 µSv – 0,79 µSv, mazowieckie 0,07 µSv – 2,64 µSv. Effective doses from Cs-137 in milk are differentiate and depend on region from which milk derive. Distribution of concentration Cs-137 in milk corresponds to distribution of contamination after Chernobyl accident.
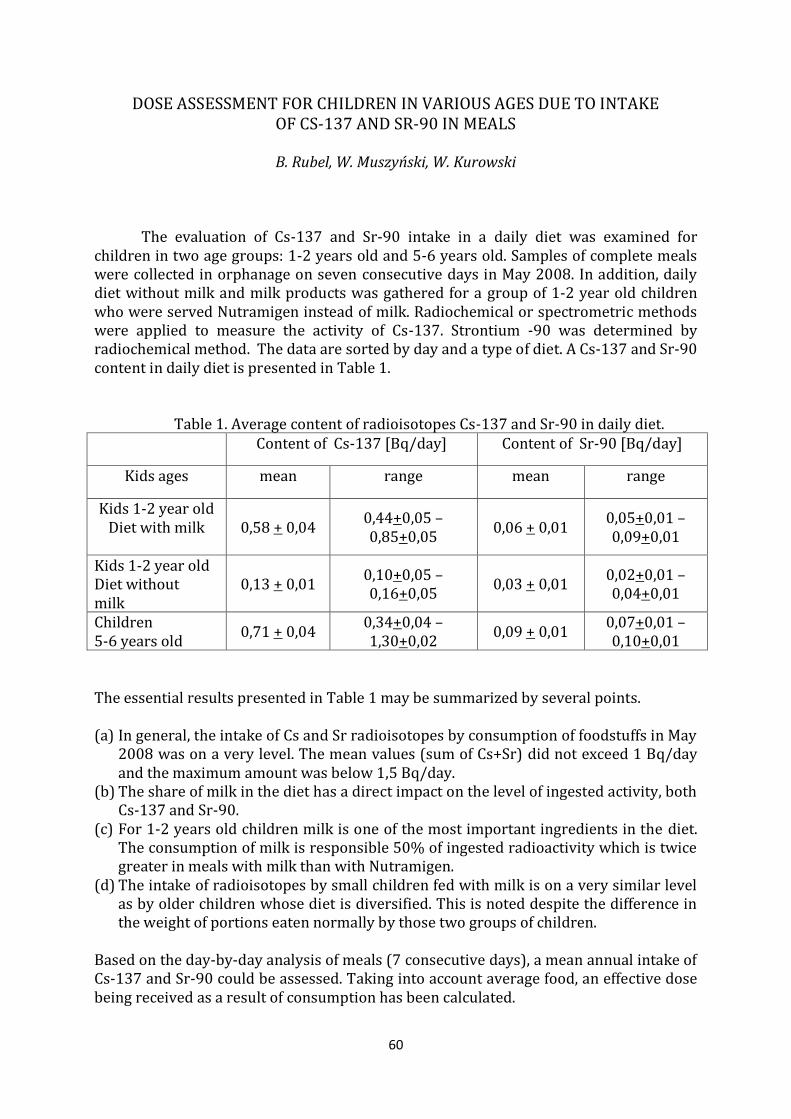
60
DOSE ASSESSMENT FOR CHILDREN IN VARIOUS AGES DUE TO INTAKE OF CS-137 AND SR-90 IN MEALS
B. Rubel, W. Muszyński, W. Kurowski
The evaluation of Cs-137 and Sr-90 intake in a daily diet was examined for children in two age groups: 1-2 years old and 5-6 years old. Samples of complete meals were collected in orphanage on seven consecutive days in May 2008. In addition, daily diet without milk and milk products was gathered for a group of 1-2 year old children who were served Nutramigen instead of milk. Radiochemical or spectrometric methods were applied to measure the activity of Cs-137. Strontium -90 was determined by radiochemical method. The data are sorted by day and a type of diet. A Cs-137 and Sr-90 content in daily diet is presented in Table 1.
Table 1. Average content of radioisotopes Cs-137 and Sr-90 in daily diet. Content of Cs-137 [Bq/day] Content of Sr-90 [Bq/day]
Kids ages mean range mean range
Kids 1-2 year old Diet with milk
0,58 + 0,04
0,44+0,05 – 0,85+0,05
0,06 + 0,01 0,05+0,01 – 0,09+0,01
Kids 1-2 year old Diet without milk
0,13 + 0,01 0,10+0,05 – 0,16+0,05
0,03 + 0,01 0,02+0,01 – 0,04+0,01
Children 5-6 years old
0,71 + 0,04 0,34+0,04 – 1,30+0,02
0,09 + 0,01 0,07+0,01 – 0,10+0,01
The essential results presented in Table 1 may be summarized by several points. (a) In general, the intake of Cs and Sr radioisotopes by consumption of foodstuffs in May
2008 was on a very level. The mean values (sum of Cs+Sr) did not exceed 1 Bq/day and the maximum amount was below 1,5 Bq/day.
(b) The share of milk in the diet has a direct impact on the level of ingested activity, both Cs-137 and Sr-90.
(c) For 1-2 years old children milk is one of the most important ingredients in the diet. The consumption of milk is responsible 50% of ingested radioactivity which is twice greater in meals with milk than with Nutramigen.
(d) The intake of radioisotopes by small children fed with milk is on a very similar level as by older children whose diet is diversified. This is noted despite the difference in the weight of portions eaten normally by those two groups of children.
Based on the day-by-day analysis of meals (7 consecutive days), a mean annual intake of Cs-137 and Sr-90 could be assessed. Taking into account average food, an effective dose being received as a result of consumption has been calculated.

61
The results are shown in Table below:
Intake of Cs-137 in with
annual diet[Bq/y]
Dose from Cs-137
[µSv/y]
Intake of of Sr-90 in with
annual diet [Bq/y]
Dose from Sr-90
[µSv/y]
Kids 1-2 years old Diet with milk
212 2,5 21.9 1,6
Kids 1-2 years old Diet without milk
47,5 0,6 10,9 0,8
Kids 5-6 years old 259 2,5 32,9 1,6
The lowest effective doses have been received by 1-2 years old children on a
milk-free diet, i.e. Nutramigen: 0,6 and 0,8 µSv/y for Cs-137 and Sr-90, respectively. The dose related to Cs-137 received by other small children (2.5 µSv/y) has been the same as for the group of 5-6 years old pupils (2,5 µSv/y).
In summary, it should be stressed that for both groups of children the effective dose received as a results of consumption has been on a very low level.

62
MONITORING OF RADIOACTIVE CONTAMINATION OF THE BALTIC SEA IN 2008
Maria Suplińska, Adam Adamczyk Studies on Baltic Sea environment coordinated by Helsinki Commission are carried
out by all Baltic States. Central Laboratory for Radiological Protection performs regular observations on radionuclides in two sea components: bottom sediments and biota (fish). The activity concentrations of 137Cs and 226Ra were determined in all samples, whereas the activity concentrations of 238Pu,239,240Pu, 90Sr, in chosen sediment samples. In addition to sea water monitoring program performed by Institute of Meteorology and Water Management, 226Ra in sea water samples was also determined. Data on radioactive contamination from Polish economic zone are transferred to the Data Bank of Helsinki Commission. Bottom sediments
Bottom sediment samples were taken from Gdansk Basin and Bornholm Basin. In 2008 deposition of 137Cs varied from 4.74±0.33 kBq m-2 in the Gulf of Gdansk to 1.54±0.24 kBq m-2 in the Bornholm Basin. The highest 137Cs activity concentrations were found in the upper sediment layers. In the Gulf of Gdansk, 137Cs activity concentrations in the layer from 0 to 5 cm were in range from 198 Bq kg-1 to 294 Bq kg-1, and in the Bornholm Basin in the range of 62.6-83.2 Bq kg-1.
In 2008 plutonium determinations were performed in two sampling stations: P-116 (Gulf of Gdansk) and P-5 (Bornholm Basin). The deposition of 239,240Pu were: 123±4.2 Bq m-2 and 54.2±2.8 Bq m-2, respectively. In the Gulf of Gdansk, 239,240Pu activity concentration in the deeper layer (11-13 cm) was 6.02 Bq kg-1. In the Bornholm Basin 239,240Pu activity concentrations were similar along the sediment profile with the average value of 1.09±0.31 Bq kg-1. Activity concentrations of 238Pu in analyzed layers ranged from 14 mBq kg-1 to 202 mBq kg-1, and the activity ratios of 238Pu to 239,240Pu were in the range of 0.02-0.05 – similar to the ratio of global fallout.
Activity concentration of 90Sr determined in the core samples (0-19cm) ranged from 2.13±0.14 Bq kg-1 to 4.67±0.20 Bq kg-1, and the differences in 90Sr concentration has not dependent on location. Deposition of 90Sr was similar in the Southern Baltic Sea region and ranged from 0.15 kBq m-2 to 0.23 kBq m-2.
Activity concentration of 226Ra in the bottom sediments depended of sampling place, being similar along the sediment profile. In the Gulf of Gdansk (P-110) the average activity concentration of 226Ra was 26.0±0.61 Bq kg-1, and in the Bornholm Deep (P-5) 46.8±1.54 Bq kg-1. Fish
Determination of activity concentrations of 137Cs, 226Ra and 40K were determined in four fish species: herring, sprat, cod and plaice. The average activity concentration of 137Cs in fish flesh in 2008 was equal to 5.57±1.01 Bq kg-1fw. The highest concentration was found in flesh of cod (7.09±0.84 Bqkg-1fw) and was about 30% higher than in
remaining fish species (5.07±0.05 Bqkg-1fw). Activity concentration of 137Cs in the Baltic
sea fish decreased exponentially with time since 1990. The calculated effective half

63
times for a decrease of 137Cs in fish (Teff ) is about 14.3 years. Activity concentration of 226Ra in fish flesh ranged from 29 mBqkg-1 (plaice) to 58 mBqkg-1 (cod). Water
Activity concentrations of 226Ra in sea water were similar in sub-regions of Southern Baltic Sea. The average activity concentration of 226Ra in 2008 was equal to 3.33 ±0.22 Bqm-3. The average activity concentration of 137Cs (calculated for six surface water samples) was 41.3 ± 5.3 Bqm-3, and the average activity concentration of 40K - 2714±106 Bqm-3

64
STUDIES ON THE VERTICAL DISTRIBUTION OF RADIOACTIVE ISOTOPES IN
BALTIC SEA BOTTOM SEDIMENTS AND ESTIMATION OF CONTAMINATION
SOURCES
ESTIMATION OF SEDIMENTATION RATES IN THE SOUTHERN BALTIC SEA REGION
Maria Suplińska, Zofia Pietrzak Flis
The purpose of this study was to determine sedimentation rate in the Southern Baltic Sea basing on vertical distribution of 210Pb in the bottom sediments. Sedimentation rate was determined as: (1) sediment accumulation rates (SAR) [g m-2 rok-1] and (2) annual accumulation layer (AAL) [mm rok-1]. Sedimentation rates and dating of bottom sediments were estimated in two sampling stations of the Gulf of Gdańsk and in four stations in the open sea area. Estimations were based on vertical distributions of unsupported 210Pb, 137Cs and 239,240Pu activity concentrations in sediment core samples taken in 1998–2007.
Two dating models based on changes of activity concentrations of 210Pbunsup were used: 1) CF:CS (Constant Flux Constant Sedimentation rate-model) and 2) CRS (Constant Rate of Supply-model). The validation of the 210Pb methods was performed by activity peak of 137Cs and 239,240Pu, applied as time markers. 137Cs originates mostly from the Chernobyl accident in 1986, whereas 239,240Pu comes from the global fallout in 1963.
Activity concentrations of 210Pb differed in the studied locations of sampling stations, being the highest in the Gulf of Gdańsk and the lowest in the Bornholm Basin. Sedimentation rates (SAR and AAL) calculated from the vertical distribution of unsupported 210Pb differ in subregions. In the Gulf of Gdańsk they are higher than those in the open sea what can result from the transport of organic and inorganic particles with the Vistula river water.
Sediment accumulation rate (g cm–2 yr–1) was constant along sediment core. Annually accumulated layer, (mm yr–1) decreased with sediment depth in all the locations. In the Gulf of Gdańsk sedimentation rate in the upper layer was about 3.6 mm yr–1, and it decreased in the deeper layers to about 1.1 mm yr–1. Sedimentation rates in the open sea area were lower than in the gulf region and the lowest was observed in the Bornholm Deep, being about 0.95 mm yr–1 in the upper layer and 0.35 mm yr–1 in the deeper layer.
AAL and SAR estimated by the means of the CF:CS model were on average about 20% higher than those from the CRS model. This small difference indicates that both the models are comparable. Validation of the models based on unsupported 210Pb using of 239,240Pu and 137Cs time markers confirm reliability of the estimated SAR and AAL values.
The results of this study indicate that the process of the formation of bottom sediments in the open sea is much slower than that in the gulf areas. The growth of a 5 cm thick layer took 27–37 years in the Gulf of Gdańsk, and 61–105 years in the open sea area.

65
SCIENTIFIC AND TECHNICAL
REPORTS
2008
DOSIMETRY DEPARTMENT

66
ACCREDITATION OF THE RESEARCH LABORATORY – NATURAL RADIOACTIVITY LABORATORY OF THE DOSIMETRY DEPARTMENT
OF CLOR IN THE SCOPE OF THE INVESTIGATION OF THE NATRURAL RADIOACTIVITY IN RAW AND BUILDING MATERIALS
The research activities performed by the Laboratory are based upon two documents.
The basic legal act determining the requirements for raw and building materials is the Ordinance of the Council of Ministers of 2 January 2007 “on the requirements for the content of natural radioactive isotopes of potassium K-40, radium Ra-226 and thorium Th-228 in raw and building materials used in buildings for the residence of people and livestock, as well as in the industrial by-products used in the construction, and the control of the content of the aforementioned isotopes” (Law Gazette no 4/2007 pos.29).
The second document is the methodology of the investigation of raw and building materials described in the Instruction 234/2003 by the Building Research Institute (ITB) entitled “The Investigations of the Natural Radioactivity of Raws and Building Materials”. The instruction contains the procedures connected to the protection against the ionizing radiation from the sources of natural radioactive isotopes present in raw materials and mineral industrial wastes used during the production of building materials and products. Moreover, the instruction presents the assortment of the controlled raw materials and industrial mineral wastes used in the construction industry, as well as offered building materials and products subject to the investigation, basic requirements, the methods of determination of the natural radioactivity concentration and the rules for the interpretation of the results and their conformity with the fixed requirements.
The Laboratory acquired the documentation of the norms in force in Poland applicable for its investigative activities. Two standards on sampling and preparation of the cement and aggregate samples has been purchased in 2008:
1. PN-EN 196-7-1997 – on cements, 2. PN-EN 932-1-1999 – on aggregates.
The basic task of the Natural Radioactivity Laboratory in 2008 was to conform the documentation of the management system to the current standards. The Laboratory performed the design studies on the accreditation process of the research laboratory. The subject of the studies was the quality manual and research procedures.
In order to improve and update the laboratory management system, the task was started with the normative documents on accreditation in force, such as:
- Polish and international standards ; - Polish and European legal regulations; - Operation codes.
The reference for the detailed design studies was the standard PN-EN-ISO/IEC 17025:2005 „General requirements on the competence of the research and reference laboratories”. The new documentation was prepared according to the standard and
Alfred ŻAK

67
basing upon the current documentation of the management system of the laboratory. The following documents underwent thorough analysis and amendments:
- Quality manual; - General instruction - documenting of the procedures and general
instructions; - General instruction – elaboration and implementation of the management
system; - Procedures and technical instruction manual; - Calibration manual; - Comparative research manual.
Besides the system documentation, the activities on the preparation and collecting the documentation required for the accreditation were continued:
- Personnel authorization cards, - Authorizations for calibrations and volume reference source preparation, - Personal documents,
The example calibration sheets for elaborating of the reference source measurements has been prepared as well.
Within the framework of the preparation for accreditation the survey of all the rooms in the laboratory was conducted, and the rooms were modernized according to the requirements of the management system.
The dryer and the set of drying trays for the samples were purchased for use in the sample preparation room. The dryer was installed and operated in the technical room.
All scales used in the laboratory have been legalized.
The training schedule on the details of the research methods affecting the correct results of the measurements for the personnel was realized. The internal training was conducted for full scope of the performed investigations, i.e.:
- principle of the equipment, - construction and adjustment of the spectrometric equipment, - performing full calibration of the measurement equipment, - preparation of samples and performing the measurement, - principle of weekly measurements of reference sources and control samples, - evaluation of the measurement, - calculation of the activity coefficient f1,
- preparation of the investigation report.
Two internal audits were performed in 2008. basing upon the found inconsistencies the management system was improved by implementing the relevant changes in handling of the samples. The corrective and preventive activities were reflected in the relevant documentation.
In IV- th quarter of 2008, after preparing all details on the management system needed for application for the accreditation audit from the PCA, all the documentation was provided to the PCA. Thus, the Laboratory started the process of the accreditation and waited for setting the PCA’s accreditation audit date.
The goals for the Natural Radioactivity Laboratory for 2008 on the activities connected with the management system were fully realized.

68
ANALYSIS AND EVALUATION OF THE ACTIVITY OF RAW AND BUILDING MATERIALS USED IN POLAND IN YEARS 1980-2007
A. Żak, J. Rychlicki, M. Kuczbajska, A. Ząbek
The systematic investigation of the natural radioactivity of raw and building materials has been carried out in Poland since 1980.
In 2007 the unified method for the natural radioactivity measurements and relatively simple, cheap and reliable instrumentation for the Laboratories performing such measurements were approved for use and in the Ministry of Infrastructure (former Ministry of Construction) and the Ministry of Industry (former Ministry of Energy) in elaborated in the Central Laboratory for Radiological Protection (CLOR) in cooperation with the Building Research Institute (ITB). The subject of the instruction are procedures connected with the ionizing radiation protection from the natural radioisotopes contained in the raw and industrial wastes of mineral origin used for the production of building materials and products. Moreover, the instruction shows the assortment of the controlled natural raw and industrial wastes of mineral origin used in the construction industry, and the offered materials and construction products subject to the control, basic requirements, methods of the measurements of the natural radioisotope concentration, and the rules for the interpretation of the results of the measurements and the evaluation of the conformity with the requirements.
The Dosimetry Department of CLOR carried out the training for the personnel of the newly organized laboratories, supervised the correctness of their procedures and the credibility of the achieved results.
In 2007 the materials for the course “Training of the personnel performing natural radioactivity of raw and building materials” were prepared (81 pages + 15-page addendum). The materials contain the basic information on:
- natural radioactivity in the environment and basic rules on the radiation protection of public;
- legal regulations, specifically on the natural radioactivity of raw materials and materials used in the construction industry;
- approved uniform method of measurements – its pros and contras; - idea and construction of the measuring devices; - preparation of the samples for the measurements and programming the
measurement cycle; - method for checking of the correctness of the measurement cycle and the
credibility of the obtained results; - method of the evaluation of the obtained results against the regulations in force. Furthermore, the method of the regulation and calibration of the equipment and the
practical methods for checking of the correctness of the calculated values of the calibration coefficients were described.
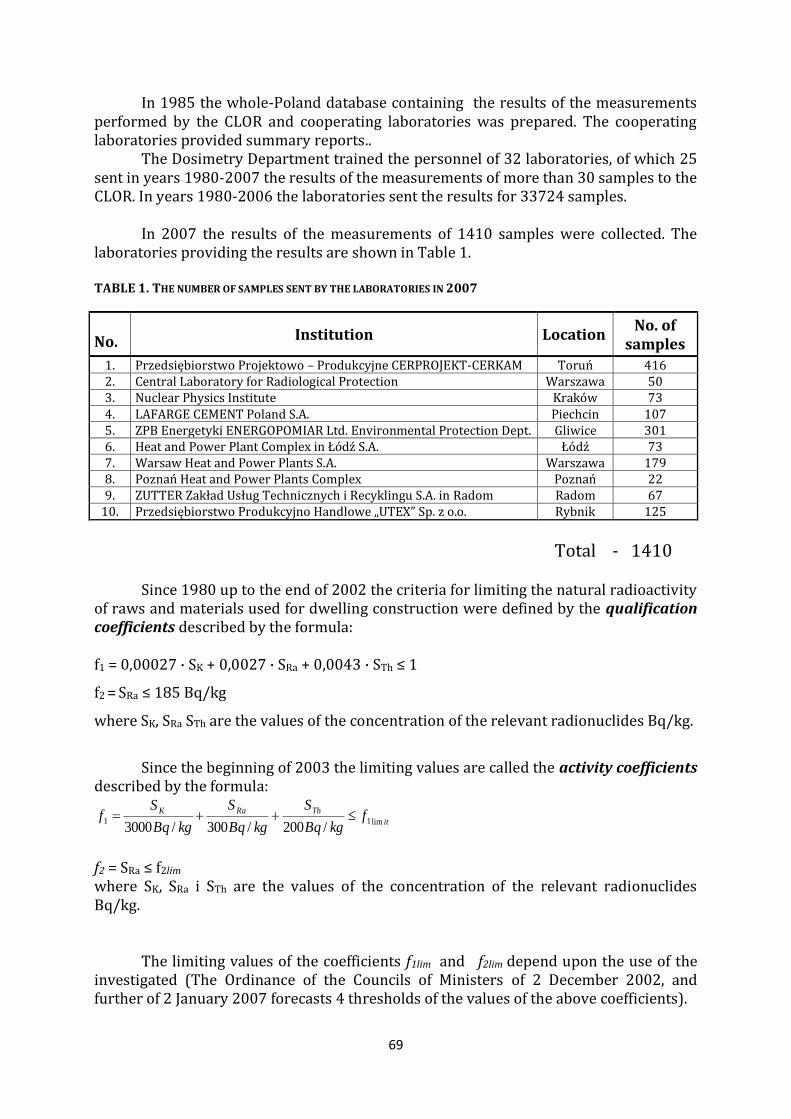
69
In 1985 the whole-Poland database containing the results of the measurements performed by the CLOR and cooperating laboratories was prepared. The cooperating laboratories provided summary reports..
The Dosimetry Department trained the personnel of 32 laboratories, of which 25 sent in years 1980-2007 the results of the measurements of more than 30 samples to the CLOR. In years 1980-2006 the laboratories sent the results for 33724 samples.
In 2007 the results of the measurements of 1410 samples were collected. The laboratories providing the results are shown in Table 1.
TABLE 1. THE NUMBER OF SAMPLES SENT BY THE LABORATORIES IN 2007
No. Institution Location
No. of samples
1. Przedsiębiorstwo Projektowo – Produkcyjne CERPROJEKT-CERKAM Toruń 416 2. Central Laboratory for Radiological Protection Warszawa 50 3. Nuclear Physics Institute Kraków 73 4. LAFARGE CEMENT Poland S.A. Piechcin 107 5. ZPB Energetyki ENERGOPOMIAR Ltd. Environmental Protection Dept. Gliwice 301 6. Heat and Power Plant Complex in Łódź S.A. Łódź 73 7. Warsaw Heat and Power Plants S.A. Warszawa 179 8. Poznań Heat and Power Plants Complex Poznań 22 9. ZUTTER Zakład Usług Technicznych i Recyklingu S.A. in Radom Radom 67
10. Przedsiębiorstwo Produkcyjno Handlowe „UTEX” Sp. z o.o. Rybnik 125
Total - 1410 Since 1980 up to the end of 2002 the criteria for limiting the natural radioactivity
of raws and materials used for dwelling construction were defined by the qualification coefficients described by the formula: f1 = 0,00027 · SK + 0,0027 · SRa + 0,0043 · STh ≤ 1
f2 = SRa ≤ 185 Bq/kg
where SK, SRa STh are the values of the concentration of the relevant radionuclides Bq/kg.
Since the beginning of 2003 the limiting values are called the activity coefficients
described by the formula:
it
ThRaK fkgBq
S
kgBq
S
kgBq
Sf
lim11/200/300/3000
f2 = SRa ≤ f2lim where SK, SRa i STh are the values of the concentration of the relevant radionuclides Bq/kg.
The limiting values of the coefficients f1lim and f2lim depend upon the use of the
investigated (The Ordinance of the Councils of Ministers of 2 December 2002, and further of 2 January 2007 forecasts 4 thresholds of the values of the above coefficients).

70
The change of the definition of f1 caused the necessity of starting the second set of the results in the database in 2003.
In 2007 the old database (dBase 3+) was replaced by the modern database running under MS-SQL. In the frame of the preparation to transfer the data to the new database the values of the qualification coefficients f1 for 26327 samples collected by the end of 2002 were replaced by the calculated values of the activity coefficients f1.
To avoid the loss of the values of the qualification coefficients f1 they were transferred to the column F11 added at the end of the table of the main data set.
The creation of the new main data set containing the results of measurements of 33724 samples for years 1980-2006 allowed to prepare the histograms of the values of the activity coefficients f1 and f2 for the chosen raw, and to visualize the trend of the average annual values of the coefficients for the entire period from 1980 to 2006.
The above main data set together with the auxiliary sets were transferred to the MS-SQL database and at the moment the database is reviewed and corrected. The average annual trends of the activity coefficients f1 and f2 for the ready-materials allow to evaluate the temporal changes of the population exposure to the ionizing radiation in the dwellings, and the investigation of changes of the coefficients for the wastes allows to evaluate the sources of the changes.
The information collected in the database allow also to identify the materials containing significant quantities of natural radioisotope concentration e.g. potassium fertilizers, some materials used in the industry, or some types of abrasives. The concentration of the natural radioisotopes and the values of the activity coefficients f1 and f2 in the selected raw and building materials measures in 2003-2007 are presented in table 2.
Other important activities of the Laboratory in the Dosimetry Department in
2007:
1. The evaluation of the exposure to the ionizing radiation of the personnel in the Flight Control Centers PAŻP basing upon the results of the measurements performed in 11 airports in Poland (190 measurements performed at the equipment and on workplaces).
2. Analysis of the exposure to the ionizing radiation of the personnel
working on the airport radar systems in Zabierzów n/Kraków, Pułtusk and in Warszawa.
3. Performing the measurements and exposure analysis for the workers
of the Inowrocław Salt Mining „Solino”, Mine in Mogilno. TABLE 2. THE CONCENTRATIONS OF THE NATURAL RADIONUCLIDES AND THE VALUES OF THE ACTIVITY COEFFICIENTS
F1 AND F24 IN THE SELECTED RAW AND BUILDING MATERIALS MEASURED IN YEARS 2003-2007
4 Since 1.01.2003 the activity coefficients for evaluation of raw and materials used in construction are determined by formula:
f1 = SK/3000 + SRa/300 + STh/200
f2 = SRa
Both coefficients are in Bq/kg.
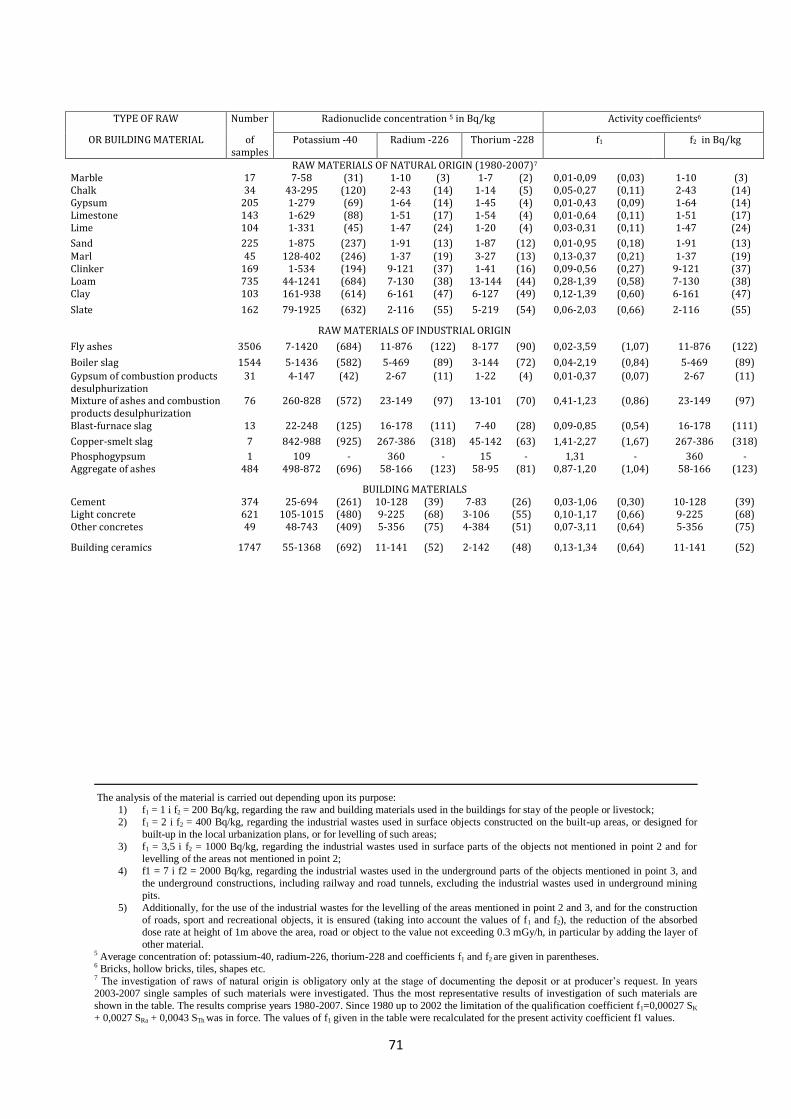
71
TYPE OF RAW Number Radionuclide concentration 5 in Bq/kg Activity coefficients6
OR BUILDING MATERIAL of samples
Potassium -40 Radium -226 Thorium -228 f1 f2 in Bq/kg
RAW MATERIALS OF NATURAL ORIGIN (1980-2007)7 Marble 17 7-58 (31) 1-10 (3) 1-7 (2) 0,01-0,09 (0,03) 1-10 (3) Chalk 34 43-295 (120) 2-43 (14) 1-14 (5) 0,05-0,27 (0,11) 2-43 (14) Gypsum 205 1-279 (69) 1-64 (14) 1-45 (4) 0,01-0,43 (0,09) 1-64 (14) Limestone 143 1-629 (88) 1-51 (17) 1-54 (4) 0,01-0,64 (0,11) 1-51 (17) Lime 104 1-331 (45) 1-47 (24) 1-20 (4) 0,03-0,31 (0,11) 1-47 (24)
Sand 225 1-875 (237) 1-91 (13) 1-87 (12) 0,01-0,95 (0,18) 1-91 (13) Marl 45 128-402 (246) 1-37 (19) 3-27 (13) 0,13-0,37 (0,21) 1-37 (19) Clinker 169 1-534 (194) 9-121 (37) 1-41 (16) 0,09-0,56 (0,27) 9-121 (37) Loam 735 44-1241 (684) 7-130 (38) 13-144 (44) 0,28-1,39 (0,58) 7-130 (38) Clay 103 161-938 (614) 6-161 (47) 6-127 (49) 0,12-1,39 (0,60) 6-161 (47)
Slate 162 79-1925 (632) 2-116 (55) 5-219 (54) 0,06-2,03 (0,66) 2-116 (55)
RAW MATERIALS OF INDUSTRIAL ORIGIN
Fly ashes 3506 7-1420 (684) 11-876 (122) 8-177 (90) 0,02-3,59 (1,07) 11-876 (122)
Boiler slag 1544 5-1436 (582) 5-469 (89) 3-144 (72) 0,04-2,19 (0,84) 5-469 (89)
Gypsum of combustion products desulphurization
31 4-147 (42) 2-67 (11) 1-22 (4) 0,01-0,37 (0,07) 2-67 (11)
Mixture of ashes and combustion products desulphurization
76 260-828 (572) 23-149 (97) 13-101 (70) 0,41-1,23 (0,86) 23-149 (97)
Blast-furnace slag 13 22-248 (125) 16-178 (111) 7-40 (28) 0,09-0,85 (0,54) 16-178 (111)
Copper-smelt slag 7 842-988 (925) 267-386 (318) 45-142 (63) 1,41-2,27 (1,67) 267-386 (318)
Phosphogypsum 1 109 - 360 - 15 - 1,31 - 360 - Aggregate of ashes 484 498-872 (696) 58-166 (123) 58-95 (81) 0,87-1,20 (1,04) 58-166 (123)
BUILDING MATERIALS Cement 374 25-694 (261) 10-128 (39) 7-83 (26) 0,03-1,06 (0,30) 10-128 (39) Light concrete 621 105-1015 (480) 9-225 (68) 3-106 (55) 0,10-1,17 (0,66) 9-225 (68) Other concretes 49 48-743 (409) 5-356 (75) 4-384 (51) 0,07-3,11 (0,64) 5-356 (75)
Building ceramics 1747 55-1368 (692) 11-141 (52) 2-142 (48) 0,13-1,34 (0,64) 11-141 (52)
The analysis of the material is carried out depending upon its purpose:
1) f1 = 1 i f2 = 200 Bq/kg, regarding the raw and building materials used in the buildings for stay of the people or livestock;
2) f1 = 2 i f2 = 400 Bq/kg, regarding the industrial wastes used in surface objects constructed on the built-up areas, or designed for
built-up in the local urbanization plans, or for levelling of such areas;
3) f1 = 3,5 i f2 = 1000 Bq/kg, regarding the industrial wastes used in surface parts of the objects not mentioned in point 2 and for
levelling of the areas not mentioned in point 2;
4) f1 = 7 i f2 = 2000 Bq/kg, regarding the industrial wastes used in the underground parts of the objects mentioned in point 3, and
the underground constructions, including railway and road tunnels, excluding the industrial wastes used in underground mining
pits.
5) Additionally, for the use of the industrial wastes for the levelling of the areas mentioned in point 2 and 3, and for the construction
of roads, sport and recreational objects, it is ensured (taking into account the values of f1 and f2), the reduction of the absorbed
dose rate at height of 1m above the area, road or object to the value not exceeding 0.3 mGy/h, in particular by adding the layer of
other material. 5 Average concentration of: potassium-40, radium-226, thorium-228 and coefficients f1 and f2 are given in parentheses. 6 Bricks, hollow bricks, tiles, shapes etc. 7 The investigation of raws of natural origin is obligatory only at the stage of documenting the deposit or at producer’s request. In years
2003-2007 single samples of such materials were investigated. Thus the most representative results of investigation of such materials are
shown in the table. The results comprise years 1980-2007. Since 1980 up to 2002 the limitation of the qualification coefficient f1=0,00027 SK
+ 0,0027 SRa + 0,0043 STh was in force. The values of f1 given in the table were recalculated for the present activity coefficient f1 values.

72
SCIENTIFIC AND TECHNICAL
REPORTS
2008
TRAINING & INFORMATION
DEPARTMENT
toron 3,2% 0,101 mSv
radon 1,201 mSv
promieniowanie gamma 0,462 mSv
wewnętrzne 0,277 mSv
promieniowanie kosmiczne 0,284 mSv
diagnostyka medyczna 26,6% 0,850 mSv
14,
27,
37,
8 8,

73
TRAINING, INFORMATION AND STANDARDIZATION
Janusz Henschke, Maria Zielonka
Central Laboratory for Radiological Protection serves as a center for training in radiation protection, Scientific and Technical Information Center and as the Secretariat of the Committee for the Radiological Protection Standardization. RADIATION PROTECTION TRAINING
CLOR organizes systematic training of persons who intend to gain qualifications needed for work with ionizing radiation. For this aim in 2008 were organized courses for radiation protection inspectors (authorizations type IOR-0, IOR-1 and IOR-3), for operators of accelerators used for other than medical purposes (A-A type), for operators of accelerators used for medical purposes and of teletherapy equipment (S-A type) and for operators of equipment for brachytherapy with radioactive sources (S-Z type). The numbers of authorizations given in 2008 are shown in Table 1.
Table 1. Number of persons trained in 2008
Type IOR-0, IOR-1 and IOR-3 A-A, S-A and S-Z together Number of
authorizations 130 57 187
SCIENTIFIC AND TECHNICAL INFORMATION CENTRE
The Center of Information is involved in publication of scientific reports, guides, training materials, popular papers on radiation protection, and in exchange of materials between information centers in Poland and abroad. The Center library contains 5792 volumes. The library is a subscriber of 12 journals. In 2008 the Scientific and Technical Information Centre of CLOR provided about 2000 consultations and information for mass media, governmental, municipal, scientific and private institutions, and for members of public. SECRETARIAT OF THE COMMITTEE FOR RADIOLOGICAL PROTECTION STANDARDIZATION
In 2008 the Secretariat of the Committee for Radiological Protection Standardization prepared for publication the following standards:
- PN-ISO 18589-1 „Measurement of radioactivity in the environment – Soil – Part 1: General guidelines and definitions”
- PN-ISO 18589-2 „Measurement of radioactivity in the environment – Soil – Part 2: Guidance for the selection of the sampling strategy, sampling and pre-treatment of samples”
Two meetings of the Committee for the Radiological Protection Standardization were organized. Official opinion on the drafts of ISO standards were prepared.

74
NATIONAL CONTACT POINT ON EUROPEAN PLATFORM ON TRAINING AND EDUCATION IN RADIATION PROTECTION
At the end 2006 in Central Laboratory for Radiological Protection, by approval of President of National Energy Agency, has been established the National Contact Point on European Platform on Training and Education in Radiation Protection (EUTERP). The main objectives of Platform are:
- to remove obstacles for mobility of Radiation Protection Experts within the European Union through harmonisation of criteria and qualifications for mutual recognition of such experts
- to facilitate the transnational access to vocational education and training - to better integrate education and training into occupational radiation protection
infrastructures in the Member, Candidate and Associates States of the European Union.
The national contact point plays a co-ordinating role between the various Platform participants within a country. This point harmonises the national education and training framework with present requirements in European countries. It implies the close collaborations with EC various education centres to update existing knowledge and to impart sufficient and competent information.
75
SCIENTIFIC AND TECHNICAL
REPORTS
2008
DEPARTMENT OF
PERSONNEL MONITORING &
CALIBRATION

76
PRODUCING DOSE-RESPONSE CALIBRATION RELATIONSHIP FOR BIOLOGICAL DOSIMETRY IN CASES OF ACCIDENTAL
HIGH-DOSE EXPOSURES TO GAMMA - RAYS
Maria Kowalska, Monika Szymańska
Since in cases of accidental radiation exposures physical dosimetry is often incomplete or absent, dose estimates and determination of radiation exposure must be based on biological dosimetry. The most specific and sensitive method of biological dosimetry relays on analysis of radiation-induced chromosome aberrations in peripheral blood lymphocyte (PBL) of the exposed person. Dicentric chromosomes are the preferred aberration for biological dose assessment during a short period after exposure to photon ionising radiation and neutrons in the dose range 0.1-5.0 Gy and 0.05-2.5Gy, respectively. At higher doses, the yield of dicentrics in PBL does not provide an accurate dose assessment due to the problem with obtaining a sufficient number of metaphases for analysis [1]. For high dose estimation a more suitable is to score rings in lymphocyte chromosomes condensed by okadaic acid [2]. This specific inhibitor of protein phosphatase can induce premature chromosome condensation (PCC) in different phases of the cell cycle. Simultaneous scoring of PCC human lymphocytes in G1 and G2/M phases provides a high number of chromosome spreads for analysis and overcomes problems related to low mitotic index or cell cycle alterations after high dose irradiation. In conclusion, the use of okadaic acid and scoring PCC rings in Giemsa-stained preparations is a powerful method for biological dosimetry in cases of high-dose exposures. In such cases, the information on the absorbed dose helps the physicians in planning the course of therapeutic treatment of an accident victim and provides an important input to investigations of the accident by the regulatory authority.
Observed yields of PCC rings in PBL of exposed persons may be used to assess previous radiation exposures by comparison with an in vitro-produced dose-response calibration curve. In order to determine own calibration curve for high dose estimation at CLOR, the peripheral blood of 6 healthy volunteers, informed about the nature and objectives of the study, was irradiated with 0, 5, 10, 15, 20 and 25 Gy of 60Co gamma-rays delivered at a dose rate of 1, 47 Gy/min. Irradiated lymphocytes were than cultured as the whole blood for 48 h. 500 nM okadaic acid was added to the cultures for the last 1 hour. Lymphocytes were fixed with methanol-acetic acid (3:1) and spread on glass slides. After Giemsa staining at least 100 PCC lymphocytes for each dose point were analyzed for every donor. Due to the absence of any significant differences between individual PCC ring yields at each dose, the results derived from lymphocyte cultures of all donors were combined and the points of the mean dose-response relationship were fitted to a linear regression model Y=aD. A correlation coefficient (r) of the model was also determined.
The results of PCC ring scoring in Giemsa-stained lymphocytes of six donor’s blood irradiated at 0-25 Gy are presented in Table 1. These data best fit to the equation Y=(0.037±0.001)D, r=995. This finding indicates that the formation of ring chromosomes by high-dose irradiation is dominated by single-track events, hence their
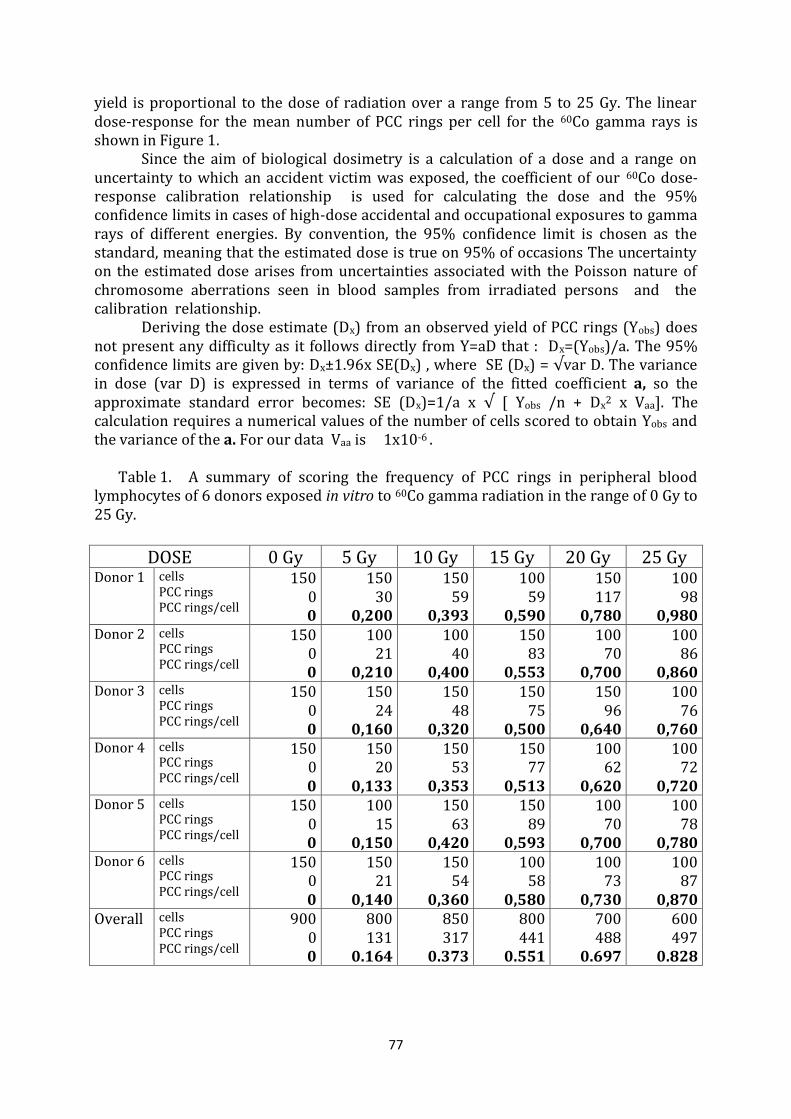
77
yield is proportional to the dose of radiation over a range from 5 to 25 Gy. The linear dose-response for the mean number of PCC rings per cell for the 60Co gamma rays is shown in Figure 1.
Since the aim of biological dosimetry is a calculation of a dose and a range on uncertainty to which an accident victim was exposed, the coefficient of our 60Co dose-response calibration relationship is used for calculating the dose and the 95% confidence limits in cases of high-dose accidental and occupational exposures to gamma rays of different energies. By convention, the 95% confidence limit is chosen as the standard, meaning that the estimated dose is true on 95% of occasions The uncertainty on the estimated dose arises from uncertainties associated with the Poisson nature of chromosome aberrations seen in blood samples from irradiated persons and the calibration relationship. Deriving the dose estimate (Dx) from an observed yield of PCC rings (Yobs) does not present any difficulty as it follows directly from Y=aD that : Dx=(Yobs)/a. The 95% confidence limits are given by: Dx±1.96x SE(Dx) , where SE (Dx) = √var D. The variance in dose (var D) is expressed in terms of variance of the fitted coefficient a, so the approximate standard error becomes: SE (Dx)=1/a x √ [ Yobs /n + Dx2 x Vaa]. The calculation requires a numerical values of the number of cells scored to obtain Yobs and the variance of the a. For our data Vaa is 1x10⁻⁶ .
Table 1. A summary of scoring the frequency of PCC rings in peripheral blood lymphocytes of 6 donors exposed in vitro to 60Co gamma radiation in the range of 0 Gy to 25 Gy.
DOSE 0 Gy 5 Gy 10 Gy 15 Gy 20 Gy 25 Gy
Donor 1 cells PCC rings PCC rings/cell
150 0 0
150 30
0,200
150 59
0,393
100 59
0,590
150 117
0,780
100 98
0,980 Donor 2 cells
PCC rings PCC rings/cell
150 0 0
100 21
0,210
100 40
0,400
150 83
0,553
100 70
0,700
100 86
0,860 Donor 3 cells
PCC rings PCC rings/cell
150 0 0
150 24
0,160
150 48
0,320
150 75
0,500
150 96
0,640
100 76
0,760 Donor 4 cells
PCC rings PCC rings/cell
150 0 0
150 20
0,133
150 53
0,353
150 77
0,513
100 62
0,620
100 72
0,720 Donor 5 cells
PCC rings PCC rings/cell
150 0 0
100 15
0,150
150 63
0,420
150 89
0,593
100 70
0,700
100 78
0,780 Donor 6 cells
PCC rings PCC rings/cell
150 0 0
150 21
0,140
150 54
0,360
100 58
0,580
100 73
0,730
100 87
0,870 Overall cells
PCC rings PCC rings/cell
900 0 0
800 131
0.164
850 317
0.373
800 441
0.551
700 488
0.697
600 497
0.828

78
Figure 1. The dose-response calibration curve for PCC ring yields in human lymphocytes exposed in vitro to 60Co gamma rays.
RADIATION DOSE [Gy]
NU
MB
ER
OF
PC
C R
ING
S P
ER
CE
LL
0
0.2
0.4
0.6
0.8
1
1.2
0 5 10 15 20 25
REFERENCES:
1. Cytogenetic analysis for radiation dose assessment. A manual. IAEA, Vienna 2001, Technical Reports Series No.405.
2. Kanda R. Hayata I and Lloyd D. Easy biodosimetry for high-dose radiation exposures using drug-induced prematurely condensed chromosomes. Int. J. Radiat. Biol. 74. 457-462.1998.

79
ASSURANCE AND SUPPORT OF THE QUALITY SYSTEM IN RADON DOSIMETRY LABORATORY AT SCOPE OF RADON
AND RADON PROGENY DETECTORS AND DEVICES CALIBRATION
Kalina Mamont-Ciesla, Olga Stawarz Report of the agreement with National Atomic Agency, number 7/SP/2008:
“Assurance and support of the quality system of dosimetric devices calibration”
The following subjects were specified in the task “Assurance and support of the
quality system in Radon Dosimetry Laboratory at scope of radon and radon progeny detectors and devices calibration”: 1. Technical supervision, conservation of the chamber and its equipment 2. Improving of the quality system in Radon Dosimetry Laboratory at scope of radon
devices calibration, radon detectors exposition and radon progeny devices calibration
3. Conducting of internal and external audits. In the further part of this text “quality system” will be replaced by “management system”.
In the year 2008 the following technical supervision and maintenance were performed: monthly charging of portable devices, repair of the AlphaGUARD PQ2000 PRO monitor and calibration in accredited laboratory, putting the non-sparking accumulator in the RGR-40 radiometer, purchase of the pump co-operating with Radon Progeny Particle Size Spectrometer (RPPSS Mk-2) and the pump for continuous work with the radon sources. Also the following checking was done: - reading of reference standards (AlphaGUARD PQ2000 PRO and Radon WL meter)
and working standards (AlphaGUARD PQ2000 and RPPSS Mk-2) in fixed and repeatable conditions of radon, radon progeny and aerosols concentration, in normal climatic conditions (comparison to the previous results);
- measurements of background, flow rate (for the new pump co-operating with RPPSS Mk-2) and efficiency of the detector (all for RPPSS Mk-2) - comparison to the previous results;
- measurements of the flow rate and efficiency of the detector for Radon WL meter, comparison to the previous results.
The checking results were satisfactory.
In the reference to the second point of the agreement the following was done: management review on the 29th of April 2008 and training (quality control, supervision of the documents of management system, changes in external documents, methods of quality assurance and estimation of the uncertainty of measurement, electrets’ method of radon concentration measurements, method of grab sampling measurements of PAEC, presentation of the calibration results, calculation of correction and calibration coefficients and their uncertainty by the computer programme – for different devices, norm PN-EN ISO/IEC 17025:2005, two months practical and theoretical training of IAEA scholar about radon and its progeny, methods of measurements and calibration, devices and detectors).

80
Furthermore the following was done: summarising of checking of the devices and training which took place in 2007; conducting of four internal audits (they covered the whole scope of management system, some observations and some corrections were done); corrections and corrective actions after the external audit in November 2007; comparing tests of PAEC measurements in the grab sampling mode for RPPSS Mk-2 and other devices; calibration of AlphaGUARD PQ2000 monitor and RGR-40 radiometer to compare the results to the results from the previous years. All checking results were satisfactory. Documents, forms and cards of the management system were updated, corrected and filled in. The programme to calculate radon concentration, PAEC, correction and calibration coefficients and their uncertainty was modified. Proficiency in calibrations, state of documents and records, equipment and accessories were checked before the external audit.
Laboratory participated again in the international intercalibration of passive methods of radon measurements in National Institute of Radiological Sciences, Chiba, Japan. The results are being work out at this moment.
On the 18th of November 2008 the external audit took place. Nine incompatibilities (three “small” and six “medium”) and eleven observations were noted in the report. Corrections and corrective actions against the incompatibilities were done and the auditors were informed about them.

81
THE ASSURANCE AND MAINTENANCE OF THE QUALITY SYSTEM IN LABORATORY OF PERSONAL AND ENVIRONMENTAL DOSES
FOR RADIOLOGICAL PROTECTION
Marek Wasek*), Grażyna Krajewska, Kamil Szewczak
* Department of Drug Bioanalysis and Analysis, Medical University of Warsaw
In 2008, for the purpose of assuring and maintaining Laboratory of Personal and Environmental Doses (PDIŚ) the following activities were performed:
1. For scheduled internal audits: - " Document control” - “Complaints” - "Measurement traceability and validation of the method” - "Instructions and procedures”
The audits were conducted before the yearly audit and organized under the supervision of the Polish Centre for Accreditation. They aimed at controlling the key areas of the quality system, which determine its effectiveness in setting the equivalent dose. The two last audits were a yearly recapitulation of activities performed by PDIŚ. There were no complaints from customers, and on the basis of the research of quality control made, the high quality of services offered by PDIŚ was confirmed.
2. Review of Quality Management On a basis of presented papers and discussions, dr Paweł Krajewski , Director CLOR stated the following facts:
- The correctness of the quality system operation in PDIŚ is according to the requirements of PN - EN the ISO / IEC 17025:2001 + Ap1:2005 standard.
- The maintenance of the technical competences to perform analysis is within the established range of accreditation.
3. Testing analysis of film detectors devoted to determine the individual equivalent
dose Hp(10) are performed according to accepted procedures of the quality system applied by PIDŚ. Research results are shown in documents QD 3.1 and QD 3.2. This type of analysis was performed periodically every 2 months in order to detect any errors or shortcomings of the quality system, which could affect the final service quality. The analysis has not detected any shortcomings within the established range of accreditation.
4. Seven internal trainings of PDIŚ technical staff covering the following issues:
- The uncertainty of the A and B type - Implementation of new standardization and calibration documents and cards
into the quality system; - The advantages and disadvantages of the photometric technique in comparison
to the technique with the thermoluminescence detectors; - The interactions between ionizing radiation and matter; - Validation of the photometric and thermoluminescence methods.

82
5. Testing a workplace for photochemical processing of photometric detectors. The testing was held before every measuring and calibration cycle.
6. Quarterly calibration of two densitometers used for film budges method.
7. Participation in an audit organized under the supervision of the Polish Centre for Accreditation. This audit has highlighted four observations: inaccuracy of the quality system (2 – small size and 2 - medium size). These inaccuracies were caused mainly by the old and over used computer equipment responsible for controlling the densitometers and archiving the results. Action to correct these inaccuracies was taken by the end of 2008.
The final conclusion of the audit, in spite of above mentioned inaccuracies, was
that the Laboratory PDIŚ has maintained the implemented quality system according to the requirements of PN - EN ISO / IEC 17025:2001 + Ap1:2005 standard.
The work executed in 2008 by PDIŚ was done according to a timetable prepared earlier and in agreement with procedures, general instructions and research procedures included into quality system.

83
THE ASSURANCE AND MAINTENANCE OF THE QUALITY SYSTEM AT THE
CALIBRATION LABORATORY - SECONDARY STANDARD DOSIMETRY
LABORATORY (DLWW) FOR THE PURPOSES OF RADIOLOGICAL PROTECTION
Kamil Szewczak
In 2008 in the Calibration Laboratory – Secondary Standard Dosimetric Laboratory in
purpose of assurance and maintenance of Quality System adequate task had been
performed (in the chronologically direction):
1. Carry out the corrective actions and analyse of the observations noted during
external audit in 2007
2. External audit supervised by PCA auditors
3. Pass on the PCA the propositions of the corrective actions
4. Carry out the proposed corrective actions
5. Carry out a correction to the Management review with has place in 11 of June
2008y
6. Internal audit
7. Pass on the PCA the evidences of the carried out corrective actions
8. Actualisation of the general procedures
9. Actualisation of the technical procedures
10. New edition of the Quality Book, edition 10
Assignments that have been results of the external audit carried out by PCA's auditors
covered the corrective actions according to four disagreements and preventing actions
for 33 observations. All corrective actions were realised with success but not to all
observations the preventing actions were made what will have influence for the
numerous disagreements in the next external audit carried out in 2008.
The audit has place in 27 June 2008 and in result a 13 disagreements were drawn up
including:
- 7 disagreements in general section
- 6 disagreements in technical section
In addition 12 observations were drawn up:
- 9 in general section
- 3 in technical section
As a basis of the disagreements adequate point of the Standard 17025 were listed:
4.1, 4.2, 4.3, 4.4, 4.9, 4.11, 4.12, 4.14, 4.15, 5.2, 5.4, 5.6, 5.9, 5.10.
In collaboration with a specialist for Quality Systems an analysis of disagreements
were done and adequate corrective actions were proposed. The propositions of the
corrective actions were approved by the PCA's auditors. At the same time thirty Cards
for Planning and Monitoring of the Corrective Action were issued according to the QPO

84
12 procedure. Because of the wide range of corrective actions it was requested to the
PCA to extend the deadline for sending the evidence to carried out operations. The
corrective actions cover mainly:
- Adapting the Quality system and procedures to the requirements of PN-EN ISO
/ IEC 17025:2005
- analysis of observations from 2007
- Review and update of the measuring procedures
- personnel training
- Review of the management
- Internal audits
The correction to the management review made in 11 June 2008 was performed. The
review was conducted on 20 August 2008 in accordance with updated QPO 10
procedure. In result of the review a protocol was drawn using a newly developed form.
As a result of management review objectives and tasks to the period 2008/2009 have
been established. Protocol from the review was attached as evidence to corrective
actions.
On September 23 an internal audit in accordance with the QPO 11 procedure had
place, it covers "Cooperation with the customers" and "Instruments calibration". As a
result one observation was recorded.
On 27 September evidences of corrective actions were send to the PCA, they include:
- Five newly created system procedures
- An analysis of observations recorded during the audit of PCA in 2007
- List from personnel training
- Management review Protocol
- Internal audits Reports
- Records of quality control of the instruments
- Evidence of validation of the formulas used in Excel spreadsheets
- Updates Cards of responsibility and authority of personnel
Updates of all procedures were performed. Five new procedures were created:
"Preventive actions", "Dealing with the work not confirm to the requirements", "
Records control", "Transport and storage of the secondary standards", "Purchasing
services and supplies".
In addition all measurements procedures were updated to new graphic form. The
Quality Book has been fully modernized to fulfil the requirements of Standard 17025.

85
SCIENTIFIC AND TECHNICAL
REPORTS
2009
RADIATION HYGIENE
DEPARTMENT

86
ACCREDITATION FOR A RADIOCHEMICAL AND SPECTROMETRIC ANALYSES LABORATORY
Ewa Starościak, Wojciech Muszyński, Barbara Rubel, Lidia Rosiak, Agnieszka Fulara, Walenty
Kurowski, Małgorzata Kardaś
A study on „Accreditation for a Radiochemical and Spectrometric Analyses Laboratory"
was carried out in the Radiation Hygiene Department of the Central Laboratory for
Radiological Protection (CLOR) in 2009. The study was devoted to tasks covered by
Contracts No 6/SP/2009. The following products were developed within the framework
of tasks specified in the Contracts:
1. Upgrading the Quality Manual, general Procedures and Instructions.
After external audit conducted by Polish Accreditation Center (PCA) experts in May
2009 upgraded Quality Manual (including a review of the quality policy), changed the
content and graphic of all procedures and prepared a new edition (2nd edition of
15.10.2009) documents of the Laboratory management system related to quality was
done. In Laboratory 15 procedures relating to management, procedures satisfy the
requirements of standards PN-EN ISO/IEC 17025:2005 are in force. Records relating to
the procedures are carried out on established forms associated by the symbols with the
procedures.
2. Prepare descriptions of Research procedures and operating Instructions
according to Standard PN-EN ISO/IEC 17025:2005 and Standard PN-ISO 10012-
1:1998 for extend the accreditation of determination of plutonium in samples of
milk; tritium and gross alpha and beta radioactivity in samples of water.
Research Procedures have been developed describing the methods about which the
Laboratory extends the range of accreditation and the instructions needed in process of
practice of this research. Procedure QPB 4 “Determination of activity concentration of
plutonium – 239, 240 and 238” was completed for the determination these isotopes in
the samples of food (milk and dairy products). In the procedures QPB 3 “Determination
of activity concentration of tritium” described procedure in case of determination of this
element in water. Based on the Standard ISO 9697:2001 “Water quality. Measurements
of gross beta activity in non-soline water” procedure QPB 6 “Determination of gross beta
radioactivity in water” was developed. Based on the Standard ISO 9696:2007 “Water
quality – Measurements of gross alpha activity in non-soline water – Thick source
method” procedure QPB 7 “Determination of gross alpha radioactivity in water” was
developed. In the Laboratory 7 Research Procedures are in force.

87
3. Conduct two internal audits concerning management system and technical
questions:
According to a program of audits for the year 2009 two internal audits, one including
management system and the other for technical area were conducted in the
radiochemical and Spectrometric Analyses Laboratory. Audits have shown that
laboratory management system is implemented. During audits 1 incompatibility and
4 observations were written. The Laboratory has taken corrective and preventive action
in relation to incompatibility and observations made by the internal auditor.
4. Registration to the PCA application to extend accreditation:
Application for extension of accreditation of Radiochemical and Spectrometric Analyses
Laboratory was submitted in the Polish Accreditation Centre. Laboratory extended the
range of accreditation about determination of activity concentration of plutonium 239,
240 and 238 in milk and dairy products and about determination of activity
concentration of tritium and gross alpha and beta radioactivity in water. The application
with a new edition 2 of 15.10.2009 Quality Paper, 15 General Procedures and 7 Research
Procedures were delivered to the PCA.
5. Carrying out the accreditation audit by experts from PCA:
On 11-12.02.2010 external audit was carried out by PCA experts. During the audit
11 incompatibility were written. Laboratory planned correction and corrective actions
to remedy the deficiencies and prevent their recurrence. During audit Laboratory range
of accreditation was established.
The Laboratory staff participated in internal trainings concerning requirements of
Standard PN-EN ISO/IEC 17025:2005. On the training organized on 6-7 October 2009 by
the Office for the Management of Quality, Environmental and Occupational Safety and
Health
4 employees have been trained with the knowledge of the Norm PN-EN ISO/IEC
17025:2005. Employees of the Laboratory for internal training are made aware of a new
edition of Quality Paper, General and Research Procedures.
Following the PCA recommendation on participation in proficiency tests and inter
comparisons (DA-05) the Laboratory participated in 2009 in international and national
intercalibration organized by:
- International Atomic Energy Agency (IAEA-2008-03) – determining the activity
concentration of uranium – 234 and uranium 238 in water and phosphogypsum
(according to the procedure QPB 5 “Determination of activity concentration of
uranium – 238, 234 and 235”).
- PROCORAD 2009, for the determination of activity concentrations of gamma
emitters in urine samples (according to the procedure QPB 1 “Study of artificial
and natural radioactivity in food and environmental samples by gamma
spectrometry”).
- Comparison measurements organized by President of National Atomic Energy
Agency (PAA) (conducted by IchTJ). The Laboratory participated in the
88
determination of plutonium-239 in the samples of: drinking water, milk powder,
carrots and soil (according to the QPB 4 procedure “Determination of activity
concentration of plutonium – 239, 240 and 238”) and americium-241 in samples
of milk powder and drinking water (according to procedure QPB 1).

89
DOSE ASSESSMENT DUE TO INTAKE OF CS-137 IN MILK IN DIFFERENT GROUP OF AGE
B.Rubel, W.Muszyński, M. Kardaś, K. Trzpil, W.Kurowski
Milk from milk company as Polmlek, Łowicz, Rotr, Kościan, Radomsko and Wart-Milk was analyzed in 2009. Milk derived from districts: łódzkie, pomorskie, kujawsko-pomorskie, małopolskie, wielkopolskie and mazowieckie.
Milk in one of the important indicator of the diet contamination because of its
quick appearance in milk after contamination of environment and cows. Its share in our
daily diet is also significant. Sample was taken from shops situated on Warsaw territory
between July and September. Activity concentration of Cs-137 was determined in two
months sample. Results are presented in table below:
districts Number of samples Range of Cs-137 activity [Bq/l]
pomorskie 2 0,27
mazowieckie 2 0,19
wielkopolskie 4 0,10 – 0,25
kujawsko-pomorskie 6 0,05 – 0,20
małopolskie 2 0,24
łódzkie 14 0,05 – 1,02
Based on mean activity concentration and on amount of consumed milk
presented in Annual Statistic Book, the annual intake of Cs-137 was calculated. Annual
effective dose for adults was assessed. The annual effective dose for adults drinking milk
from different regions is shown below:
region Effective dose from Cs-137 in milk [µSv]
pomorskie 0,64
wielkopolskie 0,24 – 0,59
kujawsko-pomorskie 0,12 – 0,47
małopolskie 0,57
łódzkie 0,12 – 2,41
mazowieckie8 0,45
Effective doses from Cs-137 in milk are differentiate and depend on region from
which milk derive. Distribution of concentration Cs-137 in milk corresponds to
distribution of contamination after Chernobyl accident.
8 Research in 2008 showed that, the effective doses from milk from mazowieckie district (16 samples) was on level 0,07 µSv – 2,64
µSv.
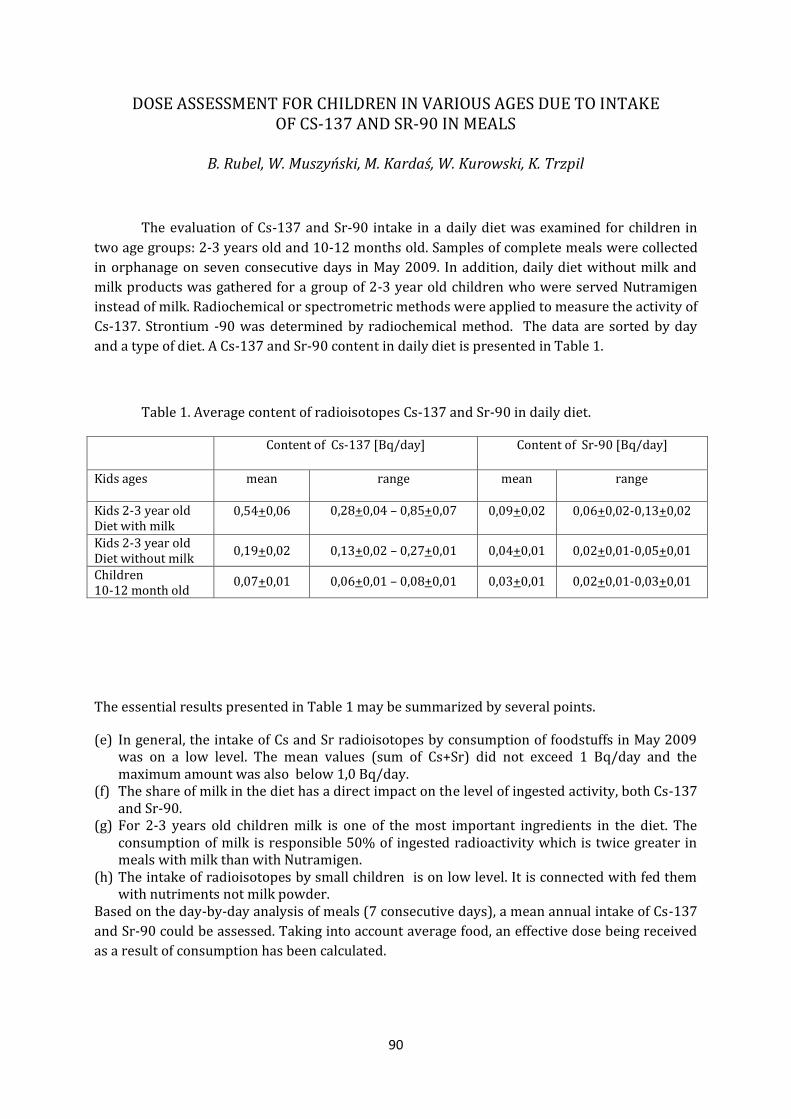
90
DOSE ASSESSMENT FOR CHILDREN IN VARIOUS AGES DUE TO INTAKE OF CS-137 AND SR-90 IN MEALS
B. Rubel, W. Muszyński, M. Kardaś, W. Kurowski, K. Trzpil
The evaluation of Cs-137 and Sr-90 intake in a daily diet was examined for children in
two age groups: 2-3 years old and 10-12 months old. Samples of complete meals were collected
in orphanage on seven consecutive days in May 2009. In addition, daily diet without milk and
milk products was gathered for a group of 2-3 year old children who were served Nutramigen
instead of milk. Radiochemical or spectrometric methods were applied to measure the activity of
Cs-137. Strontium -90 was determined by radiochemical method. The data are sorted by day
and a type of diet. A Cs-137 and Sr-90 content in daily diet is presented in Table 1.
Table 1. Average content of radioisotopes Cs-137 and Sr-90 in daily diet.
Content of Cs-137 [Bq/day] Content of Sr-90 [Bq/day]
Kids ages mean range mean range
Kids 2-3 year old Diet with milk
0,54+0,06 0,28+0,04 – 0,85+0,07
0,09+0,02 0,06+0,02-0,13+0,02
Kids 2-3 year old Diet without milk
0,19+0,02 0,13+0,02 – 0,27+0,01 0,04+0,01 0,02+0,01-0,05+0,01
Children 10-12 month old
0,07+0,01 0,06+0,01 – 0,08+0,01 0,03+0,01 0,02+0,01-0,03+0,01
The essential results presented in Table 1 may be summarized by several points.
(e) In general, the intake of Cs and Sr radioisotopes by consumption of foodstuffs in May 2009 was on a low level. The mean values (sum of Cs+Sr) did not exceed 1 Bq/day and the maximum amount was also below 1,0 Bq/day.
(f) The share of milk in the diet has a direct impact on the level of ingested activity, both Cs-137 and Sr-90.
(g) For 2-3 years old children milk is one of the most important ingredients in the diet. The consumption of milk is responsible 50% of ingested radioactivity which is twice greater in meals with milk than with Nutramigen.
(h) The intake of radioisotopes by small children is on low level. It is connected with fed them with nutriments not milk powder.
Based on the day-by-day analysis of meals (7 consecutive days), a mean annual intake of Cs-137
and Sr-90 could be assessed. Taking into account average food, an effective dose being received
as a result of consumption has been calculated.

91
The results are shown in Table below:
Concentration of
Cs-137 in annual
diet[Bq/y]
Dose from
Cs-137
[µSv/y]
Concentration of
sr-90 in annual
diet [Bq/y]
Dose from
Sr-90
[µSv/y]
Kids 2-3 years old
Diet with milk
197 1,9
31 1,5
Kids 2-3 years old
Diet without milk
71 0,7 15 0,8
Kids 10-12 months old
25 0,5 9 2,0
The lowest effective doses have been received by 2-3 years old children on a milk-free
diet, i.e. Nutramigen: 0,7 and 0,8 µSv/y for Cs-137 and Sr-90, respectively. The dose related to
Cs-137 received by other small children (0,5 µSv/y) has been much smaller than for the group
of 2-3 years old pupils (1,9 µSv/y).
In summary, it should be stressed that for both groups of children the effective dose
received as a results of consumption has been on a very low level.

92
CONCENTRATION OF CS-137 AND SR-90 IN FOOD PRODUCTS AND MEALS IN 2009
B. Rubel, W .Muszyński, M. Kardaś, W. Kurowski, K. Trzpil
Radioactivity in foodstuffs is an important indicator of the transfer of radionuclides from
the environment to humans. We can express the radioactivity content of foodstuffs per unit
weight or to estimate the ingested activity per day per person.
This paper deals with the dose assessment based on the ingestion of : (a) complete meals
prepared in several cities such as Warsaw, Kielce and Łódź and (b) food product purchased in
hypermarkets in the Warsaw area. Results of the analyses and statistical data concerning
consumption are presented. Dose assessment was done in connection with the intake of Cs-137
and Sr-90. Radiochemical and spectrometric methods were applied to determine activity of Cs-
137 in meals and food products. For spectrometric measurement a gamma spectrometer with
HPGe detector was used. Measurements were performed both in the Marinelli geometry after
homogenization of products and in ash samples in a geometry of a flat cylinder placed on the
detector. For radiochemical analyses the samples were dissolved and then filtered through a
radiochemical funnel with ammonium molybdeno-phosphate (AMP) bed, selective for cesium.
The activity of cesium in the bed was measured using Low Level GM Multicounter system
(manufactured by Risø, Denmark). Strontium-90 was determined from beta radiation of Y-90
after the equilibrium Sr-90 – Y-90 was reached.
Foodstuffs (separate products) were purchased in hypermarkets located on the outskirts
of Warsaw. Products sold in such stories originate from all districts of Poland. In the selection of
samples for examination and sampling frequency we have taken into account the share and
importance of respective products in an average diet. This was based on the data from Annual
Statistical Book. The activity of Cs-137 and Sr-90 is shown in table:
Products Activity concentration Cs-137
[Bq/kg, Bq/l]
Activity concentration of Sr-90
[Bq/kg, Bq/l]
Milk – I -VI
Milk – VII-XII
0,76 + 0,02
0,27 + 0,02
0,04 + 0,01
0,03 + 0,01
Meat 0,24 + 0,03 <0,02
Poultry
Eggs
0,18 + 0,04
0,16 + 0,03
<0,02
<0,01
Fish: Cod
Trout
5,32 + 0,34
0,29 + 0,02
0,23 + 0,02
<0,02
Fruit 0,11 + 0,02 0,03 + 0,01
Vegetables
Potatoes
0,12 + 0,02
0,16 + 0,03
0,09 + 0,02
0,04 + 0,01
Cereals products
Bakery goods
0,16 + 0,02
0,19 + 0,02
0,06 + 0,01
0,10 + 0,01
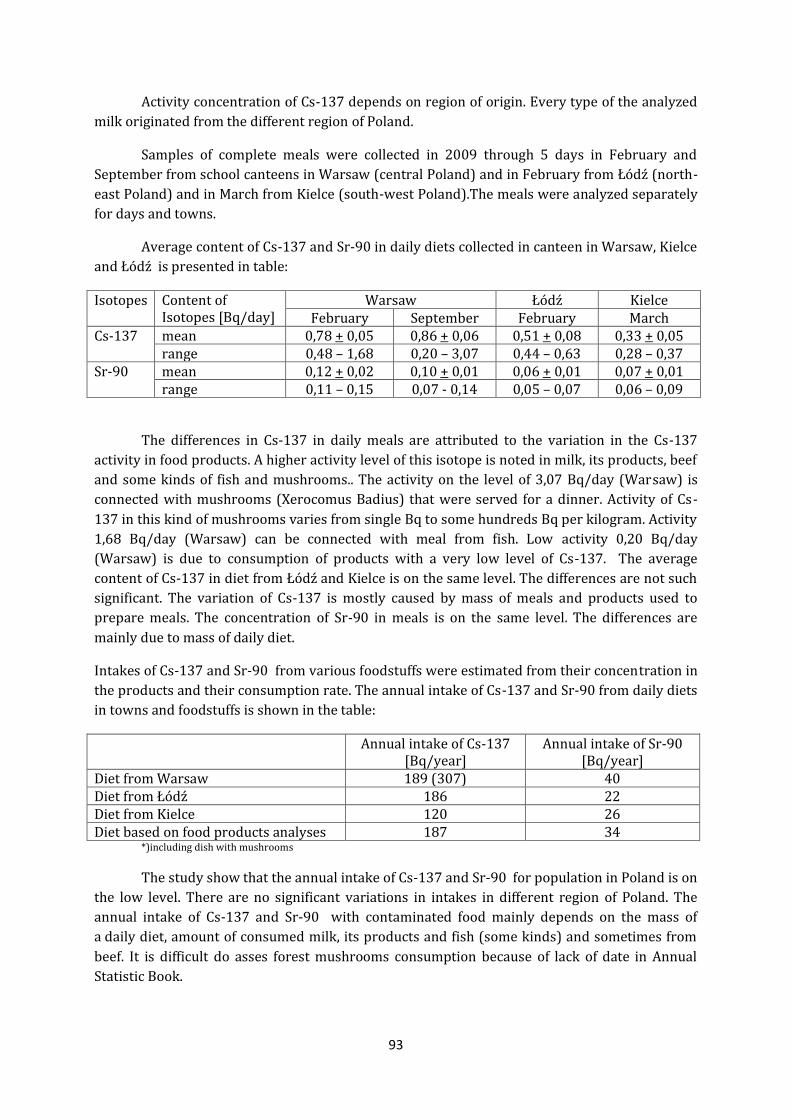
93
Activity concentration of Cs-137 depends on region of origin. Every type of the analyzed
milk originated from the different region of Poland.
Samples of complete meals were collected in 2009 through 5 days in February and
September from school canteens in Warsaw (central Poland) and in February from Łódź (north-
east Poland) and in March from Kielce (south-west Poland).The meals were analyzed separately
for days and towns.
Average content of Cs-137 and Sr-90 in daily diets collected in canteen in Warsaw, Kielce
and Łódź is presented in table:
Isotopes Content of Isotopes [Bq/day]
Warsaw Łódź Kielce February September February March
Cs-137 mean 0,78 + 0,05 0,86 + 0,06 0,51 + 0,08 0,33 + 0,05 range 0,48 – 1,68 0,20 – 3,07 0,44 – 0,63 0,28 – 0,37
Sr-90 mean 0,12 + 0,02 0,10 + 0,01 0,06 + 0,01 0,07 + 0,01 range 0,11 – 0,15 0,07 - 0,14 0,05 – 0,07 0,06 – 0,09
The differences in Cs-137 in daily meals are attributed to the variation in the Cs-137
activity in food products. A higher activity level of this isotope is noted in milk, its products, beef
and some kinds of fish and mushrooms.. The activity on the level of 3,07 Bq/day (Warsaw) is
connected with mushrooms (Xerocomus Badius) that were served for a dinner. Activity of Cs-
137 in this kind of mushrooms varies from single Bq to some hundreds Bq per kilogram. Activity
1,68 Bq/day (Warsaw) can be connected with meal from fish. Low activity 0,20 Bq/day
(Warsaw) is due to consumption of products with a very low level of Cs-137. The average
content of Cs-137 in diet from Łódź and Kielce is on the same level. The differences are not such
significant. The variation of Cs-137 is mostly caused by mass of meals and products used to
prepare meals. The concentration of Sr-90 in meals is on the same level. The differences are
mainly due to mass of daily diet.
Intakes of Cs-137 and Sr-90 from various foodstuffs were estimated from their concentration in
the products and their consumption rate. The annual intake of Cs-137 and Sr-90 from daily diets
in towns and foodstuffs is shown in the table:
Annual intake of Cs-137 [Bq/year]
Annual intake of Sr-90 [Bq/year]
Diet from Warsaw 189 (307) 40 Diet from Łódź 186 22 Diet from Kielce 120 26 Diet based on food products analyses 187 34
*)including dish with mushrooms
The study show that the annual intake of Cs-137 and Sr-90 for population in Poland is on
the low level. There are no significant variations in intakes in different region of Poland. The
annual intake of Cs-137 and Sr-90 with contaminated food mainly depends on the mass of
a daily diet, amount of consumed milk, its products and fish (some kinds) and sometimes from
beef. It is difficult do asses forest mushrooms consumption because of lack of date in Annual
Statistic Book.

94
DETERMINATION OF RADIOLOGICAL PARAMETERS OF DRINKING WATER IN LARGE CITIES, AND EVALUATION OF DOSES RECEIVED BY ITS CONSUMPTION
A. Fulara, A. Adamczyk, E. Chrzanowski
The work has been performed for Polish Atomic Agency ( Cotract 20/OR/2009)
The investigations of tap water radioactivity in 2009 were performed in nine
large cities of north-west regions of Poland.
In each sampling point a quantity of 20 liters of water was taken.
137Cs and 90Sr were determined in the same 15 l sample. In the rest 5 liters
sample, the tritium activity and total alfa and beta radioactivity were determined.
The results of 137Cs and 90Sr determinations in drinking water collected in nine
cities indicate, that both 137Cs and 90Sr concentrations were at low level, ranging
from values below detection limit (<0,41 mBq/l) to 3,95 0.44 mBq/l. In case of 90Sr
that range was from <0,36 mBq/l to 4,700,74 mBq/l.
The origin of most water samples was from deep layers of ground water. While
in case of 137Cs large differences in concentrations between surface water and deep
wells water were not observed, the concentration of 90Sr in deep wells water was
much lower than in surface water.
The tritium concentration in drinking water ranged from values below detection
limit (0,5 Bq/l) to 1,7 Bq/l.
The total beta radioactivity in investigated water samples was very low and
ranged from 0,02 0,01 Bq/l to 0,20 0,03 Bq/l.
The total alpha radioactivity only in one sample was the same like detection
limit.
According to the Ministry of Health regulations issued on 29 of march 2007,
concerning the quality of drinking water designed for public tritium concentration in
drinking water must not exceed 100 Bq/l and total permissible dose is 0,1 mSv/y.
The dose is not exceeded if the total alfa radioactivity does not exceed 0,1 Bq/l and
total beta radioactivity does not exceed 1 Bq/l.
The total indicative dose from yearly ingested 137Cs with drinking water for nine
investigated cities are in range from 0,005 Sv/y for children aged 1-10 years, to
0,013 Sv/y for adults. While from yearly ingested 90Sr these doses are from 0,016
Sv/y for children aged 1-10 year and for adults, to 0,045 Sv/y for children younger
than 1 year old.
The total indicative doses from yearly ingested 137Cs are several times lower than
from ingested 90Sr.
The results of these work indicate that calculated doses are neglectedly low.
95
DETERMINATION OF URANIUM AND PLUTONIUM REFERENCE LEVELS IN MEN’S URINUM TO ESTIMATE INTERNAL CONTAMINATION
OF PERSONS HAVING CONTACT WITH FISSLE MATERIALS
Lidia Rosiak, Ewa Starościak Radiation Hygene Department Contract PAA No 7/SP/2009
Uranium and plutonium are radioactive elements of special meaning. In
connection with cases of illegal turnover of fissle materials and more and more frequent
using of depleted uranium in military and civilian sector is a danger of absorbing these
elements by inhalation and ingestion way in case of radiation incident. This exposure
concerns not only workers and services , but also people of population – inhabitants of
region surrounding . Estimation of exposure could be done knowing an internal
contamination. This internal exposure could be determined by the knowledge of results
of measurements of uranium and plutonium activity in daily samples of urine and
metabolic parameters of these elements in a human body. We could then estimate an
effective dose (ICRP Publication No76).
The aim of this work is to determine uranium and plutonium (in the same sample) in
daily urine samples of non-occupationally exposed people. Results could be used as
reference levels, which let to detect internal exposure of these nuclides in case of an
unexpected delivery to the environment.
Daily samples of urine were taken from 10 healthy Warsaw inhabitants (5
women and 5 men), age from 23 to 60 years. These persons never worked with uranium
or/and plutonium compounds.
In 1liter samples of urine Pu –238, Pu–239 and Pu–240 with Pu-242 as a tracer
and U-235, U-234 and U-238 with U-232, as a tracer were determined. Radiochemical
method of uranium and plutonium determination depends, at great simplification, on
separation of these isotopes in chromatography column - uranium is eluated with nitric
acid, thorium isotopes are eluated with concentrated hydrochloric acid, plutonium stays
in the column. Plutonium from chromatography column is eluted with solution of
ammonium iodide in hydrochloric acid . Uranium from eluate is extracted with the
solution of tributylphosphate in kerosene then extraction from organic to aqueous
phase is carried out with nitric acid first and then with distilled water. Further analysis
is identical for both elements. Electro-deposition on stainless steel discs is carried out
and alpha activity is measured.
96
This method is too little sensitive to determine activity concentration of
plutonium in 1 liter urine samples. Concentration of plutonium in all 10 samples was
below detection limit -0.2 mBq/l.
It was also impossible with this method to determine activity concentration of U-
235 in 1 l samples. In all cases activity concentration of U-235 was below limit of
detection - 0.5 mBq/l.
Activity concentration of U-234 in urine samples oscillated in range 2.307±0,59 –
15.99±2.12 mBq/l ( average:7,41±5.09 mBq/l), and activity concentration of U-238 in
range 1.78±0.51 – 15.46±2.05 mBq/l (average: 6.24±4.78 mBq/l). An average volume
of daily urine sample was 1.79 l, so average daily U-234 excretion with urine could be
determined as 13.45±9.95 mBq/d, and U-238 11.41± 9.27 mBq/d. Daily excretion with
urine both of determined isotopes was higher for women than for men. In case of men
considerably correlation (R2=0,68) of daily excreted uranium with age of a person was
observed.
If we compare these data with earlier results for a group of 9 Warsaw inhabitants
this correlation will be not so high (R2=0,24). Due to a small number of samples it is not
possible to say, that daily uranium excretion with urine is correlated with age and sex of
a human.
The fallowing assumptions were made to calculate annual effective dose from
chronic ingestion results of daily uranium excretion with urine:
Uranium absorbed to blood from gastrointestinal tract is close to equilibrium
with uranium level in the human body
The whole uranium from the body is excreted through the renal system fU =1
Daily excretion of uranium with urine is proportional to its concentration in the
body
f1 = 2% for all components of the diet
DCF intake by ingestion:
for 234U =4.9x10⁻⁸ Sv/Bq
for 238U =4.5x10⁻⁸ Sv/Bq
Calculated average daily and annual U-234 i U-238 intakes were 13.7 mBq/d and
7.3 Bq/y and, 11.6mBq/d and 4.25 Bq/y respectively. Prof Z. Pietrzak-Flis and her team
calculated uranium intakes with food and drinking water (for Central Poland – 8.08
Bq/y ). In this work estimated intake was about two times lower.
Average effective doses were, for U-234 - 0.19 µSv/y and for U-238 – 0.25 µSv/y.
So the total from uranium is 0.44 µSv/y. This dose is 0.2% of annual dose from natural
environment.
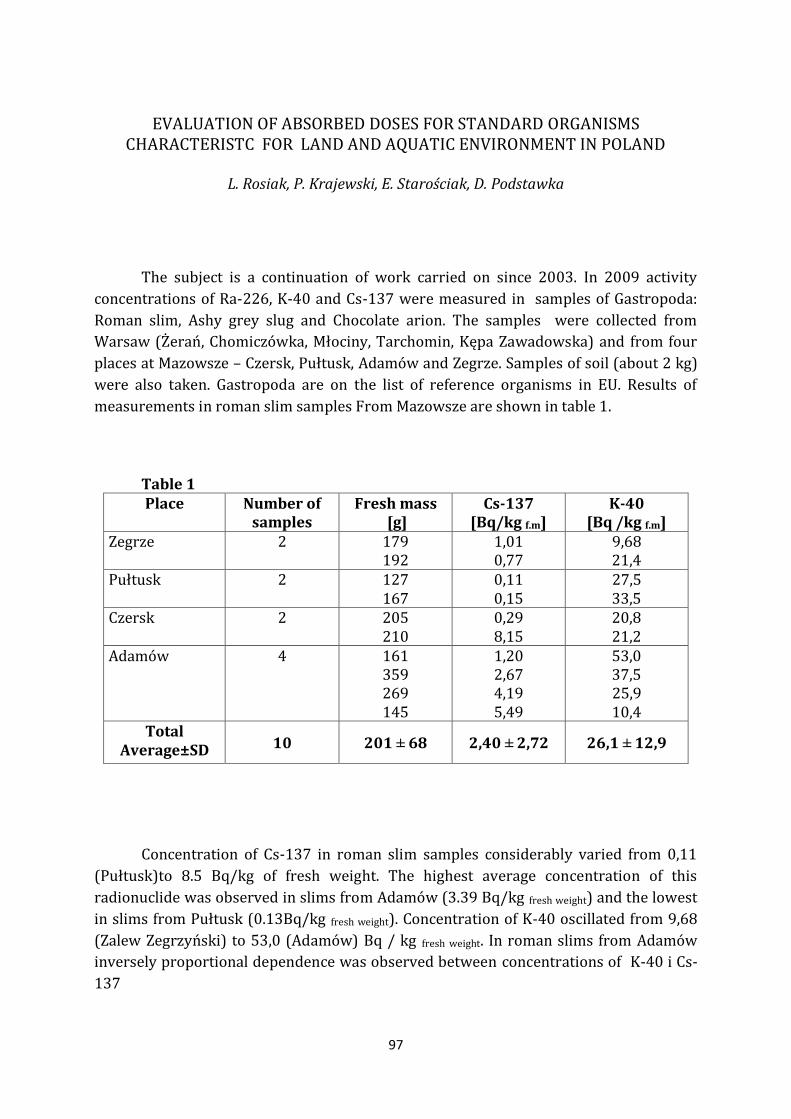
97
EVALUATION OF ABSORBED DOSES FOR STANDARD ORGANISMS
CHARACTERISTC FOR LAND AND AQUATIC ENVIRONMENT IN POLAND
L. Rosiak, P. Krajewski, E. Starościak, D. Podstawka
The subject is a continuation of work carried on since 2003. In 2009 activity
concentrations of Ra-226, K-40 and Cs-137 were measured in samples of Gastropoda:
Roman slim, Ashy grey slug and Chocolate arion. The samples were collected from
Warsaw (Żerań, Chomiczówka, Młociny, Tarchomin, Kępa Zawadowska) and from four
places at Mazowsze – Czersk, Pułtusk, Adamów and Zegrze. Samples of soil (about 2 kg)
were also taken. Gastropoda are on the list of reference organisms in EU. Results of
measurements in roman slim samples From Mazowsze are shown in table 1.
Table 1 Place
Number of
samples Fresh mass
[g] Cs-137
[Bq/kg f.m] K-40
[Bq /kg f.m] Zegrze 2
179 192
1,01 0,77
9,68 21,4
Pułtusk
2
127 167
0,11 0,15
27,5 33,5
Czersk 2 205 210
0,29 8,15
20,8 21,2
Adamów 4 161 359 269 145
1,20 2,67 4,19 5,49
53,0 37,5 25,9 10,4
Total Average±SD 10 201 ± 68 2,40 ± 2,72 26,1 ± 12,9
Concentration of Cs-137 in roman slim samples considerably varied from 0,11
(Pułtusk)to 8.5 Bq/kg of fresh weight. The highest average concentration of this
radionuclide was observed in slims from Adamów (3.39 Bq/kg fresh weight) and the lowest
in slims from Pułtusk (0.13Bq/kg fresh weight). Concentration of K-40 oscillated from 9,68
(Zalew Zegrzyński) to 53,0 (Adamów) Bq / kg fresh weight. In roman slims from Adamów
inversely proportional dependence was observed between concentrations of K-40 i Cs-
137

98
Results of Ra-226,Cs-137 and K-40 measurements in roman slims from Warsaw
are shown in table 2. Determination of Ra-226 was made only in 7 samples and average
concentration of this radionuclide was 2,35 Bq /kg fresh weight in range from 0,66 to 5,90
Bq /kg fresh weight. Concentration of Cs-137 in these slims considerably oscillated from
0,07 (Okęcie) to 3,64(Młociny) Bq /kg fresh weigh. Concentration of K-40 oscillated in range
5,42(Młociny) - 52,3 (Tarchomin) Bq / kg fresh weigh.
Table 2 Place WARSAW
Number of samples
Fresh mass [g]
Ra-226 [Bq/kg f.m]
Cs-137 [Bq/kg f.m]
K-40 Bq/kg f.m]
Okęcie 4 238 120 179 186
1,30 0,66 2,46 5,90
0,09 0,07 0,34 0,45
13,4 15,1 36,3 49,0
Żerań 2 75 120
1,94 -
0,26 0,15
44,1 11,3
Tarchomin 2 96 225
- 1,04
0,29 0,50
52,3 45,4
Młociny 3 265 235 79
3,16 - -
3,64 0,75 2,02
16,3 5,42 21,4
Kępa Zawadowska
2 287 311
- -
0,74 0,35
20,2 21,5
Total Average±SD
13 186 ± 81 2,35 ± 1,78 0,74 ± 1,01 27,1 ± 16,1
Results of measurements of Ra-226,Cs-137 and K-40 in naked (with no shell) slims are shown in table 3.
Table 3
Place WARSAW
Number of
samples
Fresh mass [g]
Ra-226 [Bq/ kgf.m]
Cs-137 [Bq/ kgf.m]
K-40 [Bq /kg f.m]
Chocolate arion Okęcie Chomiczówka
1 3
53,3 233 153 127
0,24 0,24
- 0,20
0,94 0,76 1,26 1,01
28,6 19,4 53,6 19,7
Ashy-grey slug Adamów
3
391 343 161
0,41 0,15
-
111 72,3 216
61,5 17,0 63,1
Total Average±SD
7 209 ±121 0,25 ±0,09 57,6 ±82,6 37,6 ±20,9

99
Very high concentration of Cs-137 was observed in ashy-grey slugs from Adamów
– 133 Bq /kg fresh weight, about 40-times higher than concentration of this radionuclide (3,39 Bq /kg fresh weight) in roman slims taken from the same place. Concentration of Ra-226 in naked slims was in average about ten times lower than in roman slims. An evaluation of absorbed doses for slims was made using our own– written in CLOR programme (called BIOTA)-for doses calculation. In table 4 an evaluation of annual absorbed doses for slims is shown.
Table 4
Place
K-40
[mGy y-1]
Average±SD
Ra-226
[mGy y-1]
Average±SD
Cs-137
[mGy y-1]
Average±SD
Sum
[mGy y-1]
WARSAW
Roman slim
Chocolate arion
0,39 ±0,06
0,47±0,05
9,15 ±6,24
0,86 ±0,09
0,06 ±0,03
0,46±0,28
9,60
1,79
Adamów
Roman slim
Ashy-grey slug
0,43 ±0,06
0,47 ±0,07
-
0,87 ±0,39
0,21 ±0,01
0,76 ±0,32
0,64
2,10
Czersk, Zegrze, Pułtusk 0,45 ±0,14 - 0,03 ±0,02 0,48
AVERAGE 0,44 3,63 0,30 4,37
Annual average absorbed dose for slims is rather small (4,37 mGy y-1). Dose from
natural isotope Ra-226 is the greatest part of total dose. Doses from K-40 and Cs-137 are similar in Chocolate arion, but for Ashy-grey slug the dose from Cs-137 is almost two
times higher than for K-40 and is very similar to the dose from Ra-226. Doses from Cs-137 are the lowest parts of the total dose for Roman slim. The work will be continued in 2010.
100
COMPERATIVE MEASUREMENTS REGARDING CS-137 ISOTOPE DETERMINATION BY BASIC UNITS PERFORMING RADIOACTIVE CONTAMINATION MEASUREMENTS WITHIN THE FRAMEWORK
OF RADIATION MONITORING OF THE COUNTRY
M. Kardaś, W. Kurowski, W. Muszyński, B. Rubel The study financed by the National Atomic Energy Agency
(Contract No. 23/OR/2009 of 17 April 2009 r.)
The project aimed at comparative measurements of Cs-137 isotope content in samples of control material with pre-determined amount of that isotope. The study was carried by basic units responsible for monitoring and measurements of local radioactive contamination in Poland. Tap water with spike of Cs-137 isotope was used as a control material. Tap water was sampled from the main water supply at the Central Laboratory for Radiological Protection.
Calibration of gamma spectrometers (Canberra spectrometers with HPGe detectors and Genie 2000 software) and beta measurement system (Low-level β-multicounter – Risoe, Denmark) was checked. The accuracy of calibration was earlier verified in the framework of international program „Radiotoxicology Intercomparisons 2009” managed by PROCORAD, France.
A 120 litre container was used. It was first cleaned with a solution containing
CsCl (25 g Cs) in 0,1 mol/l HCl. After cleaning the container was emptied and then it was filled with 100 l of drinking water which was then acidified with 100 ml of concentrated nitric acid. A reference solution of C-137 was prepared. It was diluted in accordance with the producer’s instruction. That solution was added to water in such amount to obtain the reference material of the C-137 activity exactly specified for that measuring task. The liquid was mechanically stirred to ensure homogeneity of the entire volume. This was confirmed by test measurements performed prior to the dissemination of 45 samples. They were sent to local units in HDPE containers which were first cleaned with the same kind of solution as the original 120 l container: CsCl (25 g Cs) in 0,1 mol/l HCl. This was done to avoid the reaction between C-137 with the wall of HDPE containers. Then they were filled with 2500 ml of the reference solution and dispatched to the local units. Each unit has capability for the Cs-137 determination though the apparatus and measuring techniques may differ from place to place.
Each parcel was accompanied with blank forms to be filled out with data regarding the laboratory location, staff doing the analysis, method(s) of measurement and apparatus type.
Results of measurements of the control samples were received from 30 units. The units determined 42 activity concentrations of Cs-137 (12 units used two methods: spectrometry and radiochemistry).

101
All measurement results were recorded and analyzed. Measurements' results were compared to reference values. With the use of Dixon, Grubbs and t-Student tests, uncertain results were rejected and other results were subject to statistical analysis.
A number of results in the range of +25% of reference values equals 35 (83,3% of a total number of received). The accuracy and precision of results provided by the units was assessed based on MAEA criteria. The result is acceptable if it meets both criteria. Two results satisfy this requirement. "Z" parameter was determined. Its absolute value is: Z ≤ 2 for 29 results which means that the result does not significantly differ from the reference value.

102
SCIENTIFIC AND TECHNICAL
REPORTS
2009
DOSIMETRY DEPARTMENT

103
THE QUALITY ASSURANCE SYSTEM IN THE ACCREDITED NATURAL
RADIOACTIVITY LABORATORY REGARDING THE RESEARCH OF THE RADIUM RA-226, THORIUM TH-228 AND POTASSIUM K-40
REFERENCE SOURCE
Krzysztof Isajenko, Alfred Żak, Barbara Piotrowska, Jarosław Rychlicki, Magdalena Kuczbajska, Adam Ząbek
The specific scope of tasks for the year 2009 comprised: - technical supervision over the equipment of the Laboratory and performing of the
periodical calibration of the spectrometers; - improving the management system in the Natural Radioactivity Laboratory regarding
the measurements of the natural radioisotopes: Ra-226, Th-228 and K-40 in raws and building materials;
- performing the accreditation audit by the PCA; - performing two internal audits (technical and comprehensive).
In 2009 the calibration of the spectrometers of AZAR and MAZAR types were performed in the scope of the technical supervision over the equipment of the Laboratory.
In the frame of the continuous improvement of the management system the update of the documentation of the management system was performed, i.e. the Quality Manual and the Research Method Manual. The changes regarded the introduction of the corrections after the audits and after the survey of the management. After introducing the changes the staff was trained in the scope of the Standard PN-EN ISO/ICE 17025 items 4.12 and 4.13 i.e. preventive actions and supervision over the records. In 2009 the Laboratory employed the new person who has been trained in the full scope of the activities of the Laboratory. The detailed training regarded: - principle of the equipment, - construction and adjustment of the spectrometric equipment, - performing full calibration of the measurement equipment, - preparation of samples and performing the measurement, - principle of weekly measurements of reference sources and control samples, - evaluation of the measurement, - calculation of the activity coefficient f1,
- preparation of the investigation report.
Additionally, in 2009, the external training “Implementation of the Management System in the Laboratory according to the Standard PN-EN ISO/IEC 17025:2005” organized by the Quality, Environment and Safety Management Bureau was carried out.
Besides, basing upon the separate agreement with the National Atomic Energy Agency, the Laboratory of the Natural Radioactivity Measurements organized and carried out the

104
intercomparison run regarding the measurement of the content of the natural radioactive isotopes in raws and building materials for the entities performing such measurements. The results of the intercomparison are presented in the separate report.
The priority for 2009 for the Laboratory was to obtain the accreditation. The accreditation audit took place on 5-6 May 2009 and was carried out by the PCA auditors. Five non-compliant issues were found during the audit: One major issue:
- Lack of any internal audits; Three medium issues:
- Lack of the identification of the supplier list (signature, date) and of the transfer of the information from the supplier form;
- Lack of the acceptation date for the prepared audit schedule; - Incomplete identification of some technical records;
One minor issue: - Incorrect interpretation (classification) of the preventive activities. Some of the
remarks written in the documentation survey should not be qualified as preventive measures.
The accreditation was prolonged up to the IVth quarter of 2009 due to the remarks from the PCA on the submitted evidence of the corrective and preventive measures.
In 2009 one management survey and two internal audits were carried out.
The aims from the Management Survey were met.
The internal audits were carried out in 20-21.05.2009 (comprehensive) and 28-29.09.2009 (technical).
The internal audit of the management system was carried out basing upon items 4.1-4.15; 5.2-5.10 of the Standard PN-EN ISO/IEC 17025:2005. The auditor was Mrs. Grażyna Krajewska.
The criteria for the internal audit comprising the technical activities were items 4.6; 4.9; 4.13 and 5.2 – 5.10 of the Standard PN-EN ISO/IEC 17025:2005. The auditor was Mr. Janusz Henschke.
The non-compliant issues were removed in 2009. The corrective and preventive measures were applied, as well.
The final report of the on-site assessment in the accreditation process prepared by the external auditors (principal and technical) was received by the Laboratory on 16 October 2009, and successively the contract between the PCA and the CLOR regarding the cooperation in the field of obtained accreditation was signed.
As of 19 November 1009 the Laboratory of the Natural Radioactivity Measurements is recognized as accredited laboratory No. AB1108. However, due to the changes of the staff in charge in the Laboratory withheld the use of the accreditation symbol until the competence of the authorized person is confirmed by the PCA.

105
THE ORGANIZATION AND PROCEEDING OF THE INTERCOMPARISON MEASUREMENTS OF THE NATURAL RADIONUCLIDES CONTENT IN RAW AND
BUILDING MATERIALS
K. Isajenko, A. Żak, B. Piotrowska, M. Kuczbajska, A. Ząbek
The task was conducted in two stages.
The first stage was concluded up to 15 July 2009, and the second stage was realized by 30 November 2009.
The tasks of the first stage:
- Accepting the declarations and preparing the list of the laboratories participating in the intercomparison.
- Acquisition of the materials for intercomparison samples.
- Preparation of the intercomparison samples including the control measurements of the uniformity of samples, and their distribution to the laboratories according to the fixed list.
- Preparation and presentation of the report on the abovementioned items including the measurement methods to the President of the National Atomic Energy Agency.
The tasks of the second stage:
Collecting the results of the measurements from every participant of the intercomparison and assigning the code number to the participating laboratories;
Integration, analysis and evaluation of the received measurement results;
Final report to the President of the National Atomic Energy Agency including in particular:
- Description of the techniques of the preparation of the initial materials, reference and control samples and the results of the measurements of these materials and samples;
- Integration of the measurement results from the laboratories;
- Statistical analysis of the results
- Evaluation of the accuracy and precision of the measurements;
- List of the participating laboratories.
32 laboratories applied for the participation in the intercalibration. The cellular concrete sample prepared on the base of ashes from the power plant Kozienice received from the Laboratory for Physical and Chemical Testing of Raws and Products in the Institute of Ceramics and Building Materials was chosen as the material for the intercomparison. The amount of 120 kg of concrete was used for the investigation. The difference in the non-uniformity of the samples was at the level of 1.5 %.

106
Basing upon the attached questionnaire it was concluded that of 30 laboratories that provided the results:
- 26 laboratories perform measurements by means of AZAR or MAZAR spectrometer with NaI(Tl) 2x2” detector;
- 3 laboratories perform measurements by means of HPGe spectrometry;
- 1 laboratory uses a multi-channel spectrometer with NaI(Tl) 3 x 3” detector.
Basing upon the attached questionnaire it was concluded that of 30 laboratories that provided the results:
- 14 laboratories is accredited in the scope of the natural radioactivity measurements in raws and building materials;
- 4 laboratories perform measurements according to PN-EN ISO/IEC 9001/2001,
- 15 laboratories perform measurements according to PN-EN ISO/IEC 17025:2005;
- 13 laboratories has internal management system, of which 5 base their system on the norm PN-EN ISO/IEC 17025;
- 1 laboratory has the Certificate of the Institutional Quality Control.
The reference source:
- 26 laboratories use calibration sources prepared by the CLOR on the basis of the reference sources coming from the New Brunswick Laboratory, USA and pure KCl.
- 2 laboratories use the sources prepared by the IAEA.
- 2 laboratories use their own sources on the basis of the reference sources coming from the New Brunswick Laboratory, USA.
The results of the routine measurements were provided by 28 laboratories (Run A);
The results of the prolonged-time measurements were provided by 29 laboratories (Run B);
The evaluation took into account the two runs and regarded the radioactivity
concentration of potassium 40K, radium 226Ra, thorium 228Th, and activity coefficients f1 and f2.
The average of the results provided by the laboratories were used as the reference values:
A. for the normal measurement time (Run A):
potassium concentration: 494.3 ± 11.2 Bq/kg;
radium concentration: 94.7 ± 2.6 Bq/kg;
thorium concentration: 71.7 ± 1.3 Bq/kg;
activity coefficient f1: 0.823 ± 0.014;
activity coefficient f2: 94.7 ± 2.6 Bq/kg;

107
B. for the prolonged measurement time (Run B):
potassium concentration: 492.1± 5.3 Bq/kg;
radium concentration: 97.3 ± 1.1 Bq/kg;
thorium concentration: 70.4 ± 0.8 Bq/kg;
activity coefficient f1: 0.817 ± 0.008;
activity coefficient f2: 97.3 ± 1.1 Bq/kg;
THE RESULTS:
Run A
The values of the potassium concentration determined by the laboratories varied from 401.4 Bq/kg to 899.0 Bq/kg. The prevailing number of the laboratories correctly determined the value of the potassium concentration and the total uncertainty of the measurement, except laboratories no. nr K3, K9, K12, K15, where the value of the total uncertainty was significantly underestimated and laboratory no. K27, where probably the calibration coefficients of the measuring system were subject to changes.
The values of the radium concentration varied from 0.0 to 113.2 Bq/kg. The difference between measured value and average value exceeds the value of the measurement uncertainty for 6 laboratories. The excess was slight for laboratories no. K11, K12, K18, but for laboratories no. K5 and K24 the difference was remarkable. The value form the laboratory no. K27 as the most outstanding was rejected when calculating the average value.
The values of the thorium concentration varied from 46.5 to 104.0 Bq/kg. The difference between measured value and average value exceeds the value of the measurement uncertainty for 8 laboratories. The excess was slight for laboratories no K11 and K18, but for laboratories no. K2, K3, K5, K24, K27 and no. K28 the difference was remarkable.
The main purpose of the intercomparison measurements was the evaluation of the precision of the determination of the activity coefficients f1 and f2, as well as the evaluation of the expertise of the laboratories in the scope of the determination of the coefficients f1 and f2 and the evaluation of their uncertainty.
The values of f1 determined by the laboratories varied from 0.68 to 0.94. The values of the uncertainty were from 0.04 (lab. No. K5, K15, K18) to 0.18 (no. K29). Significant values of uncertainty were reported by the laboratories no. K12, K13 and K29. Most laboratories correctly determined the value of f1 coefficient within the limits of the measuring uncertainty. The laboratories no. K3, K5, K11, K18, K24 and K27 obtained the values of uncertainty significantly lower than the differences between the measured values and the average value.
The values of the activity coefficient f2, which is equal to the SRa, are presented for the results of the concentration of radium.
108
Run B - This series of the measurements was performed to reduce the part of the measurement uncertainty depending upon the statistical scatter from the equipment background and the scatter of the number of counts from the relevant measurement ranges. It allows the best estimation of the influence of additional factors, often disregarded by the measuring staff, on the total measurement uncertainty. The difference between the average value of the measured parameter and the measured value taking into account the measurement uncertainty is considered as the measure of the factors mentioned above. If the average value falls into the scope: measured value ± total measurement uncertainty, it means that the measurement uncertainty was estimated correctly. If there is a gap between the average value and the scope: measured value ± total measurement uncertainty, it means that either total measurement uncertainty is underestimated or there are other factors, which affected the measurement result.
- The measure of the difference between the measured value and the average value, further called “uncertainty difference” has been defined as:
- for the cases when the measured value minus total measurement uncertainty is larger than the average value, the “uncertainty difference” is calculated: measured value minus uncertainty value minus average value;
- for the cases when the measured value plus total measurement uncertainty is smaller than the average value, the “uncertainty difference” is calculated average value minus uncertainty minus measured value.
Uncertainty difference is in percentage of the average value.
The results of the analysis show that for the determined values of the potassium concentration the significant “uncertainty difference” was found for the laboratories K3, K12 and K27. Majority of the laboratories estimated the uncertainty below 10 %, and the differences between the measured values and the average fall between – 17.1 % and + 82.2 %. The results were within the limits of ± 20 % of the average value except for the two laboratories K12 and K27, for which the relative values amounted to 1.27 and 1.82, respectively.
In case of the determination of radium concentration, the significant differences in uncertainties occurred for the laboratories no. K3, K10, K11, K18, K27 and K30, however majority of the laboratories estimated the uncertainty of the measurement below 20 % (many of them reached uncertainty < 10% ). The uncertainty of above 20 % was estimated in the laboratories K13 and K27.
The data for thorium concentration determination show that the significant number of the results was within ± 20 % of the average value. The exception were laboratories no. K3 and K12.
In case of the activity coefficient f1 the laboratories K1, K24, K27 and K30 gave the values of the coefficient which do not correspond to the values calculated on the basis of the performed measurements of the concentration of potassium, radium and thorium. The data show that considerable differences in the values of the activity coefficient f1 uncertainty were for the laboratories no. K1, K3, K5, K10, K11, K24 and K27, and at the insignificant degree for the laboratories no. K18, K23 and K32.

109
THE EVALUATION OF THE RESULTS
The criteria for the evaluation of the proficiency of the laboratories are based upon the analysis of the deviation of the results recalculated for the accepted standard deviation from the reference value (here – the average value). The results were subject to statistical analysis using Z-test, as well as the procedures recommended by the IAEA.
Parameter Z is calculated using the formula:
valuerefresultlabZ
..
where: δ – value of the average standard deviation (rejecting questionable results).
Basing upon the parameter Z the accuracy of the results in the whole population was estimated. The evaluation of the proficiency of the laboratory is estimated as follows:
|Z| 2 satisfactory result, 2< |Z| < 3 questionable result, but acceptable, |Z| 3 result not acceptable corrective measures needed.
The evaluation of the results of the laboratories performed using the tests recommended by the IAEA allows to determine the accuracy and precision of the results. The following criteria were applied:
Accuracy of the result is satisfactory when:
labUrefUvaluerefresultlab 2258,2..
Precision of the result is satisfactory when:
%100..
22
resultlab
Ulab
valueref
Uref
is smaller or equal 16% in the case of f1 and 25% in the case of f2; where: U – measurement uncertainty.
Run A
In the case of the activity coefficient f1 two laboratories (K24 and K27) gave the
result which is not satisfactory (parameter |Z| for these laboratories was 3.22 and 3.95, respectively). Two laboratories (K3 and K11), according to the Z-test, gave questionable result, but acceptable. The |Z| value for these laboratories amounted to 2.85 and 2.02, respectively. Remaining 24 laboratories have satisfactory results.
The evaluation of the laboratory regarding the accuracy of the results of measurements of the activity coefficient f1 showed that all of the laboratories met the above criterion. The criterion for the precision of the results was not met in three cases (laboratories K12, K13, K29).

110
In the case of the activity coefficient f2 four laboratories (K5, K12, K24 and K29) gave
the questionable result, but acceptable (|Z| parameter for these laboratories was: 2.64, 2.37, 2.48 and 2.73, respectively). One laboratory (K27) reported unsatisfactory result (|Z| amounting to almost 14). Remaining 23 laboratories obtained satisfactory results (i.e. |Z| 2).
The evaluation of the laboratory regarding the accuracy of the results of measurements of the activity coefficient f1 showed that only laboratory K27 has unsatisfactory accuracy. The criterion for the precision of the results was not met for one laboratory (K13).
Run B
As many as 7 laboratories obtained unsatisfactory results in Z-test for correctness of the f1 coefficient determination – these are: K1, K3, K7, K10, K12, K24, K27. The |Z| parameter value for these laboratories fall between 3.28 (laboratory K7) and 7.80 (laboratory K27). Additionally, next 7 laboratories (K5, K6, K11, K18, K21, K23 and K32) gave questionable, but acceptable results according to the Z-test. Only 15 laboratories had satisfactory results.
The evaluation of the laboratory regarding the accuracy of the results of measurements of the activity coefficient f1 showed that only the laboratory K27 reported unsatisfactory result. The criterion for the precision of the results was not met by the laboratory K12.
As many as 14 laboratories reported unsatisfactory results when determining the activity coefficient f2 (|Z| value larger than 3) – they were laboratories:: K2, K3, K6, K9, K10, K11, K12, K13, K14, K18, K21, K24, K27 and K30. One laboratory gave unsatisfactory, but acceptable result (laboratory K7). And only 14 laboratories had the results complying with the Z-test (satisfactory results).
The evaluation of the laboratory regarding the accuracy of the results of measurements of the activity coefficient f2 revealed that two laboratories (K10 and K27) didn’t meet the above criteria. The criterion for the precision of the results was not met by the laboratory K27.
Besides the results of the inter-laboratory comparisons described above, the measurement results were also subject to the evaluation according to the requirements by the Polish Accreditation Center (PCA) – it regards, in particular, the accredited laboratories. The analysis of the |En| parameter was limited to the results from the
normal time of the measurements i.e. Run A.

111
The evaluation uses the comparison value of the En parameter calculated from the below
formula:
22
reflab
reflab
UU
xxEn
where:
labx - is the result obtained in the laboratory,
refx - is the result obtained in the reference laboratory (in case of the current
intercalibration the reference value is the average value of the measured
quantities), and labU and refU is the result uncertainty in the measuring lab
and uncertainty in the reference lab (average value uncertainty), respectively.
If |En| > 1 for any result, then the general evaluation for the result of the comparison is negative.
The analysis of the results according to the criterion |En| > 1 revealed that five laboratories should have the negative result of the intercomparison. These are laboratories no. K3, K5, K11, K24 and K27.

112
ANALYSIS AND EVALUATION OF THE RADIOACTIVITY OF RAW AND BUILDING MATERIALS USED IN POLAND IN YEARS 1980-2009
K. Isajenko, B. Piotrowska, A. Żak, J. Rychlicki, M. Kuczbajska, A. Ząbek
The systematic investigation of the natural radioactivity of raws and building
materials has been carried out in Poland since 1980. Since 1980 up to 2002 the values of the qualification coefficients f1 and f2 were
determined basing on the concentration of the isotopes of: potassium 40K, radium 226Ra and thorium 228Th using the below formula:
f1 = 0.00027 SK + 0.0027 SRa + 0.0043·STh ≤ 1 f2 = SRa ≤ 185 Bq/kg
According to the applied in radiation protection ALARA (as low as reasonable achievable) principle, it was recommended to use the maximum values of f1 and f2 coefficients:
f1 max = f1 + Δ f1 and f2 max = f2 + Δ f2 ≤ 185 Bq/kg where: SK, SRa, S Th are in Bq/kg, f1 and f2 are the measured values, Δf1 and Δf2 are the total measurement uncertainties at the confidence level of 0.95.
Since 01.01.2003 the criteria published in the Ordinance of the Council of
Ministers of 3 December 2002 and successively the Ordinance of the Council of Ministers of 2 January 2007 are applied. The Ordinance classifies the applicability of various raw and building materials in the various types of construction by the determination of the two parameters:
- the activity coefficient f1, determining the content of the natural radioactive isotopes (the indicator of the whole-body exposure to the gamma radiation).
- the activity coefficient f2, determining the content of radium 226Ra (the indicator of the exposure of the ling tissue to the alpha radiation emitted by the radon daughters inhaled with the air by the human respiratory tract).
The values of the activity coefficients f1 and f2 are defined by the formula: f1 = Sk/3000 [Bq/kg] + SRa/300 [Bq/kg] + STh/200 [Bq/kg]; f2 = SRa [Bq/kg].
where: SK, SRa and STh are the values of the concentration of the relevant radionuclides given in Bq/kg.
The limiting values of the activity coefficients f1 and f2 for the construction of dwellings are:
f1=1 and f2=200 Bq/kg
113
Simultaneously the principles of the evaluation of the materials has been changed. The measured values of f1 and f2 are considered during the evaluation, but none can exceed the limiting value by more than 20%, i.e.:
f1 ≤ 1.2 and f2 ≤ 240 Bq/kg. The total uncertainty value of the measurements has also been limited to 20% of the value of the coefficients f1 and f2, not less than 0.8 of their limiting values. The limiting values for the remaining applications in the construction industry are:
f1=2 and f2=400 [Bq/kg] regarding the industrial wastes used in surface objects constructed on the built-up areas, or designed for built-up in the local urbanization plans, or for levelling of such areas; f1=3,5 and f2=1000 [Bq/kg] regarding the industrial wastes used in surface parts of the objects not mentioned in point 2 and for levelling of the areas not mentioned in the above point; f1=7 and f2=2000 [Bq/kg] regarding the industrial wastes used in the underground parts of the objects mentioned in point 3, and the underground constructions, including railway and road tunnels, excluding the industrial wastes used in underground mining pits.
Basing upon the results of the natural radioactivity determination of raws and building materials carried out by the Central Laboratory for Radiological Protection and over 30 other measuring institutions in Poland, the national database for the measurements has been created. The database is running Since 1980 and as more than 38000 records.
The effect of changing the criteria for the determination of the applicability for
the dwelling construction was analyzed for the fly-ashes and slags, as they are the most frequently used waste materials. The comparative analysis was based on the set measurement results of 8507 ash samples containing all the needed values, thus:
- the results of the radioisotope concentration measurements, - the values of activity coefficients f1 and f2, - the values of the qualification coefficients f1 and f2 used up to 2002, - total uncertainties of their determination Δf1 and Δf2.
The evaluation of the applicability of the batch of the materials represented by the investigated samples were carried out in two versions:
A. according to the rules used between 1980 and 2002, B. according to the rules used since 2003.
The fact that more samples of fly ashes and slags met the criteria used since 2003 is surprising. It means that current criteria for the evaluation of the activity coefficients are more permissive than those used before 2003. In 1985 the Dosimetry Department of the Central Laboratory for Radiological Protection elaborated the national database containing the results of the investigations performed by the CLOR and cooperating Laboratories. Basing upon the provided data of 1980-2009 the histogram of the activity coefficients f1 and f2, and the trend of the annual average of the coefficients for the chosen materials for this period were prepared. The average values of the activity coefficients remain at the similar level for several years. The average values of the coefficients for the most widely used raws and building materials are:

114
for boiler slags since 1992: f1 amounting to about 0.9, f2 amounting to about 95 Bq/kg;
for ashes since 1996: - f1 amounting to about 1.15, - f2 amounting to about 120 Bq/kg;
for light and cellular concretes since 2000: f1 amounting to about 0.7, f2 amounting to about 80 Bq/kg;
for building ceramics since 1996: f1 amounting to about 0.65, f2 amounting to about 52 Bq/kg;
for cements since 2005: f1 amounting to about 0.3, f2 amounting to about 40 Bq/kg.
The knowledge about the annual trend of the activity coefficients f1 and f2 for the
ready-to-use materials allows the evaluation of the temporal changes of the population exposure to the ionizing radiation in dwellings, and the examination of the changes for the waste materials allows to indirectly evaluate the source of the changes.
The information stored in the database allows to identify the materials containing
particularly significant values of the natural radioactive isotope concentration e.g. potassium fertilizers, some materials used in the industry or some sorts of abrasives. The concentration of the natural radionuclides and the values of the activity coefficients f1 and f2 in the chosen raws and building materials measured in years 2003-2009 are presented in Table 2. In 2009 the results of the investigation of 1182 samples of raws and building materials provided by 12 laboratories were added to the database (the results for 2009 are still coming).
The analysis of the number of values higher than the limits for the activity coefficients f1 and f2 for dwellings and public constructions in years 1980-2009 shows that:
- the trend of the average values of the activity coefficients f1 and f2 remains constant for the last years.
- 100 % of the raws of natural origin and ready-to-use building materials (i.e. cement, cellular concrete, building ceramics) can be applied to dwellings construction.
- in case of the raws of industrial origin the best activity coefficient values have: - gypsum (100 % of the investigated samples can be applied in dwellings
construction), - ash aggregate (98.4 %), - blast-furnace slag (97.8 %), - power-plant slag (94.3 %).
- the least applicability for dwellings construction among the raws of industrial origin is for copper-smelt slag (only 1.3 % of the total amount of samples can be applied in dwellings construction).
115
- the obligatory control of the raws and building materials assures the use of harmless (form the radiological protection point of view) materials for the public.
Other major activities performed by the Laboratory in the frame of the Dosimetry Department in 2009 are:
1. The investigation and elaboration of the radiological conditions for the ash dump of the Żerań Power and Heat Plant at Myśliborska Street in Warszawa;
2. The investigation and elaboration of the radiological conditions for the blast-furnace waste dump of the Siekierki “Zawady” Power and Heat Plant in Warszawa;
3. The Laboratory took part in: - XVIth International Conference “Ashes form the Energetics”
(presentation and poster: „Natural Radioactivity of Wastes”); - Scientific picnic;
4. 73 opinions on the applications of the materials represented by the samples from various regions of Poland were issued.

116
MONITORING OF 137Cs CONCENTRATION IN SOIL, 2008-2009
Krzysztof Isajenko, Barbara Piotrowska, Magdalena Kuczbajska, Adam Ząbek This project was supported by the National Environmental Protection and Water Management Fund.
The investigations of radioactive contaminations of soil are performed in the frame of Polish National Environmental Monitoring System. The soil sampling is carried out at the premises of the network of meteorological stations of the Institute of Meteorology and Water Management.
The results of the measurements of soil samples are used for the all-country computerized radiological data base and for preparation of radiological maps of Poland produced in MapInfo 8.0 PL system. This system visualizes results of the investigation at the sampling points as circle cartodiagrams or extrapolates results of the point measurements to the whole area of Poland.
In the 254 points soil samples were collected to determine concentration of the caesium 137Cs and natural radionuclides (radium 226Ra, actinium 228Ac and potassium 40K) by means of the spectrometric analysis.
In each point the samples of soil were taken in October 2008 with a knife-edge pipe of 7 cm diameter from the 10 cm thick surface layer at six places, at the circumference of the circle of 2 m radius, and in the centre of the circle. The measurements of radionuclide concentrations in soil samples were made using spectrometers with HPGe detectors, located in low-background lead shielding houses. The time of each measurement was 80000 s.
The mean value of 137Cs deposition density in Poland is 2.10 kBqm-2, ranging from 0.02 to 26.79 kBqm-2. The radiological map of 137Cs deposition density (raster map) is presented in Fig.1. Such distribution of 137Cs was mainly due to the weather conditions - in particular rainfall - in Poland in May 1986, i.e. in the period immediately after the Chernobyl accident. All results refer to soil samples taken in October 2008.
The mean values of concentrations of natural radionuclides in soil in Poland are:
for 226Ra - 25.8, for 228Ac - 24.3 and for 40K – 416 Bqkg-1, i.e. lower than the mean world concentrations of 33, 45 and 420 Bqkg-1, respectively [1].
The highest mean concentrations of 226Ra and 228Ac occur in the southern parts of Poland, depending on the geological structure of the country. For instance in a soil sample taken in Szklarska Poręba the concentrations are: 143,2 Bqkg-1 of 226Ra and 125,0 Bqkg-1 of 228Ac.

117
Fig. 1. 137Cs deposition in the 10 cm surface layer of soil in Poland, in October 2008 REFERENCES [1] United Nations Scientific Committee on the Effects of Atomic Radiation: Sources and Effects of Ionizing Radiation. United Nations , New York, 2000.
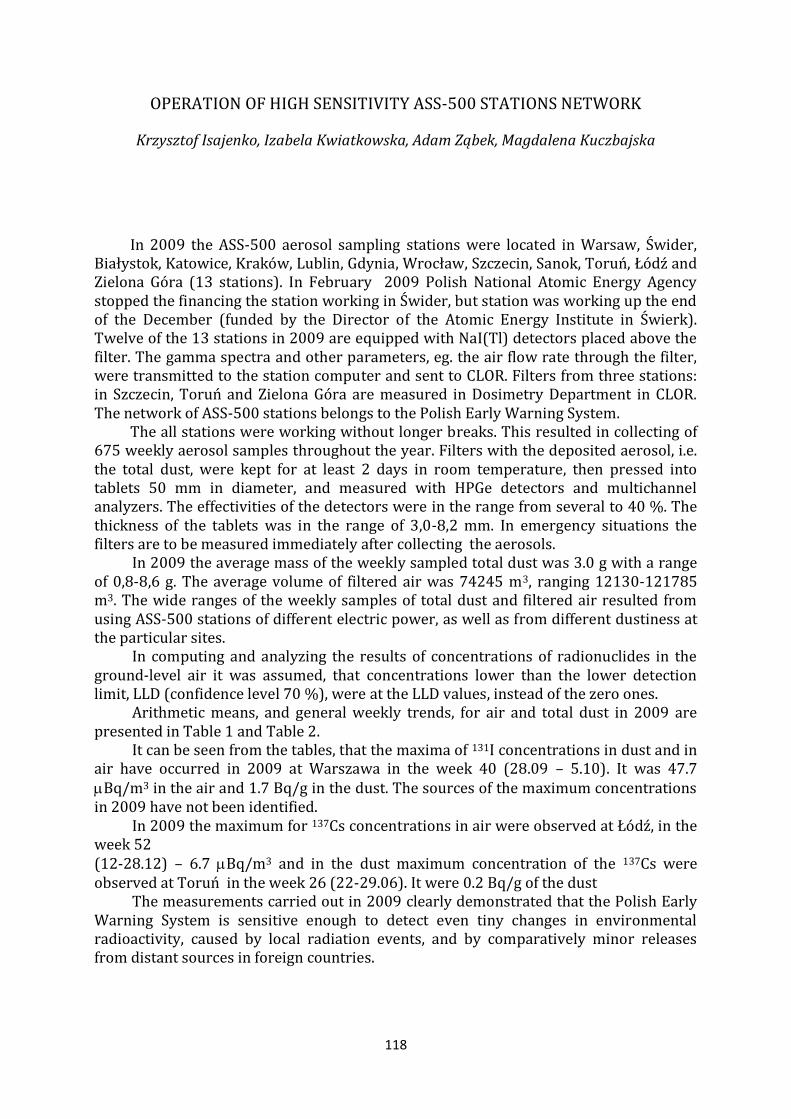
118
OPERATION OF HIGH SENSITIVITY ASS-500 STATIONS NETWORK
Krzysztof Isajenko, Izabela Kwiatkowska, Adam Ząbek, Magdalena Kuczbajska
In 2009 the ASS-500 aerosol sampling stations were located in Warsaw, Świder, Białystok, Katowice, Kraków, Lublin, Gdynia, Wrocław, Szczecin, Sanok, Toruń, Łódź and Zielona Góra (13 stations). In February 2009 Polish National Atomic Energy Agency stopped the financing the station working in Świder, but station was working up the end of the December (funded by the Director of the Atomic Energy Institute in Świerk). Twelve of the 13 stations in 2009 are equipped with NaI(Tl) detectors placed above the filter. The gamma spectra and other parameters, eg. the air flow rate through the filter, were transmitted to the station computer and sent to CLOR. Filters from three stations: in Szczecin, Toruń and Zielona Góra are measured in Dosimetry Department in CLOR. The network of ASS-500 stations belongs to the Polish Early Warning System.
The all stations were working without longer breaks. This resulted in collecting of 675 weekly aerosol samples throughout the year. Filters with the deposited aerosol, i.e. the total dust, were kept for at least 2 days in room temperature, then pressed into tablets 50 mm in diameter, and measured with HPGe detectors and multichannel analyzers. The effectivities of the detectors were in the range from several to 40 %. The thickness of the tablets was in the range of 3,0-8,2 mm. In emergency situations the filters are to be measured immediately after collecting the aerosols.
In 2009 the average mass of the weekly sampled total dust was 3.0 g with a range of 0,8-8,6 g. The average volume of filtered air was 74245 m3, ranging 12130-121785 m3. The wide ranges of the weekly samples of total dust and filtered air resulted from using ASS-500 stations of different electric power, as well as from different dustiness at the particular sites.
In computing and analyzing the results of concentrations of radionuclides in the ground-level air it was assumed, that concentrations lower than the lower detection limit, LLD (confidence level 70 %), were at the LLD values, instead of the zero ones.
Arithmetic means, and general weekly trends, for air and total dust in 2009 are presented in Table 1 and Table 2.
It can be seen from the tables, that the maxima of 131I concentrations in dust and in air have occurred in 2009 at Warszawa in the week 40 (28.09 – 5.10). It was 47.7 Bq/m3 in the air and 1.7 Bq/g in the dust. The sources of the maximum concentrations in 2009 have not been identified.
In 2009 the maximum for 137Cs concentrations in air were observed at Łódź, in the week 52 (12-28.12) – 6.7 Bq/m3 and in the dust maximum concentration of the 137Cs were observed at Toruń in the week 26 (22-29.06). It were 0.2 Bq/g of the dust
The measurements carried out in 2009 clearly demonstrated that the Polish Early Warning System is sensitive enough to detect even tiny changes in environmental radioactivity, caused by local radiation events, and by comparatively minor releases from distant sources in foreign countries.
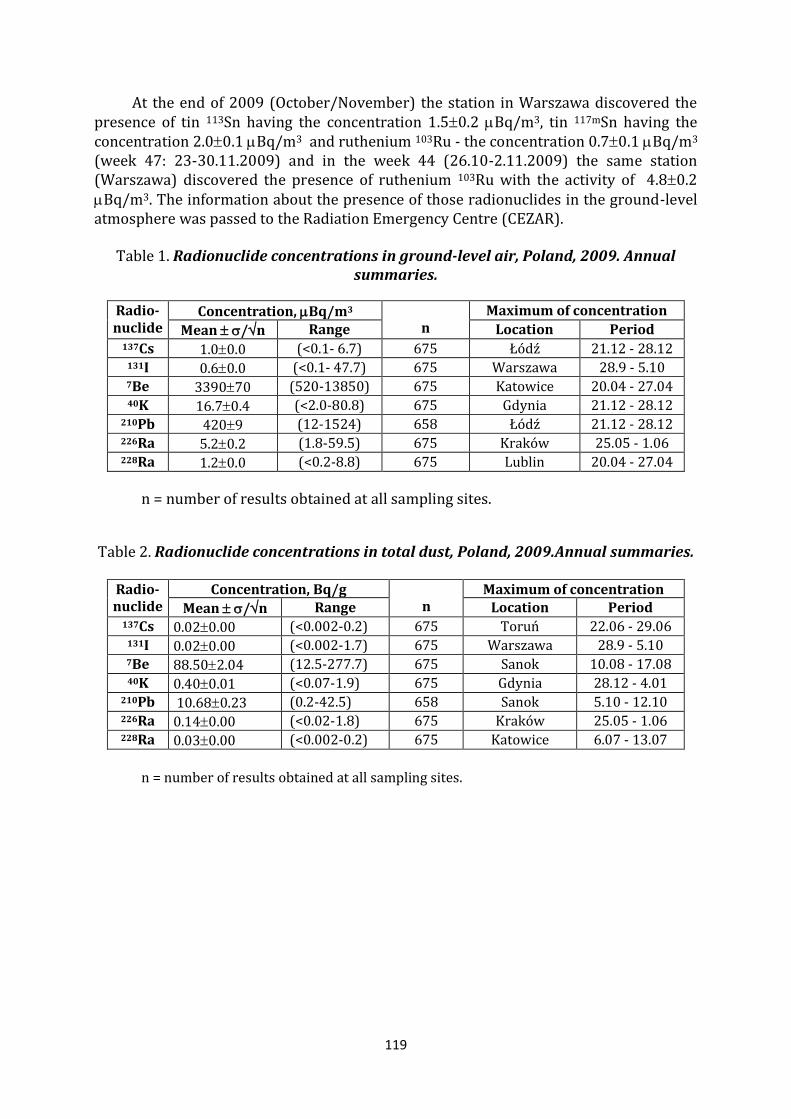
119
At the end of 2009 (October/November) the station in Warszawa discovered the presence of tin 113Sn having the concentration 1.50.2 Bq/m3, tin 117mSn having the concentration 2.00.1 Bq/m3 and ruthenium 103Ru - the concentration 0.70.1 Bq/m3 (week 47: 23-30.11.2009) and in the week 44 (26.10-2.11.2009) the same station (Warszawa) discovered the presence of ruthenium 103Ru with the activity of 4.80.2 Bq/m3. The information about the presence of those radionuclides in the ground-level atmosphere was passed to the Radiation Emergency Centre (CEZAR).
Table 1. Radionuclide concentrations in ground-level air, Poland, 2009. Annual
summaries.
Radio- nuclide
Concentration, Bq/m3 n
Maximum of concentration
Mean /n Range Location Period 137Cs 1.00.0
(<0.1- 6.7)
675
Łódź 21.12 - 28.12
131I 0.60.0
(<0.1- 47.7)
675
Warszawa 3
28.9 - 5.10 4 7Be
339070
(520-13850)
675
Katowice 20.04 - 27.04
40K 16.70.4
(<2.0-80.8)
675
Gdynia 21.12 - 28.12 210Pb 4209
(12-1524)
658
Łódź 21.12 - 28.12
226Ra 5.20.2
(1.8-59.5)
675
Kraków 25.05 - 1.06 228Ra 1.20.0
(<0.2-8.8)
675
Lublin 20.04 - 27.04
5
n = number of results obtained at all sampling sites.
Table 2. Radionuclide concentrations in total dust, Poland, 2009.Annual summaries.
Radio- nuclide
Concentration, Bq/g n
Maximum of concentration
Mean /n Range Location Period 137Cs 0.020.00 (<0.002-0.2)
675
Toruń 22.06 - 29.06
131I 0.020.00
(<0.002-1.7)
675
Warszawa 28.9 - 5.10 6 7Be 88.502.04 (12.5-277.7)
675
Sanok
7 10.08 - 17.08
8 40K 0.400.01
(<0.07-1.9)
675
Gdynia 28.12 - 4.01 9 210Pb 10.680.23
(0.2-42.5)
658
Sanok 5.10 - 12.10 226Ra 0.140.00
(<0.02-1.8)
675
Kraków 25.05 - 1.06 10 228Ra 0.030.00
(<0.002-0.2)
675
Katowice 11
6.07 - 13.07 12
n = number of results obtained at all sampling sites.

120
SCIENTIFIC AND TECHNICAL
REPORTS
2009
TRAINING & INFORMATION
DEPARTMENT
toron 3,2% 0,101 mSv
radon 1,201 mSv
promieniowanie gamma 0,462 mSv
wewnętrzne 0,277 mSv
promieniowanie kosmiczne 0,284 mSv
diagnostyka medyczna 26,6% 0,850 mSv
14,
27,
37,
8 8,

121

122
TRAINING, INFORMATION AND STANDARDIZATION
Janusz Henschke, Maria Zielonka
Central Laboratory for Radiological Protection serves as a center for training in radiation protection, Scientific and Technical Information Centre and as the Secretariat of the Committee for the Radiological Protection Standardization. RADIATION PROTECTION TRAINING CLOR organizes systematic training of persons who intend to gain qualifications needed for work with ionizing radiation. For this aim in 2009 were organized courses for radiation protection inspectors (qualifications type IOR-0, IOR-1 and IOR-3), for operators of accelerators used for other than medical purposes (A-A type), for operators of accelerators used for medical purposes and of teletherapy equipment (S-A type) and for operators of equipment for brachytherapy with radioactive sources (S-Z type). The numbers of persons trained in 2009 for different type authorizations are shown in Table 1.
Table 1. Number of persons trained in 2009
Type IOR-0, IOR-1 and IOR-3 A-A, S-A and S-Z together Number of authorizations 113 47 160
SCIENTIFIC AND TECHNICAL INFORMATION CENTRE
The Center of Information is involved in publication of scientific reports, guides, training materials, popular papers on radiation protection, and in exchange of materials between information centers in Poland and abroad. The Center library contains 5793 volumes. The library is a subscriber of 11 journals. In 2009 the Scientific and Technical Information Centre of CLOR provided about 1200 consultations and information for mass media, governmental, municipal, scientific and private institutions, and for members of public. SECRETARIAT OF THE COMMITTEE FOR RADIOLOGICAL PROTECTION STANDARDIZATION
In 2009 the Secretariat of the Committee for Radiological Protection Standardization prepared for publication the following standards:
- PN-ISO 18589-1 „Measurement of radioactivity in the environment – Soil – Part 1: General guidelines and definitions”
- PN-ISO 18589-2 „Measurement of radioactivity in the environment – Soil – Part 2: Guidance for the selection of the sampling strategy, sampling and pre-treatment of samples”
Official opinion on the drafts of ISO standards were prepared.

123
NATIONAL CONTACT POINT ON EUROPEAN PLATFORM ON TRAINING AND EDUCATION IN RADIATION PROTECTION At the end 2006 in Central Laboratory for Radiological Protection by approval of President of National Energy Agency has been established the National Contact Point on European Platform on Training and Education in Radiation Protection (EUTERP). The main objectives of Platform are:
- to remove obstacles for mobility of Radiation Protection Experts within the European Union through harmonisation of criteria and qualifications for mutual recognition of such experts
- to facilitate the transnational access to vocational education and training - to better integrate education and training into occupational radiation protection
infrastructures in the Member, Candidate and Associates States of the European Union.
The national contact point plays a co-ordinating role between the various Platform participants within a country. This point harmonises the national education and training framework with present requirements in European countries. It implies the close collaborations with EC various education centres to update existing knowledge and to impart sufficient and competent information.

124
ANNUAL EFFECTIVE DOSE (2009)
Janusz Henschke
The population of Poland is at present subject to ionizing radiation from natural and artificial sources at levels not much different from those in other European countries. Ionizing radiation of natural origin consists of cosmic radiation and radiation of natural radionuclides present in the environment and in various types of products and materials such as building materials, food, water and air. Man-made ionizing radiation consists of radiation used in medical diagnostics and, to a much lesser extent, of radiation emitted by radioactive fallout from former nuclear tests and from accident in nuclear power plant in Chernobyl. The average annual effective dose from natural and man-made sources, estimated according to the recommendation of UNSCEAR 2000*), amounted in 2009 to 3,19 mSv for the statistical inhabitant of Poland. The most considerable contribution to this value, 73% (2,33 mSv/year), is from radiation of the natural radionuclides. Among them the highest individual dose arises from radon exposure 1,20 mSv (37,6%). Cosmic radiation contributes only 0,28 mSv (8,5%). The man-made sources contribute to the average annual effective dose about 0,87 mSv/year, i.e. 27%, most of which comes from ionizing radiation used in medical diagnostics (0,85 mSv/year or 26,6% ). The average annual effective doses for inhabitants of Poland from various sources of radiation are shown in Figures 1 and 2. The annual dose limit for public exposure according to regulations is 1 mSv. This dose limit does not include irradiation from cosmic rays and from natural radioactive elements presented in the environment or in human organism in physiological conditions. The investigations carried out by the Central Laboratory for Radiological Protection allow to estimate the value of the annual effective dose, caused by radiation of man-made sources (excluding medical exposure), for an statistical inhabitant of Poland in 2009 to be 0,016 mSv. This value contains the dose due to external gamma radiation and the dose from radiation of radionuclides incorporated to the body through alimentary and respiratory tracts. Comparing the value of 0,016 mSv to the annual dose limit for public (1 mSv) and to the average effective dose ( 3,19 mSv ) can be stated that in 2009 this value reached 1,6% of the dose limit and 0,5% of the average annual effective dose to which the statistical inhabitant of Poland was exposed.
________________________ *)United Nations Scientific Committee on the Effects of Atomic Radiation: Sources and Effects of Ionizing Radiation. United Nations, New York, 2000.
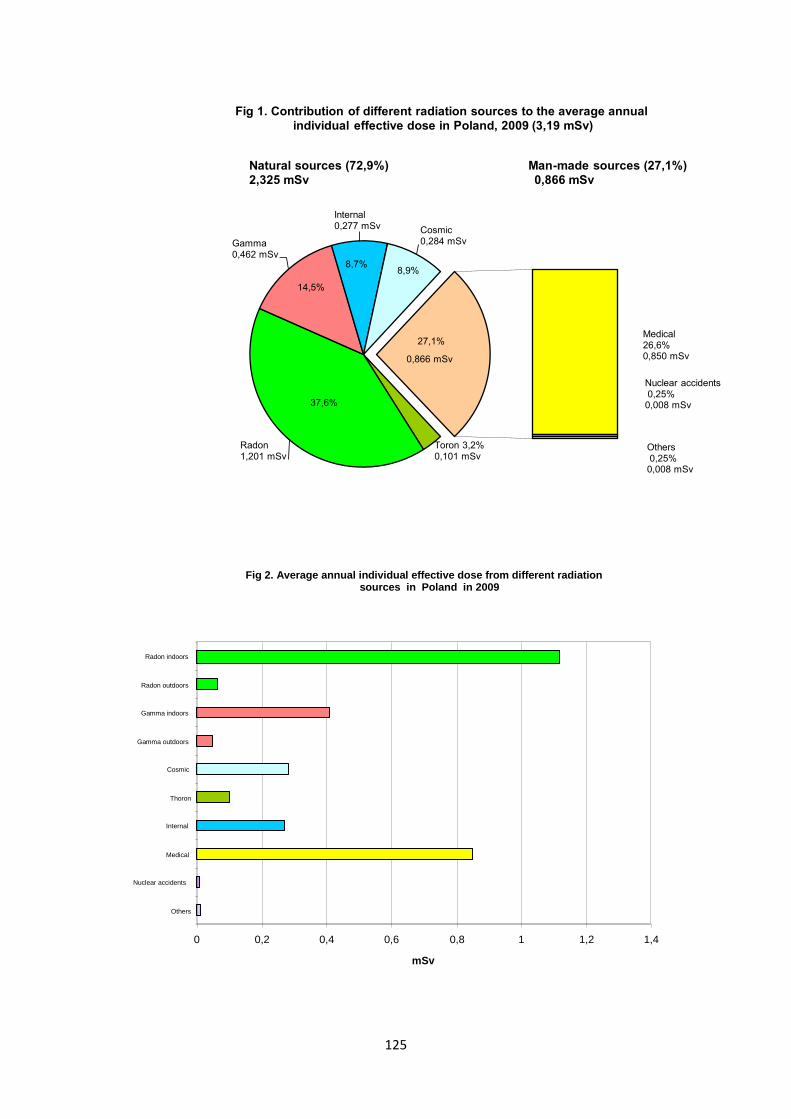
125
Fig 2. Average annual individual effective dose from different radiation
sources in Poland in 2009
0 0,2 0,4 0,6 0,8 1 1,2 1,4
Others
Nuclear accidents
Medical
Internal
Thoron
Cosmic
Gamma outdoors
Gamma indoors
Radon outdoors
Radon indoors
mSv
Toron 3,2% 0,101 mSv
Radon 1,201 mSv
Gamma 0,462 mSv
Internal 0,277 mSv Cosmic
0,284 mSv
Medical 26,6% 0,850 mSv
Nuclear accidents 0,25% 0,008 mSv
Others 0,25% 0,008 mSv
Fig 1. Contribution of different radiation sources to the average annual
individual effective dose in Poland, 2009 (3,19 mSv)
14,5%
27,1%
37,6%
8,7% 8,9%
Natural sources (72,9%) Man-made sources (27,1%)
2,325 mSv 0,866 mSv
0,866 mSv

126
SCIENTIFIC AND TECHNICAL
REPORTS
2009
DEPARTMENT OF
PERSONNEL MONITORING &
CALIBRATION

127
DRAWING UP METHODOLOGY ESSENTIAL TO START THE BETA SECONDARY
STANDARD TYPE 2 (BSS 2)
Krzysztof Ciupek
Calibration Laboratory in the Central Laboratory for Radiation Protection is
owner of BSS 2 -Beta Secondary Standard Type 2, which has been produced by GSA
Global GmbH. The source set consist of three β--radioactive sources:
1. Pm-147 with the mean beta particle energy of 0,06MeV
2. Kr-85 with the mean beta particle energy of 0,24MeV
3. Sr-90/Y-90 with the mean beta particle energy of 0,8MeV
Running the BSS 2 required correct connecting of all elements and installing the
latest version of correction factors and parameters provided by Physikalisch-Technische
Bundesanstalt (Germany). The system and its methodology is fully in line with the
requirements included in the ISO 6980. BSS 2 set was measured from the point of view
of radiation protection of the personnel. The assessment of the dose equivalent for the
hands of worker whom is carrying Kr-85 source holder out of the container and
mounting it on the source stand is less than 50nSv during this action. All of the
dosimetric measurements in the environment of workplace served for preparing the
Measuring Procedure and the Operation Manual of the BSS 2 to be in accordance with
the requirements of the radiological protection principles.
In accordance with the subject of work, test of personal dosimeters and a dosimetric
instrument calibration for the beta radiation were made. To this purpose film and
thermoluminescent dosimeters were used. Both types of dosimeters were irradiated by
the beta or mixed (beta and gamma) sources (see Table 1. and Table 2.)
Table 1. Personal dose equivalent values of the film dosimeters exposed
at the beta or mixed (beta and gamma) radiation field.
Lp. Source Reference value[mSv]1) Readout value[mSv]2)
Hp(0,07) Hp(10) Hp(0,07) Hp(10)
1 Sr-90 & Cs-137 10 0,5 8,9 0,4
2 Kr-85 & Co-60 10 0,5 9,8 0,4
3 Kr-85 & Cs-137 5 0,5 4,8 0,7
4 Kr-85 0,5 - 0,3 -
5 Kr-85 & Cs-137 0,5 0,5 0,7 0,4
6 Sr-90 0,5 - 0,4 - 1) uncertainty ± 5%

128
2) uncertainty ± 22%
Table 2. Personal dose equivalent values of the thermoluminescent dosimeters
exposed at the beta or mixed (beta and gamma) radiation field.
Lp. Source
Reference value[mSv]1) Readout value[mSv]2)
Hp(0,07) Hp(10) Hp(0,07) Hp(10)
1 Kr-85 0,5 - 0,5 -
2
Kr-85 & Cs-137
2,0 5,0 1,7 5,1
3 2,0 1,0 2,1 1,0
4 1,0 0,5 0,9 0,5
5 1 ,0 3,0 0,6 3,0 1) uncertainty ± 5% 2) uncertainty ± 30%
Test of calibration of a dosimetric instrument were carried out on the SmartION.
Response, ratio of the measured value to the reference value, of this instrument given by
the producer is 1,05 for beta radiation from Pm-147 source while CLOR result is 1,02.
Test measurements of the dose and dose rate carried out on the BSS 2 shows
correctness of applied methodology of irradiation by the beta-particle sources. Presence
work is concerned on the uncertainty budget and extension of the Laboratory
accreditation given by Polish Centre for Accreditation for Beta Secondary Standard
stand.
To achieve this purpose, continuing measurements with dosimeters and dosimetric
instruments and participation in an interlaboratory comparison is necessary.

129
PERSONNEL MONITORING CARRIED OUT BY CLOR IN YEARS 2008 AND 2009
Marek Wasek1, mgr Grażyna Krajewska, mgr Kamil Szewczak
1Medical University of Warsaw, Department of Drug Bioanalysis and Analysis
In CLOR Personnel Monitoring Laboratory, in 2008y were monitored over 3900 workers
occupationally exposed to external radiation. In 2009 number of monitored workers increased to
4500 persons.
In the years 2008 and 2009 it were adequately workers:
- scientific facilities 733 and 895 persons
- industrial facilities 919 and 895 persons
- medical facilities 1302 and 1809 persons
- other 733 and 8500 persons
The measurement of individual doses for photon and beta radiation was carried out by two
methods. First based on film dosimeters and second based on a thermoluminescent detectors. The
measurement period was essentially one or three months.
Results of monitoring show that in 2008y as well as in 2009y about 90% of effective doses,
estimated from all Hp(10) indications, were below measurement method threshold (<0,20 mSv). It is,
below 1% of annual dose limit 20mSv. An over exposure of annual dose limit was stated for only
0.1% estimations in 2008y and 0.07% in 2009y. It was 21 cases in 2008y and 12 cases in 2009y.
In this two years monitoring period, almost all skin equivalent does, estimated from Hp(0.07)
indications, were below 1% of annual dose limit 500 mSv. Only in 2009y two doses were in range 50
– 150 mSv, it is in range of 10 – 30% of annual dose limit.

130
More detailed measurements results in scientific, industrial, medical and other facilities are
shown in Tables 1 – 4.
Table 1 Number of Hp(10) indications in respective dose ranges in different types of facilities. 2008 year.
Measurement
method
Facility type Effective dose [mSv] Total
<0,2 0,2÷0,6 >0,6÷20 >20
Photometric Scientific 2643 206 83 6 2938
Industry 3383 233 58 1 3675
Medical 4416 696 89 2 5203
Other 2687 121 44 0 2852
Total 13129 1256 274 9 14668
TLD Medical 585 221 12 818
Table 2 Number of Hp(0.07) indications in respective dose ranges in different types of facilities. 2008 year.
Measurement
method
Facility type Equivalent dose [mSv] Total
<0,2 0,2÷0,6 >0,6÷20 >20
Photometric Scientific 0 7 7 0 14
Medical 0 60 22 0 82
Total 0 67 29 0 96
Table 3 Number of Hp(10) indications in respective dose ranges in different types of facilities. 2009 year.
Measurement
method
Facility type Effective dose [mSv] Total
<1 1÷6 >6÷20 >20
Photometric Scientific 3353 181 20 0 3554
Industry 3289 54 7 3 3355
Medical 3907 32 3 2 3944
Other 3199 48 1 0 3248
Total 13748 315 31 5 14099
TLD Scientific 106 12 5 3 126
Industry 32 0 0 0 32
Medical 3408 144 24 4 3580
Other 206 0 0 0 206
Total 3752 156 29 7 3944
Table 4 Number of Hp(0.07) indications in respective dose ranges in different types of facilities. 2009 year.
Measurement
method
Equivalent dose [mSv] Total
<50 50÷150 150÷500 >500
TLD 853 2 0 0 855

131
CALIBRATION OF DOSIMETRIC INSTRUMENTS USED FOR RADIOLOGICAL PROTECTION IN 2009
Krzysztof Ciupek Secondary Standard Dosimetry Laboratory (SSDL) in the Central Laboratory for Radiological Protection has got accreditation certificate since 2003 to calibrate individual and environmental radiation measurement instruments. Frequency of calibration is given by a decree ‘Dz. U. z 2002r. Nr 239, poz. 2032’ according to which each dosimetric instrument has to be calibrated not less than:
- once in a 12 months – in case of having control radiation source, - once in a 24 months – in case of not having control radiation source.
Calibration in gamma radiation scope take place on the two stands: GAMMA-1 and GAMMA-2. The former stand has 3 sources: Co-60, Cs-137 and Am-241. Instruments on this stand are calibrated in the range1) to:
- 6 000μGy/h for Co-60 - 100 000μGy/h for Cs-137 - 20μGy/h for Am-241
The latter stand has 8 sources of Co-60 and 5 sources of Cs-137. Instruments on this stand are calibrated in the range2) to:
- 200μGy/h for Co-60 - 4 000μGy/h for Cs-137
Corresponding standard values are obtain by: - distance between source and instrument, - choice of source with suitable activity (for GAMMA-2) - using absorbers (for GAMMA-1).
In the DSSL, surface contaminations measurement instruments are also calibrated. Three β--radioactive sources are used (C-14, Cl-36, Sr-90) and one α-radioactive – Am-241. In 2009 Laboratory received 705 contracts for calibration of more than 50 types of instruments. 140 calibrations were made for surface contaminations measurement instruments. 583 certificates and 17 unserviceable protocols were made out. Most often calibrated:
- instruments were RK-67, EKO-C and RKP-1, - individual dosimeters were ISOTRAK and STEPHEEN, - instruments with ionization chamber were EKO-K, RGD and VICTOREEN, - instruments with proportional counter was FH, - sondes with scintillation counter were SSU and SGB-D.
Approximately 90% calibrated instruments in SSDL had Geigera-Müllera counter.
1) and 2) values related to kerma rate in the air

132
MAINTENANCE OF THE QUALITY MANAGEMENT SYSTEM AT THE RADON DOSIMETRY LABORATORY
Olga Stawarz, Katarzyna Wołoszczuk, Kalina Mamont-Cieśla
1. Introduction In the frame of the contract between CLOR and National Atomic Agency (PAA) No
5/SP/2009 entitled „Maintenance of the dosimetric devices quality system” the Radon Dosimetry Laboratory (PDR) was obliged to realize four tasks contained in the third chapter of the contract and concerning the management system in the scope of calibration of radon detectors and devices and radon progeny devices. Below the realization of these tasks are shortly described.
2. Technical supervision and maintenance of the chamber and its equipment
The periodic checking and comparative measurements of the following devices were conducted: - Radon Progeny Particle Size Spectrometer (RPPSS Mk-2) - background, flow rates and
efficiency of alpha particles counting in each of 5 channels. It is a working standard for calibration of radon progeny devices
- WL Meter model TN-WL-02 No S 39812-763 -monitor by Thomson/Nielsen firm – counting for the control source and flow rate
- Radon monitors AlphaGUARD PQ 2000: S/N EF 0843 (AG1) – working standard and AlphaGuard PQ 2000 PRO S/N EF 1103 (AG2) – reference standard for calibration of radon detectors and devices.
All results of the checked parameters and comparisons were in conformity with expected values (the previous results) and satisfactory.
3. Internal and external audits
On the February 4th 2009 a management review with the director of CLOR and technical and quality managers was held. The annual report on the activities at the Radon Dosimetry Laboratory was presented and last year reports of the PCA auditors were discussed.
Four internal audits, two on the management system and two technical, were performed. Protocols of observations and nonconformities and reports of audits were prepared. Suitable corrections were introduced in documents and the corrective and preventive actions were carried out. Then the auditors were notified about the realization of their requirements.
On November 20, 2009 an assessment of the Polish Accreditation Center - performed by an auditor dr ing. Magdalena Nowak on the basis of the documents review

133
- took place. The results of the assessment didn’t come to the CLOR before the end of 2009.
4. Improving of the management system at the Radon Dosimetry Laboratory
Improving of the management system concerned two groups of activities. One was
connected with the preparation to the fusion of two accredited laboratories: Radon Dosimetry Laboratory and Dosimetric Secondary Standards Laboratory and required changes in documents and training of personnel. The other was directed on the improving of the technical aspects of calibration which is described below.
4.1. Improving of the calibration methods 4.1.1. An air cleaner was installed in the radon chamber to make possible a quick
reduction of the aerosol concentration and owing to that quick receiving very low equilibrium factor F (<0.01).
4.1.2. On the outside of the chamber a rotameter was applied in the closed circuit of the air flow to make possible a continuous check of the flow rate during work of the spectrometer RPPSS. It is especially important for the continuous mode of work, which is on general long-lasting.
4.1.3. Investigations proving even distribution of the radon concentration in the chamber to convince the technical PCA auditor that despite about 9 times higher specific gravity of radon than of air there is no a gradient of radon concentration in the chamber. In this purpose comparison of two AlphaGUARD monitors (AG1 and AG2) readings were performed. First they were located side by side at the same level and the ratio AG1/AG2 was equal to 0.96 (the mean of 166 hours). Then AG1 was located on the floor and AG2 under the ceiling and the ratio AG1/AG2 was equal to 0.97 (the mean of 15 hours). The radon concentration was very high (ca. 40 000Bq/m3) and there was no stirring. The inner height of the chamber is 199 cm. (Fig.1).
Fig.1. The time courses of radon concentration in the chamber - readings of two AlphaGUARD monitors: AG1 located on the floor and AG2 - under the ceiling, no stirring of air in the chamber.

134
4.2. System of keeping the radon concentration in the chamber at a stable level
For a calibration of some radon detectors (e.g. charcoal detectors) it is important to keep reference radon concentration at a stable level. Such a system has been designed and investigated at the Radon Dosimetry Laboratory. Diagram of it is shown in the Fig.2. The system is based on the applying of the continuous pumping through a radon generator, a three way connector (of “fork” type) and two adjustable rotameters: rotameter1 (r1) leading part of the radon from the generator to the chamber and rotameter 2 (r2) leading the rest of the radon outdoors. It makes possible to deliver to the chamber some portion k=r1/(r1+r2) radon from the source. The portion is adjusted by rotameter 1. The other portion of radon is rejected over the roof of the building.
Fig. 2. „Fork” mode of feeding the chamber with radon. The relation between Amax, factor k and A0 can be given by the equation:
Amax*(1- e-Rn*t )*k + A0*e-1*t =A0 this gives rise to:
)1(*
1*
max
*1
0 tRn
t
teA
eAk
(1)
where: Amax – the maximal radon concentration in the chamber corresponding to the activity
of radium in the source:
10 500 Bq/m3 for the source of 137 kBq and 39 000 Bq/m3 for the source of 502
kBq/m3 A0 – the expected stable concentration
λRn – the decay constant of radon 0.00755 h-1
λ1 – the disappearance constant of radon in the chamber (decay plus escape through
leaks) k = r1/(r1+r2)where r1 and r2 – flows through rotameters r1 and r2, respectively.
In the Fig.3 there is an example of the stable radon concentration for k=0.38 and λ1=0.0082 h-1 during ca. 70 hours.

135
Fig.3. The time course of the radon concentration in the „fork” mode of the feeding the
chamber with radon (mean 3 761 Bq/m3) and a natural radon decay curve.
The disappearance constant of radon in the chamber corresponds to two reasons of the disappearance: natural decay and leakiness of the chamber. The leakiness of the chamber depends on devices connected to the chamber outside such as: the pump for RPPSS, the generator of aerosols TSI, the counter of the neutral condensation nuclei RICH100 and so on. If there is no devices connected outside of the chamber the disappearance constant λ 1 equals to 0.0082. Such a situation takes place during
calibrations of radon detectors and devices. In the Table 1. there are, experimentally defined, the disappearance constants for various devices connected to the chamber outside. The devices are used during calibrations of devices for radon progeny (potential alpha energy) concentration.
Table 1. Disappearance constants of the radon concentration in the chamber for various devices connected outside of the chamber.
λRn=0,00755 h-1 λ1 [h-1] No outside devices 0.0082 Aerosol generator TSI in the open circuit 0.0161 Aerosol generator TSI in the closed circuit 0.0173 Radon Progeny Particle Size Spectrometer RPPSS Mk-2 0.0229 RPPSS Mk-2 + TSI 0.0245 Counter of condensation nuclei RICH100 + RPPSS Mk-2 + TSI 0.0528
For the specific configuration of connection, expected value of the stable
concentration A0 will be received for the coefficient k calculated from the equation (1).
0
500
1000
1500
2000
2500
3000
3500
4000
4500
0 10 20 30 40 50 60 70 80
[Bq
/m3]
Time [hours]
"Fork mode"
Mean
Natural decay

136
4.3. Participation in the international intercalibration of passive methods Every year the Radon Dosimetry Laboratory participates in the international
intercalibration of passive methods organized by the National Institute of Radiological Sciences (NIRS), Chiba, Japonia. In the 2008/2009 year series two methods were submitted: own method of track detectors in cups of the NRPB/SSI type and a commercially available method of E-PERM system electrets. There were two expositions characterized in the Table2.
Table 2. Characteristic of two comparison experiments in NIRS, Japan.
Reference radon concentration
(Cref Cref) [kBq/m3 ]
Duration of exposition [h]
Exposition [kBq
h/m3]
I LOW 0.96 ± 0.10 100 96± 10
III HIGH 9.30 ± 0.49 119 1107± 58
For an estimation of the range of the compliance with the reference value a coefficient PD= (Clab-Cref)/Cref*100% and a criterion PD %20 were accepted.
In the Table 3 the results of the coefficient PD for CLOR’s methods are given. Tabela 3. Values of the PD coefficients for two methods of the Radon Dosimetry Laboratory.
Exposition Detectors CR-39 Electrets
I LOW 12% 5% III HIGH 13% 3%
Both methods submitted by PDR got very good compliance with the reference
values in two experiments (all coefficients PD are significantly lower than 20%). Overall results are shown in Fig. 4.

137
Fig. 4. Overall results of the Japanese 2008/2009 intercalibrations. Participant codes of PDR’s methods: K1- CR-39 detectors and K2-electrets. 4.4. National intercalibration of CR-39 track detector methods
In 2009 the Radon Dosimetry Laboratory organized an intercalibration of CR-39 track detector methods for the Polish institutions set up in the Radon Centre (non-governmental organization). Six institutions (seven methods) participated in three comparative experiments:
- Medical University in Białystok - Central Mining Institute in Katowice - Institute of Nuclear Physics PAN in Kraków - Central Laboratory for Radiological Protection (KfK cups) in Warszawa - Central Laboratory for Radiological Protection (SSI cups) in Warszawa - Institute of Occupational Medicine in Łódź - Wrocław University Technology in Wrocław Three expositions were performed: 20413, 43027 and 74046 kBq h/m3.
Each participant have sent 20 detectors: 5 for each exposition plus 5 for the transport and storage background.

138
Fig. 5. Photo of the cups with CR-39 detectors being exposed in the CLOR’s chamber.
The CLOR’s intercalibration is described in an article entiled “Intercomparison of
radon CR-39 detector systems conducted in CLOR’s calibration chamber” published in Nukleonika 2010;55(4):589-593.
139
THE ASSURANCE AND MAINTENANCE OF THE QUALITY SYSTEM AT THE CALIBRATION LABORATORY - SECONDARY STANDARD DOSIMETRY
LABORATORY (DLWW) FOR THE PURPOSES OF RADIOLOGICAL PROTECTION
Kamil Szewczak
In 2008 in the Calibration Laboratory – Secondary Standard Dosimetric Laboratory in
purpose of assurance and maintenance of Quality System adequate task had been
performed (in the chronologically direction):
11. Carry out the corrective actions and analyse of the observations noted during
external audit in 2007
12. External audit supervised by PCA auditors
13. Pass on the PCA the propositions of the corrective actions
14. Carry out the proposed corrective actions
15. Carry out a correction to the Management review with has place in 11 of June
2008y
16. Internal audit
17. Pass on the PCA the evidences of the carried out corrective actions
18. Actualisation of the general procedures
19. Actualisation of the technical procedures
20. New edition of the Quality Book, edition 10
Assignments that have been results of the external audit carried out by PCA's auditors
covered the corrective actions according to four disagreements and preventing actions
for 33 observations. All corrective actions were realised with success but not to all
observations the preventing actions were made what will have influence for the
numerous disagreements in the next external audit carried out in 2008.
The audit has place in 27 June 2008 and in result a 13 disagreements were drawn up
including:
- 7 disagreements in general section
- 6 disagreements in technical section
In addition 12 observations were drawn up:
- 9 in general section
- 3 in technical section
As a basis of the disagreements adequate point of the Standard 17025 were listed:
4.1, 4.2, 4.3, 4.4, 4.9, 4.11, 4.12, 4.14, 4.15, 5.2, 5.4, 5.6, 5.9, 5.10.
In collaboration with a specialist for Quality Systems an analysis of disagreements
were done and adequate corrective actions were proposed. The propositions of the
corrective actions were approved by the PCA's auditors. At the same time thirty Cards
for Planning and Monitoring of the Corrective Action were issued according to the QPO

140
12 procedure. Because of the wide range of corrective actions it was requested to the
PCA to extend the deadline for sending the evidence to carried out operations. The
corrective actions cover mainly:
- Adapting the Quality system and procedures to the requirements of PN-EN ISO
/ IEC 17025:2005
- analysis of observations from 2007
- Review and update of the measuring procedures
- personnel training
- Review of the management
- Internal audits
The correction to the management review made in 11 June 2008 was performed. The
review was conducted on 20 August 2008 in accordance with updated QPO 10
procedure. In result of the review a protocol was drawn using a newly developed form.
As a result of management review objectives and tasks to the period 2008/2009 have
been established. Protocol from the review was attached as evidence to corrective
actions.
On September 23 an internal audit in accordance with the QPO 11 procedure had
place, it covers "Cooperation with the customers" and "Instruments calibration". As
a result one observation was recorded.
On 27 September evidences of corrective actions were send to the PCA, they include:
- Five newly created system procedures
- An analysis of observations recorded during the audit of PCA in 2007
- List from personnel training
- Management review Protocol
- Internal audits Reports
- Records of quality control of the instruments
- Evidence of validation of the formulas used in Excel spreadsheets
- Updates Cards of responsibility and authority of personnel
Updates of all procedures were performed. Five new procedures were created:
"Preventive actions", "Dealing with the work not confirm to the requirements", "
Records control", "Transport and storage of the secondary standards", "Purchasing
services and supplies".
In addition all measurements procedures were updated to new graphic form. The
Quality Book has been fully modernized to fulfil the requirements of Standard 17025.

141
THE ASSURANCE AND MAINTENANCE OF THE QUALITY SYSTEM IN LABORATORY OF PERSONNEL MONITORING
FOR RADIOLOGICAL PROTECTION
Marek Wasek1, Grażyna Krajewska, Kamil Szewczak
1Warszawski Uniwersytet Medyczny, Zakład Bioanalizy i Analizy Leków
In 2009, for the purpose of assuring and maintaining Laboratory of Personnel Monitoring (PDIŚ) the following activities were performed:
1. Four scheduled internal audits: "Surveillance of the equipment” "Customer service" "Complaints" "Documents control”
The audits were conducted before the yearly audit and organized under the supervision of the Polish Centre for Accreditation. They aimed at controlling the key areas of the quality system, which determine its effectiveness in setting the equivalent dose. The two last audits were a yearly recapitulation of activities performed by PDIŚ. There were no complaints from customers, and on the basis of the research of quality control made, the high quality of services offered by PDIŚ was confirmed.
2. Corrective action for disagreements noted during the external audit in 12.12.2008.
Complete the procedure QPO 13 Training
3. Review of Quality Management at 18 June performed by Director of CLOR – PhD Paweł Krajewski
4. Participation in an audit organized under the supervision of the Polish Centre for Accreditation (PCA) which has place in 22 June.
In the results of the audit two disagreements were noted. The final conclusion of the audit, was that the Laboratory PDIŚ has maintained the implemented quality system according to the requirements of PN - EN ISO / IEC 17025:2001 + Ap1:2005 standard. An accreditation Certificate is valid up to December 2011.
5. Fife internal trainings of PDIŚ technical staff covering the following issues: Conclusions after PCA's audit Complaints Statements of general procedure QPO 12 Properly use a accreditation symbol In the range of the new developed procedures contributed to TLD method 6. Test of the workplace for photochemical processing of film detectors. The test
was held before every measuring and calibration cycle.
The work executed in 2008 by PDIŚ was done according to a timetable prepared earlier and in agreement with procedures, general instructions and research procedures included into quality system

142