central england temperatures; monthly means of the radcliffe meteorological station, oxford
TRANSCRIPT

CORRESPONDENCE AND NOTES 385
REFERENCES
Abbot, C. G.
Elterman, L.
Feussner, K. Feussner, K. and Dubois, P.
Fowle, F. E. Heidel, K.
IGY Instruction Manual,
Johnson, F. S. Linke, F.
Thekaekara, M. P.
Part V1
1927
1968
1956 1930
1915 1972
1956
1954 1922
1972
‘ Smithsonian solar radiation researches,’ Gerl. Eeitr. 2.
‘ UV, Visible, and ,IR attenuation for altitudes to 50 krn,
See IGY Instruction Manual. ‘ Trubungsfaktor, precipitable water,’ Staub. Eeitr. Geophys.,
‘ Transparency of aqueous vapour,’ Appl. J., 42, pp. 394-41 1. ‘ Turbidity trends in Tucson, Arizona,’ Science, 177, pp.
Radiation instruments and measurements, New York :
‘ The solar constant,’ J. Met., 11, pp. 431-439. ‘ Transmissionkoeffizient and Trubungsfaklor,’ Beitr. 7.
‘Evaluating the light from the sun,’ Optical Spectra, 6,
Geophys., 16, pp. 344-354.
1968,’ AFCRL Rept. 68-0153, 49 pp.
27, pp. 132-175.
882-3.
Pergamon Press, pp. 371-466.
Phys. d. f r . Arm., 10, pp. 91-111.
pp. 32-35.
Geophysical Monitoring for Climate Change, National Oceanic and Atmospheric Administration, Boulder, Colorado, U.S.A. 25 September 1974
551.524.36(425)
CENTRAL ENGLAND TEMPERATURES; MONTHLY MEANS OF THE RADCLIFFE METEOROLOGICAL STATION, OXFORD
By C. G. SMITH
I have read with interest Professor Gordon Manley’s recent article (Manley 1974) which brings his valuable table of Central England mean monthly temperatures up to 1973 and extends the record further back into the 17th century. However, I am puzzled and disturbed by his comments on the reliability of the record of the Radcliffe Meteorological Station, Oxford, for which I have been personally responsible since 1950. Professor Manley suggests that the Oxford temperature record has recently become less representative, particularly since about 1960, and that this can be attributed to an ‘urban effect’ as Oxford has grown. He does not produce any positive evidence to support this view other than the observation that ‘night minima are most affected’ and a reference to some consideration of the values reported at stations such as Brize Norton, Abingdon and Sherburn ‘in the adjacent countryside’.
Professor Manley quotes two of my papers and thanks me for drawing his attention ‘some years ago to the tendency for the Oxford monthly means to rise relative to others’. A careful reading of my two papers quoted by Professor Manley (Smith 1968 and 1969) does not, I think, justify any such assertion. When they were written I was certainly aware of the possibility of such changes arising from an urban effect, particularly the extensions to the adjoining Radcliffe Infirmary since about 1940, but I had found no evidence for it and the implication of both papers was that this particular site was a remarkably good one for the study of long period temperature fluctuations. Any suggestion that the record had become unreliable has come from Professor Manley himself for, on two or three occasions, he has suggested this possibility to me. I have expressed my doubts to him that any such change has occurred and 1 have promised him that I would make a detailed examination of the record to see if this might have occurred. I had two main reasons for doubting his suggestion: firstly the remarkable internal consistency of the record ; and secondly the location of the station and the character of the built-up area around it. Its location in central North Oxford
386 CORRESPONDENCE AND NOTES
is in an area of the city that has been very little affected by the growth of the built-up area this century. There are large open spaces to the east and west of this district and, with the exception of the extensions to the adjacent hospital, there has been virtually no change in the density of building in the neighbourhood for nearly a hundred years. This can be confirmed by inspection of the printed maps and plans of the Ordnance Survey. Moreover, Oxford is a city with large tracts of open countryside extending in wedges right into the centre. The instrument enclosure is sited in a relatively large walled garden to the north of the Old Observatory building and these surroundings have remained unchanged since the end of the 18th century. I would not have been surprised if the extensions to the hospital buildings had had some effect on the temperature record, particularly in winter, as a result of space heating. 1 now have good reasons for believing that such an effect cannot be established. I can only attribute this to the insulating effect of the walled garden and Observatory and the generally open character of the built-up area of North Oxford.
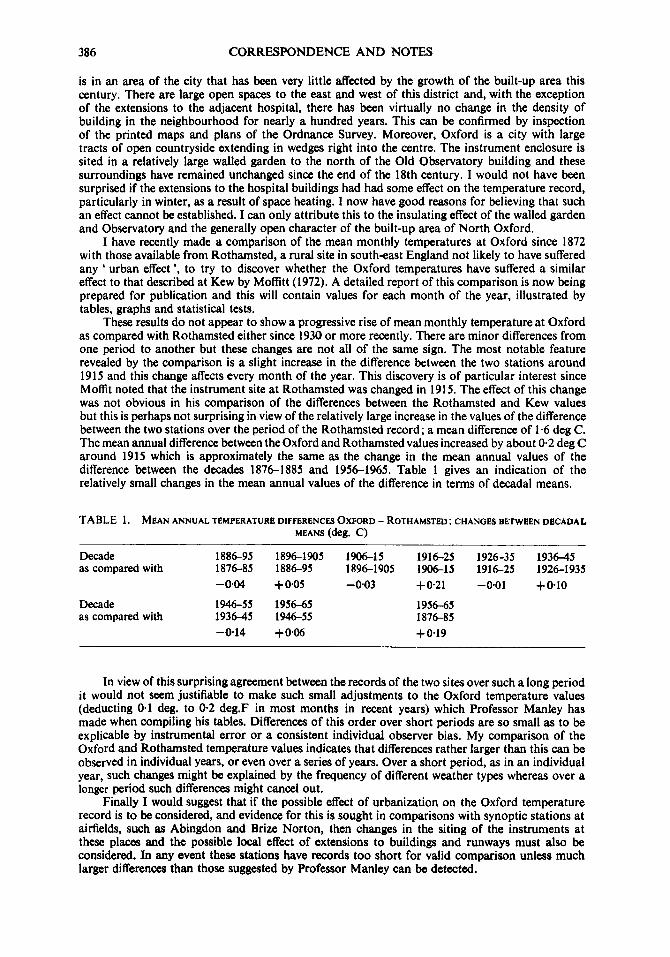
I have recently made a comparison of the mean monthly temperatures at Oxford since 1872 with those available from Rothamsted, a rural site in southeast England not likely to have sufrered any ' urban effect ', to try to discover whether the Oxford temperatures have suffered a similar effect to that described at Kew by Moffitt (1972). A detailed report of this comparison is now being prepared for publication and this will contain values for each month of the year, illustrated by tables, graphs and statistical tests.
These results do not appear to show a progressive rise of mean monthly temperature at Oxford as compared with Rothamsted either since 1930 or more recently. There are minor differences from one period to another but these changes are not all of the same sign. The most notable feature revealed by the comparison is a slight increase in the difference between the two stations around 1915 and this change affects every month of the year. This discovery is of particular interest since Moffit noted that the instrument site at Rothamsted was changed in 1915. The effect of this change was not obvious in his comparison of the differences between the Rothamsted and Kew values but this is perhaps not surprising in view of the relatively large increase in the values of the difference between the two stations over the period of the Rothamsted record; a mean difference of 1-6 deg C. The mean annual difference between the Oxford and Rothamsted values increased by about 0.2 deg C around 1915 which is approximately the same as the change in the mean annual values of the difference between the decades 1876-1885 and 19561965. Table 1 gives an indication of the relatively small changes in the mean annual values of the difference in terms of decadal means.
TABLE 1. MEAN ANNUAL TEMPERATURE DIFFERENCES OXFORD - ROTHAMSTED: CHANGES BETWEEN DECADAL MEANS (deg. C)
Decade 1886-95 1896-1905 1906-15 1916-25 1926-35 1936-45 as compared with 1876-85 1886-95 1896-1905 1 W 1 5 1916-25 19261935
-0.04 +0.05 -0.03 +0.21 -0.01 +010 Decade 194655 1956-65 as compared with 1936-45 1946-55
-014 +OM
1956-65 187fj-85 +0.19
In view of this surprising agreement between the records of the two sites over such a long period it would not seem justifiable to make such small adjustments to the Oxford temperature values (deducting 0.1 deg. to 0.2 deg.F in most months in recent years) which Professor Manley has made when compiling his tables. Differences of this order over short periods are so small as to be explicable by instrumental error or a consistent individual observer bias. My comparison of the Oxford and Rothamsted temperature values indicates that differences rather larger than this can be observed in individual years, or even over a series of years. Over a short period, as in an individual year, such changes might be explained by the frequency of different weather types whereas over a longer period such differences might cancel out.
Finally I would suggest that if the possible effect of urbanization on the Oxford temperature record is to be considered, and evidence for this is sought in comparisons with synoptic stations at airfields, such as Abingdon and Brim Norton, then changes in the siting of the instruments at these places and the possible local effect of extensions to buildings and runways must also be considered. In any event these stations have records too short for valid comparison unless much larger differences than those suggested by Professor Manley can be detected.

CORRESPONDENCE AND NOTES 387
REFERENCES
Manley, Gordon
Moffitt, B. J.
Smith, C. G.
1974
1972
1968
1969
' Central England temperatures: monthly means 1659 to 1973,' Quart. J. R. Met. SOC., 100. pp. 389-405.
' The effects of urbanisation on mean monthly temperatures at Kew Observatory,' Weather, 27, pp. 121-129.
' The Radcliffe Meteorological Station,' ibid., 23, pp. 357- 361.
' Winters at Oxford since 1815,' Ibid., 24. pp. 23-26.
School of Geography, University of Oxford, Mansfield Road, Oxford OX1 3TB. 18 September 1974
REPLY
By GORDON MANLEY
Dr. C . G. Smith has done welcome service in calling attention to a major problem facing all who would attempt the establishment of a reliable instrumental index of the amplitude of climatic fluctuations, especially of temperature. I have long thought that the compilation of an index for Central England, based since 1880 on at least four Lancashire stations, but on only a single south Midland station at Oxford, might be open to criticism which should be forestalled. Nevertheless, the exceptional care with which the Radcliffe Observatory temperature record at Oxford has hitherto been maintained and reduced is evident, and so far I have not found reason to change my opinion that up to 1925 or thereabouts it still provides within England the most satisfactory series of monthly means that we have for any one place, notwithstanding some comment in recent years by Professor Lamb (Geografska Annaler, 45, 1963, p. 186). Hence I hope there will come a time when the earlier part of this Oxford series can be examined further against other south Midland observations, should these be found sufficiently acceptable; this will not be easy.
I have not only visited the Observatory site, but have investigated in some detail the changes in the extent of the infirmary buildings nearby; for this I have to thank Mr. R. Fairclough, M.A., of the Map Room in the Cambridge University Library who provided me with a full sequence of the large-scale O.S. maps since 1900, including the 1 / I 250 plans. Early in this century the description of the station tells us that the instruments stood on the lawn south of the Observatory building, when the open ground was still quite open, although some buildings had been added; later, the screen was moved to its present position north-west of the building. By 1938 the open ground had diminished to about five acres, and by 1961 to about one and a half acres. We need not detail here the heights and disposition of the buildings, or the angle they subtend at the screen which will indicate the impediment, notably to outgoing radiation. Suffice it to say that it is this last which leads me to think that the night minimum temperatures are those which will first be likely to show the consequences of the increasing restriction of the site. The effect on maximum temperatures, over what is stiii an irregular-shaped grassy expanse roughly 90 x 60 yards, is less certain. These are likely to be affected not only by the size of the area open to direct insolation, i.e. the height and arrangement of the buildings, but also by the frictional checking of the air-flow arising from the extent of the built-up area of the adjacent city; what we may call the ' small city park ' effect, well demonstrated by such a station as Whitworth Park, Manchester. As Dr. Smith says, the disposition of the Oxford flood plains, still almost entirely open, has ensured that the extent of the built-up area west of the Radcliffe Infirmary gounds has been very little changed; and I accept that i t is doubtful whether the great enlargement of suburban Oxford to the south-east and north can have recognizable meteorological consequences as far as the Radcliffe area is concerned, unless they can be shown to lie in the impediment to outgoing radiation that is provided by the haze of particulate matter, not necessarily smoke, that is characteristic of urban areas in quiet weathzr. Taking into account the available evidence, it seemed to me when I made my comparisons in 1951 that until then the Radcliffe monthly means continued to provide a sufficient representation of the trend of temperature over the south Midlands; hence up to that time it appears that we are in agreement.

388 CORRESPONDENCE AND NOTES
Dr. Smith appears to feel that my application of a small deduction to the published Oxford means since 1960 has not been sufficiently justified, and 1 am glad to have this opportunity to point to the facts, and to assure him that, knowing the strenuous efforts that have been made to maintain the continuity of a series of meteorological observations of exceptional value, I should not act without considerable thought.
Since 1952, when I produced my earlier table, for upwards of 20years I have regularly calculated my central England mean from the data published in the Monthly Weuther Report as soon as it arrived. In every month, therefore, I have had occasion to note the marked differences between the extreme minima at Oxford and those, commonly on the same night, at neighbouring stations. So large was the difference on many occasions that I began to take out the mean daily maxima and minima for each month as well, and the deductions since 1960 that I applied in my paper, to which Dr. Smith draws attention, were based on detailed comparison with Rothamsted and Abingdon. I refrained from pressing comparison too closely before 1951 because of the likelihood that there were changes during and after the war at Abingdon, an important airfield at which observations began in 1939. There is also a further difficulty: monthly means at Abingdon derive from 21h-h observations (day max.-night min.) And these as we know (Giblett, in M.O. Averages of Tem- peratures, 1901-1930) differ slightly from means based on 09h observation only.
Indeed, the possible effects of past changes in observing location and routine at the Radcliffe Observatory, Rothamsted, Shinlield and other south Midland stations, small though these are, should not be overlooked in any effort to make longer-term comparisons. In regard to comparisons of Oxford with Rothamsted for earlier decades cited by Dr. Smith, there are those who will welcome a reassurance that the effects of a change in altitude from 368 to 424 feet that apparently occurred between 1906 and 1907 have been allowed for; and also the possible derivation of earlier years (1876-7) from the Oxford record itself (Boyd, Annals of Eugenics, 9,1939) inasmuch as Rothamsted observations are there stated to have begun in 1878.
Nevertheless, Dr. Smith’s comparisons for earlier decades do not seem to me relevant to my more immediate argument: that the Radcliffe temperatures, at least since some time between 1950 and 1960, show a sufficient upward trend relative to other south Midland stations to require adjustment; arid that accordingly a mean representative of the south Midlands might well be derived in future as a matter of principle from a group of stations instead of the single location at Oxford at which the effects of restriction of the adjacent open ground have begun to appear.
Let me therefore summarize the evidence. Finding reasonably acceptable and reliable stations is not easy, and extraction from the printed Monthly Weather Report makes a lengthy task as omissions and possible errors should be sought and allowed for. I have accordingly to thank the Meteorological Office for providing copies of their decadal tables preparatory to their production
TABLE 1. AVERAGE DEPARTURES OF MEAN DAILY MAXIMA AND MINIMA, BY DECADES
STATIONS: ROTHAMSTED, AYLESBURY, SHINFIELD, CHELTENHAM, ABINGDON. WELLESBOURNE AND CIRENCESTER ADDED (DECADE 1951-1960 NOT QUITE COMPLETE). 09h OBSERVATIONS EVERYWHERE EXCEPT ABINGDON (21 h-
09h). FAHRENHEIT THROUGHOUT. ABOVE OXFORD, POSITIVE; BELOW, NEGATIVE
Ro. AY. Sh. Ch. Ab. Mean Well. Ciren. of 5
Maxima: 1951/60 -1.28 -0.56 +0.05 -0.01 +014 -0.33 -0.37 -1.64 1961170 -1.21 -0.70 +0*34 -0.14 -002 -0.35 -0.58 -1.21 Relative change at
Oxford -007 +0.14 -029 +012 +0*16 +0*01 +0*21 4 . 4 3 Oxford shows no very definite trend
Minima: 1951/60 -1.72 -1.42 -0.67 +0*35 -055 -0.80 -1.70 -1.75 1961/70 -2.03 -1.94 -1.08 -013 -0.92 -1.22 -2.11 -2.18 Relative change at
Oxford +0.31 +032 +041 +0*48 +Om37 +0.42 +Om41 +043 Oxford: definite and nearly uniform trend throughout
~~
Nore. On a comparison of the available figuras, January 1971 to September 1973 only, taken directly from the M.W.R., the Oxford maxima are higher than the average of the seven stations by 0.44, compared with 0.50 for 1961-1970. The Oxford minima are higher by I .43, compared with 1.48 for 1961-1970. The difference thus persists, and it will be interesting to watch developments. At Abingdon, a change of site in 1966 has been noted, but its overall effect appears to be neglisible. The apparent tendency for Cirencester maxima to rise from perhaps 1963 has not been iovestigatd.

CORRESPONDENCE AND NOTES 389
of the 1941-1970 averages, for Rothamsted, Aylesbury, Shinfield, Cheltenham, Abingdon; together with Cirencester and Wellesbourne, more or less complete since 1951-1952; we may fairly presume that any needful corrections have been incorporated before tabulation. It can be noted that I have taken care to avoid places with unusual exposures that lead to local extremes, such as Grendon Underwood; and that throughout I have taken out the departures of the mean maxima and the mean minima for each individual month, partly in order to detect possible discontinuities, partly in order to diminish the effect of single-decimal reductions using the coarser Celsius degree; compari- sons throughout are in Fahrenheit. I fully agree that we should not get lost in argument over particular months. After all, in comparing the means for a winter month between two otherwise similar stations at which the one had had a single night's fresh snow cover and a local clearance of the sky while the other had not, the effect of that one night could lead, other things being equal, to a difference of 0.4 deg.F in the mean minima; and instrumental errors occasionally creep in, even at the most reliable stations.
Inasmuch as the monthly mean minima, overall, at the Radcliffe Observatory are quite con- sistently about 0 4 deg.F higher for the decade 1961-1970 compared with 1951-1960, and on the evidence that the maxima are but little changed, if at all, the implication is that the Radcliffe monthly means are likely to be of the order of 0.2 deg.F higher since some date that can be put close to, but before 1960. My cautious adjustment of 0.1 deg. to 0.2 deg.F. is accordingly justified. But as a matter of principle, many will consider i t preferable if future investigators who wish to continue the series will strike their mean for ' south Central England ' from a group of well-run stations such as those I have named. We do not always know what goes on around them; for example, in conversation Dr. Penman has informed me that even the changes in proportion of land ploughed to land under grass have perceptible effects on Rothamsted observations, and I suspect that something similar may operate at Cambridge.
3 Whitwell Way, Coton, Cambridge CB3 7PW. 27 November 1974
551 3 0 . 5 3 4
COMMENT ON THE PAPER ' THE LAMINATED STRUCTURE OF THE OZONE I N THE ATMOSPHERE ' BY G. M. B. DOBSON
By A. B. PITTOCK
Dr. Dobson refers to a suggestion made by me (Pittock 1965) that the observed coincidence between a dust layer and a persistent ozone minimum at about 21 km altitude over Boulder (40'") in the spring of 1964 was due to destruction of the ozone by the dust.
However, in a later paper (Pittock 1966) I came to the conclusion that a necessary and sufficient explanation was the quasi-horizontal advection of relatively ozone-poor air from about the same altitude in the tropics. This air was 'tagged' by the injection into it of volcanic dust from the eruption of Mt. Agung, Bali (8"s) in the spring of 1963. My conclusion therefore was in line with, and offers substantial support to that given by Dobson.
My feeling is that the highly conservative nature of the ozone content in a given parcel of lower stratospheric air adequately accounts for the observed laminated structure, even despite the downward revision of ozone relaxation times contained in recent photochemical theory (Dutsch 1973). This may yet cause ozone content to be regarded as a critical indicator of global-scaleclimatic variation.
REFERENCES ' The laminated structure of the ozone in the atmosphere,'
Qiccrrr. J . R . Met . soc., 99, pp. 599-607. ' Recent developments in photochemistry of atmospheric
ozone,' Pitre nnd ApplirclGeoph.vsics. 106-108, pp. 1361- 1384.
Dobson, G. M. B.
Dutsch, H. U.
1973
1973