censusinfo useful for planning - statistics timor-leste€¦ · tetum? the censusinfo allows you to...
TRANSCRIPT

CensusInfo
It is a database of the Population and Housing Census 2010
in Timor-Leste. The database provides detailed statistics on the
characteristics of Timorese population and households, including
demographic, socio-economic, geographical, and housing data.
Useful for planning
The CensusInfo database is a powerful tool for evidence-based
planning, monitoring and policy advocacy. The database was devel-
oped by the General Directorate of Statistics, Ministry of Finance
with technical support from UNICEF.
The database CD-ROM is free for distribution.
You can find information at http://www.devinfo.org

Step 1 Click on the blue icon on the top and select an
indicator from the drop down menu at the left column, e.g.
‘Source of drinking water’ from ‘Housing’ indicators and
‘Proportion of households using an improved drinking water
source’.
Step 2 Click on the green icon on the top and select (a)
geographical area(s) from the drop down menu at the left col-
umn, e.g. ‘Timor-Leste’ from ‘Asia’ and select ‘Level 4’ meaning
district level.
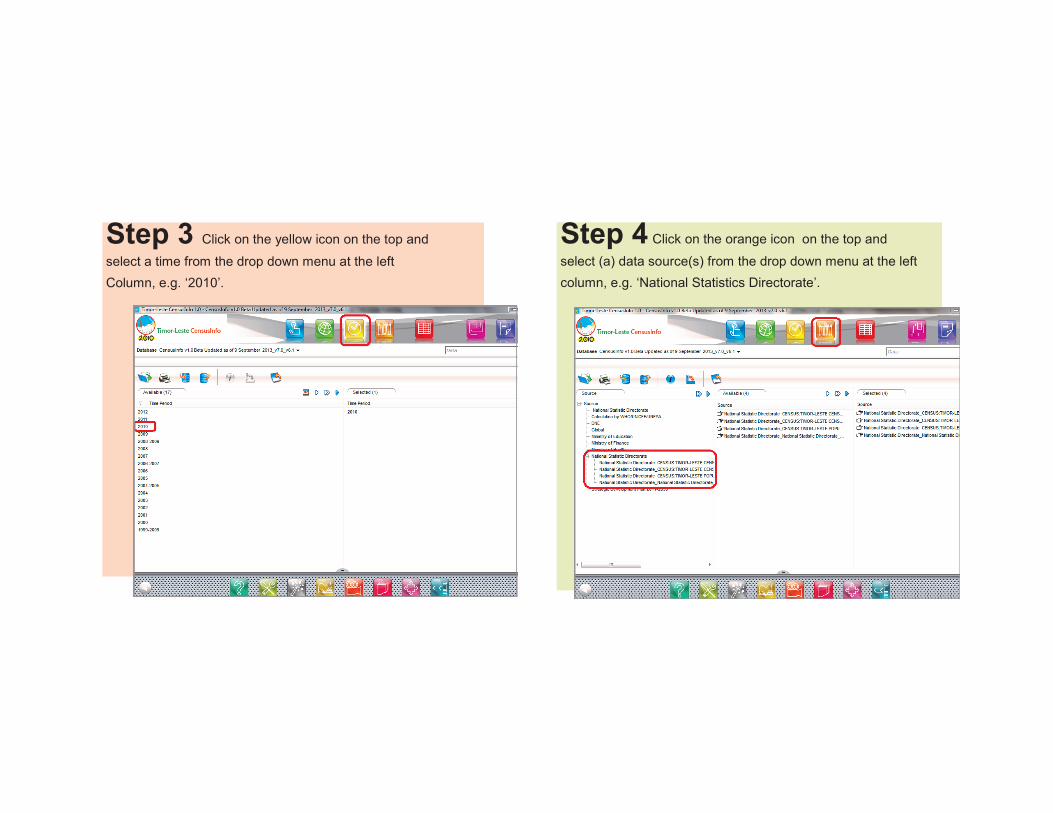
Step 3 Click on the yellow icon on the top and
select a time from the drop down menu at the left
Column, e.g. ‘2010’.
Step 4 Click on the orange icon on the top and
select (a) data source(s) from the drop down menu at the left
column, e.g. ‘National Statistics Directorate’.

Step 5 Finally, click on the red icon on the top and
generate data, e.g. Proportion of households
using an improved drinking water source.
Need a table, map or graph?
The CensusInfo database system has simple and user-friendly
features that can be used to query the database and generate tables,
graphs and maps. You can easily insert these table and map into
reports and presentations. Data from the CensusInfo can be exported
to XLS, HTML, PDF, CSV and XML files and imported from
spreadsheets in a standardized format.
TABLES
The CensusInfo table wizard
creates a table from the data
extracted from the database.
The table wizard includes
options to change colors
etc.as you can do in
Microsoft Excel.

Graphs
The CensusInfo graph wizard creates a map from the data extracted
from the database. The graph wizard includes options to change
colors and edit labels and so on as you can do in Microsoft Excel.
Maps
The CensusInfo map wizard creates a map from the data extracted
from the database. The map wizard includes options to change
colors and edit labels and so on,

Want to work in
Tetum?
The CensusInfo allows
you to work in Tetum.
Here are the steps that
you need to follow.
Step 1
Click on the
light green
icon at the
Bottom.
English
Tetum
Step 2
When a small
window
appears,
click on the
‘Language’ tab
on the top.
Step 3
Within the
same window,
select ‘Tetum’
from the drop
down ‘Source
Language’
menu, then
restart.