cell-ecm traction force modulates endogenous tension at cell cell … · tothe totalcell-ecm...
TRANSCRIPT

Cell-ECM traction force modulates endogenoustension at cell–cell contactsVenkat Maruthamuthua, Benedikt Sabassb,c, Ulrich S. Schwarzb,d, and Margaret L. Gardela,e,1
aInstitute for Biophysical Dynamics, University of Chicago, Chicago, IL 60637; bBioquant, University of Heidelberg, 69120 Heidelberg, Germany;cII. Institute for Theoretical Physics, University of Stuttgart, 70550 Stuttgart, Germany; dInstitute for Theoretical Physics, University of Heidelberg,69120 Heidelberg, Germany; and eJames Franck Institute and Department of Physics, University of Chicago, Chicago, IL 60637
Edited by Shu Chien, University of California, San Diego, La Jolla, CA, and approved February 3, 2011 (received for review July 30, 2010)
Cells in tissues are mechanically coupled both to the ECM andneighboring cells, but the coordination and interdependency offorces sustained at cell-ECM and cell–cell adhesions are unknown.In this paper, we demonstrate that the endogenous force sustainedat the cell–cell contact between a pair of epithelial cells is approxi-mately 100 nN, directed perpendicular to the cell–cell interface andconcentrated at the contact edges. This force is stably maintainedover time despite significant fluctuations in cell–cell contact lengthand cell morphology. A direct relationship between the total cellu-lar traction force on the ECM and the endogenous cell–cell forceexists, indicating that the cell–cell tension is a constant fractionof the cell-ECM traction. Thus, modulation of ECM properties thatimpact cell-ECM traction alters cell–cell tension. Finally, we show ina minimal model of a tissue that all cells experience similar forcesfrom the surrounding microenvironment, despite differences inthe extent of cell-ECM and cell–cell adhesion. This interdependenceof cell–cell and cell-ECM forces has significant implications for themaintenance of the mechanical integrity of tissues, mechanotrans-duction, and tumor mechanobiology.
cellular mechanotransduction ∣ cadherin ∣ adherens junctions ∣ focaladhesions ∣ intercellular force transmission
In multicellular tissue, morphological changes during tissueformation, maintenance, and repair require the dynamic regu-
lation and coordination of cellular movements and shape (1).Physical interactions in multicellular populations are, to a largedegree, guided by adhesions formed both between neighboringcells and between cells and the ECM (2, 3). Rather than simplyplaying a passive role in maintaining attachment and resisting ex-ternal forces, it is becoming increasingly evident that cell-ECMand cell–cell adhesions are also sites of transmission of active,cell-generated forces (4).
The nature of force balance across a cell guides its morpholo-gical changes and movement (1). For single cells, integrin-mediated focal adhesions to the ECM sustain large tensile loadsgenerated within the actin cytoskeleton, and these forces regulatecell shape and migration (1, 4, 5). In turn, force-mediated integrinsignaling also controls cell growth, proliferation, and differentia-tion (6, 7). In multicellular ensembles, such as epithelial mono-layers, cells form adhesions to neighboring cells, primarilythrough cadherin-mediated adhesions, as well as to the extracel-lular matrix. Here, morphological changes are driven by theforces generated and sustained at both cell–cell and cell-ECMadhesions. Although it is known that cadherin-mediated adhe-sions to neighboring cells share similar characteristics of force-dependent growth and signaling observed at focal adhesions(3, 8, 9) and have the potential to sustain large tensile loads(9, 10), little is known about the magnitude of tension sustainedat endogenous cell–cell contacts.
Evidence of mechanical tension sustained at endogenouscell–cell contacts has, to a large degree, relied on mechanicalinterpretations of cytoskeletal dynamics induced by disruptionof a cell–cell contact in a multicellular tissue (11–14). Althoughthis method has provided powerful insights about an otherwise
experimentally inaccessible quantity, it requires assumptions ofthe cellular mechanics and can provide only estimates of relativeforces at the cell–cell interface. Traction force microscopy ofepithelial monolayers has also provided evidence for cell–celltension during epithelial sheet migration (15). Recently, directmeasurements of the endogenous tension exerted at cell–cellcontacts have shown that the magnitude of tension at the cell–cellinterface regulates the size of the cell–cell adhesive contact forpairs of endothelial cells where the cell shape is geometricallyconstrained (16). However, the regulation of the force at acell–cell adhesion in its native, unconstrained morphology re-mains unknown. Moreover, although it has been speculatedthat mechanical “cross-talk” between cell-ECM and cell–cell ad-hesions may play an important role in guiding cellular rearrange-ments in a multicellular context (17, 18), the extent to which cell–cell forces are coordinated with cell-ECM forces is less certain.
In this paper, we first consider the minimal model of twoepithelial cells adherent to both the ECM and each other witha fully developed cell–cell contact. We determine the nature ofthe endogenous force at the cell–cell contact to be tensile, direc-ted perpendicular to the cell–cell interface, and concentratedat the contact edges. We find that the ratio of the cell–cell forceto the total cell-ECM traction force is remarkably constant acrosscell pairs despite natural variations in cellular contractility. Inturn, we show that perturbations to ECM properties such asbiochemical composition or mechanical rigidity, well known toalter cellular traction force, modulate the tension sustained atthe cell–cell contact. Thus, tension exerted at focal adhesionsis directly correlated to the tension at cell–cell contacts. Finally,consideration of an asymmetric three-cell case shows all cellsexert similar levels of forces on their microenvironments, eventhough the extent of cell–cell and cell-ECM adhesion differs.These results have implications for understanding the mechanicalcoordination between the tension sustained at focal adhesionsand cell–cell adhesions in multicellular tissue.
ResultsTraction Force Imbalance Measures Endogenous Force at Cell–CellContact. The endogenous force transmitted at a single cell–cellcontact between pairs of Madin–Darby canine kidney (MDCK)epithelial cells was determined based on a calculation of the bal-ance of traction forces exerted on the ECM. To assess tractionforces exerted at integrin-mediated adhesions, MDCK cells wereplated on compliant, collagen-coated polyacrylamide gels suita-ble for high resolution traction force microscopy (19). Tractionforce vectors were calculated from the substrate displacement
Author contributions: V.M. and M.L.G. designed research; V.M. performed research; V.M.,B.S., and U.S.S. contributed new reagents/analytic tools; V.M., B.S., and U.S.S. analyzeddata; and V.M. and M.L.G. wrote the paper.
The authors declare no conflict of interest.
This article is a PNAS Direct Submission.1To whom correspondence should be addressed. E-mail: [email protected].
This article contains supporting information online at www.pnas.org/lookup/suppl/doi:10.1073/pnas.1011123108/-/DCSupplemental.
4708–4713 ∣ PNAS ∣ March 22, 2011 ∣ vol. 108 ∣ no. 12 www.pnas.org/cgi/doi/10.1073/pnas.1011123108
Dow
nloa
ded
by g
uest
on
Apr
il 25
, 202
0

vectors by using Fourier transform traction cytometry algorithms(19) (SI Text).
In isolated MDCK cells, traction stresses were exerted at thecell periphery and directed toward the cell center (Fig. 1 A andB); the location of traction stresses corresponds to the typical dis-tribution of focal adhesions in individual cells (Fig. S1) and nocolocalization of GFP-E-cadherin to sites of cell-ECM tractionwas observed (Fig. 1A). The traction stress multiplied by the unitgrid area yielded the traction force vector, ~Ti. The sum of trac-tion force magnitudes across the cell,∑ j ~Tij, provided a measureof the total cell-ECM generated force and was approximately250 nN (SI Text). The vector sum of the traction forces acrossthe cell, ∑ ~Ti, measured the unbalanced traction force. To com-pare the magnitude of the unbalanced force to the total cell-ECMforce, the ratio j∑ ~Tij∕∑ j ~Tij was used. For single cells, the un-balanced force was 5� 3% of the total cell-ECM force (Fig. 1C).We attribute this small degree of force imbalance to the error ofour analysis routines, as real force imbalances of this magnitudewould result in rapid acceleration of the cell body (SI Text).
Pairs of MDCK cells with fully expanded cell–cell contactswere identified by prominent E-cadherin localization along thecell–cell interface and, in a large fraction of cells, enhancedlocalization of GFP-E-cadherin in plaques at the edges of thecell–cell contact (20, 21) (Fig. 1D). In cell pairs, focal adhesionslargely disassembled at regions of cell–cell contacts, but remainedat the free cell edge (21) (Fig. S2). Consistent with this, tractionstresses exerted by the cell pair were directed centripetally atthe cell periphery and no large traction stresses were exertedunder sites of prominent GFP-E-cadherin localization (Fig. 1 D
and E). The total cell-ECM force generated by the cell pair wasapproximately 400 nN, or 200 nN per cell. The traction forcevectors were well balanced across the cell pair, and the percentof unbalanced traction force across the cell pair was 5� 3%,similar to that observed in single cells (green, Fig. 1F).
Using E-cadherin localization to identify the cell–cell bound-ary, we then calculated the sum of traction force vectors underan individual cell in a cell pair, ~Fcell1 ¼ ∑cell1
~Ti (yellow line,Fig. 1 D and E; see SI Text). This imbalance for a single cellin a cell pair is distinctly larger than the imbalance for the entirecell pair (Fig. 1F). Because the cell is in mechanical equilibrium,we deduced that this imbalance reflects the force exerted at thecell–cell interface by its neighbor (schematic, Fig. 1F). If thiswere the case, both cells in the pair would exert equal and oppos-ing forces on each other. Indeed, we observed a strong correla-tion between the magnitude of the force imbalance vector ofthe two cells in a cell pair, j ~Fcell1j and j ~Fcell2j (Fig 1G). The aver-age endogenous tension exerted at the cell–cell interface wascalculated as the vector difference ~Fcell-cell ¼ ð ~Fcell1 − ~Fcell2Þ∕2.We found that the magnitude of ~Fcell-cell was broadly distributed,with an average of approximately 100 nN (Fig. 1H) and thatthe direction of the vector was perpendicular to the cell–cellinterface (Fig. 1I). The magnitude of the vector sum,jð ~Fcell1 þ ~Fcell2Þj∕2, which, in principle, should be zero, providedan estimate of measurement error and was approximately 10%that of Fcell-cell. From the uncertainty in single cell tractionforce balance, we determined the upper bound of Fcell-cell mea-surement error to be 30% (SI Text).
A B CG
H
I
F
D E
Fig. 1. Traction force imbalance yields the endogenous cell–cell force. (A) MDCK cell expressing GFP-E-cadherin with traction stress vectors (redarrows) superimposed. Green line indicates region used for calculation of total traction force. Stress magnitude and distance scale are indicated by thered arrow and white line, respectively. (B) Heat-scale plot of traction stress magnitudes of the cell shown in A. (C, Top) Schematic of cell on traction gel withtraction stress vectors (red arrow). (Bottom) Histogram of the unbalanced traction force across an isolated cell, measured as j∑ ~Tij∕∑ j ~Tij, and expressed as apercentage (number of cells ¼ 16). (D) A pair of contacting MDCK cells expressing GFP-E-cadherin with traction stress vectors overlaid (red arrows). Outline ofthe regions used to calculate the force balance within the cell pair or a single cell are indicated by the green and yellow lines, respectively. (E) Heat-scale plot oftraction stress magnitudes of the cell pair shown in D. (F, Top) Schematic of side view of the cell pair on traction gel with traction stresses (red arrows) andcell–cell forces (black arrows) depicted. (Bottom) Histogram of the unbalanced traction force, as measured in C for both a cell pair (green) and a single cellwithin the cell pair (yellow) (number of cell pairs ¼ 24). (G) Net force exerted by cell 2 on cell 1, Fcell1, as a function of the force exerted by cell 1 on cell 2, Fcell2.Dashed line indicates a slope of one. (Inset) Schematic of a cell pair depicting Fcell1 and Fcell2. (H) Histogram of the endogenous cell–cell force; mean� SD is100� 40 nN. (I) Histogram of the angle between the cell–cell force and the line joining the edges of the cell–cell contact; mean� SD is 88� 180. (Inset) Sche-matic depicting the angle calculated. Scale bar in A, B, D, and E is 5 μm. Reference traction vector in A and D is 950 Pa.
Maruthamuthu et al. PNAS ∣ March 22, 2011 ∣ vol. 108 ∣ no. 12 ∣ 4709
BIOPH
YSICSAND
COMPU
TATIONALBIOLO
GY
APP
LIED
PHYS
ICAL
SCIENCE
S
Dow
nloa
ded
by g
uest
on
Apr
il 25
, 202
0

The method developed here is, in principle, similar to thosein recent reports (15, 16), but has been extended to singlecell–cell contacts between unconstrained cell pairs on uniformsubstrates. This method is robust to choice of traction force re-construction routine and parameters chosen (SI Text). Hence-forth in this paper, we refer to this way of deducing theendogenous forces at the cell–cell contact as the traction forceimbalance method (TFIM).
Cell–Cell Force Is Independent of the Cell–Cell Contact Size and IsStable During Dynamic Cell Morphological Changes. To explorethe regulation of the endogenous tension at cell–cell contacts,we sought correlation of cell–cell force with cadherin localizationat the cell–cell contact. We found that the cell–cell force isnot correlated to the integrated intensity of E-cadherin localizedat the cell–cell contact (Fig. S3), in contrast to correlationsobserved when the cell–cell contact is formed with geometricalconstraints on cell shape (16).
In unconstrained cell pairs, cells undergo random migration,effecting changes in cell morphology and orientation relative toeach other over the course of an hour (Fig 2A and Movie S1).Over this time, the spatial organization of the traction stresseschanges and reflects changes in cell shape and orientation(Fig. 2B and Movie S1). To accommodate the changes in cellmorphology, the cell–cell contact dynamically remodels withthe contact length changing by as much as 30% over the courseof an hour (Fig. 2C and Fig. S4). However, during this time, themagnitude of the cell–cell force remains constant (Fig. 2C andFig. S4). Thus, we do not observe a correlation between the cell–cell force and contact length (Figs. S3 and S4). These data in-dicate that, for mature cell–cell contacts in an unconstrainedepithelial cell pair, the length of the cell–cell contact does notstrongly correlate to the tension at the cell–cell contact.
Cell–Cell Force Acts at Contact Vertices of Cell Pair. One possible ex-planation for the independence of the cell–cell force on contactlength is that forces are unevenly distributed across the contact
length, such that a small portion of the contact sustains a largefraction of the load. Immunofluorescence of F-actin and myosinlight chain shows that actomyosin bundles are primarily coloca-lized at the cell periphery at dense E-cadherin plaques (Fig. 2Dand Fig. S2), consistent with previous reports (21, 22). The E-cadherin-rich plaques at the cell–cell contact edges can be theconsidered the contact vertices of a cell pair (20) (Fig. S4).The variation in actin intensity along the cell–cell contact couldreflect different levels of force transmission along the length ofthe contact.
TFIM yields the net force vector at the cell–cell contact butnot the distribution of forces along the contact length. To provideinsight into the nature of the force distribution along the cell–cellcontact, cell–cell adhesion along the contact was differentially dis-rupted. If the forces were primarily concentrated at the contactvertices, perturbation of the contact edges should lead to a dis-proportionate decrease in the magnitude of the cell–cell force.
To disrupt the cell–cell contact, we exploited the Ca2þ depen-dence of cadherin binding (23). We first determined the cellmorphology, traction force, and cell–cell force for cell pairs withmature cell contacts in calcium-containing media. Then, calcium-free media containing a cell-impermeable calcium chelator,BAPTA, was perfused, and changes in the cell morphology,cell–cell contact, traction force, and cell–cell force were moni-tored. We observed that cell–cell contacts in a cell pair typicallybegan to rupture at the contact edges (Movie S2) within about10 min of calcium depletion. Rupture of the cell–cell edge wasinitiated by the retraction of the F-actin and associated E-cadher-in plaque at the contact vertices (Fig. 2E, black arrows). Overthis time, the central region of the cell–cell contact remainedintact and the overall length of the cell–cell contact decreased byonly 5–10% (Fig. 2 E and F).
During the first 10 min of calcium depletion, minimal changeswere observed in the total cell-ECM traction force, ∑ j ~Tij, in-dicating that the calcium-free media did not have a large effecton integrin-mediated adhesion to the ECM over this time(Fig. 2F). As the cell–cell contact began to rupture, traction
A
B
C
E
D F
G
Fig. 2. Cell–cell force is stable over time and is concentrated at the contact edges. (A) Time lapse images of randomly migrating MDCK cell pair expressingGFP-E-cadherin at times indicated. (B) Heat-scale map of traction stress magnitudes of the cell pair at times identical to those in A. Cell–cell contact line in-dicated by white line. (C) Cell–cell force and the cell–cell contact length of a cell pair during time lapse imaging of random migration. Time points correspond-ing to images in A and B are denoted by an asterisk (*). (D) Localization of GFP-E-cadherin and mApple-actin in an MDCK cell pair. White outline indicatesregion used for analysis in E. (E) Images of actin (Top) and E-cadherin (Bottom) at times after calcium depletion. E-cadherin images overlaid with traction stressvectors (red arrows) at times after calcium depletion. Arrows indicate location of fiducial marks in F-actin coinciding with the edges of the GFP-E-cadherinplaque at the cell–cell contact. Reference traction vector in E is 250 Pa. (F) Cell–cell force, total traction force, and cell–cell contact length as a function of timeafter calcium depletion; data calculated from cell shown in E. (G) Percentage drop in cell–cell contact length, total traction force, and cell–cell force within10 min after calcium depletion for n ¼ 3 cell pairs. Scale bar in A, B, and D is 10 μm and in E is 3 μm.
4710 ∣ www.pnas.org/cgi/doi/10.1073/pnas.1011123108 Maruthamuthu et al.
Dow
nloa
ded
by g
uest
on
Apr
il 25
, 202
0

stresses near the location of the E-cadherin plaque at the contactedges undergoing retraction reoriented away from the cell–cellcontact in the direction of retraction (Fig. 2E). Over this sametime, the cell–cell force significantly dropped, by almost half itsinitial value (Fig. 2F). Thus, as the cell–cell contact disrupted,local traction stresses to the ECM reoriented, thereby leadingto a better balance of traction forces in individual cells. Thus,disruption of the peripheral edge of the cell–cell contact, whichreduced the contact length and cell-ECM force by less than 10%,reduced the cell–cell force by approximately 50% (Fig. 2G).This strongly suggests that the cell–cell forces in a cell pairare inhomogeneously distributed along the cell–cell contact, witha large fraction of the tension transmitted at the peripheralvertices, colocalizing with the heightened E-cadherin, F-actin,and myosin intensities.
Cell–Cell Force Is Proportional to Cell-ECM Traction Force. We soughtto closely explore the correlations between the cell–cell forceand traction force exerted to the ECM. Our calculation ofFcell-cell reflects a force perpendicular to the cell–cell contactcounterbalanced by all traction forces exerted on the ECM inthe antiparallel direction, ∑ ~T‖;i for each cell in the cell pair(Fig. 3A). This force balance, however, does not constrain thetraction forces that are perpendicular to the cell–cell force vector,~T⊥;i, which are internally balanced (Fig. 3A). Thus, the sum of themagnitudes of traction force vectors perpendicular to the cell–cell force, ∑ j ~T⊥;ij, provided a measure of the tension exertedto the ECM at focal adhesions that is independent of the forcebalance used to calculate the cell–cell tension.
A broad distribution of the cell-ECM traction force perpendi-cular to the cell–cell force,∑ j ~T⊥;ij (expressed on a per cell basis)was observed, ranging from 40 to 300 nN, and likely due to nat-ural variation in cellular contractility and cell area. Surprisingly,we found that the cell–cell force, Fcell-cell, was directly correlated
to ∑ j ~T⊥;ij (Fig. 3B). As a consequence, Fcell-cell was also tightlycorrelated to the total cell-ECM traction force, ∑ j ~Tij (Fig. 3C).Thus, the ratio between the cell–cell force and cell-ECM tractionforce per cell for cell pairs was a surprisingly robust constantfraction around 0.5 and remained remarkably constant despitean order of magnitude variation in the traction forces (Fig. 3D).This demonstrates a strong correlation between forces trans-mitted through cell–cell and cell-ECM adhesions.
Although dependence of the cell–cell force on intracellularfactors affecting cellular contractility was shown by recentwork (16), here we demonstrate an explicit correlation betweencellular traction to the ECM and the tensile force exerted atcell–cell contacts. Our results suggest that extracellular factorsthat perturb cell-ECM traction forces will directly impact forcesat cell–cell adhesions.
ECM Properties Modulate Endogenous Cell–Cell Forces. To test thehypothesis that independently altering the cell-ECM tractionforces would affect the cell–cell force, we altered ECM propertiesknown to affect cell-ECM traction forces. Changing the ECMligand from collagen I (CnI) to fibronectin (Fn), while maintain-ing a constant ECM stiffness, was previously shown to impacttraction force magnitudes in other cell types (24). For MDCKcells plated on Fn-coated matrices, the average cellular tractionforce decreased approximately 40% to 150 nN (Fig. 4A).Remarkably, we found that the average cell–cell force also de-creased to 60 nN such that the ratio Fcell-cell∕∑ j ~Tij remainedconstant (Fig. 4 B and C).
Increased mechanical rigidity of the ECM, while maintaining aconstant ECM ligand, has also been found to enhance cellulartraction force (7). With MDCK cells, we found that increasingYoung’s modulus of the underlying hydrogel from 8.4 to20.7 kPa enhanced the total cellular traction forces by approxi-mately 25% to 300 nN (Fig. 4A). At the same time, we foundthat the average cell–cell force also proportionately increasedto 130 nN and was consistent with the same trend relatingcell–cell force and cell-ECM traction observed (Fig. 4 B and C).These results show that perturbations to the biochemistry or
A B
C D
Fig. 3. Cell–cell force is directly proportional to the total cell-ECM tractionforce. (A) Schematic of a cell pair depicting force balance between cell-ECMand cell–cell forces. Cell-ECM traction forces acting at cell periphery (purplearrow, ~T ) can be deconstructed into a component that is parallel (bluearrow, ~T‖) and perpendicular (red arrow, ~T⊥) to the cell–cell force. Cell–cellforces ( ~Fcell-cell , black arrows) act primarily perpendicular to the cell–cellcontact. (B) Cell–cell force as a function of the total traction force per celldirected perpendicular to the cell–cell force. Data are for n ¼ 24 MDCKcell pairs. (C) Cell–cell force as a function of the total traction force exertedper cell. (D) Histogram of the ratio of the cell–cell force to the total tractionforce exerted per cell, mean� SD ¼ 0.47� 0.07.
0 100 200 300 400
40
80
120
160
200
Cel
l-Cel
l For
ce (
nN)
Cell-ECM Force (nN)
CnI, 8.4 kPaFn, 8.4 kPaCnI, 20.7 kPa
CA
0
50
100
150
200
Cel
l-Cel
l For
ce (
nN)
100
200
300
400
Cel
l-EC
M F
orce
(nN
)
Fn8.4 kPa
CnI8.4 kPa
CnI20.7 kPa
B0
0
Fig. 4. ECM properties modulate endogenous cell–cell forces. (A) Box plot ofthe total cell-ECM traction force for cells plated on substrates of differentstiffnesses, with a Young’s modulus of 8.4 kPa or 20.7 kPa, or coated withdifferent ligands, collagen I (CnI) or fibronectin (FN). Ligand biochemistryand gel stiffness indicated. Data reflects statistics as follows: FN, 8.4 kPa(n ¼ 18 cell pairs); Cn I, 8.4 kPa (n ¼ 24 cell pairs); Cn I, 20.7 kPa (n ¼ 15 cellpairs). Statistical properties of data shown in box plot are as follows: mean(open square), box (25∕75% quantile), whisker (5∕95% quantile), and aster-isks (maximum/minimum). (B) Box plot of cell–cell force for all three substrateconditions as in A. (C) Cell–cell force as a function of cell-ECM force for allthree substrate conditions indicated: FN, 8.4 kPa (open green triangles);CnI, 8.4 kPa (closed red squares); CnI, 20.7 kPa (closed blue circles). Dashedline indicates a slope of 0.5.
Maruthamuthu et al. PNAS ∣ March 22, 2011 ∣ vol. 108 ∣ no. 12 ∣ 4711
BIOPH
YSICSAND
COMPU
TATIONALBIOLO
GY
APP
LIED
PHYS
ICAL
SCIENCE
S
Dow
nloa
ded
by g
uest
on
Apr
il 25
, 202
0
mechanics of the ECM can significantly impact the endogenousforces at cell–cell contacts, but a robust correlation between thecell-ECM and cell–cell force remains.
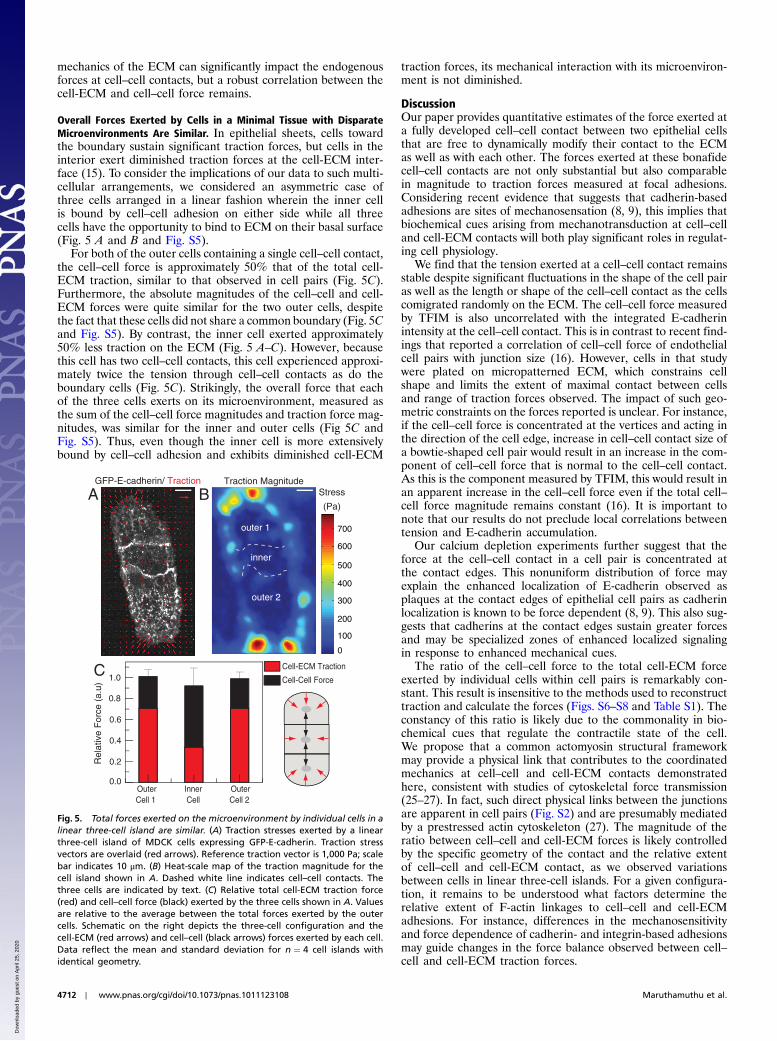
Overall Forces Exerted by Cells in a Minimal Tissue with DisparateMicroenvironments Are Similar. In epithelial sheets, cells towardthe boundary sustain significant traction forces, but cells in theinterior exert diminished traction forces at the cell-ECM inter-face (15). To consider the implications of our data to such multi-cellular arrangements, we considered an asymmetric case ofthree cells arranged in a linear fashion wherein the inner cellis bound by cell–cell adhesion on either side while all threecells have the opportunity to bind to ECM on their basal surface(Fig. 5 A and B and Fig. S5).
For both of the outer cells containing a single cell–cell contact,the cell–cell force is approximately 50% that of the total cell-ECM traction, similar to that observed in cell pairs (Fig. 5C).Furthermore, the absolute magnitudes of the cell–cell and cell-ECM forces were quite similar for the two outer cells, despitethe fact that these cells did not share a common boundary (Fig. 5Cand Fig. S5). By contrast, the inner cell exerted approximately50% less traction on the ECM (Fig. 5 A–C). However, becausethis cell has two cell–cell contacts, this cell experienced approxi-mately twice the tension through cell–cell contacts as do theboundary cells (Fig. 5C). Strikingly, the overall force that eachof the three cells exerts on its microenvironment, measured asthe sum of the cell–cell force magnitudes and traction force mag-nitudes, was similar for the inner and outer cells (Fig 5C andFig. S5). Thus, even though the inner cell is more extensivelybound by cell–cell adhesion and exhibits diminished cell-ECM
traction forces, its mechanical interaction with its microenviron-ment is not diminished.
DiscussionOur paper provides quantitative estimates of the force exerted ata fully developed cell–cell contact between two epithelial cellsthat are free to dynamically modify their contact to the ECMas well as with each other. The forces exerted at these bonafidecell–cell contacts are not only substantial but also comparablein magnitude to traction forces measured at focal adhesions.Considering recent evidence that suggests that cadherin-basedadhesions are sites of mechanosensation (8, 9), this implies thatbiochemical cues arising from mechanotransduction at cell–celland cell-ECM contacts will both play significant roles in regulat-ing cell physiology.
We find that the tension exerted at a cell–cell contact remainsstable despite significant fluctuations in the shape of the cell pairas well as the length or shape of the cell–cell contact as the cellscomigrated randomly on the ECM. The cell–cell force measuredby TFIM is also uncorrelated with the integrated E-cadherinintensity at the cell–cell contact. This is in contrast to recent find-ings that reported a correlation of cell–cell force of endothelialcell pairs with junction size (16). However, cells in that studywere plated on micropatterned ECM, which constrains cellshape and limits the extent of maximal contact between cellsand range of traction forces observed. The impact of such geo-metric constraints on the forces reported is unclear. For instance,if the cell–cell force is concentrated at the vertices and acting inthe direction of the cell edge, increase in cell–cell contact size ofa bowtie-shaped cell pair would result in an increase in the com-ponent of cell–cell force that is normal to the cell–cell contact.As this is the component measured by TFIM, this would result inan apparent increase in the cell–cell force even if the total cell–cell force magnitude remains constant (16). It is important tonote that our results do not preclude local correlations betweentension and E-cadherin accumulation.
Our calcium depletion experiments further suggest that theforce at the cell–cell contact in a cell pair is concentrated atthe contact edges. This nonuniform distribution of force mayexplain the enhanced localization of E-cadherin observed asplaques at the contact edges of epithelial cell pairs as cadherinlocalization is known to be force dependent (8, 9). This also sug-gests that cadherins at the contact edges sustain greater forcesand may be specialized zones of enhanced localized signalingin response to enhanced mechanical cues.
The ratio of the cell–cell force to the total cell-ECM forceexerted by individual cells within cell pairs is remarkably con-stant. This result is insensitive to the methods used to reconstructtraction and calculate the forces (Figs. S6–S8 and Table S1). Theconstancy of this ratio is likely due to the commonality in bio-chemical cues that regulate the contractile state of the cell.We propose that a common actomyosin structural frameworkmay provide a physical link that contributes to the coordinatedmechanics at cell–cell and cell-ECM contacts demonstratedhere, consistent with studies of cytoskeletal force transmission(25–27). In fact, such direct physical links between the junctionsare apparent in cell pairs (Fig. S2) and are presumably mediatedby a prestressed actin cytoskeleton (27). The magnitude of theratio between cell–cell and cell-ECM forces is likely controlledby the specific geometry of the contact and the relative extentof cell–cell and cell-ECM contact, as we observed variationsbetween cells in linear three-cell islands. For a given configura-tion, it remains to be understood what factors determine therelative extent of F-actin linkages to cell–cell and cell-ECMadhesions. For instance, differences in the mechanosensitivityand force dependence of cadherin- and integrin-based adhesionsmay guide changes in the force balance observed between cell–cell and cell-ECM traction forces.
100
200
300
400
600
500
0
700
Rel
ativ
e F
orce
(a.
u)
A B
C
outer 2
outer 1
inner
GFP-E-cadherin/ Traction Traction MagnitudeStress
(Pa)
OuterCell 1
Cell-ECM Traction
Cell-Cell Force1.0
0.8
0.6
0.4
0.2
0.0InnerCell
OuterCell 2
Fig. 5. Total forces exerted on the microenvironment by individual cells in alinear three-cell island are similar. (A) Traction stresses exerted by a linearthree-cell island of MDCK cells expressing GFP-E-cadherin. Traction stressvectors are overlaid (red arrows). Reference traction vector is 1,000 Pa; scalebar indicates 10 μm. (B) Heat-scale map of the traction magnitude for thecell island shown in A. Dashed white line indicates cell–cell contacts. Thethree cells are indicated by text. (C) Relative total cell-ECM traction force(red) and cell–cell force (black) exerted by the three cells shown in A. Valuesare relative to the average between the total forces exerted by the outercells. Schematic on the right depicts the three-cell configuration and thecell-ECM (red arrows) and cell–cell (black arrows) forces exerted by each cell.Data reflect the mean and standard deviation for n ¼ 4 cell islands withidentical geometry.
4712 ∣ www.pnas.org/cgi/doi/10.1073/pnas.1011123108 Maruthamuthu et al.
Dow
nloa
ded
by g
uest
on
Apr
il 25
, 202
0

Our results also show that biochemical and mechanical proper-ties of the ECM alone can directly impact the force levels atcell–cell junctions. In development and disease, changes in ECMproperties are known to influence the behaviors of multicellulartissue (28, 29); our results imply that part of this may be a con-sequence of altered tension at cell–cell interfaces. For instance,our results showing a strong correlation between cell–cell tensionand cell-ECM tension shed light into the role of perturbed ECMmechanics in tumor progression (28, 30).
There are several implications of our results to forces atcell–cell contacts in more general two-dimensional multicellularassemblies, such as epithelial monolayers. Although we find thatthe cell–cell force is essentially normal to the contact for a cellpair, cell–cell forces in general 2D assemblies can be expectedto have appreciable components in directions both normal andparallel to the cell–cell interface. Direct measurements of endo-geneous cell–cell forces with these geometries will help establisha more solid mechanical footing to interpretations of cell–celltensions made from laser ablation experiments inside tissue.
Our minimalistic tissue model consisting of a linear array ofthree cells reflects an important feature of monolayers whereinthe outer cells exhibit enhanced traction forces and the innercell, which is bound by more extensive cell–cell adhesion, exertsdiminished traction on the ECM. If the traction forces on theouter cells were internally balanced, the inner cell would feel verylittle net tension and would be mechanically quiescent. However,instead, we find that the traction forces exerted by the outer cellsare not balanced such that the inner cell experiences similar force
levels to the cells on the periphery. Our data indicate each cell ina multicellular arrangement sustains a similar level of tension,with the magnitude of forces sustained at cadherin- and integ-rin-mediated adhesions changing depending on the geometryof adhesion. Thus, our data provide direct evidence of the me-chanical coordination between cell-ECM and cell–cell adhesions.It is likely that a fine balance between forces sustained at thesetwo types of adhesions exists to control tissue morphology andbehavior.
Materials and MethodsMDCK cells stably expressing GFP-E-cadherin (20) were plated on collagen-coated polyacrylamide (PAA) gels suitable for traction force microscopy,as described in ref. 19. Further details of live cell imaging, traction forcemicroscopy, and analysis are found in SI Text. Unless otherwise specified,cells were plated on PAA gels with a Young’s modulus of 8.4 kPa coated withCollagen I.
ACKNOWLEDGMENTS. We thank James Nelson and Nicolas Borghi (StanfordUniversity, Palo Alto, CA) for MDCK cells expressing GFP-E-cadherin anduseful discussions. We thank Karl Matlin (University of Chicago, Chicago,IL) for MDCK cells expressing GFP-vinculin and useful discussions. M.L.G.acknowledges support from the National Institutes of Health (GrantDP10D00354), Packard Foundation, and a Burroughs Wellcome CareerAward. U.S.S. acknowledges support from the cluster of excellence CellNet-works at Heidelberg and from the MechanoSys-grant from the FederalMinistry of Education and Research of Germany. V.M. acknowledges supportfrom an American Heart Association Midwest Affiliate PostdoctoralFellowship.
1. Paluch E, Heisenberg C-P (2009) Biology and physics of cell shape changes in develop-ment. Curr Biol 19:R790–R799.
2. Gumbiner BM (2005) Regulation of cadherin-mediated adhesion in morphogenesis.Nat Rev Mol Cell Biol 6:622–634.
3. Schwartz MA, DeSimone DW (2008) Cell adhesion receptors in mechanotransduction.Curr Opin Cell Biol 20:551–556.
4. Chen CS, Tan J, Tien J (2004) Mechanotransduction at cell-matrix and cell-cell contacts.Annu Rev Biomed Eng 6:275–302.
5. Gardel ML, Schneider IC, Aratyn-Schaus Y, Waterman CM (2010) Mechanical integra-tion of actin and adhesion dynamics in cell migration. Annu Rev Cell Dev Biol26:315–333.
6. Paul AJ, Jessamine PW, Maria EM, Qi W (2009) The hard life of soft cells. Cell MotilCytoskel 66:597–605.
7. Discher DE, Janmey P, Wang Y-l (2005) Tissue cells feel and respond to the stiffness oftheir substrate. Science 310:1139–1143.
8. le Duc Q, et al. (2010) Vinculin potentiates E-cadherin mechanosensing and is recruitedto actin-anchored sites within adherens junctions in a myosin II-dependent manner.J Cell Biol 189:1107–1115.
9. Ladoux B, et al. (2010) Strength dependence of cadherin-mediated adhesions. BiophysJ 98:534–542.
10. Ganz A, et al. (2006) Traction forces exerted through N-cadherin contacts. Biol Cell98:721–730.
11. Hutson MS, et al. (2003) Forces for morphogenesis investigated with laser microsur-gery and quantitative modeling. Science 300:145–149.
12. Peralta XG, et al. (2007) Upregulation of forces and morphogenic asymmetries indorsal closure during Drosophila development. Biophys J 92:2583–2596.
13. Rauzi M, Verant P, Lecuit T, Lenne P-F (2008) Nature and anisotropy of cortical forcesorienting Drosophila tissue morphogenesis. Nat Cell Biol 10:1401–1410.
14. Fernandez-Gonzalez R, et al. (2009) Myosin II dynamics are regulated by tension inintercalating cells. Dev Cell 17:736–743.
15. Trepat X, et al. (2009) Physical forces during collective cell migration. Nat Phys5:426–430.
16. Liu Z, et al. (2010) Mechanical tugging force regulates the size of cell-cell junctions.Proc Natl Acad Sci 107:9944–9949.
17. Tsai J, Kam L (2009) Rigidity-dependent cross talk between integrin and cadherinsignaling. Biophys J 96:L39–L41.
18. de Rooij J, et al. (2005) Integrin-dependent actomyosin contraction regulates epithe-lial cell scattering. J Cell Biol 171:153–164.
19. Sabass B, Gardel ML, Waterman CM, Schwarz US (2008) High resolution tractionforce microscopy based on experimental and computational advances. Biophys J94:207–220.
20. Adams CL, Chen Y-T, Smith SJ, James Nelson W (1998) Mechanisms of epithelial cell–cell adhesion and cell compaction revealed by high-resolution tracking of E-cadherin–green fluorescent protein. J Cell Biol 142:1105–1119.
21. Yamada S, Nelson WJ (2007) Localized zones of Rho and Rac activities drive initiationand expansion of epithelial cell cell adhesion. J Cell Biol 178:517–527.
22. Shewan AM, et al. (2005) Myosin 2 is a key rho kinase target necessary for the localconcentration of E-cadherin at cell-cell contacts. Mol Biol Cell 16:4531–4542.
23. Meza I, et al. (1980) Occluding junctions and cytoskeletal components in a culturedtransporting epithelium. J Cell Biol 87:746–754.
24. Ohashi T, Ichihara H, Sakamoto N, Sato M (2009) Specify of traction forces to extra-cellular matrix in smooth muscle cells. IFMBE Proc 23:1–2.
25. Hu S, et al. (2003) Intracellular stress tomography reveals stress focusing and structuralanisotropy in cytoskeleton of living cells. Am J Physiol-Cell Ph 285:C1082–1090.
26. Cai Y, et al. (2010) Cytoskeletal coherence requires myosin-IIA contractility. J Cell Sci123:413–423.
27. Wang N, et al. (2002) Cell prestress. I. Stiffness and prestress are closely associated inadherent contractile cells. Am J Physiol-Cell Ph 282:C606–616.
28. Paszek MJ, et al. (2005) Tensional homeostasis and the malignant phenotype. CancerCell 8:241–254.
29. Guo WH, Frey MT, Burnham NA, Wang YL (2006) Substrate rigidity regulates theformation and maintenance of tissues. Biophys J 90:2213–2220.
30. Levental KR, et al. (2009) Matrix crosslinking forces tumor progression by enhancingintegrin signaling. Cell 139:891–906.
Maruthamuthu et al. PNAS ∣ March 22, 2011 ∣ vol. 108 ∣ no. 12 ∣ 4713
BIOPH
YSICSAND
COMPU
TATIONALBIOLO
GY
APP
LIED
PHYS
ICAL
SCIENCE
S
Dow
nloa
ded
by g
uest
on
Apr
il 25
, 202
0