c:\documents and settings\administrator\桌面\cet2012\文章信息
TRANSCRIPT

Advances in Materials Physics and ChemistrySupplement: 2012 world Congress on Engineering and Technology
Copyright © 2012 SciRes. AMPC
TABLE OF CONTENTS
October 26, 2012
A First-Principles Study of Structure-Property Correlation and the Origin of Ferrimagnetism
in Gallium Ferrite
Amritendu Roy, Ashish Garg, Rajendra Prasad,Sushil Auluck 1
Preparation, characterization and thermal expansion of Pr co-dopant in Samarium doped
Ceria
V.Venkatesh, V.Prashanth Kumar, R.Sayanna and C.Vishnuvardhan Reddy 5
Antibacterial activity of TiO2/Ti composite photocatalyst films treated by ultrasonic cleaning
Yun Lu, Lian Hao, Yutaka Hirakawa and Hiromasa Sato 9
Optical Properties Of Mn2+ Doped Lead Phosphate (Lp) Glasses
C. Dayanand 13
Sol-gel Synthesis of TiO2 Thin Films from In-house Nano-TiO2 Powder
Mohd Zainizan Sahdan, Nafarizal Nayan, Samsul Haimi Dahlan,Mahdi Ezwan Mahmoud,Uda
Hashim 16
Fluoride processing of titanium-containing minerals
N.M. Laptash and I.G. Maslennikova 21
Thermoelectrical investigation of rare earth sulfide materials
V.V. Sokolov, V.V. Bakovetz, S.M. Luguev, N.V. Lugueva 25
The Reaction Sequence and Dielectric Properties of BaAl2Ti5O14 Ceramics
Xiaogang Yao, Wei Chen, Lan Luo 28
Pulsed Gas Jets for Formation of High-Intensity Cluster Beams
N. G. Korobeishchikov, A. E. Zarvin, V. V. Kalyada, A. A. Schmakov 31
A sewage sludge derived composite material for adsorption of antibiotics – kinetics
Pengfei Zhang and Rui Ding, Mykola Seredych and Teresa J. Bandosz 35
Synthesis and Characterization of Poly(1-methoxy-4-octyloxy)-para-phenylene vinylen for
Light-emitting diodes application
Piched Anuragudom 38
Photocatalytic of TiO2-SiO2 thin films co-doped with Fe3+ and thio-urea in the degradation
of formaldehyde by indoor and outdoor visible lights
Charuwan Kaewtip, Kamolporn Accanit, Nat-a-nong Chaowai, Kanokpun Areerat, Pasuree
Reanjaruan, Virote Boonumnauyvitaya 40
Apatite Deposition on ZrO2 Thin Films by DC Unbalanced Magnetron Sputtering
Arisara Thaveedeetrakul, Virote Boonamnuayvitaya, Nirun Witit-anun 45
Low Temperature Electrical Transport in Double Layered CMR Manganite
La1.2Sr1.4Ba0.4Mn2O7

Advances in Materials Physics and ChemistrySupplement: 2012 world Congress on Engineering and Technology
Copyright © 2012 SciRes. AMPC
Y.S. Reddy, P. Kistaiah and C. Vishnuvardhan Reddy 49
The minimum energy principle in description of nonlinear properties of orthotropic material
Tadeusz WEGNER, Dariusz KURPISZ 53
Synthesis of Aluminum-doped Zinc Oxide Nanowires hydrothermally grown on plastic
substrate
Concepción Mejía García, Elvia Díaz Valdés, Ana Ma. Paniagua Mercado, Arturo F. Méndez
Sánchez, Jose A. Andraca Adame, Velumani Subramaniam, Josue Romero Ibarra 56
Morphology and electronic properties of hybrid organic-inorganic system: Ag nanoparticles
embedded into CuPc matrix
I.M. Aristova, O.Yu.Vilkov,A.Pietzsch, M. Tchaplyguine,O.V. Molodtsova, V.Yu. Aristov 60
Preparation and Property Analysis of Melamine Formaldehyde Foam
Dongwei Wang, Xiaoxian Zhang, Song Luo, Sai Li 63
Abrasive Wear Behavior of Different Thermal Spray Coatings and Hard Chromium
Electroplating On A286 Super Alloy
Macid NURBAŞ,Elif Nazik ATABAY DURUL 68
Ion mobility in the fluorite solid solutions 50PbF2–30BiF3–20K(Na)F according to 19F, 23Na
NMR data
V.Ya. Kavun a, A.B. Slobodyuk a, I.A. Telin a, R.M. Yaroshenko a, I.G. Maslennikova a, V.K.
Goncharuk a, V.I. Kharchenko 71
Influence of Waste Materials Containing Tungsten on Melting and Crystallization of
Glass-ceramics
Shaomin Lin,Bo Wang, Guishen Liu, Liqing Li, Xiaodong Hou 74
Impacts of melt spinning and element substitution on electrochemical characteristics of the
La–Mg–Ni-based A2B7-type alloys
Yanghuan Zhang, Hongwei Shang, Ying Cai, Zhong-hui Hou, Guofang Zhang, Dongliang Zhao 78
Laser Deposition of Tetrasulfonated Phthalocyanine Layers for Gas Sensors
Premysl Fitla, Martin Vrnataa, Dusan Kopeckya, Jan Vlceka, Jitka Skodovaa, Jaroslav
Hofmanna, Vladimir Myslikb 84
Polypyrrole micro/nanostructure prepared using azo dyes with different substituents
Dusan Kopecky, Jitka Skodova, Martin Vrnata, Premysl Fitl 89
BPSCCO superconducting films grown by spray pyrolysis technique: systematic study of the
relationship between Pb content and annealing conditions
Elvia Díaz Valdés, Concepción Mejía García, Ana María Paniagua Mercado, Arturo Méndez
Sánchez 92
Development And Characterization Of Ultra Low Cement Castable Cordierites By
Thixotropic Properties Mixtures
Ana M. Paniagua-Mercado1, Arturo Méndez-Sánchez, Elvia Díaz Valdés, Concepción Mejía
García,Paulino Estrada Díaz, 96

Advances in Materials Physics and ChemistrySupplement: 2012 world Congress on Engineering and Technology
Copyright © 2012 SciRes. AMPC
Increasing The Burned Time And Mechanical Properties With New Mix As Flame Retardant
Based In Hexametaphosphate Of Sodium And Borax In Textile 100% Acrylic Fabrics
M. Olvera-Graciaa, L. Mercado-Velazqueza, A.M. Paniagua-Mercadob, 99
Influence of Humidity on Yield Stress Determination by Slump Test of Slip-Prone Clayey
Soils and Their Relation with the Chemical Properties
Arturo F. Méndez-Sánchez, Ana M. Paniagua-Mercado1, Karen E. Nieto-Zepeda, Leonor
Pérez-Trejo, Elvia Diaz Valdés, Concepción Mejía García 102
Preparation of high Ga content Cu(In,Ga)Se2 thin films by sequential evaporation process
added In2S3
Toshiyuki Yamaguchi, Kazuma Tsujita, Shigetoshi Niiyama, Toshito Imanishi 106
Thermal Degradation Kinetics of iPP/Pd Nanocomposite Prepared by a Drying Process
Jae-Young Lee, Hong-Ki Lee, Sung-Wan Hong, Il-Yub Choi 110
Evaluation of UV optical fibers behavior under neutron irradiation
Dan Sporea, Adelina Sporea, Mirela Ancuta, Dumitru Barbos, Maria Mihalache, Mirea Mladin 115
Adsorption Of Cu(II), Ni(II), Zn(II), Cd(II) And Pb(II) Onto Kaolin/Zeolite Based-
Geopolymers
Bassam El-Eswed,Mazen Alshaaer,Rushdi Ibrahim Yousef,Imad Hamadneh,Fawwaz Khalili 119
Fabrication of Sn coatings on alumina balls by mechanical coating technique and
relevant process analysis
Liang Hao, Yun Lu, Hiromasa Sato, Kazuki Chiba 126
AlSi11/ Si3N4 interpenetrating composites Tribology properties of aluminum matris
composites
Hongyan WANG, Shouren WANG*, Gaozhi LIU, Yingzi WANG 130
Mixing Enhancement In A Coaxial Jet Mixer
Valery Zhdanov, Egon Hassel 134
Biodiesel Production From Rubber Seed Oil Using A Limestone Based Catalyst
Jolius Gimbun, Shahid Ali, Chitra Charan Suri Charan Kanwal, Liyana Amer Shah, Nurul
Hidayah Muhamad @ Ghazali, Chin Kui Cheng, Said Nurdin 138
Facile and green synthesis of α,β-unsaturated ketone catalyzed by air-stable
organobismuth complex
Renhua Qiu, Yimiao Qiu, Zhengong Meng, Xingxing Song, Zhenyong Jia, Kun Yu, Shuangfeng
Yin,Chak-Tong Au*, Wai-Yeung Wong 142
Jet Plasma-Chemical Reactor For The Conversion Of Methane: The Use Of Clustering
A. E. Zarvin, N. G. Korobeishchikov, M. D. Khodakov, V. V. Kalyada 146
Micromixing of a Two Phase System in a Stirred Tank with Multiple Impellers
Lei Yang, Jingcai Cheng, Ping Fan, Chao Yang 150
Aqueous Two Phase Extraction for the Recovery of 1,3-Propanediol from its Aqueous
Solutions

Advances in Materials Physics and ChemistrySupplement: 2012 world Congress on Engineering and Technology
Copyright © 2012 SciRes. AMPC
Min Hee Chung, Yeon Ki Hong,Hyoung Wook Lee, Sung-Jun Park 154
Research on Supercritical Methanol Treatment of Lignite
Luan Haiyan,Wang Aiguo, Zhang Qian, Chen Fuming 158
Use of Compressive Reactor for Associated Petroleum Gas Processing
B. S. Ezdin, A. A. Nikiforov, V. E. Fedorov, A. E. Zarvin, S.A. Konovalov, V. V. Kalyada, I.
V. Mishchenko 162
Hydrogen as Carbon Gasifying Agent during Glycerol Steam Reforming over Bimetallic
Co-Ni Catalyst
Chin Kui Cheng, Rwi Hau Lim, Anabil Ubil, Sim Yee Chin, Jolius Gimbun 165
Progress of Modern Pyrolysis Furnace Technology
Guotai Zhang and Bruce Evans 169
Study on Rational Well Spacing Optimization of Low Permeability Gas Reservoir
ZHANG Jian-guo, WU Yong, AI Fang 173
Investigation of the Surface Properties of Vinyl Ethers – Sodium
2-Acrylamido-2-Methylpropanesulfonate Copolymers
S. Kh. Khussain, E. M. Shaikhutdinov, N. Zh. Seitkaliyeva, and A. Zh. Zhenisova 177
Coacervation Microencapsulation of CaCO3 Particles with a Fluoropolymer by
Pressure-induced Phase Separation of Supercritical Carbon Dioxide Solutions
Kenji Mishima1*, Haruo Yokota1, Takafumi Kato1, Tadashi Suetsugu2, Xiuqin Wei2, Keiichi
Irie3, Kenichi Mishima3, Michihiro Fujiwara3 181
Synthesis and Electrochemical Characterization of Li2MnSiO4 with Different Crystal
Structure as Cathode Material in Lithium Rechargeable Batteries
Joongpyo Shim, Sora Won, Gyungse Park, Ho-Jung Sun 185
Kinetic Study of Sulfur Dioxide Elimination by Limestone through the Lab Scale Circulating
Fluidized Bed Combustor
Dowon Shun, Dal-Hee Bae, In-Kyu Jang, Keon-Hee Park and Seung Kyu Park 189
Research of Extent of Well Control of Explored Reserves of Lithologic Deposit in Delta
Front Area
Ma Dong 193
Industrialization Process of Pesticide Residue Grade n-Hexane
Can QUAN1, Xiongwei YAN, Ting Huang, Hong Mei LI, Junsu JIN 197
Simulation of Multi-stage Flash(MSF)Desalination Process
Wu Lian-ying Xiao Sheng-nan Gao Cong-jie 200
Simulation of Countercurrent Multi-effect Drying System
LI Hong, WU Lianying, WU Xianli, HU Yangdong 206
Yttria Promoted Nickel Nanowire Catalyst for The Partial Oxidation of Methane to
Synthesis Gas
Xuebin Hong, Bingbing Li, Cong Zhang 212
The Study of Method for Complex Processing Turgay Sub-Standard

Advances in Materials Physics and ChemistrySupplement: 2012 world Congress on Engineering and Technology
Copyright © 2012 SciRes. AMPC
Aluminum-Containing Raw Materials
Sarsenbay G., Myltykbaeva L.A., Abdulwalyev R.A., Satylganova S.B. 216
Sustainable Polymers Derived From Naturally Occurring Materials
Bimlesh Lochab,I K. Varma; J. Bijwea 221
A Novel Method for the Protection and Activation of Histidine
Zhao Yinan, Zhang Shubiao*, Cui Shaohui, Chen Huiying, Wang Bing,Zhao Yinan, Zhang
Shufen 226
In Vitro Study of Carbamate-Linked Cationic Lipid for Gene Delivery against Cervical
Cancer Cells
Defu Zhi, Shuibao Zhang, Yinan Zhao, Shaohui Cui, Bing Wang, Huiying Chen,Defu Zhi,
Defeng Zhao 229
Optimization of Draft Tube Position in a Spouted Bed Reactor using Response Surface
Methodology
Elaheh Baghban, Arjomand Mehrabani-Zeinabad 232
Comparison of Gas Permeability and Selectivity between Alumina Membrane and Vycor
Glass at High Temperatures
F.N.TÜZÜN, E.KOÇDEMİR, G.UĞUZ 236
Experimental Studies on the Influence of HCO3- on Absorption and Desorption of CO2 from
Ammonia Solution
Shaojian Jiang, Wei Zhong, Rui Peng, Yong Jiang, Jun Zhang 240
Developing A Mathematical Model for Hydrate Formation in A Spray Batch Reactor
Mohammad Kazemeini,Farideh Freidoonian,Moslem Fattahi 244
Catalytic Feedstock Recycling of polymers
Raju Francis;Beena Sethi 249
Obtaining the Thin Semiconductive Covering Re-Se from Sulphate Electrolyte
E.A.Salakhova,A.M.Aliyev 253
Resolving a challenge in the modeling of hydrogen production using steam reforming of
Methane in monolith reactors using CFD methods
Mohammad Irani 253
Photocatalytic Degradation of Ethylene Dichloride in Water Using Nano TiO2 Supported on
Clinoptilolite as a Photocatalyst
Manouchehr Nikazar; Soheil Jalali Farahani; Mastaneh Reza Soltani 260
Simulation of Thermophysical Processes at Laser Welding of Alloys Containing
Refractory Nanoparticles
Anatoly N. Cherepanov, Vasily P. Shapeev, Liu Guangxun, Cao Lamei 264
Activation of quartz grain surface with chloride ions
Bondaletov D.N. Fedorova V.A. 269
The figure on the front cover is from the article published in Advances in Materials Physics and
Chemistry, 2012, Vol.2, Supplement, pp. 21-24 by N.M. Laptash and I.G. Maslennikova

Advances in Materials Physics and Chemistry (AMPC)
Journal Information
SUBSCRIPTIONS
The Advances in Materials Physics and Chemistry (Online at Scientific Research Publishing, www.SciRP.org) is published quarterly by Scientific Research Publishing, Inc., USA.
Subscription rates: Print: $39 per issue. To subscribe, please contact Journals Subscriptions Department, E-mail: [email protected]
SERVICES
Advertisements Advertisement Sales Department, E-mail: [email protected]
Reprints (minimum quantity 100 copies) Reprints Co-ordinator, Scientific Research Publishing, Inc., USA. E-mail: [email protected]
COPYRIGHT
Copyright©2012 Scientific Research Publishing, Inc.
All Rights Reserved. No part of this publication may be reproduced, stored in a retrieval system, or tr ansmitted, in any form or by any means, electronic, m echanical, pho tocopying, recording , s canning or ot herwise, ex cept as descri bed below, without th e permission in writing of the Publisher.
Copying of articles is not permitted except for personal and internal use, to the extent permitted by national copyright law, or under the terms of a license issued by the national Reproduction Rights Organization.
Requests for permission for other kinds of copying, such as copying for general distribution, for advertising or promotional purposes, for creating new collective works or for resale, and other enquiries should be addressed to the Publisher.
Statements and opinions expressed in the articles and communications are those of the individual contributors and not the statements and opinion of Scientific Research Publishing, Inc. We assumes no responsib ility or liability for any damage or injury to persons or property arising out of the use of any materials, instructions, methods or ideas contained herein. We expressly disclaim any implied warranties of merchan tability or fitness for a p articular purpos e. If expert assistance is requir ed, the s ervices of a competent professional person should be sought.
PRODUCTION INFORMATION
For manuscripts that have been accepted for publication, please contact: E-mail: [email protected]

A First-Principles Study of Structure-Property Correlation and the Origin of Ferrimagnetism in Gallium Ferrite
Amritendu Roy1, Ashish Garg1, Rajendra Prasad2 1Department of Materials Science and Engineering
2Department of Physics Indian Institute of Technology Kanpur
Kanpur, India – 208016 e-mail: [email protected]
Sushil Auluck National Physical Laboratory
Dr. K. S. Krishnan Marg,New Delhi, India-110012
Abstract— A first-principles study of structure property correlation and the origin of ferrimagnetism is presented based on LSDA+U method. In particular, the results for the ground state structure, electronic band structure, density of states, Born effective charges, spontaneous polarization and cationic disorder are discussed. The calculations were done using Vienna ab-initio simulation package (VASP) with projector augmented wave method. We find that the ground state structure is orthorhombic and insulating having A-type antiferromagnetic spin configuration. The cationic disorder is found to play an important role. Although the cationic site disorder is not spontaneous in the ground state, interchange of octahedrally coordinated Ga2 and Fe2 sites is most favored. We find that ferrimagnetism in gallium ferrite is primarily due to this exchange between Ga-Fe sites such that Fe spins at Ga1 and Ga2 sites are antiferromagnetically aligned while maintaining ferromagnetic coupling between Fe spins at Ga1 and Fe1 sites as well as between Fe spins at Ga2 and Fe2 sites. Further, the partial density of states shows noticeable hybridization of Fe 3d, Ga 4s, Ga 4p and O 2p states indicating some covalent character of Ga/Fe-O bonds. However, the charge density and electron localization functions show largely the ionic character of these bonds. Our calculation predicts spontaneous polarization of ~59 �C/cm2 along b-axis. Keywords: Gallium Ferrite, LSDA+U, Spontaneous Polarization, Ferrimagnetism, Cation site disorder
1. IntroductionGallium ferrite (GaFeO3 or GFO) is a room temperature piezoelectric and a ferrimagnet whose magnetic transition temperature (TC) is slightly lower than room temperature [1] but tunable to room temperature and beyond by tailoring the composition [1,2] and processing conditions.[1-3] Thus, compositionally modulated GFO is a promising candidate for room temperature magnetoelectric applications.
Early studies on GFO [2] predicted simultaneous piezoelectricity and ferromagnetism. Structural characterization using x-ray [1,4,5] and neutron [1,4,6]
diffraction techniques concluded an orthorhombic structure (Space Group: Pc21n) with eight formula units per unit cell, is stable over a wide temperature domain (4K-700K)[1,7]. The unit cell comprises of two types of Ga (Ga1 and Ga2) and Fe (Fe1 and Fe2) ions and six types of O (O1, O2,….O6) ions.[1] The above studies also suggest substantial cationic site
disorder i.e. some of the Ga sites are always occupied by Fe ions and vice-versa.[1] However, magnetic behavior of GFO had been a matter of uncertainty for a long time. Initial prediction of ferromagnetic ordering [2] was challenged by Frankel et al.[8] who using high field Mössbauer spectroscopy and macroscopic magnetic measurements proved collinear ferrimagnetism in GFO. Ferrimagnetic ordering has been further demonstrated by almost all subsequent studies using neutron diffraction technique.[1,4] Piezoelectricity in GFO, on the other hand, has been hardly studied with few exceptions showing that the piezoelectric constants are almost double to that of quartz [9] which is attributed to the asymmetric Ga1-O tetrahedron in the GFO unit cell.[10]
In spite of extensive experimental studies, first-principles calculations on GFO, have not been carried out much, partly due to the complex crystal structure with substantially large number of ions in the unit cell having partial site occupancies of the cations. However, such type of studies have been quite successful in predicting and analyzing structure-property correlations in complex material systems and in this regard, a detailed study on GFO would be particularly interesting to probe the hitherto disputed issues such as the ground state structure, magnetic structure and the piezoelectric response of the material. Our study, using first-principles calculations, shows that the ground state structure of GFO is A-type antiferromagnetic. The calculations indicate the presence of large spontaneous polarization (Ps) of ~ 59 �C/cm2 along crystallographic b-axis. Finally, we predict that the observed ferrimagnetism is solely due the inherent cation site disorder in the material.
2. Calculation MethodologyWe used Vienna ab-initio simulation package (VASP) [11] with projector augmented wave method (PAW) [12] in our work. The Kohn-Sham equation [13] was solved using local spin density approximation (LSDA+U) [14] with Hubbard parameter, U = 5 eV, and the exchange interaction, J = 1 eV. Our calculations for the determination of the ground states structure are based on the stoichiometric GFO assuming no partial occupancies of the constituent ions with starting parameters taken from previous literature.[1] We considered 3 valence electrons of Ga (4s24p1), 8 for Fe (3d74s1) and 6 for O
Advances in Materials Physics and Chemistry Supplement: 2012 world Congress on Engineering and Technology
Copyright © 2012 SciRes. 1

(2s22p4) ions. Structural optimization was carried out using Monkhorst-Pack [15] 7×7×12 mesh. Born effective charges, and spontaneous polarization for the ground state structure were calculated using Berry phase method. [16]
3. Results and DiscussionsA. Structural Optimization: Ground state structure Though previous literature predicts the ground state structure of GFO to be antiferromagnetic [1,17], possible antiferromagnetic configurations have not been explored. Therefore, we started with four possible antiferromagnetic spin configurations as shown schematically in Fig. 1(a)-(d) i.e. AFM-1, AFM-2, AFM-3 and AFM-4, to arrive at the ground state spin ordering. It should be noted that other possible antiferromagnetic spin configurations were found to be equivalent to one of the above configurations. Computation of the total energies of the above structures shows, that the energetically, AFM-3 > AFM-4 > AFM-2 > AFM-1. Therefore, we can conclude that AFM-1 spin configuration is the most favored configuration and all the further calculations were performed on AFM-1 structure.
Figure 1. Schematic representation of different antiferromagnetic ordering (a) AFM-1, (b) AFM-2, (c) AFM-3 and (d) AFM-4
Structural optimization by relaxing the ionic positions, lattice parameters and unit cell shape further reveals that the ground state structure retains the original Pc21n symmetry observed experimentally[1,18]. The calculated ground state lattice parameters: a = 8.6717 Å, b = 9.3027 Å and c = 5.0403 Å are in good agreement with previous experimental results.[1,7,18] Calculated ionic positions show that Fe1 and Fe2 ions are located on alternate planes parallel to ac-plane. Since Fe1 and Fe2 have antiparallel spin configurations and are situated on alternate parallel planes, we conclude (see Fig 1) that the ground state magnetic structure of GFO is A-type antiferromagnetic. Using the ground state structural data, we further calculated cation-oxygen bond length and Fe/Ga-O-Fe/Ga bond angles. We found that cation-oxygen polyhedra are significantly distorted which could contribute to the
observed piezoelectric behavior. Calculation of Fe-O-Fe, on the other hand, could be linked with the super-exchange interaction between O and neighboring Fe3+ ions. In general, larger the Fe-O-Fe bond angle results in stronger antiferromagnetic super-exchange.[19] The maximum value of Fe1-O1-Fe2, bond angle is ~168.54o while other angles are: Fe1-O3-Fe2, 123.13o and Fe1-O5-Fe2, 126.23o, respectively. Such large Fe-O-Fe bond angles (larger than 90°) results in antiferromagnetic ordering of Fe1 and Fe2 ions and lead to noticeable super-exchange interaction between Fe and O ions which is reflected in significantly large magnetic moments of O. Similar large bond angles among Fe1-O-Ga2 and Fe2-O-Ga1 ensure that Fe ions occupying Ga sites due to site disorder would therefore form strong antiferromagnetic spin arrangement between Fe at Ga1 with Fe2 and Fe at Ga2 with Fe1, respectively. Therefore we can conclude that any Fe ion, due to partial site occupancy, occupying Ga1 site would have antiferromagnetic ordering with Fe2 and Fe at Ga2 site and would be antiferromagnetically coupled with Fe1 site.
B. Electronic Band Structure, Density of States and BondingFig. 2 shows the electronic band structure along high symmetry directions and total density of states of GFO. It is found that GFO possesses a direct band gap (Eg) of ~2.0 eV (�- �). However, experimental studies reports a band gap of 2.7-3.0 eV.[20] The difference between our results and the experimental results is primarily due to underestimation of band gap by the LSDA technique which is very common in electronic structure calculation of oxides. [21] Cation site disorder, inherent to the experimental structure of GFO might also contribute to the effect of enhancing the band gap. [22] The angular momentum character of the bands over different energy domains can be identified by computing the partial density of states. Our calculations shows that the upper most part of the valence band is mainly composed of Fe 3d and O 2p states. Beyond the Fermi level, a narrow energy band (1.77 eV to 2.45 eV) comprises mainly of Fe 3d character, while the highest energy window has contributions from Fe 3d, Ga 4s, Ga 4p and O 2p states. Calculations of the partial density of states demonstrate significant hybridization of Fe 3d and O 2p states throughout the uppermost part of the valence band which further indicates presence of significant covalent character between Fe-O bonds.
Analysis of the chemical bonding can further be carried out by plotting electron localization function (ELF) which gives a measure of the local influence of the Pauli repulsion on the behavior of the electrons. A large value of ELF function indicates space with anti-parallel spin configuration .[23] Our calculation of ELF distribution in GFO unit cell (not shown here) depicts maximum ELF value at O sites and small values at Fe and Ga sites indicating charge transfer from Fe/Ga to O sites. A complete charge transfer was found between Fe2 and O3 ions. Similar charge transfer was also noticed between Fe1 and O1, O2 ions. Thus, we can predict that Fe-O bonds in GFO are mostly ionic. In comparison, finite value of ELF between O and Ga1 and Ga2 indicate some degree of covalent characteristics.
2 Copyright © 2012 SciRes.

C. Cation Site Disorder and Ferrimagnetism Calculation of the magnetic moments of the constituent
ions in the ground state shows that Fe1 and Fe2 ions have magnetic moments of + 4.05 �B and - 4.04 �B, respectively. We find that the magnitude of moments agrees reasonably well with the experimental data. [1] It was also found that the oxygen ions surrounding the Fe ions manifest small but finite magnetic moments attributed to super-exchange interactions with the surrounding Fe ions.
Till now, our calculations have been based on the ground state structure containing no partial site occupancies of the cations which is however, in contrast with the experimental reports showing significant Fe occupancies at the Ga sites. Thus, to probe the effect of cation site disorder on the magnetic characteristics of GFO, we selectively interchanged Fe and Ga sites and computed total energy of the system. Since, GFO unit-cell contains four ions of each type of cation, such an interchange would result in ¼th site occupancy of Fe ions at Ga sites and vice-versa. Calculations of total energy of these disordered structures show that partial site occupancy is not favored in the ground state, also observed previously by Han et al. [17] However, it was found that among various possible cases of site disorders, Fe2 ions preferentially occupying Ga2 sites is most probable since �E, the energy difference with respect to the ground state in that case is minimum. Although these energy differences may be affected by the computational methodology, the magnitude of the available thermal energy at room temperature (kT ~25 meV) is of the order of the energy difference for Fe2-Ga2 site disorder indicating towards the role of thermally originated defects. An important observation of the inclusion of cation site disorder in the calculation would be on the modification of the local magnetic moments. It was observed that upon interchanging Fe1 and Ga1 sites, the average magnetic moment of Fe ion at Ga1 site becomes 3.99 �B. On the other hand, the magnetic moment of Fe ion at Ga2 site becomes 4.11 �B when Fe2 and Ga2 sites are interchanged. In order to analyze the observed ferrimagnetism as against the antiferromagnetic ordering in the ground state, we further calculated the total magnetic moment of the disordered structure, using the partial site occupancies from the Rietveld refinement data [24] and taking the magnetic moments for different cation sites, from our calculation with site disorder. We estimated net magnetic moment of 0.24 �B/ Fe site which agrees quite well with experimental results. [25] Therefore, we conclude that ferrimagnetism in GFO is solely due to site disorder in the structure.
D. Born Effective Charge and Spontaneous Polarization Born effective charges (BEC or Z*), are important quantities in characterizing the piezoelectrics, ferroelectrics and multiferroics since they relate the lattice displacements and electric field and therefore give a measure long range Coulomb interaction, whose competition with the short range forces leads to the ferroelectric transition. Recent first-principles calculations show anomalously large BECs for some ions in common ferroelectrics [21] which are often explained as manifestation of strong covalent character of bonds between the specific ions. In GFO, from the ELF plots, we find that charge sharing between the Ga/Fe and O ions in cation-oxygen
bonds is insignificant while the structural data indicates large distortion of the cation-oxygen polyhedra. Since ferroelectric and/ piezoelectric responses are combined manifestations of structural distortions and effective charges of constituent ions [26] it is imperative to calculate the Born effective charges of ions in GFO. Here we calculate the BEC tensors of nonequivalent ions of GFO by slightly displacing each ion, one at a time, along three axes of Cartesian co-ordinates and then calculating the resulting difference in polarization, using Berry phase method. Table 1 lists the diagonal elements of BEC tensor for each ion. It is noticed that the principal elements of BEC tensor for Ga1 are close to the nominal ionic charge of Ga i.e., +3. Thus we predict that all the Ga1-O bonds are mainly ionic in nature. On the other hand, Ga2 develops a maximum effective charge of 3.53, ~ 18 % higher with respect to its nominal charge. In contrast, both Fe1 and Fe2 ions show much higher increase in the effective charges, 36 % and 27 % respectively. Oxygen ions show a maximum reduction of 39.5 % with respect to the nominal ionic charge.
Figure 2. Electronic band structure (left) and total density of states of GFO
with orthorhombic symmetry.
Structural analysis of GFO shows that while the constituent ions possess inversion symmetry in the crystallographic a and c directions, the inversion symmetry is lost in crystallographic b-direction. Since existence of spontaneous polarization (Ps) is manifestation of the lack of inversion symmetry, we argue that the direction of spontaneous polarization in GFO is only along the b-direction. Using the Born effective charges from Table 1, we further calculated the magnitude of Ps of GFO as ~ 58.63 �C/cm2 along the b-direction which is an order of magnitude larger than that predicted by Arima et al.[1] who neglected the role of effective charges and other ions in determining the magnitude of Ps. A calculation on the relative contribution of individual ions shows that the contribution of Ga1 is largest. However, it is balanced by opposite contributions from Fe1, O1, O2 and O6. Structural data further substantiate that these ions are the most asymmetrically placed around the inversion center whereas Ga2 and Fe2 cations maintain nearly centrosymmetric configuration and contribute minimum to the total polarization. Therefore, we predict that Ps in GFO is primarily contributed from Ga1, Fe1, O1, O2 and O6 ions.
Copyright © 2012 SciRes. 3

4. SummaryTo summarize, we show, using first-principles calculations using LSDA+U that orthorhombic Pc21n symmetry with A-type antiferromagnetic spin configuration is the ground state structure of gallium ferrite. The calculated ground state lattice parameters, bond strength and bond angles agree well with the reported as well as our experimental results. Electronic density of states showed hybridization among Fe 3d, Ga 4s, Ga 4p and O 2p states. From the electron localization function (ELF) calculation, we find almost complete charge transfer between Fe2 and O3 and Fe1 and O1, O2 ions suggesting that Fe-O bonds in GFO have mostly ionic character. Calculations also showed a spontaneous polarization of ~ 59 �C/cm2 along b-direction i.e. [010]-axis of GFO, attributed to the non-centrosymmetry and effective charges of Ga1, Fe1, O1, O2 and O6 ions. We find that the cation site disorder, although not preferred in the ground state, is the most favored configuration in the disordered state. An examination of the role of cation site disorder on magnetic structure of GFO shows modification of the local magnetic structure with altered magnetic moments of Fe ions at Ga site. This suggests that ferrimagnetism in GFO is solely due to the site disorder.
TABLE I. PRINCIPAL ELEMENTS OF BORN EFFECTIVE CHARGE TENSORS OF CONSTITUENT IONS ALONG WITH THEIR NOMINAL
CHARGES, IN GFO
Ion Nominal ionic charge
(e)
Z* (e)
Zxx Zyy Zzz
Ga1 +3 3.01 3.11 2.99 Ga2 +3 3.57 3.16 3.53 Fe1 +3 3.66 3.78 4.08 Fe2 +3 3.68 3.38 3.82 O1 -2 -2.29 -2.58 -2.79 O2 -2 -2.45 -2.29 -2.41 O3 -2 -2.54 -2.30 -2.75 O4 -2 -2.27 -2.85 -2.17 O5 -2 -2.50 -2.16 -2.79 O6 -2 -2.32 -2.08 -2.40
5.AcknowledgmentThe work was supported by Department of Science and
Technology, Govt. of India through project number SR/S2/CMP-0098/2010. SA thanks NPL for the J C Bose Fellowship.
REFERENCES [1] T. Arima, D. Higashiyama, Y. Kaneko, J. P. He, T. Goto,
S. Miyasaka, T. Kimura, K. Oikawa, T. Kamiyama, R. Kumai, and Y. Tokura, Physical Review B 70 (6), 064426 (2004).
[2] J. P. Remeika, Journal of Applied Physics 31 (5), S263 (1960).
[3] C. H. Nowlin and R. V. Jones, Journal of Applied Physics 34 (4), 1262 (1963).
[4] M. B. Mohamed, A. Senyshyn, H. Ehrenberg, and H. Fuess, Journal of Alloys and Compounds 492 (1-2), L20.
[5] W. Kim, J. H. We, S. J. Kim, and C. S. Kim, Journal of Applied Physics 101 (9), 09M515 (2007).
[6] Y. Kaneko, T. Arima, J. P. He, R. Kumai, and Y. Tokura, Journal of Magnetism and Magnetic Materials 272-276 (Part 1), 555 (2004).
[7] S. Mukherjee, A. Garg, and R. Gupta, Journal of Physics: Condensed Matter 23 (44), 445403 (2011).
[8] R. B. Frankel, N. A. Blum, S. Foner, A. J. Freeman, and M. Schieber, Physical Review Letters 15 (25), 958 (1965).
[9] D. L. White, Bull. Am. Phys. Soc. 5, 189 (1960). [10] S. C. Abrahams and J. M. Reddy, Physical Review Letters
13 (23), 688 (1964). [11] G. Kresse and D. Joubert, Physical Review B 59 (3), 1758
(1999). [12] P. E. Blöchl, Physical Review B 50 (24), 17953 (1994). [13] W. Kohn and L. J. Sham, Physical Review 140 (4A),
A1133 (1965). [14] V. I. Anisimov, F. Aryasetiawan, and A. I. Lichtenstein,
Journal of Physics: Condensed Matter 9 (4), 767 (1997). [15] H. J. Monkhorst and J. D. Pack, Physical Review B 13
(12), 5188 (1976). [16] R. D. King-Smith and D. Vanderbilt, Physical Review B
47 (3), 1651 (1993). [17] M. J. Han, T. Ozaki, and J. Yu, Physical Review B 75 (6),
060404 (2007). [18] S. C. Abrahams, J. M. Reddy, and J. L. Bernstein, The
Journal of Chemical Physics 42 (11), 3957 (1965). [19] J. B. Goodenough, Physical Review 100 (2), 564 (1955). [20] Z. H. Sun, S. Dai, Y. L. Zhou, L. Z. Cao, and Z. H. Chen,
Thin Solid Films 516 (21), 7433 (2008). [21] A. Roy and et al., Journal of Physics: Condensed Matter
22 (16), 165902 (2010). [22] S. Chen, X. G. Gong, A. Walsh, and S.-H. Wei, Applied
Physics Letters 94 (4), 041903 (2009). [23] A. Savin, R. Nesper, S. Wengert, and T. F. Fässler,
Angewandte Chemie International Edition in English 36 (17), 1808 (1997).
[24] A. Roy, S. Mukherjee, R. Gupta, S. Auluck, R. Prasad, and A. Garg, Journal of Physics: Condensed Matter 23 (32), 325902 (2011).
[25] A. Roy, R. Prasad, S. Auluck, and A. Garg, Journal of Applied Physics 111 (4), 043915 (2012).
[26] R. E. Cohen, in Piezoelectricity (Springer Berlin Heidelberg, 2008), Vol. 114, pp. 471.
4 Copyright © 2012 SciRes.

Preparation, characterization and thermal expansion of Pr co-dopant in Samarium doped Ceria
V.Venkatesh, V.Prashanth Kumar, R.Sayanna and C.Vishnuvardhan Reddy Dept.of Physics
Osmania University Hyderabad,INDIA
Abstract—The compositions Ce0.8-xSm0.2PrxO2-� (X=0, 0.02, 0.04, 0.06) were prepared through the sol–gel route. The effect of Pr addition on the crystal structure, densification and thermal expansion of Ce0.8Sm0.2O2-� was studied. The phase identification and morphology was studied by X-ray diffraction (XRD) and scanning electron microscopy (SEM). X-ray diffraction analysis showed that all the samples exhibit a fluorite structure. The lattice parameters were determined by X-ray powder diffraction. Lattice parameters and volume of the unit cell increases with Pr doping. Density of the all samples is more than 90% of theoretical density. The thermal expansion was measured using dilatometric technique in the temperature range 30–1000°C. It was observed that the thermal expansion increased linearly with increasing temperature for all the samples.
Keywords-solid oxide fuel cells, sol-gel,x-ray diffraction, scaning electron microscopy, thermal expansion
1. INTRODUCTION Solid oxide fuel cells (SOFCs) convert chemical energy
directly into electrical energy with high efficiency, environmental friendliness, and great flexibility in the choice of fuel[1-3]. Electrolytes used for SOFCs are usually the main components determining the performance of the fuel cell. Yttria stabilized zirconia (YSZ) is well established electrolyte, which can be used in commercial SOFCs. A typical high-temperature SOFC uses 8 mol% YSZ as electrolyte, usually operated at temperatures as high as 800-1000oC to obtain the required level of ionic conductivity. However, such high operating temperatures result in expensive fabrication costs and accelerate the degradation of fuel cell systems. Therefore, strong motivation to search for new, improved oxide-ion electrolytes at intermediate temperatures (400-700oC) persists. Lowering the operating temperature to an intermediate temperature (400-700°C) significantly enhances the long-term performance stability, lessens sealing problem, widens the material selection, and allows the use of low-cost metallic interconnects, thereby accelerating the commercialization of SOFC technology[4]. Doped ceria has been acknowledged as a potential electrolyte material for IT-SOFCs because of their high ionic conductivity and good compatibility with electrodes[5-6].
The ionic conductivities of ceria based electrolytes doped with various dopants(e.g., Sm3+, Gd3+, Y3+, Ca2+, Sr2+) at different dopant concentrations have been extensively investigated[7-13]. Sm3+ is considered one of the best dopants for ceria-based solid electrolytes currently available [14-16]. The co-doping technique has been effective method for improving the conductivity and leads to thermal expansion match between the electrodes and electrolyte in ceria based electrolytes for the IT-SOFCs [7]. In the present paper we report the sol-gel synthesis of Ce0.8-xSm0.2PrxO2-� for (0�x� 0.06). The powder characteristics such as crystallite size, surface area and thermal expansion have been determined as a function of x.
2. EXPERIMENTAL The sample with the general formula Ce0.8-xSm0.2PrxO2-�
(x=0, 0.02, 0.04, 0.06) were synthesized by sol-gel method. Ceric ammonium nitrate ((NH4)2Ce(NO3)6) (Merck, 99%), samarium oxide (Sm2O3) (Himedia-99.9%) and Praseodymium oxide (Pr6O11) (Himedia-99.9%) were used as starting materials. Stoichiometric amounts of samarium oxide and praseodymium oxide powders were mixed with nitric acid and placed on a heater at 50°C to convert into nitrates. Stoichiometric amount of Ceric ammonium nitrate was dissolved in distilled water. Nitrate solutions were added to Ceric ammonium nitrate solution and stirred properly. Citric acid was added to the whole solution in 1�1 molar metal ratio to bind the metal ions. The pH of solution was adjusted to �7 by adding ammonia. After evaporating the water, ethylene glycol was added and heated at about 90°C until a gel-type solution was formed. The gel was dried at 150°C and then decomposed at 250 °C in air for 2 h to decompose nitrates and all organic materials. The resultant ash was ground to get a fine homogeneous powder after that the powder was calcined at 600°C for 2 hours. The oxidation of Ce3+ to Ce4+ occurred during this stage [5]. Intermediate calcination and grounding of the synthesized powders were finally pressed in to pellets dimension 10mm in diameter 2mm in thickness, and then pellets were sintered in air at 1300°C for 4 hours. The densities of sintered samples measured in xylene by Archimedes principle. The sintered samples have above 90% of the theoretical density. Phase identification and crystallographic information of the samples were obtained from the X-ray data by using
Advances in Materials Physics and Chemistry Supplement: 2012 world Congress on Engineering and Technology
Copyright © 2012 SciRes. 5

20 30 40 50 60 70 80
PANalytical X’Pert Pro X-ray diffractometer (XRD) with Cu K� radiation (=1.54056 Å operated at 40kV and 30mA) at room temperature in the range 20°�2 �80°. Lattice parameter s were calculated by fitting the observed reflections with a least-square refinement UNIT CELL program. The surface morphology of the samples was observed using the scanning electron microscopy (SEM) (ZIESS EVO-18). The Thermal expansion measurements were carried out with a Netzsch push-rod dilatometer (DIL: Model Netzsch DIL 402 PC, Germany). Thermal expansion coefficient of the sintered sample pellets were measured using a constant heating rate of 3°C/min in the temperature range 30-1000°C. The rectangular samples of dimension 25mm×6mm×6mm were used these measurements. The rectangular pellets were pressed in a hydraulic press and sintered at 1300°C. Standard aluminum (Al2O3) reference sample was used for the temperature calibration.
(420
)(3
31)
(400
)
(222
)(311
)
(220
)
(200
)(111
)
x=0.06
x=0.04
x=0.02
x=0
Inte
nsity
(arb
.u))
2 Theta(deg)
I. RESULTS AND DISCUSSION
The X-ray diffraction patterns of the prepared system Ce0.8-xSm0.2PrxO2-� are shown in Fig. 1. Praseodymium as co-dopant into samarium doped ceria (SDC) ceramics sintered at 1300°C shows cubic fluorite structure with space group Fm3m (JCPDS powder diffraction File no.75-0158).
Fig.1:
XRD pattern of Ce0.8- xSm0.2PrxO2�
� (0�x �0.06).
The crystallite size (DXRD) is calculated according to the Scherrer equation[17].
DXRD = 0.9 / (�cos ) ------------------- (1) Where, is the wavelength of the radiation, is the diffraction angle and � is the full width in radians at half maximum intensity of powder pattern at 2. The crystallite sizes of the sample powders calculated by the Scherrer formula are in between 46nm and 59nm. In praseodymium, the ionic state changes from Pr3+ to Pr4+
under oxidizing process [18]. The introduction of Pr4+ into Ce4+ can cause a small shift in the ceria peaks. This shift is indicative of a change in the lattice parameter. The lattice parameter is increased with an increase Pr content due to the difference in ionic radii of Ce4+ (0.96Å) and Pr4+(1.14Å ) in an oxide solid solution [19]. As praseodymium content increases, the lattice parameter increases, this is indicates that Pr has been dissolved into Ce site in Ce0.8-xSm0.2PrxO2-� and in single
phase structure is formed. The lattice parameters, the unit cell volume and the type of structure of the system are presented in the table 1.
Fig.2 show the SEM photographs are clears that less
porous is residual, in accordance with the relative density of the sintered pellets.
Fig.2: SEM Photographs of Ce0.8Sm0.2O2-�, Ce0.78 Sm0.2Pr0.02O2-� and Ce0.74Sm0.2Pr0.06O2-�
x Structure a(Å) Volume (Å3)
0 Cubic 5.432 160.28 0.02 Cubic 5.436 160.71 0.04 Cubic 5.437 160.77 0.06 Cubic 5.438 160.82
X=0.0
X=0.022
X=0.06
6 Copyright © 2012 SciRes.

Relatively dense samples, with density greater than 90% of the theoretical values are required for the measurement of TEC [20].
DTH = z × M / 0.6023×V ------------------- (2)
Theoretical density can be calculated using by equation (2) where V (in Å3) is the volume of the unit cell as determined by XRD, M (in atomic mass units) is the mass of one formula unit, z is the number of such formula units in one unit cell of the crystal. The possible departures from stoichiometry have not been taken into account in calculating M. The bulk density (d), the theoretical density (dth), and d/dth (%) are summarized in table 2. All samples have densities above 90% of the theoretical value. . Table.2: Density measurements of Ce0.8-xSm0.2PrxO2-� (0�x �0.06)
200 400 600 800 10000.0
0.2
0.4
0.6
0.8
1.0
1.2
1.4
(dL/
L)%
Temperature (0C)
x=0x=0.02x=0.04x=0.06
The thermal expansion coefficients of electrolyte and electrodes should match, to avoid micro-cracks in between them for the operati0n of SOFC device at high temperatures. The thermal expansion data of Ce0.8-xSm0.2PrxO2-� (x=0, 0.02, 0.04, 0.06) obtained in the temperature range 30- 1000°C in air is shown in Fig.4. The thermal expansion depends on the electrostatic forces within the lattice, which depends on the concentration of positive and negative charges and their distances within the lattice. The thermal expansion increases due to the decrease in attractive forces. Thermal expansion of a lattice is characterized by a steady thermal expansion coefficient (�), for a certain structure and fixed oxygen to metal stoichiometry. The slope of thermal expansion curves for all the compositions are increased with temperature.
Fig.4: Temperature variation of thermal expansion of Ce0.8-xSm0.2PrxO2
(0�x�0.06). The thermal expansion coefficients (TEC) are
calculated from the thermal expansion curves and values are listed in Table.3. The results of the present study are in
contrast with the reported values. [10, 12-13, 21-24]. The disparity in the results may be due to preparation condition, non-stoichiometry of oxygen and oxidizing process of Pr.
Table 3: Thermal expansion co-efficient of Ce0.8-xSm0.2PrxO2-� (0�x �0.06)
CONCLUSIONS
Praseodymium and samarium co-doped ceria samples Ce0.8�xSm0.2PrxO2�� (x=0.00, 0.02, 0.04 and 0.06) are successfully synthesized through the sol–gel method. Dense ceramics are obtained by sintering the pellets at 1300 °C for 4 hours. The relative densities are over 90% of the theoretical density and these results are consistent with the SEM studies. The lattice parameter increased with increasing Pr content. Thermal expansion increased linearly with increasing temperature for all the samples. The values of thermal expansion coefficients of all the compositions are in the range of 12.25×10�6/°C to 13.31×10�6/°C. The present co-doped ceria materials can be used as possible electrolyte material for IT-SOFC applications.
ACKNOWLEDGMENTS One of the author, V.Venkatesh, thanks to the
University Grant Commission (UGC), New Delhi, India for the financial assistance under the scheme of Research Fellowships in Science for Meritorious Students (RFSMS).
REFERENCES[1] Xingbao Zhu, Zhe Lu, Bo Wei, Yaohui Zhang, Xiqiang Huang, Wenhui
Su, Int J Hydrogen Energy, vol.35, 2010, pp. 6897-904. [2] J. Nielsen, A Hagen, Y.L. Liu, Solid State Ionics, vol.181, 2010, pp.
517-24. [3] Yicheng Liou, Songling Yang, J Power Sources, vol.179, 2008, pp.553-
9. [4] N.P. Brandon, S. Skinner, B.C.H. Steele, Annu. Rev. Mater. Res., vol.
33, 2003, pp. 183. [5] B.C.H. Steele, Solid State Ionics, vol.129, 2000, pp. 95-110. [6] C.M. Lapa, D.P.F. De Souza, F.M.L. Figueiredo, F.M.B. Marques. Int J
Hydrogen Energy, vol.35, 2010, pp. 2737-41. [7] S.Omer, E.D.Wachsman, J.C.Nino, Solid State Ionics, vol.178,2008, pp.
1890-7. [8] S.Omer, E.D.Wachsman, J.C.Nino, Solid State Ionics, vol.177,2006, pp.
3199. [9] H.Inaba, H.Tagawa, Solid State Ionics, vol. 83, 1996, pp. 1. [10] N.Kim, BH.Kim, D.Lee, J.Power Sources, vol. 90, 2000, pp. 139. [11] S.Lubke, H.D.Wiemhofer, Solid State Ionics, vol.117, 1999, pp. 229. [12] V.Prashanth Kumar, Y,S.Reddy, G.Prasad, P.Kistaiah, C.Vishnuvardhan
Redyy, Mater.Chem.Phys, vol.112, 2008, pp. 711. [13] S.Ramesh, V.Prashanth Kumar, P.Kistaiah, C.Vishnuvadhan Redyy,
Solid State Ionics, vol. 181, 2010, pp. 86.
x Bulk Density (d)
Theoretical Density (dth)
d/dth%
0 6.769 7.216 93 0.02 6.934 7.197 96 0.04 6.725 7.195 93 0.06 6.818 7.192 94
TEC (10-6/oC) x 30- 600oC 30- 800oC 30- 1000oC
0 11.51 12.25 12.32 0.02 11.17 12.36 12.66 0.04 12.03 13.31 13.78 0.06 11.52 13.18 13.02
Copyright © 2012 SciRes. 7

[14] Yifeng Zheng, Liqiang Wu, Haitao Gu, Ling Gao, Han Chen, Lucun Guo. J Alloys Compd, vol.486, 2009, pp. 586-9.
[15] Yifeng Zheng, Shoucheng He, Lin Ge, Ming Zhou, Han Chen, Lucun Guo, Int. J of Hydrogen Energy, vol.36, 2011, pp. 5128-5135
[16] K. Eguchi, T. Setoguchi, T. Inoue, H. Arai. Solid State Ionics, vol.52, 1992, pp. 165-72.
[17] L.V. Azaroff, Elements of X-Ray Crystallography, McGraw-Hill, New York, 1968, 552.
[18] S.Lubke, H.D.Wiemhofer, Solid State Ionics, vol.117, 1999, pp. 229. [19] R.D.Shannon, Acta Cryst., vol. A32, 1976, pp. 751. [20] J. H. Kuo, H. U. Anderson, and D. M. Sparlin: J. Solid State Chem.,
vol.83, 1989, pp. 52. [21] S.R.Bishop, K.L.Dunkun, E.D.Wachsman, Electrochim. Acta, vol.54,
2009, pp. 1436. [22] H.Hayashi, M.Kanoh, C.J.Quan, H.Inaba, S.Wang, M.Dokiya,
H.Tagawa, Solid State Ionics, vol.132, 2000, pp. 227. [23] F.Tietz, Ionics, vol.5, 1999, pp. 129. [24] S.Wang, R.Zheng, A.Suzuki, T.Hashimoto, Solid State Ionics, vol.174,
2004, pp. 157.
8 Copyright © 2012 SciRes.

Antibacterial activity of TiO2/Ti composite photocatalyst films treated by ultrasonic cleaning
Yun Lu Graduate School & Faculty of Engineering
Chiba University 1-33, Yayoi-cho, Inage-ku, Chiba 263-8522, Japan
Lian Hao, Yutaka Hirakawa and Hiromasa Sato Graduate School Chiba University
1-33, Yayoi-cho, Inage-ku, Chiba 263-8522, Japan [email protected]
Abstract— In this work, TiO2/Ti composite films were fabricated by 2-setp MCT and the following high temperature oxidation. Antibacterial activity of the composite films treated by ultrasonic cleaning to increase the performance reliability was examined. The prepared TiO2/Ti composite films showed high photocatalytic activity in the degradation of methylene blue solution. It is obvious that TiO2/Ti composite films have antibacterial activity under UV irradiation.
Keywords-mechanical coating technique; TiO2/Ti composite film; photocatatlyst; antibacterial activity
1. INTRODUCTION In recent years, TiO2 photocatalysts have showed a high potential in the environmental and energy fields, including self-cleaning Surfaces, air and water purification systems, sterilization, hydrogen evolution and photoelectrochemical conversion, among others [1-3]. To lower the recycling cost and increase the degradation efficiency of pollutants, investigations of TiO2 photocatalysts are oriented toward the immobilization in the form of films [4,5]. Numerous techniques including physical vapor deposition (PVD), chemical vapor deposition (CVD), and sol-gel method, among others have been used to fabricate TiO2 photocatalyst films to increase their photocatalytic activity [6-8]. However, some disadvantages limit the applications of these techniques. For example, complicated and large scale equipments are required and their processes can be operated only in vacuum for PVD and CVD. In addition, the production cost is relatively high.
In this condition, we developed ball milling and proposed a novel coating technique called mechanical coating technique (MCT) to fabricate TiO2 photocatalyst films on alumina (Al2O3) balls [9-12]. In MCT, collision, friction and abrasion among Ti powder, alumina balls and the inner wall of the bowl are utilized effectively to form Ti films on alumina balls. After that, TiO2 films or TiO2/Ti composite films were fabricated by the following high-temperature oxidation. Although the TiO2 resultants had rutile crystal type, they showed relatively high photocatalytic activity [11]. Further, we developed 2-step MCT based on the concept of MCT to prepare TiO2/Ti composite films by coating nano-TiO2 powder particles on the Ti films without oxidation process [9, 12]. The
TiO2/Ti composite films showed high photocatalytic activity in the degradation of methylene blue solution. It is expected that the TiO2/Ti composite films on alumina balls are applied in the environmental and energy fields.
In this work, TiO2/Ti composite films on alumna balls were fabricated by 2-step MCT and the following high temperature oxidation. Ultrasonic cleaning was performed for the alumina balls with the TiO2/Ti composite films to increase the performance reliability. Photocatalytic activity and antibacterial activity of the TiO2/Ti composite films were evaluated and discussed.
2. EXPERIMENTALA. Fabrication of TiO2/Ti composite films First, Ti powder with an average diameter of 30 �m and a purity of 99.1% was used as the coating material. Alumina (Al2O3) balls with an average diameter of 1 mm were used as the substrates. Ti powder and Al2O3 balls were charged into a bowl made of alumina with a dimension of 75×70 mm (250 ml in volume). Then the mechanical coating was carried out by a planetary ball mill (Pulverisette 6, Fritsch). The rotation speed of the ball mill was set at 300 rpm and the milling time was 10 h. During the fabrication, milling operation was performed 10 min followed by 2 min intermittence to avoid the overheating of the bowl and the contents. The schematic diagram of MCT can be found in our published work [9].
Secondly, TiO2/Ti composite films were fabricated. The Al2O3 balls coated with Ti films and anatase TiO2 nanopowder of 7 nm in average diameter (ST-01, purity: 99.99 %, Ishihara Sangyo) were used as the substrate and the coating material, respectively. The rotation speed of planetary ball mill was 300 rpm. MCT was carried out for 3 h. Planetary ball mill (Pulverisette 6, Fritsch) was also employed for MCT in the second step.
Further, to enhance the photocatalytic activity and, the alumina balls with TiO2/Ti composite films were heat-treated at 773 K in air for 10 h. Subsequently, all the samples were cleaned in acetone by ultrasonic (frequency: 28 kHz) for 1.5 h to remove the unstrong adhesions on the surface of the samples to increase the performance reliability.
Advances in Materials Physics and Chemistry Supplement: 2012 world Congress on Engineering and Technology
Copyright © 2012 SciRes. 9

B. Characterization of TiO2/Ti composite films and evaluation of photocatalytic activity
The morphologies and the microstructures of the samples were observed by SEM (JSM-6510, JEOL).
Photocatalytic activity of the samples was evaluated by measuring the degradation rate of methylene blue (MB) solution at room temperature. The samples were spread uniformly on the bottom of a cylinder-shaped cell with 20×50 mm. To obtain the same initial conditions of evaluating photocatalytic activity for all the samples, pre-adsorption of MB solution was carried out using 3 ml MB solution with a concentration of 20 �mol/l before evaluating photocatalytic activity. Subsequently, the samples after the pre-absorption were spread uniformly on the bottom of the cell again and 7 ml MB solution with a concentration of 10 �mol/l was poured into the cell. Then photocatalytic activity was evaluated under UV light irradiation with an intensity of 1 mW/cm2 for 24 h. These evaluation conditions were referenced to Japanese Industrial Standard (JIS R 1703-2). The absorbance of MB solution was measured by a colorimeter (Sanshin Industrial Co., Ltd) with UV irradiation. The gradient, k (nmol·l-1·h-1) of MB solution concentration-irradiation time curve was calculated by the least-squares method with the data from 1~12 h and used as the degradation rate constants. The details of the evaluation can be found in our published work [12].
3.EVALUATION OF ANTIBACTIRAL ACTIVITY Antibacterial activity of the alumina balls with TiO2/Ti composite films was evaluated by using Escherichia coli test referred to JIS R 1702 for the flat film sample. The Ti film alumina balls by MCT were used for the control sample. First, the alumina balls (5 g) with TiO2/Ti composite films were washed by alcohol and air-dried, then spread uniformly on the bottom of a petri dish with 50×12 mm as shown in Fig.1. Subsequently, 0.8 ml solution of Escherichia coli
Petri dishOne layer sample
on the bottom
Figure 1. One layer of the alumina balls with TiO2/Ti composite films spread uniformly on the bottom of petri dish.
(NBRC3972) culture with 1.3~5×10⁵ colony/ml was dropped uniformly onto the the alumina balls on the bottom of the petri dish. In order to count the starting colonies of
Escherichia coli, the control samples of the Ti film alumina balls were immediately washed away by using 9.2 ml SCDLP medium as shown in Fig.2 and the medium was diluted by 10 fold dilution. Besides, the samples of the alumina balls with TiO2/Ti composite films were placed in the dark and under UN irradiation (by FL15BL-B) with 0.1 mW/cm2 (by UV-340A) for 8 h respectively as shown in Fig.3. Afterwards, the samples were washed away by using 9.2 ml SCDLP medium and the medium was diluted by 10 fold dilution as the control samples for counting the colonies of Escherichia coli. The all test were carried out at 25.4 ºC.
SCDLP agar
Petri dish with one layer sample
Figure 2. Wash-out of the culture medium in antibacterial activity test.
Black light
Samples
Figure 3. Antibacterial activity test under UV irradiation .
4. REASULTS AND DISCUSSION
A. Surface Morphologies and Photocatalytic Activity of the TiO2/Ti Films Fig.4 shows the surface morphologies of the TiO2/Ti films.
It can be found that the adhered some TiO2 particles on the surface of the Ti films were removed by ultrasonic cleaning. It must be that the removed TiO2 particles had relative weak adhesion strength and the performance reliability of the TiO2/Ti films will be increased by ultrasonic cleaning. Fig.5 gives the concentration evolution of MB solution as a function of UV irradiation time. After ultrasonic cleaning, although the degradation rate constants k was lower rather than that ( k=574 nmol·l-1h-1) without ultrasonic cleaning, still kept relative large value, 486 nmol·l-1h-1. It hints that there is enough TiO2, which
10 Copyright © 2012 SciRes.

has strong adhesion on the Ti film base after ultrasonic cleaning.
(a)
(b)
Figure 4. SEM images of surfaces of the films, (a) TiO2/Ti composite films and (b) TiO2/Ti composite films after ultrasonic cleaning.
0 10 200
2
4
6
8
10
UV irradiation time / h
MB
solu
tion
conc
entra
tion
/�m
ol·l-1
MB solution
Figure 5. Concentration evolution of MB solution as a function of UV irradiation time for TiO2/Ti composite films.
B. Antibactrial activity of TiO2/Ti composite films Fig.6 shows photographs of the poured plate cultures samples used the collected bacterial culture liquid. Compared of these photographs, it is obvious that the quantity of the bacillus coli in the case (Fig.6(d)) of TiO2/Ti films is less than that of the Ti films used for the control samples. It shows that TiO2/Ti films has antibacterial activity. Table 1 gives
antibacterial test conditions and results. The average count of Escherichia coli of the control samples had a starting average count, 3.6×10⁵, however, after 8 h, reached 18.0×10⁵ and 11.3×10⁵ in the dark place and under UV irradiation respectively. On the other hand, the average count of Escherichia coli for the TiO2/Ti films were less than
(a) In the dark place for Ti film balls (b) Under UV irradiation for Ti film balls
(d) Under UV irradiation for TiO2/Ti composite film balls
(c) In the dark place for TiO2/Ti composite film balls
Figure 6. The samples of the standing plate culture used the collected bacterial culture liquid after antibacterial test for 8 h of Ti and Ti/TiO2 composite films (The white points and circle bodies : bacillus coli).
Table 1 The antibacterial test conditions and results of TiO2/Ti composite films.
Sample Irradiation condition
Petri dishnumber
Total bacteria count
( 105)
Average bacteria count
( 105)
Ti films(control sample )
0 h
1 3.6
3.62 3.8
3 3.3
8 hin the dark place
1 17
18.02 19
3 18
8 hUV irradiation(0.1 mW/cm2)
1 11
11.32 12
3 11
TiO2/Ti composite
films
8 h in the dark place
1 9.6
9.32 8.1
3 10
8 hUV irradiation(0.1 mW/cm2)
1 1.8
1.72 1.6
3 1.8
these of the control samples of the Ti films, 9.3×10⁵ and 1.7×10⁵ in the dark place and under UV irradiation respectively. The TiO2/Ti composite films shown obvious antibacterial activity.
Copyright © 2012 SciRes. 11
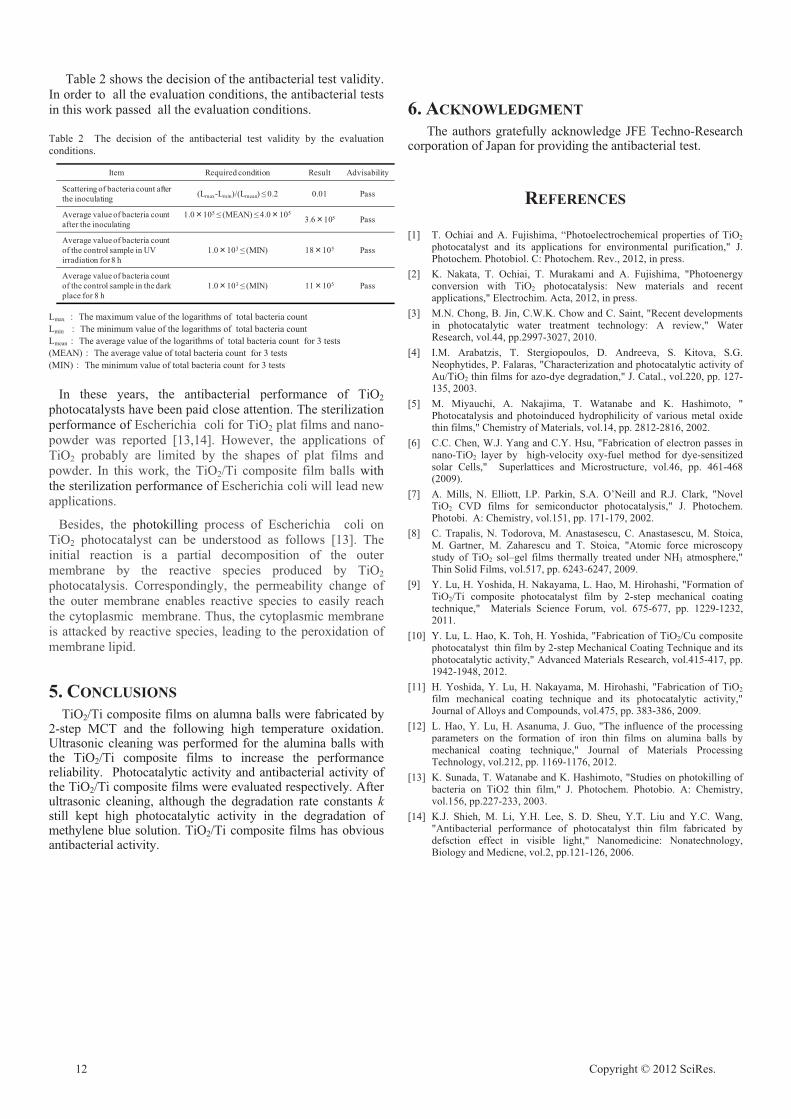
Table 2 shows the decision of the antibacterial test validity. In order to all the evaluation conditions, the antibacterial tests in this work passed all the evaluation conditions. 6. ACKNOWLEDGMENT
The authors gratefully acknowledge JFE Techno-Research corporation of Japan for providing the antibacterial test.
Table 2 The decision of the antibacterial test validity by the evaluation conditions.
Item Required condition Result Advisability
Scattering of bacteria count after the inoculating (Lmax-Lmin)/(Lmean) � 0.2 0.01 Pass
Average value of bacteria count after the inoculating
1.0 105 � (MEAN) � 4.0 1053.6 105 Pass
Average value of bacteria count of the control sample in UV irradiation for 8 h
1.0 103 � (MIN) 18 105 Pass
Average value of bacteria count of the control sample in the dark place for 8 h
1.0 103 � (MIN) 11 105 Pass
REFERENCES
[1] T. Ochiai and A. Fujishima, “Photoelectrochemical properties of TiO2 photocatalyst and its applications for environmental purification," J. Photochem. Photobiol. C: Photochem. Rev., 2012, in press.
[2] K. Nakata, T. Ochiai, T. Murakami and A. Fujishima, "Photoenergy conversion with TiO2 photocatalysis: New materials and recent applications," Electrochim. Acta, 2012, in press.
[3] M.N. Chong, B. Jin, C.W.K. Chow and C. Saint, "Recent developments in photocatalytic water treatment technology: A review," Water Research, vol.44, pp.2997-3027, 2010.
Lmax The maximum value of the logarithms of total bacteria count Lmin The minimum value of the logarithms of total bacteria count Lmean The average value of the logarithms of total bacteria count for 3 tests
[4] I.M. Arabatzis, T. Stergiopoulos, D. Andreeva, S. Kitova, S.G. Neophytides, P. Falaras, "Characterization and photocatalytic activity of Au/TiO2 thin films for azo-dye degradation," J. Catal., vol.220, pp. 127-135, 2003.
(MEAN) The average value of total bacteria count for 3 tests (MIN) The minimum value of total bacteria count for 3 tests In these years, the antibacterial performance of TiO2 photocatalysts have been paid close attention. The sterilization performance of Escherichia coli for TiO2 plat films and nano-powder was reported [13,14]. However, the applications of TiO2 probably are limited by the shapes of plat films and powder. In this work, the TiO2/Ti composite film balls with the sterilization performance of Escherichia coli will lead new applications.
[5] M. Miyauchi, A. Nakajima, T. Watanabe and K. Hashimoto, " Photocatalysis and photoinduced hydrophilicity of various metal oxide thin films," Chemistry of Materials, vol.14, pp. 2812-2816, 2002.
[6] C.C. Chen, W.J. Yang and C.Y. Hsu, "Fabrication of electron passes in nano-TiO2 layer by high-velocity oxy-fuel method for dye-sensitized solar Cells," Superlattices and Microstructure, vol.46, pp. 461-468 (2009).
[7] A. Mills, N. Elliott, I.P. Parkin, S.A. O’Neill and R.J. Clark, "Novel TiO2 CVD films for semiconductor photocatalysis," J. Photochem. Photobi. A: Chemistry, vol.151, pp. 171-179, 2002. Besides, the photokilling process of Escherichia coli on
TiO2 photocatalyst can be understood as follows [13]. The initial reaction is a partial decomposition of the outer membrane by the reactive species produced by TiO2 photocatalysis. Correspondingly, the permeability change of the outer membrane enables reactive species to easily reach the cytoplasmic membrane. Thus, the cytoplasmic membrane is attacked by reactive species, leading to the peroxidation of membrane lipid.
[8] C. Trapalis, N. Todorova, M. Anastasescu, C. Anastasescu, M. Stoica, M. Gartner, M. Zaharescu and T. Stoica, "Atomic force microscopy study of TiO2 sol–gel films thermally treated under NH3 atmosphere," Thin Solid Films, vol.517, pp. 6243-6247, 2009.
[9] Y. Lu, H. Yoshida, H. Nakayama, L. Hao, M. Hirohashi, "Formation of TiO2/Ti composite photocatalyst film by 2-step mechanical coating technique," Materials Science Forum, vol. 675-677, pp. 1229-1232, 2011.
[10] Y. Lu, L. Hao, K. Toh, H. Yoshida, "Fabrication of TiO2/Cu composite photocatalyst thin film by 2-step Mechanical Coating Technique and its photocatalytic activity," Advanced Materials Research, vol.415-417, pp. 1942-1948, 2012.
5. CONCLUSIONS [11] H. Yoshida, Y. Lu, H. Nakayama, M. Hirohashi, "Fabrication of TiO2 film mechanical coating technique and its photocatalytic activity," Journal of Alloys and Compounds, vol.475, pp. 383-386, 2009. TiO2/Ti composite films on alumna balls were fabricated by
2-step MCT and the following high temperature oxidation. Ultrasonic cleaning was performed for the alumina balls with the TiO2/Ti composite films to increase the performance reliability. Photocatalytic activity and antibacterial activity of the TiO2/Ti composite films were evaluated respectively. After ultrasonic cleaning, although the degradation rate constants k still kept high photocatalytic activity in the degradation of methylene blue solution. TiO2/Ti composite films has obvious antibacterial activity.
[12] L. Hao, Y. Lu, H. Asanuma, J. Guo, "The influence of the processing parameters on the formation of iron thin films on alumina balls by mechanical coating technique," Journal of Materials Processing Technology, vol.212, pp. 1169-1176, 2012.
[13] K. Sunada, T. Watanabe and K. Hashimoto, "Studies on photokilling of bacteria on TiO2 thin film," J. Photochem. Photobio. A: Chemistry, vol.156, pp.227-233, 2003.
[14] K.J. Shieh, M. Li, Y.H. Lee, S. D. Sheu, Y.T. Liu and Y.C. Wang, "Antibacterial performance of photocatalyst thin film fabricated by defsction effect in visible light," Nanomedicine: Nonatechnology, Biology and Medicne, vol.2, pp.121-126, 2006.
12 Copyright © 2012 SciRes.

Optical Properties Of Mn2+ Doped Lead Phosphate (Lp) GlassesC. Dayanand
Department of Physics, Science & Humanities, Tirumala Engineering College, Jawaharlal Nehru Technology University, Hyderabad, India
Abstract-- Doping of MnO (less than One mole %) in LP glass system promotes the transparency and the general quality of the LP glass.- Mn2+ occupying an Oh site in the LP glass network - The influence of the LP glass network on Mn2+ energy levels and its electronic structure seems to be different when the concentration of MnO is extremely small (0.2 mole%) - The observation of single band of Mn2+ in this case probably correlates well with the observation of forbidden hyperfine EPR transitions in the same glass.
Keywords- Lead Phosphate, optical absorption spectra,ligand Coordination. Eutectic mixture, crystal field environment, forbidden bands.
1. Introduction
In this article the optical investigations made on [x (PbO - (1-x) P2O5)] Lead Phosphate (LP) glasses and were discussed. The objective of studying optical absorption spectra of Mn2+
doped LP glass system is two fold. Firstly it is interesting to understand the effect of magnetic ion like Mn2+ on the absorption edge in particular and on energy bands in general of LP glass system. Secondly it is much more interesting to study the effect of lead phosphate glass network on the electronic structure and energy levels of Mn2+ ion. The energy level diagram of Mn2+ is same in Oh and Td, the spectra in the two geometry’s are distinct which is the most interesting [1] aspect of the optical study. There appear to be not many investigations on the electronic absorption spectra of Mn2+ ion in glasses [1] probably for weak and poorly, resolved optical absorption bands in glasses. However, there are some reports on optical absorption spectra of Mn2+ doped silicate, [1-3] borate [1-2] phosphate [1-6] and other glasses. As already mentioned, although Mn2+ can enter into Oh or Td site in a glass, the absorption spectra observable could be different depending on various factors. However, optical absorption bands of Mn2+ are still expected to appear in greater intensity if Mn2+ exists in Td - ligand coordination than when it exists in Oh - ligand coordination. Thus, “Mn2+ is an excellent ion for probing the local site geometry in various glassy matrices even by optical absorption technique”, even though its overall absorptivity is very low. Because of the number and energy distribution of distinct ligand field - sensitive transitions observable, the
potential value of Mn2+ for structural diagnosis studies in glasses is very high, but so far it has not been fully exploited. The present work aims at filling up this gap to a certain extent.
2. Experimental The Mn2+ doped LP glasses were prepared by taking PbO, ADP and suitable quantity of MnO2 together and thoroughly mixing and grinding the chemicals. Thus, the method of preparation of the Mn2+ doped LP glasses is exactly same as describe in the [7]. However, certain observations in respect of liquidus temperature and the time required for the melt to be maintained at that temperature have been made. Since MnO2 in the eutectic mixture of PbO and P2O5 is expected to undergo the chemical reaction.
2 MnO2 � 2 MnO � O2 � . . . . . . . . . . . . (1)
It is observed that effervescence takes place at the melt temperature. Therefore, the time required to obtain clear, transparent and bubble free melt was longer in the case of MnO doped LP glasses. These observations indicate that the presence of MnO as an impurity promotes the ease with which the glasses can be prepared. Further, the glasses obtained were less hygroscopic, chemically more durable with better homogeneity and visibly more transparent than their corresponding undoped LP glasses. These doped glasses were used for recording the optical absorption spectra, sometimes, in conjunction with the undoped glasses.
3. Results And Discussion
The optical absorption spectra in the range of 200 to 700 nm typically for Mn2+ doped LP glasses with x = 0.35, 0.40, 0.45 containing higher concentration (0.7 mole %) of Mn2+
are shown in Fig. 1 as curves A, B, C, respectively. For x=0.50, the spectrum is shown as curve D in Fig. 2 respectively. It is seen in all these spectra that both visible and UV regions are totally free from any absorption bands due to Mn2+. At the same time it is seen that, the absorption edges of these doped glasses are almost unaffected within the error of � 2 nm.
Advances in Materials Physics and Chemistry Supplement: 2012 world Congress on Engineering and Technology
Copyright © 2012 SciRes. 13

Specifically, in Fig.2 the spectra of undoped and Mn2+
doped glasses (x=0.5) are given together for comparison. While the optical absorption edge at 258 � 2 nm coincides for both the glasses, it can be seen that the absorbance of undoped glass is higher than the absorbance of the Mn2+ doped glass. In order to make proper comparison of the transparency of the undoped and Mn2+ doped (high concentration, (HC)) glasses, the absorption coefficients of these glasses have been calculated at the average wavelength (550 nm) of the visregion. The values are found to be
ible
l
Orge
]. As a result, the absorption intensity
n , Mn or even Mn .
(undoped) � = 4.3 cm (Mnoped), which suggest that doped glass is again more
transparent (1.8 times).
� = 10.7 cm-1 (undoped), � = 1.6 cm-1 (Mn2+ doped)
These values clearly suggest that Mn2+ doped glasses are at least 7 times [i.e. ratio of � (undoped) to � (doped)] more transparent than the undoped glasses. Thus the role of Mn2+
impurity in LP glass appear to be limited to promoting the ease of glass formation, while having no effect on the absorption edge. his app ars to be dT e ue to the smal concentration of Mn2+ impurity in the glass. It is sur ising t at the Mn2+ in any of pr h x PbO - (1- x) P2O5glasses does not exhibit any d-d bands. The Mn2+ ion (d5) has five unpaired electrons in the valence shell distributed in the t2g and eg orbitals either in Oh or Td,symmetry. In free ion state it will give rise to a number of free ion terms in the increasing order of energy 6S, 4G, 4P, 4D, 2I, 2G,2H, 4F, 2D, 2F, 2F, 2S, 2D, 2G, 2P and 2D. When the ion is placed in a ligand field, these levels split further into number of components depending on the strength of crystal field environment [4,6]. The energy level diagram for d5
configuration has been calculated by number of authors including Tanabe and Sugano [8] and l [9]. Tanabe and Sugano or Orgel diagram for Mn2+(d5) they have been discussed in the literature extensively. Since not a single band in the Mn2+ (HC) doped LP glass has been observed, it is felt that either concentration of Mn2+ is not sufficient or lead phosphate glass system as such has great influence on the absorption bands of Mn2+ ion. One fact that can be concluded with certainty is that the Mn2+ in LP glass system occupies an Oh site in which case the absorption bands are expected to be very weak. On the other hand if Mn2+ ion were to be in a Tdligand coordination mixing of d-orbitals with p-orbitals is expected to take place [2is expected to be 10 to 100 times more than that due to the ion in the Oh environment. Our efforts to increase the concentration of Mn2+ in the LP glasses by the addition of higher quantities of starting chemical, MnO2 have not been successful. With increase in the concentration of MnO2, the lead phosphate glasses are found to gain color but no specific bands of Mn2+ could be observed. This indicates that higher amount of MnO2 does not lead to higher number of Mn2+ ions and probably Manganese changes to other oxidation states of M 3+ 6+ 7+
Therefore, for increasing Mn2+ ions, the starting compound may have to be different from MnO2. Fig. 3 gives the absorption spectra of both undoped and doped (low concentration, (LC)) LP glass for x = 0.5. The absorption coefficients calculated for undoped and doped glasses are � = 7.6 cm-1 -1 2+
d
In order to detect the presence of any weak absorption bands due to Mn2+ in this particular LP glass (Fig. 3). The absorption spectrum of doped glass has been recorded with the undoped glass in the path of the reference beam to compensate for the host network absorption. It is interesting to note that the effort led to the detection of a weak but definite absorption band at 261 nm (38,310 cm-1) shown in Fig 4. A comparison of the k pea position of this band with the bands reported in the
literature [4] indicates that it should be attributed to
14 Copyright © 2012 SciRes.
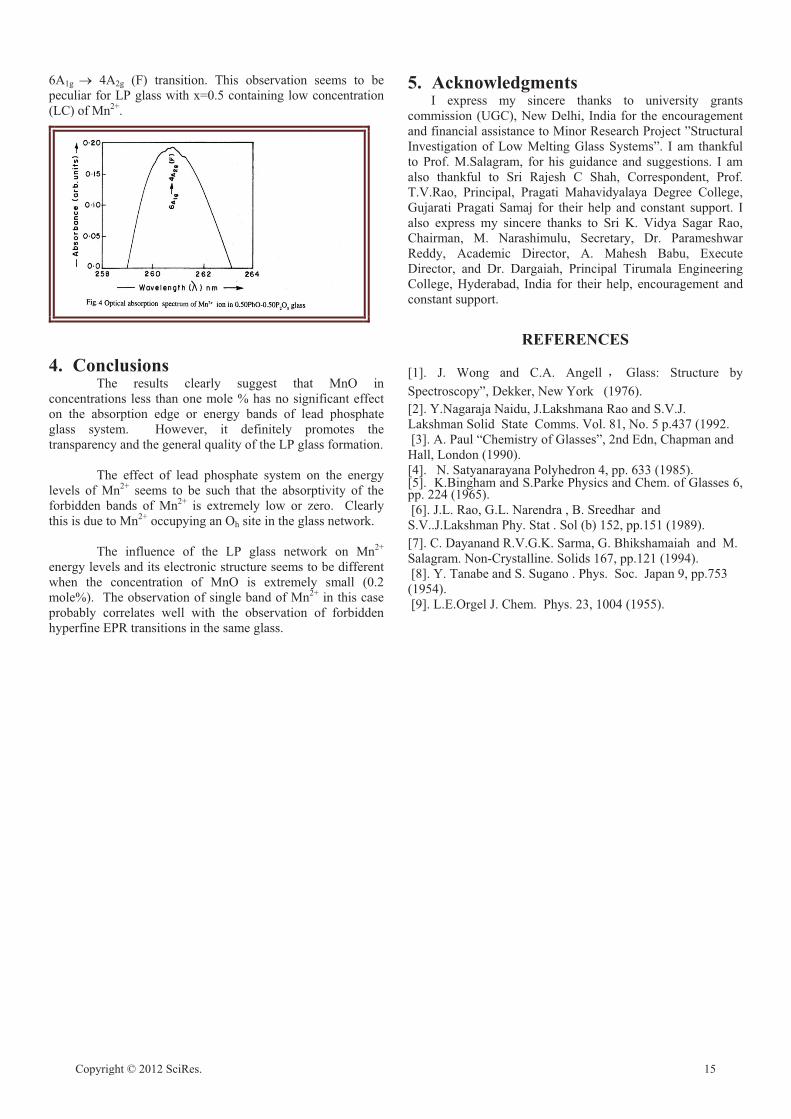
6A1g � 4A2g (F) transition. This observation seems to be peculiar for LP glass with x=0.5 containing low concentration (LC) of Mn2+.
4. Conclusions The results clearly suggest that MnO in
ncentrations less than one mole % has no significant effect coon bsorption edge or energy bands of lead phosphate glass system. However, it definitely promotes the transparency and the general quality of the LP glass formation.
The effect of lead phosphate system on the energy
the a
els o
mall (0.2 gle band of Mn2+ in this case he observation of forbidden
yperfine EPR transitions in the same glass.
d, India for their help, encouragement and onstant support.
Structure by
an and
. of Glasses 6,
9, pp.753
[9]. L.E.Orgel J. Chem. Phys. 23, 1004 (1955).
5. Acknowledgments I express my sincere thanks to university grants commission (UGC), New Delhi, India for the encouragement and financial assistance to Minor Research Project ”Structural Investigation of Low Melting Glass Systems”. I am thankful to Prof. M.Salagram, for his guidance and suggestions. I am also thankful to Sri Rajesh C Shah, Correspondent, Prof. T.V.Rao, Principal, Pragati Mahavidyalaya Degree College, Gujarati Pragati Samaj for their help and constant support. I also express my sincere thanks to Sri K. Vidya Sagar Rao, Chairman, M. Narashimulu, Secretary, Dr. Parameshwar Reddy, Academic Director, A. Mahesh Babu, Execute Director, and Dr. Dargaiah, Principal Tirumala Engineering College, Hyderabac
REFERENCES
[1]. J. Wong and C.A. Angell Glass:Spectroscopy”, Dekker, New York (1976). [2]. Y.Nagaraja Naidu, J.Lakshmana Rao and S.V.J. Lakshman Solid State Comms. Vol. 81, No. 5 p.437 (1992. [3]. A. Paul “Chemistry of Glasses”, 2nd Edn, ChapmHall, London (1990). [4]. N. Satyanarayana Polyhedron 4, pp. 633 (1985). [5]. K.Bingham and S.Parke Physics and Chemlev f Mn2+ seems to be such that the absorptivity of the
forbidden bands of Mn2+ is extremely low or zero. Clearly this is due to Mn2+ occupying an Oh site in the glass network.
The influence of the LP glass network on Mn2+
energy levels and its electronic structure seems to be different hen the concentration of MnO is extremely s
pp. 224 (1965). [6]. J.L. Rao, G.L. Narendra , B. Sreedhar and S.V..J.Lakshman Phy. Stat . Sol (b) 152, pp.151 (1989). [7]. C. Dayanand R.V.G.K. Sarma, G. Bhikshamaiah and M. Salagram. Non-Crystalline. Solids 167, pp.121 (1994). [8]. Y. Tanabe and S. Sugano . Phys. Soc. Japan(1954). w
mole%). The observation of sinprobably correlates well with th
Copyright © 2012 SciRes. 15

Sol-gel Synthesis of TiO2 Thin Films from In-house Nano-TiO2 Powder
Mohd Zainizan Sahdan, Nafarizal Nayan, Samsul Haimi Dahlan
Microelectronic and Nanotechnology-Shamsuddin Research Centre (MiNT-SRC)
Faculty of Electrical and Electronic Engineering Universiti Tun Hussein Onn Malaysia
86400 Batu Pahat, Johor, Malaysia
Mahdi Ezwan Mahmoud Material Technology Group Nuclear Agency of Malaysia
43000 Kajang, Selangor, Malaysia
Uda Hashim Institute of Nano Electronic Engineering (INEE)
Universiti Malaysia Perlis 01000 Arau, Perlis, Malaysia
Abstract— This paper presents the optimization process in sol-gel technique to synthesize Titanium dioxide (TiO2) thin films using in-house Nano-TiO2 powder. Nano-TiO2 powder was previously synthesized in our lab from ilmenite which is a tin mining byproduct using a modified hydrothermal method. By varying the mass of Nano-TiO2 powder and acetic acid (catalyst) concentration in the sol-gel process, highly transparent TiO2 thin films were obtained. The thin films were characterized by field effect scanning electron microscope (FESEM), atomic force microscopy (AFM), thickness profiler, ultra-violet-visible spectrometer (UV-Vis) and current-voltage (I-V) measurement system. This paper also demonstrates the TiO2 thin films are sensitive towards isopropanol (IPA) solution where the I-V response of the thin films changed sharply as IPA was dropped onto the thin film’s surface. The electrical property shows the thin film has potential applications for chemical sensors and solar cells.
Keywords- Titanium dioxide; Ilmenite; Sol-gel; Tin mining;
1. IntroductionTianium dioxide (TiO2) or known as titania has been
reported widely for its numerous applications from optoelectronics to cosmetics [1-3]. TiO2 has excellent photocatalytic oxidative properties that depend on the crystallinity and crystal form [4]. Due to the photocatalytic activity, TiO2 has been used in water and air pollution treatments [5]. It also exhibits unique electrical and chemical properties that can be utilized in various technological and engineering applications such as humidity sensor, gas sensor and membrane [6-7]. In addition, TiO2 is also proposed for solar cells and laser diodes for its high refractive index and stability [8]. Although the starting material of TiO2 powder can be obtained easily in the market, the price is quite expensive especially for research purposes in Malaysia. Therefore, an alternative way of using in-house nano-TiO2 powder (anatase) synthesized from Ilmenite powder (from Malaysian Tin mining
waste), is proposed. Using this in-house nano-TiO2 powder, the cost of the starting material can be reduced up to 80%.
The problem of using nano-TiO2 powder is the low solubility in organic solvent such as ethanol and isopropanol. Therefore, optimization on the mass of the starting material and catalyst is required. Sol-gel process is proposed since it is a convenient and versatile method for preparing transparent thin film at low temperature [9]. The sol-gel process involved many complex processes for both chemical and structural nature. Before gel formation (polymerization), two stages are indentified: (i) hydrolysis of the organometallic group precursor, and (ii) polycondensation. The physical, chemical and mechanical properties are much dependant on the properties of the precursor solution [10]. Therefore, optimizing the precursor solution may produce great results of TiO2 thin film. Sol-gel process is very convenient to deposit transparent materials in combination with spin coating technique. The resulting coatings are of high purity and structural homogeneity depending on the parameters optimization.
2. ExperimentalIndium Tin Oxide (ITO) was used as the substrate which
has dimension of 1.5 cm x 1.5 cm. The substrate was cleaned using acetone in ultrasonic bath for 5 minutes at 50ºC. Then, it was blown dry with nitrogen gas.
Different TiO2 solution was prepared using different mass of nano-TiO2 powder which is 1g, 0.4 g, 0.1 g and 0.05 g. Each powder will be stirred in 30 ml of ethanol mixed with 6 ml of acetic acid. After underwent ageing process for 20 hours, the solution was spin coated onto the ITO substrate for 10 layers. The deposition was using 2-steps spin coating (1000 r.p.m. for 30 s and 3000 r.p.m. for 60 s). Every layer was preheated at 100ºC for 3 minutes. The thin films were annealed at 500ºC for 1 hour to improve the structural property. Again, after underwent slow cooling at room temperature, the thin films were characterized to find the optimum Nano-TiO2 mass.
The acetic acid concentration was optimized using different acetic acid volumes which are 0 ml, 6 ml, 10 ml and 30 ml. It
Advances in Materials Physics and Chemistry Supplement: 2012 world Congress on Engineering and Technology
16 Copyright © 2012 SciRes.

was mixed with nano-TiO2 powder using the optimum mass in the previous experiment. It was stirred in 30 ml of ethanol for 20 hours. Using the same spin coater step, the TiO2 thin films were deposited onto the ITO substrates. After annealing at 500ºC for 1 hour, the thin films were undergoing slow cooling at room temperature.
The thickness of each sample was characterized using KL Tenko surface profiler. The surface topology and roughness were characterized by an XE-100 Park system atomic force microscope (AFM). The optical property was characterized with a Lambda-750 Perkin Elmer ultra violet-visible spectrometer (UV-Vis). The structural property was characterized by an Advance Bruker X-ray diffractometer (XRD) and the electrical property of the sample was measured by a 2400 Keithley current-voltage (I-V) measurement system.
3. Results and Discussion A. Nano-TiO2 Mass Optimization Figure 1 shows the AFM topography of the sample deposited using different mass of nano-TiO2 powder. Generally, the film’s roughness changes as the mass of the nano-TiO2 powder
changed. All films exhibit particles-packed morphology rather than sheet-packed. Lowering the mass of nano-TiO2 powder contribute to the reduction of the surface roughness of the films. The surface roughness for film deposited using 1g, 0.4g, 0.1g and 0.05g of nano-TiO2 powder is 55.6, 18.6, 23.8 and 26.6, respectively. It is found that the optimum mass of nano-TiO2 powder for optimum roughness is 0.4g. The thicknesses of the sample deposited using 1g, 0.4g, 0.1g and 0.05g of nano-TiO2 powder is 230, 140, 110 and 98 nm, respectively.
Figure 2 shows the transmittance of the TiO2 thin films using different mass of nano-TiO2 powder. As shown in the figure, it is clearly observed that the transmittance increases as the mass of the nano-TiO2 powder decreases. This may due to the reduction of the thin film’s thickness as the mass of nano-TiO2 powder reduced. The TiO2 thin film absorbed light which has energy greater than 3.4 eV (~365 nm). However for 0.4g sample, it absorbed photon energy greater than 3.83 eV (~324 nm) or in other word, extends the transparency in which applicable for photovoltaic application. Figure 3 shows the XRD spectra of the TiO2 thin films. It is proven that all TiO2 films exhibit anatase form. The intensity of the XRD spectra differs due to the mass difference of nano-TiO2 powder.
(a) (b)
Figure 1. The AFM topography of TiO2 thin films using different mass of nano-TiO2 powder; (a) 1g; (b) 0.4g; (c) 0.1g; (d) 0.05g.
(c) (d)
Copyright © 2012 SciRes. 17

Figure 2. The UV-Vis spectra of TiO2 thin films deposited using different mass of nano-TiO2 powder
Figure 3. The XRD spectra of TiO2 thin films using different mass of nano-TiO2
powder; (a) 1g; (b) 0.4g; (c) 0.1g; (d) 0.05g.
(a) (b)
(c) (d)
Figure 4. The AFM topography of TiO2 thin films using different acetic acid concentration; (a) 0 ml; (b) 3 ml; (c) 10 ml; (d) 30 ml.
18 Copyright © 2012 SciRes.

Figure 5. The transmittance spectra of TiO2 thin films using different
acetic acid concentration; (a) 0 ml; (b) 3 ml; (c) 10 ml; (d) 30 ml.
Figure 6. The XRD spectra of TiO2 thin films using different acetic acid
concentration; (a) 0 ml; (b) 3 ml; (c) 10 ml; (d) 30 ml.
B. Acetic Acid Concentration Optimization Figure 4(a) shows the AFM topography of the sample
deposited using 0.4g of nano-TiO2 powder without the presence of acetic acid catalyst. The surface roughness obtained from AFM is 32. Figure 4(b) shows the topography of TiO2 thin film when 3 ml of acetic acid was added in the solution. The surface roughness is reduced to 25.9. However, figure 4(c) show different morphology of TiO2 thin film when 10 ml of acetic acid was used. The particle morphology is obviously seen and the surface roughness is reduced to 3.8 when the acetic acid volume was increased to 10 ml. On the other hand, figure 4(d) shows almost similar morphology with that of figure 4(c). The surface roughness increased slightly to 4.9 when the acetic acid volume was 30 ml. It is found that the optimum acetic acid volume is 10 ml which results a uniform TiO2 thin films as shown in figure 4(c). All samples exhibit almost similar thickness which is approximately 130 nm.
Figure 5 shows the transmittance spectra of the sample deposited using different acetic acid concentration. Generally, as the acetic acid volume increases, the transmittance of the TiO2 thin film also increased. However for 10 ml sample, the transmittance for wavelength from 419 to 547 nm decreased below the transmittance of 3 ml sample. The effect of adding acetic acid on the band gap is evaluated using Tauc’s plot from the equations;
� = (1/t) × ln[1/T] (1)
and
Eg = hc/ (2)
Where �, t and T are the absorption coefficient, film’s thickness and transmittance, respectively. While Eg, h, c and are the energy gap, plank constant (4.136×10⁻¹⁵ eV), speed of light (3×10⁸ m.s-1) and wavelength, respectively. It has been found that the band gap of the TiO2 thin films for 0, 3 and 30 ml samples is around 3.2 eV. However, the 10 ml sample has different band gap value which is around 2.2 eV. Figure 6 shows the XRD spectra of the samples which indicates all TiO2
thin films are still in anatase form although the intensity is low. This low intensity of the film is due to the low thickness of TiO2 thin film.
C. Sensing Properties of TiO2 Thin Film In order to test current-voltage (I-V) characteristic of the
sample, Platinum (Pt) electrodes were deposited on the TiO2 thin film using a d.c. sputter coater. With Pt thickness around 15 nm, I-V probes were contacted and supplied with voltages from -2 V to +7 V using Keithley 2400 source meter. Figure 7 shows the I-V characteristic of the optimized TiO2 films (nano-TiO2 powder: 0.4g, acetic acid: 10 ml) when dropped with IPA. As shown in the figure, the TiO2 thin film exhibits Schottky response with Pt due to large difference of work function. The threshold voltage is around 6.7V. The threshold voltage increased to 2.4V as IPA was dropped on the thin film. The current value was gradually decreased by time and obviously seen after 30 second. The I-V response returned back to origin after 5 minutes. This phenomena is due to the chemical reaction between TiO2 particles and the IPA. The sensitivity of
Figure 7. The sensing property of TiO2 thin film toward IPA solvent.
structural stability, porousity and surface-to-volume ratio. TiO2 thin films prepared by sol-gel process provide a backbone that
Copyright © 2012 SciRes. 19

can be use as a microporous support in which analyte-sensitive species are trapped and into which analyte molecules may effectively diffuse and interact [11].
4. Conclusion This paper presents the results of the optimization process
to produce uniform and transparent TiO2 thin films using sol-gel technique. Two types of optimizations were performed. First was the mass of nano-TiO2 powder and second was the acetic acid concentration.
The results from the AFM analysis confirmed that 0.4 g sample has the least TiO2 thin film roughness. Then by adding 10 ml of acetic acid has resulted optimum uniformity and roughness of the TiO2 thin film. The transmittance for the optimum film is around 80% which is sufficient for optoelectronic application especially for solar cell. The XRD result indicates that all films are in anatase form. Finally, it has been demonstrated in this paper that the prepared TiO2 thin film is sensitive towards organic solvent which could increase the current value. Therefore, it is applicable for chemical sensing application.
5. Acknowledgment The authors would like to thank Universiti Tun Hussein
Onn Malaysia for providing the technical supports and Ministry of Higher Education Malaysia (MOHE) for the financial support through fundamental research grant scheme (FRGS) vote No 1059 and MTUN COE research grant vote No C020.
REFERENCES[1] S. Angkaew and P. Limsuwan, "Preparation of silver-titanium
dioxide core-shell (Ag@TiO2) nanoparticles: Effect of Ti-Ag mole ratio," Procedia Engineering, vol. 32, pp. 649-655, 2012.
[2] V. Brezová, et al., "Photoactivity of mechanochemically prepared nanoparticulate titanium dioxide investigated by EPR spectroscopy," Journal of Photochemistry and Photobiology A: Chemistry, vol. 206, pp. 177-187, 2009.
[3] R. K. Keswani, et al., "Room temperature synthesis of titanium dioxide nanoparticles of different phases in water in oil microemulsion," Colloids and Surfaces A: Physicochemical and Engineering Aspects, vol. 369, pp. 75-81, 2010.
[4] A. Kiselev, et al., "Solar light decomposition of DFP on the surface of anatase and rutile TiO2 prepared by hydrothermal treatment of microemulsions," Surface Science, vol. 584, pp. 98-105, 2005.
[5] J. Taranto, et al., "Photocatalytic air purification: Comparative efficacy and pressure drop of a TiO2-coated thin mesh and a honeycomb monolith at high air velocities using a 0.4 m3 close-loop reactor," Separation and Purification Technology, vol. 67, pp. 187-193, 2009.
[6] J. Moon, et al., "Pd-doped TiO2 nanofiber networks for gas sensor applications," Sensors and Actuators B: Chemical, vol. 149, pp. 301-305, 2010.
[7] A. L. Ahmad, et al., "Synthesis and characterization of TiO2 membrane with palladium impregnation for hydrogen separation," Journal of Membrane Science, vol. 366, pp. 166-175, 2011.
[8] S. Nad, et al., "Anomalous nanostructured titanium dioxide," Journal of Colloid and Interface Science, vol. 264, pp. 89-94, 2003.
[9] R. Gupta, et al., "Effect of ethanol variation on the internal environment of sol–gel bulk and thin films with aging," Biosensorsand Bioelectronics, vol. 21, pp. 549-556, 2005.
[10] J. Calabria A, et al., "Synthesis of sol–gel titania bactericide coatings on adobe brick," Construction and Building Materials, vol. 24, pp. 384-389, 2010.
[11] S. H. Si, et al., "Improvement of piezoelectric crystal sensor for the detection of organic vapors using nanocrystalline TiO2 films," Sensors and Actuators B: Chemical, vol. 108, pp. 165-171, 2005.
20 Copyright © 2012 SciRes.

Fluoride processing of titanium-containing minerals
N.M. Laptash and I.G. Maslennikova Institute of Chemistry, Far Eastern Branch of RAS
Vladivostok, Russia [email protected]
Abstract—Fluoride processing of natural ilmenite with the use of ammonium hydrogen difluoride (NH4HF2) as an effective fluorinating agent is suggested. Chemistry, composition, structure, thermal and hydrolytic properties of fluorination products were investigated. Ammonium fluoro- and oxofluorotitanates are suitable for preparing of titanium dioxide as pigmentary product or as doped by nitrogen and fluorine.
Keywords - ilmenite; fluorination reactions; ammonium hydrogen difluoride; ammonium fluoro- and oxofluorometallates; thermal behavior; hydrolysis; N-F-TiO2.
1. IntroductionTitanium dioxide (TiO2) has long been at the center of
photocatalyst research due to its catalytic efficiency coupled with wide availability, biocompatibility, chemical stability, low cost, and safety toward both humans and the environment. It is much more effective as photocatalyst in the form of nanoparticles modified by doping with cations and anions [1, 2]. The nitrogen and fluorine-doped titanium dioxide (N–F–TiO2) nanomaterials exhibit high photocatalytic activity for water-splitting and photodegradation of organic pollutants [3–8]. It was shown that co-doping with nitrogen and fluorine is advantageous for the reduction of defect formation and lowers the energy cost for the incorporation of nitrogen owing to the charge compensation effect between the donor (F) and acceptor (N) [9].
Multifunctional properties and vast applications of nano–TiO2 require its production in a mass scale. The large-quantity production of rutile nanorods from ilmenite sands was recently suggested [10, 11]. Ilmenite (FeTiO3) is abundant feedstock for industrial production of TiO2. At present, ilmenite is commonly used in industry for making white pigment via a sulfate or chlorine route having serious disadvantages, such as the treatments of byproducts in the former and the lack of raw rutile minerals in the latter. Fluoride processing of titanium-bearing minerals can serve as an alternative. Ammonium hydrogen difluoride (NH4HF2, solid, melting point is 126 oC, boiling point is 240 oC) was recognized as versatile fluorinating agent for recovering of titanium-containing raw materials [12, 13]. It should be noted that foundation of ilmenite processing with ammonium hydrogen difluoride was created by Svendsen as early as the thirties [14, 15]. The suggested methods comprised fluorination with molten NH4HF2 followed by sublimation of fluoride titanium compound but the detailed chemistry was not completely
understood. Since the fluorination products are ammonium fluoro- or oxoflluorotitanates, it is reasonable to consider them as precursors for the N–F–TiO2 obtaining.
Indeed, the N–F–TiO2 nanoparticles of anatase crystalline structure were recently prepared by a facile method of (NH4)2TiF6 pyrolysis [16]. The synthesis of N–F-codoped TiO2 powders with a homogenous anatase structure via a thermal decomposition of different ammonium oxofluorotitanate precursors at 550 oC was reported [17]. Uniform ammonium oxofluorotitanate (NH4TiOF3) mesocrystals and their conversion to mesocrystals of TiO2 were described [18–20]. Titanium oxyfluoride TiOF2 was synthesized for obtaining of thermally stable TiO2 of high photocatalytic activity [21] and for its use as anode material for lithium-ion battery [22]. The synthesis of the above precursors from natural ilmenite and investigation of their physicochemical properties is the aim of present paper.
I. FLUORINATION OF ILMENITE WITH NH4HF2 Interaction of ilmenite with NH4HF2 proceeds exothermally
at room temperature under grinding the initial components [23]. Similar reactions when two solids interact under mechanical grinding with the formation of a new compound were being studied by Indian authors since 1982 [24]. One should concentrate attention on nonstoichiometric composition of fluorinating products due to some OH– groups substituting for fluorine since water molecules are formed during fluorination:
FeTiO3 + (5–0.5y)NH4HF2 = NH4H2xFeOxF3 + (NH4)3Ti(OH)yF7-y + (1–0.5y)NH3 + (3–x–y)H2O
(x � 0.3, y � 0.4). (1) The main titanium fluoride product is a double salt
isostructural with (NH4)3TiF7 = (NH4)2TiF6·NH4F which was isolated in a single crystal form from fluoride aqueous solution. Its crystal structure was determined. The parameters of tetragonal unit cell were changed under X-rays, the stable phase is characterized by the following parameters: sp. gr.P4nc; a = 11.97, b = 11.68 Å; z = 8. One of the three independent Ti octahedra is disordered so a phase transition (PT) at about 280 K takes place. Fe(II) forms a cubic fluoroperovskite type structure and easily oxidized in air and in aqueous solution, and Fe(III) fluoride compound crystallizes in cubic fluoroelpasolite structure. Its octahedral single crystals of the (NH4)xFe(O�)3-
xF2x (� = 2.70–2.85) composition were grown. Usually, natural ilmenite contains some Fe(III). We dealt with the real composition of 0.8FeTiO3�0.1Fe2O3 and investigated carefully its fluorinated process. The corresponding thermal curves are shown in Fig. 1. An exoeffect at 125 oC is evident.
Advances in Materials Physics and Chemistry Supplement: 2012 world Congress on Engineering and Technology
Copyright © 2012 SciRes. 21

Figure 1. Thermal curves of the mixture of ilmenite with NH4HF2.
The corresponding equation can be expressed as follows:
0.8FeTiO3�0.1Fe2O3 + 4.4NH4HF2 = 0.8 NH4H0.4FeO0.2F3 + 0.2(NH4)2.8Fe(O�)0.2F5.6 + 0.8(NH4)3Ti(O�)0.4F6.6 + 0.64NH3 + 2.18H2O. (2)
The endoeffect at 280 oC corresponds to thermal decomposition of titanium double salt. Further effects are connected with thermal behavior of (NH4)2Ti(O�)0.4F5.6 and ammonium fluoroferrates:
(NH4)3Ti(O�)0.4F6.6 = (NH4)2Ti(O�)0.4F5.6 + NH3 + HF (3)
(NH4)2.8Fe(O�)0.2F5.6 = FeF2 + 0.17N2 + 2.47NH3 + 3.6HF+ 0.2H2O (4)
NH4�0.4FeO0.2F3 = FeF2 + NH3 + HF + 0.2H2O (5)
(NH4)2Ti(O�)0.4F5.6 = NH4TiO0.4F4.2 + NH3 + 1.4HF (6)
NH4TiO0.4F4.2 = NH4TiO0.4F4.2� (7)
FeF2 + NH4TiO0.4F4.2 = FeTiF6 + NH3 + 0.2HF + 0.4H2O (8)
FeTiF6 = FeF2 + TiF4�. (9)
One should mention the evolution of volatile titanium fluoride compound NH4TiO0.4F4.2 which sublimes incongruently with the formation, probably, of the titanium adduct with NH3. We succeeded in obtaining of single crystal of this volatile compound and determined its chain structure (Fig. 2). Infinite chains of cis-connected [TiF6]-octahedra are joint via NH4
groups by N–H���F hydrogen bonds with the average N���F distance of 2.85–2.98 Å [25]. It is necessary to take into account that some Ti4+ is reduced to Ti3+by NH3 evolved, so we used simple aqueous leaching of the cake to separate titanium
Figure 2. Crystal structure of NH4TiOxF5-2x (x = 0.15): sp. gr. P21/n, a = 14.683,
b = 6.392, c = 20.821 Å; �, = 90o, � = 110.538o, Z = 16.
from iron. One can expect the formation of ammonium oxofluorotitanate (NH4)3TiOF5 at this stage at pH = 7–8 [26]. This compound is isostructural with iron fluoroelpasolite, their crystal structures were determined [27].
II. DYNAMIC ORIENTATIONAL DISORDER IN CRYSTALS OF IRON AND TITANIUM
FLUOROELPASOLITES Classical cubic structure of A2BMX6 (A>B) elpasolite
(Fm3m, Z = 4) comprises a central atom M to be in the 4a position, ligands in 24e, larger cations in 8c, and smaller cations in 4b. NH4 in the latter position is accepted to be disordered on two orientations. We advanced in the refining of this structure and published recently the paper on this subject [28]. In fact, the ligand atoms are distributed on mixed 24e+96j positions, and ammonium group in the 4b position is distributed on the 32f position taking 8 equivalent orientations. Ammonium groups in the 8c position are tetrahedrally shifted into the 32f position. In the Ti oxofluoroelpasolite, a central atom is disordered on 6 orientations. The Ti atom is shifted towards the O atom with the formation of short triple Ti–O bond that allows to determine the real geometry of TiOF5 octahedron. Fig. 3 presents disordered structure of the discussed elpasolites.
Figure 3. Disordered crystal structure of (NH4)3FeF6 or (NH4)3TiOF5.
22 Copyright © 2012 SciRes.

Figure 4. Temperature dependence of the second moment (M2) of the 19F NMR spectrum of (NH4)3TiOF5.
The observed disorder has a dynamic nature that the NMR
data support (Fig. 4). Two phase transitions at lower temperature are evident. The M2 jump at 265 � coincides with the temperature of phase transition (PT) detected by the differential scanning microcalorimetry method (DSM). The rather large value of entropy change �S at this PT (18.1 J mol-
1 K-1 or Rln9) characterizes this first order PT as of order-disorder type [29].
High anionic and cationic mobility is reflected in thermal behavior of this complex. The easy transfer of hydrogen from ammonium group to the O atom emerges in the IR spectrum as the appearance of strong hydrogen bond of the O–H���F type at 700–800 cm-1. As a result, only NH3 and H2O, but no HF evolve during the thermal decomposition of the compound.
III. THERMAL AND HYDROLYTIC PROPERTIES OF AMMONIUM FLUOROMETALLATES
Thermal behavior of ammonium oxofluorotitanates were examined [30]. Thermal curves of the (NH4)3TiOF5 decomposition are presented in Fig. 5. The corresponding reactions can be expressed as follows:
2(NH4)3TiOF5 = (NH4)2TiF6 + (NH4)2TiOF4 + 2NH3 +H2O (10)
3(NH4)2TiOF4 = (NH4)2TiF6 + 2NH4TiOF3 + 2NH3+ H2O (11)
4NH4TiOF3 = (NH4)2TiF6 + 3(NH4)0.3TiOF2 + 0.15N2 + 0.8NH3 +H2O. (12)
Figure 5. Thermal curves of (NH4)3TiOF5.
The process is accompanied by sublimation of volatile titanium compound and by the formation of hexagonal ammonium-containing TiOF2.
Hydrolysis process of volatile ammonium fluorotitanate, NH4TiOxF5-2x, is practically important. Its aqueous solution has an acid reaction meaning the strong hydrolysis [31]. According to 19F, 17O, and 49Ti NMR data, dimers with bridging OH or even trimers (cyclic or linear) are formed: NH4TiO0.2F4.6 + 0.5H2O = 0.25(NH4)2[TiF6] + 0.1(NH4)3[Ti2(OH)F10] + 0.15(NH4)1.3H1.7[Ti3(OH)3F12] + 0.025H2[Ti4(OH)6F12], (13)
Oligomerization (polymerization) is the main feature of
pyrohydrolisis of ammonium fluorotitanates and fluoroferrates. Kinetic curves show that it takes about 40 min to convert ammonium fluorometallates to oxides [32, 33]:
(NH4)2Ti(OH)xF6-x � NH4TiOF3 � (NH4)0.8TiOF2.8 � (NH4)0.3TiOF2.3 � TiO2; (14) (NH4)xFe(OH)3-xF2x � (NH4)1-�Fe(OH)yF4-�-y � (NH4)yFe(OH)xF3-x+y � Fe2�3. (15)
Using the data obtained we suggested pyro-hydro-metallurgical method of ilmenite processing [34] which comprises the fluorination of ilmenite with NH4HF2 at 20–200 oC followed by a simple aqueous leaching of the cake. Combination of hydrolysis and pyrohydrolysis processes gives pigmentary Ti and Fe oxides. We tried to burn volatile ammonium fluorotitanate in an oxygen atmosphere at 1000 oC and obtained N–F-doped TiO2 with rutile structure. Crystals with splendid color like sapphire were grown. They are good UV- and visible light absorbers. We suspect that selecting conditions of hydrolysis (pyrohydrolysis) or/and pyrolysis of ammonium fluorotitanates, it will be possible to design nanosized N–F-doped TiO2.
Thus, to obtain useful product from natural raw materials using NH4HF2 we should to take into account that thermodynamically possible fluorination reactions proceed spontaneously (exothermally) with the formation of high symmetry phases of ammonium fluoro- and oxofluorometallates. The essence of high symmetry is dynamic orientation disorder of both ammonium groups and anionic polyhedra.
Under dynamic disorder, it is possible to identify O and F atoms on local scale by common X-ray diffraction and to find the real geometry of oxofluoride polyhedron. Orientational dynamic disorder is responsible for PTs at lower temperatures which proceed with rather large �S and are characterized as PT of order-disorder type.
Oligomerization is the main feature of thermal and hydrolytical decomposition of ammonium fluoro- and oxofluorometallates which can be used for designing perspective functional materials doped by F and N atoms.
Copyright © 2012 SciRes. 23

2. Acknowledgment We thank Dr. A.A. Udovenko, Prof. I.N. Flerov, Prof. V.Ya.
Kavun, Prof. S.P. Gabuda and Prof. V.K. Goncharuk for their help and useful discussion.
REFERENCES
[1] X. Chen, S.S. Mao, “Titanium dioxide nanomaterials: synthesis, properties, modifications, and applications”, Chem. Rev., vol. 107, pp. 2891–2959, June 2007.
[2] H. Tong, S. Ouyang, Y. Bi, N. Umezawa, M. Oshikiri, J. Ye, “Nano-photocatalytic materials: possibilities and challenges”, Adv. Mater., vol. 24, pp. 229–251, January 2012.
[3] D. Li, H. Haneda, S. Hishita, N. Ohashi, “Visible-light-driven N–F–codoped TiO2 photpcatalyst. 2. Optical chracterization, photocatalysis, and potential application to air purification”, Chem. Mater., vol. 17, pp. 2596–2602, Murch 2005.
[4] S. Livraghi, K. Elghniji, A.M. Czoska, M.C. Paganini, E. Giamello, M. Ksibi, “Nitrogen-doped and nitrogen-fluorine-codoped titanium dioxide. Nature and concentration of photoactive species and yheir role in determing the photocatalytic activity under visible light”, J. Photochem Photobiol. A: Chem., vol. 205, pp. 93–97, June 2009.
[5] X. Du, J. He, Y. Zhao, “Facile preparation of F and N codoped pinecone-like titania hollow microparticals with visible light photocatalytic activity”, J. Phys. Chem., vol. 113, pp. 14151–14158, August 2009.
[6] G.S. Wu, J.L. Wen, S. Nigro, A.C. Chen, “One-step synthesis of N- and F-codoped mesoporous TiO2 photocatalyst with high visible light activity”, Nanotechnology, vol. 21, No. 085701, February 2010.
[7] Y. Lv, Z. Fu, B. Yang, J. Xu, M. Wu, C. Zhu, Y. Zhao, “ Preparation N–F-codoped TiO2 nanorod array by liquid phase deposition as visible light photocatalyst”, Mater. Res. Bull., vol. 46, pp. 361–365, March 2011.
[8] W. Wang, C. Lu, Y. Ni, M. Su, W. Huang, Z. Xu, “Preparation and characterization of visible-light-driven N–F–Ta tri-doped TiO2 photocatalyst”, Appl. Surf. Sci., vol. 258, pp. 8696–8703, September 2012.
[9] C. Di Valentin, E. Finazzi, G. Pacchioni, A. Selloni, S. Livraghi, A.M. Czoska, M.C. Paganini, E. Giamello, “Density functional theory and electron paramagnetic resonance study on the effect of N–F codoping of TiO2”, Chem. Mater., vol. 20, pp. 3706–3714, June 2008.
[10] J. Yu, Y. Chen, A.M. Glushenkov, “Titanium oxide nanorods extracted from ilmenite sands”, Cryst. Growth @ Design, vol. 9, pp. 1240–1244, February 2009.
[11] T. Tao, A.M. Glushenkov, Q. Chen, H. Hu, D. Zhou, H. Zhang, M. Boese, S. Liu, R. Amal,Y. Chen, “Porous TiO2 with a controllable bimodal pore size distribution from natural ilmenite”, Cryst. Eng. Com., vol. 13, pp. 1322–1327, March 2011.
[12] G.L. Herwig, “Upgrading titaniferous ores”, Pat. AU No. 428758, June 1972.
[13] A.R. McGregor, A. Rodionov, “F–treatment of titanium materials”, Pat. AU No. 2005100939, February 2006.
[14] S.S. Svendsen, “Manufacture of titanium compounds”, Pat. US No. 2042434, June1931.
[15] S.S. Svendsen, “Treatment of titanium-bearing materials”, Pat. US No. 2042435, September 1934.
[16] D.M. Chen, Z.Y. Jiang, J.Q. Geng, J.H. Zhu, D. Yang, “A facile method to synthesize nitrogen and fluorine co-doped TiO2 nanoparticles by pyrolysis of (NH4)2TiF6”, J. Nanopart. Res., vol. 11, pp. 303–313, February 2009.
[17] M. Hojamberdiev, G.Q. Zhu, P. Sujaridworakun, S. Jinawath, P. Liu, J.P. Zhou, “Visible-light-driven N-F-codoped TiO2 powders from
different ammonium oxofluorotitanate precursors”, Powder Technology, vol. 218, pp. 140–148, March 2012.
[18] L. Zhou, D. Smyth-Boyle, P. O’Brien, “A facile synthesis of uniform NH4TiOF3 mesocrystals and their conversion to TiO2 mesocrystals”, J. Am. Chem. Soc., vol. 130, pp. 1309–1320, January 2008.
[19] L. Zhou, P. O’Brien, “Ammonium oxofluorotitanate: morphology control and conversion to anatase TiOF2 mesocrystals and their conversion to TiO2”, Phys. Status Solidy A – Appl. Mater Sci., vol. 205, pp. 2317–2323, October 2008.
[20] M-K. Lee, T-H. Shih, “Growth evolution of ammonium oxotrifluorotitanate discoid crystal on glass prepared by ammonium hexafluorotitanate and boric acid”, J. Phys. D: Appl. Phys., vol. 43, No. 025402, January 2010.
[21] K.L. Lv, J.G. Yu, L.Z. Cui, S.L. Chen, M. Li, “Preparation of thermally sdtable antase TiO2 photocatalyst from TiOF2 precursor and its photocatalytic activity”, J. Alloys Compounds, vol. 509, pp. 4557–4562, March 2011.
[22] L. Chen, L.F. Shen, P. Nie, X.G. Zhang, H.S. Li, “Facile hydrothermal synthesis of single crystalline TiOF2 nanocubes and their phase transitions to TiO2 hollow nanocages as anode materials for lithium-ion battwery”, Electrochim. Acta, vol. 62, pp. 408–415, February 2012.
[23] N.M. Laptash, I.G. Maslennikova, L.N. Kurilenko, N.M. Mishchenko, “Ilmenite fluorination by ammonium hydrodifluoride. New ammonium oxofluorotitanate”, Russ. J. Inorg. Chem., vol. 46, pp. 28–34, January 2001 (Translated from Zh. Neorgan. Khim., vol. 46, pp. 33–39).
[24] B.R. Wani, U.R.K. Rao, K.S. Venkateswarlu, A.S. Gokhale, “Thermal behaviour of (NH4)3VO2F4 and Na(NH4)2VO2F4”, Thermochim. Acta, vol. 58, pp. 87–95, October 1982.
[25] I.G. Maslennikova, N.M. Laptash, T.A. Kaidalova, V.Ya. Kavun, “Volatile ammonium fluorotitanate“, Spectroscopy Letters, vol. 34, pp. 775–781, 2001.
[26] N.M Laptash., I.G. Maslennikova, �.�. �aidalova, “Ammonium Oxofluorotitanates”, J. Fluorine Chem., vol. 99, pp. 133–137, November 1999.
[27] A.A. Udovenko, N.M. Laptash, I.G. Maslennikova, “Orientation disorder in ammonium elpasolites. Crystal structures of (NH4)3AlF6, (NH4)3TiOF5 and (NH4)3FeF6“, J. Fluorine Chem., vol. 124, pp. 5–15, November 2003.
[28] A.A. Udovenko, N.M. Laptash, “Dynamic orientational disorder in crystals of fluroelpasolites, structural refinement of (NH4)3AlF6, (NH4)3TiOF5, and Rb2KTiOF5“, Acta Crystallogr., vol. B67, pp. 447–454, December 2011.
[29] I.N. Flerov, V.D. Fokina, A.F. Bovina, N.M. Laptash, “Phase transitions in perovskite-like oxyfluorides (NH4)3WO3F3 and (NH4)3TiOF5“, Solid State Sci., vol. 6, pp. 367–370, April 2004.
[30] N.M. Laptash, E.B. Merkulov, I.G. Maslennikova, “Thermal behaviour of ammonium oxofluorotitanates (IV)“, J. Therm. Anal. Calorym., vol. 63, pp. 197–204, 2001.
[31] N.M. Laptash, M.A. Fedotov, I.G. Maslennikova, “Hydrolysis of volatile ammonium oxofluorotitanate (IV) according to 19F, 17O, 49Ti. NMR data“, Russ. J. Struct. Chem., vol. 45, pp. 74–82, January-February 2004 (Translated from Zh. Strukt. Khim., vol. 45, pp. 77–85).
[32] I.G. Maslennikova, N.M. Laptash, A.P. Golikov, “Kinetics of pyrohydrolysis of (NH4)2TiF6 � (NH4)2TiOF4“, Russ. J. Inorg. Chem., vol. 46, pp. 186–191, February 2001 (Translated from Zh. Neorgan. Khim., vol. 46, pp. 233–238).
[33] I.G. Maslennikova, N.M. Laptash, A.P. Golikov, “Pyrohydrolysis of ammonium fluoroferrates“, Russ. J. Inorg. Chem., vol. 47, pp. 705–711, May 2002 (Translated from Zh. Neorgan. Khim., vol. 47, pp. 796-802).
[34] P.S. Gordienko, I.G. Maslennikova, N.M. Laptash, V.K. Gonchruk, A.A. Smol’kov, “Method of titanium-containing raw material processing”, Pat. RU No. 2139249, October 1999.
24 Copyright © 2012 SciRes.

Thermoelectrical investigation of rare earth sulfide materials
V.V. Sokolov, V.V. Bakovetz Nikolaev Institute of Inorganic Chemistry SB RAS
NIIC SB RAS Novosibirsk, Russia [email protected]
S.M. Luguev, N.V. Lugueva Amirkhanov Institute of Physic DSC RAS
IPh DSC RAS Makhachkala, Dagestan. Russia
Abstract- Results are presented on synthesis and crystal growth of Gd2S3 - Dy2S3 solid solution sulfides and study of their thermoelectric properties in the range of temperatures 80-400 K. Gd0.2Dy0.8S1.48 composition has the best values of thermoelectric efficiency 0.39 x 10⁻³/K at 400 K.
Keywords - Gd2S3 - Dy2S3 solid solution sulfides, synthesis , growth of crystals, thermoelectric properties
1. Introduction Interest in investigation of rare-earth Ln2S3 sulfides with
the structure of Thorium phosphide is bound with possible application of compositions on their base as working elements of thermoelectric energy converters for high temperatures. The researches of GdSy (1.45 � y � 1.50) [1,2] showed that some compositions at 1000 K have more high thermoelectric efficiency of Z then Ge-Si solid solution compositions. The structure of Ln2S3 sulfides allows to fill vacancy with rare-earth and other metals and to change their thermoelectric properties. To increase thermoelectric efficiency of material it is usual to decrease its thermal conductivity creating there additional centers of phonon scattering. Such centers for the GdSy system may be presented by the doping paramagnetic ions of rare-earth elements scattering phonons and decreasing thermal conductivity but not modifying electrical characteristics of the compound. The research of Gd1-xDyxS1.48 compositions containing paramagnetic Dy ions showed that in this system near Gd0.2Dy0.8S1.48 have the minimum thermal conductivity [3]. Therefore is of interest to study dynamics of thermoelectric properties of these compositions in dependence from temperature. In this work the synthesis, preparation of crystals in Gd2S3 - Dy2S3 system and their thermoelectric properties in the range of temperatures 80-400 K are presented.
D. Study�of�thermoelectrical�properties�
2. Experimental A. �Preparation�of�Gd2S3��and�Dy2S3��sulfides�Sulfides Gd2S3 and Dy2S3 were prepared from high-purity
rare earth oxides (99.95%) by H2S sulfidizing at 950– 10000 C [4].
The mixtures of sulfides for crystallization were prepared with 0.1 mol. step.
B. Growth�of�Gd2S3���Dy2S3�solid�solution�crystals�Directed crystallization from sulfide melts at 1700 -20000C
in carbon and glass-carbon containers with HF heating was used.
Crystallization of prepared compositions was carried out under inert gas atmosphere for preparation of nonstoichiometric with electron conductivity crystals [5]. Crystallization velocity was 5 - 30 mm/h. The diameter of the obtained cylindrical samples of crystals was 10 mm and height - 10�30 mm.
C. �Methods�of�characterization�of�crystals�- XRD - parameters of cubic Th3P4 type
- Gravimetric measurements of density - Measurements of Seebeck coefficient at 200 C - Chemical and gas-chromatografic analysis of composition [6]
To study thermoelectrical properties the samples were cut from the central part of ingots that was the most uniform. At temperature measurements the composition change on sulfur therefore uncertainty in an index at sulfur +-0.01 is possible.
Measurements of thermal conductivity coefficient were performed with absolute stationary method.
The equipment simultaneously with measurement of in the same samples allowed to measure electrical conductivity and Seebeck coefficient at 80-400 K. 3. Results and Discussion
Advances in Materials Physics and Chemistry Supplement: 2012 world Congress on Engineering and Technology
Copyright © 2012 SciRes. 25

A. Characterization�of�prepared�crystals����Results of characterization of prepared crystals of Gd2S3 -
Dy2S3 solid solution is presented in Table 1.
All crystals have cubic structure of Th3P4 type with linear dependence of cell parameters from composition.
The same dependence is in density of crystals from composition.
Deviation of composition from stoichiometry from Gd2S3 to Dy2S3 agree with their phase diagrams.
TABLE I. CHARACTERISTICS OF CRYSTALS IN GD2S3 - DY2S3 SYSTEM
Composition mol. Gd2S3
Parameter of cell, �
Index y in Gd1-xDyxSy
exp. calc.
Density d, g/ cm3
exp. calc.
Seebeck coeff. �� mkV/ �
1 0.9 0.8 0.7 0.6 0.5 0.4 0.3 0.2 0.1 0
8.372 8.365 8.358 8.350 8.340 8.331 8.328 8.323 8.311 8.302 8.292
1.466 1.464 1.464 1.467 1.471 1.470 1.476 1.477 1.479 1.480 1.478 1.482 1.479 1.473 1.488 1.482 1.490 1.487 1.489 1.486 1.493 1.495
6.30 6.29 6.33 6.34 6.35 6.35 6.36 6.37 6.39 6.39 6.42 6.43 6.46 6.45 6.47 6.45 6.50 6.49 6.54 6.53 6.55 6.56
62 68 77 72 80 76 88 107 110 104 125
Increasing of Seebeck coefficient from Gd2S3 to Dy2S3 to
agree with deviation composition from stoichiometry of crystals.
B. Results�of�thermoelectric�measurements��
Temperature dependences of thermal conductivity coefficient in Gd2S3 - Dy2S3 system for the series of compositions at 80 - 400 K are presented in Fig. 1.
Figure 1. Temperature dependences of thermal conductivity coefficient of
GdS1.48 (1), Gd0.6 Dy0.4 S1.48 (2), DyS1.48 (3), Gd0.2 Dy0.8 S1.48 (4).
Up to Gd0.6Dy0.4S1.48 thermal conductivity weakly depends on the concentration of Dy ions and Gd0.2Dy0.8S1.490 sample has minimal thermal conductivity in this system (Fig.2).
Figure 2. Concentration dependences of thermal conductivity coefficient of
solid solutions Gd1�xDyxS1.48 at 300 (1) and 400 K (2).
Analysis of thermal conductivity is made in paper [3]. Substantial decrease of thermal conductivity coefficient is observed for the compositions with x > 0.6, and minimal value � � at x = 0.8. Such dependence of thermal conductivity coefficient of the samples unusual for phonon heat transfer is results from phonon scattering by paramagnetic ions of Dysprosium.
Results of Seebeck coefficient and electrical conductivity measurements are presented on Fig. 3 and 4.
Temperature dependence of Seebeck coefficient and electrical conductivity has the same character that usual metals or doped semiconductors. At constant concentration of carriers of a current and decrease of their mobility with growth of temperature Seebeck coefficient linearly grows and electrical conductivity decreases.
Figure 3. Temperature dependences of Seebeck coefficient
of Gd0.3Dy0.7S1.48 (1), Gd0.2Dy0.8S1.48 (2), Gd0.1Dy0.9S1.48 (3), GdS1.48 (4).
Figure 4. Temperature dependences of electrical conductivity of GdS1.48 (1),
Gd0.1Dy0.9S1.48 (2), Gd0.2Dy0.8S1.48 (3), Gd0.3Dy0.7S1.48 (4)
26 Copyright © 2012 SciRes.

Replacement of Gadolinium by Dysprosium as it was established earlier [7], at 300 K changes of Seebeck coefficient growth and electrical conductivity lowering no more than for 18 % within Gd1-xDyxS1.48 compositions. At 80 K electrical conductivity of Gd0.3Dy0.7S1.48 is lower for 30 %, than at GdS1.48.
On the basis of experimental data of Seebeck coefficient and electrical and thermal conductivity the thermoelectric efficiency (Z = �2�/�) of the studied compositions was calculated. Gd0.2Dy0.8S1.48 composition has the best values of this parameter among the samples investigated in this work. Values Z for the studied samples at 300 and 400 K are presented in the Table II.
TABLE II THERMOELECTRIC PROPERTIES OF SOME GD1-XDYXS1.48 COMPOSITION
Composition
-�, mkV·
K-1 300 �
�, Om-1cm-1
300 K
, W m-1K-1
300 K
Z�103, K-1
300 �
Z�103, K-1
400 K
GdS1.48 72 304 1.04 0.16 0.27 Gd0.3Dy0.7S1.48 83 262 0.80 0.23 0.34 Gd0.2Dy0.8S1.48 80 278 0.74 0.24 0.39 Gd0.1Dy0.9S1.48 75 298 0.84 0.20 0.32
�Thus, study of thermal conductivity, Seebeck coefficient
and electrical conductivity of Gd1-xDyxS1.48 compositions in a range of temperatures 80-400 K showed that the main contribution to heat transfer to them is brought by fluctuations
of a crystal lattice. It is established that replacement of atoms of a Gadolinium by Dysprosium reduces thermal conductivity with growth of deficiency of a crystals and additional scattering of phonon on paramagnetic Dy ions. On the basis of experimental data in all studied temperature interval the Gd0.2Dy0.8S1.48 sample has maximal value of thermoelectric efficiency.
REFERENCES [1] G.G. Gadzhiev, S.M. Luguev, V.V. Sokolov, B.N. Magdiev., N.V. Lugueva. In book.: Transfer of carriers of a charge and heat in semiconductors. Makhachkala, 1986, page 87-93.(on Russian) [2] S.M. Luguev, V.V. Sokolov, N.V. Lugueva. Advanced Materials and
Proceessing. Proceedings of Russia-Japan Seminar, September 15-20, 2007. Novosibirsk, 2007, �. 71-75.
[3] S.M. Luguev, N.V. Lugueva, V.V. Sokolov. Temperature and concentration dependences of thermal conductivity of solid solutions of gadolinium and dysprosium// Thermophysics and Aeromechanics, vol. 19, No. 3, pp. 375-380, 2012.
[4] V.V. Sokolov, A.A. Kamarzin, L.N.Trushnikova, M.V. Savelyeva Optical materials containing rare earth Ln2S3 sulfides // J. Alloys and Comp. vol. 225, No. 2,. pp. 567�570, 1995.
[5] A.A. Kamarzin, K.E. Mironov, V.V. Sokolov Growth and Properties of Lanthanum and Rare Earth Metal Sesquisulfide Crystals // J.Crystal Growth. vol. 52, pp. 619 – 622, 1981.
[6] L.S. Chuchalina, I.G. Vasilyeva, A.A. Kamarzin Non-direct method of gas-chromatografic analysis of determination of lanthanum sulfide composition// Journal of Analytical Chemistry vol. 33, n. 1, pp.190-192, 1978. (on Russian)
[7] S.M. Luguev, N.V. Lugueva, V.V. Sokolov. Thermoelectrics and their applications. Reports of the X-th interstate seminar. , Ioffe PTI, pp.179-183, 2007. (on Russian)
Copyright © 2012 SciRes. 27

The Reaction Sequence and Dielectric Properties of BaAl2Ti5O14 Ceramics
Xiaogang Yao, Wei Chen, Lan Luo Shanghai Institute of CeramicsChinese Academy of Science
Shanghai, China [email protected]
Abstract—To investigate the correct reaction sequence of BaO-Al2O3-5TiO2 system, powders calcined at different temperatures are analyzed by x-ray diffraction. The results show that the source phase BaCO3 decomposes below 800°C, TiO2 and Al2O3 start to consume at 900 and 1100°C, respectively. BaTi4O9 phase appears at 1000°C while BaAl2Ti5O14 phase starts to reveal at 1200°C. As the temperature increases, the density, dielectric constant and quality factor of the BaAl2Ti5O14 ceramic increase and keep unchanged at 1350°C. The dielectric properties of BaAl2Ti5O14 ceramic sintered at 1350°C for 3h are: �r=35.8, Q×f=5130GHz, �f=-6.8ppm/°C.
Keywords-reaction sequence; BaAl2Ti5O14; ceramics; dielectric properties
1. IntroductionThe rapid progress in mobile communication has created a
tremendous demand for the microwave dielectric materials with high dielectric constant, low dielectric loss and near-zero temperature coefficient of resonator frequency [1,2]. As a typical high permittivity system, Ba6-3xLn8+2xTi18O54 (Ln=La, Sm, Nd) has attracted plenty of attention for the high dielectric constant over 80 [3,4]. However, the shortcoming of BLT system is its relatively high dielectric loss (low quality factor) which has restricted its commercial application.
Much work was done to lower the dielectric loss of the BLT system. Zhu improved the Q×f value of Ba4.2Nd9.2Ti18O54 ceramic by doping with LnAlO3 (Ln=La, Nd, Sm) [5]. TiO2 was added into Ba6-3xSm8+2xTi18O54 by Ohsato and excellent dielectric properties were obtained [6]. Our previous work has revealed that the crucial point to lower the dielectric loss of BLT system is preventing the reduction of Ti4+ at high sintering temperatures [7]. Al2O3 or MgO was used as an acceptor to suppress the reduction of Ti4+ in Ba4.2Sm9.2Ti18O54 ceramic and was very effective to improve the Q×f value of the BST ceramic. In our present work, Al2O3 was added into Ba-Sm-Ti and Ba-Nd-Ti systems. The dielectric loss has been reduced effectively. The common results are closely related to a new phase BaAl2Ti5O14 (BAT) which is observed in both systems. No relevant information about the new BAT phase was reported.
In this paper, BaAl2Ti5O14 ceramic was prepared by the solid state reaction. X-ray diffraction was used to identify the crystalline phase at each calcining temperature from 800 to 1350°C. The reaction sequence of BaO-Al2O3-5TiO2 system was determined and the microwave dielectric properties of BaAl2Ti5O14 ceramic were measured.
2. ExperimentThe BAT ceramic powders were prepared according to the
desired stoichiometry of BaAl2Ti5O14 by mixing the chemical grade starting materials BaCO3 (99.9%), Al2O3 (99.9%) and TiO2 (99.9%). After ground in deionized water with ZrO2 balls for 24h, the mixture was dried and then calcined at different temperatures from 800 to 1350°C in air for 1h. The optimally calcined BAT powders were milled for 24h, dried at 120°C and granulated with polyvinyl alcohol (PVA). The granules were preformed and then sintered at 1275~1375°C in air for 3h with a heating rate of 5°C/min.
The bulk densities of the BAT ceramic were measured by the Archimedes method. The crystalline phases of the calcined BAT powders and sintered BAT ceramic were analyzed by a Rigaku D/max 2550V X-ray diffractometer with a conventional Cu-K� radiation in the range of 10~70° with a step size of 0.02°. The microstructure of the BAT ceramic was examined by a Hitachi S-4800 field emission scanning electron microscope. The dielectric properties of the polished BAT samples were tested the TE011 mode of an Agilent E8363A PNA series network analyzer with a frequency ranges from 3 to 4GHz. �f was tested in the temperature ranges from 20 to 80°C and calculated by noting the change in resonant frequency as:
� � / 60f 2 1 1= f - f f� (1)
Here, f1 and f2 represent the resonant frequencies at 20 and 80°C, respectively.
Advances in Materials Physics and Chemistry Supplement: 2012 world Congress on Engineering and Technology
28 Copyright © 2012 SciRes.

3. Results and Discussion A. Reaction Sequence of BaO-Al2O3-5TiO2 ststem
Fig.1 XRD patterns of BaO-Al2O3-5TiO2 powders calcined at different
temperatures from 800 to 1350°C for 1h.
Fig.1 shows the XRD patterns of the BAT powders calcined at different temperatures from 800 to 1350°C for 1h. Here, the phases identified by X-ray diffraction at each calcining temperature are listed in Table 1. Six phases are observed as various temperatures are used. BaCO3, Al2O3 and TiO2 phases are observed at 800 °C with a new phase BaTiO3 accompanied. It is easy to deduce that BaTiO3 is the product of the reaction of BaCO3 and TiO2. With increasing the temperature to 900°C, no BaCO3 is residual while the trace of BaTiO4 is detected. Fewer BaTiO3 but a predominant BaTiO4 phase is found at 1000°C. Not any change is observed until the calcining temperature is increased to 1200°C. The diffraction peaks of TiO2 and BaTiO4 are getting weak while a new phase BaAl2Ti5O14 appears. Only a single BaAl2Ti5O14 phase exists over 1300°C.
We can easily write down the reaction sequence of the BaO-Al2O3-5TiO2 system with the increasing of calcining temperature from 800 to 1350°C.
Below 800°C: (2) 3BaCO BaO+CO� 2 �
3
9
800°C: (3) 2BaO+TiO BaTiO�
900~1000°C: (4) 3 2 4BaTiO +3TiO BaTi O�
1200°C: (5) 4 9 2 3 2 2 5 14BaTi O +Al O +TiO BaAl Ti O�
Table 1 Crystalline phases exist of not exist at each calcining temperature.
Tc/°C BaCO3 TiO2 Al2O3 BaTiO3 BaTiO4 BaAl2Ti5O14
800 Y Y Y Y N N 900 N Y Y Y Y N 1000 N Y Y N Y N 1100 N Y Y N Y N 1200 N Y N N Y Y 1250 N Y N N N Y 1300 N N N N N Y 1350 N N N N N Y
Fig.2 shows the DSC curve of the BaO-Al2O3-5TiO2 powder heated from room temperature to 1350°C. As shown in Fig.2, three exothermic peaks are observed at 825, 925 and
1300°C which correspond very well to the temperatures at which the reactions (3)-(5) happen.
Fig.2 DSC curve of BAT powders
B. Dielectric Propertiesof BaAl2Ti5O14 ceramic From what has been discussed above, we can draw the
conclusion that the sintering temperature of the BaAl2Ti5O14 ceramic is between 1300 and 1350°C. Thus, five temperature points (1275, 1300, 1325, 1350, 1375°C) are used to study the effect of temperature on the dielectric properties.
Fig.3 Density of the BAT ceramics sintered at different temperatures from
1275 to 1375°C.
Fig.3 shows the density of BAT ceramics at different sintering temperature. With the increasing temperature from 1275 to 1375°C, the density of BAT ceramics increases from 4.02 to the maximum value 4.17g/cm3 at 1350°C, and then decreases slightly. We can conclude that the optimized sintering temperature of the BAT ceramics is 1350°C.
Fig.4 SEM images of the BAT ceramic sintered at 1350°C for 3h: (a) ×500; (b)
×1000.
Copyright © 2012 SciRes. 29

Fig.4 shows the SEM images of the BAT ceramic samples sintered at 1350°C for 3h. As we can see from Fig.4a, the BAT ceramic has a compact structure but a heterogeneous grain size. The average size is 10�m, as shown in Fig.4b. Irregularly grown grains are seen in both images. The formation mechanism of these huge grains is still inexplicit and needs further research.
Fig.5 Dielectric constant of the BAT ceramics sintered at different temperatures
from 1275 to 1375°C.
Fig.5 shows the dielectric constant of BAT ceramics sintered at different temperatures. It is not strange that the change in dielectric constant with temperature shows the same regularity with that of density, since a more compact structure means a lower porosity. The dielectric constant of BAT ceramics reach 35.8 after sintering at 1350°C for 3h.
Fig.6 Q×f value of the BAT ceramics sintered at different temperatures from
1275 to 1375°C.
Fig.6 shows the Q×f value of the BAT ceramics sintered at different temperatures from 1275 to 1375°C for 3h. With the increasing temperature, the Q×f value of BAT ceramics increases from 4324GHz at 1275°C to the maximum value 5130GHz at 1350°C. The heterogeneous grain size has very bad effect on the Q×f value. Huge grains can increase the dielectric loss significantly. Therefore, much work need be done to obtain a more homogenous grain distribution so as to improve the Q×f value of BAT ceramics.
Fig.7 Resonator frequency of temperature coefficient of the BAT ceramics
sintered at different temperatures from 1275 to 1375°C.
Fig.7 shows the �f value of BAT ceramics sintered at different temperatures for 3h. The �f value of the BAT ceramics is slightly affected by the sintering temperature. BAT ceramics sintered at 1350°C for 3h has a negative �f value of -6.8ppm/°C.
4. Conclusion BaAl2Ti5O14 ceramic is prepared by the conventional solid
state reaction. The reaction sequence of BaO-Al2O3-5TiO2 system has been established. The result shows that the ideal calcining temperature of BAT powder is 1200°C and the best sintering temperature of BAT ceramic is 1350°C. The BAT ceramic has a heterogeneous grain distribution which has very bad effect on its dielectric properties especially for the Qf value. The dielectric properties of BAT ceramic sintered at 1350°C for 3h are: �r=35.8, Q×f= 5130GHz and �f=-6.8ppm/°C.
REFERENCES[1] R. Cava, “Dielectric materials for applications in microwave
communications,” J.Mater.Chem. pp. 54-62, 2001. [2] I. Reaney D. Iddles, “Microwave dielectric ceramics for resonators
and filters in mobile phone networks,” J.Am.Ceram.Soc.pp.2063-2072,2006.
[3] H. Ohsato, “Science of tungstenbronze-type like Ba6-3xR8+2xTi18O54 (R=rare earth) microwave dielectric solid solutions,” J.Euro.Ceram.Soc.pp.2703-2711,2001.
[4] H. Ohsato, M. Mizuta, “Microwave dielectric properties of tungsten bronze-type Ba6-3xR8+2xTi18O54 (R=La, Pr, Nd and Sm) solid solution,”J. Ceram.Soc.Jap.pp.178-182,1998.
[5] J. Zhu, E. Kipkoech, W. Lu. “Effects of LnAlO3(Ln=La, Nd, Sm) additives on the properties of Ba4.2Nd9.2Ti18O54 ceramics,” J.Euro.Ceram.Soc.pp.2027-2030,2006.
[6] H. Ohsato, A. Komura, “Microwave dielectric properties and sintering of Ba6-3xR8+2xTi18O54 (R=Sm,x=2/3) solid solution with added rutile,” Jpn.J.Appl.Phys. pp.5357-5359,1998.
[7] X. Yao, H. Lin, “Antireducion of Ti4+ in Ba4.2Sm9.2Ti18O54 ceramics by doping with MgO,Al2O3 and MnO2,”Ceram.Int.pp.3011-3016,2012.
30 Copyright © 2012 SciRes.

Pulsed Gas Jets for Formationof High-Intensity Cluster Beams
N. G. Korobeishchikov, A. E. Zarvin, V. V. Kalyada, A. A. Schmakov Department of Applied Physics
Novosibirsk National Research State University Novosibirsk, Russia [email protected]
Abstract—The possibility of using of pulsed supersonic gas jets for the formation of high intensity cluster ion beams are discusses. The results of experimental investigations of pulsed gases expansion are generalized in terms of dimensionless similarity parameters. The results of the experimental study of formation of an high-intensity cluster beam of argon are presented. The fundamental phenomenon influences on the main parameters of cluster beam (cluster size, intensity ect.) are considered.
Keywords-pulsed supersonic jet; steady-flow region; settling time; condensation of gas; cluster beam
1. IntroductionToday the beams of atomic or molecular ions are in fact
become an integral part of many modern technologies [1]. All conventional ion beam technologies are based on the individual collisions (or a cascade of binary collisions) of incident ions with near-surface atoms. A completely different situation occurs during a collision the energetic large clusters with the surface. In this case, nearly simultaneous interaction of many particles of cluster around the same number of atoms in a solid occurs. This leads to deposition a high-energy density into a very small volume of the target material, and strong nonlinear effects: lateral sputtering, dry etching, and shallow implantation. Recently it was shown that the accelerated gas cluster ion beams have a number of unique advantages that allow them to be considered a promising basis for new technologies, including nanotechnologies [2, 3].
It’s known that in supersonic jet due to free expansion the gas temperature drops to cryogenic values the process of condensation occur and clusters can form [4]. A cluster can consist of a large number of identical or different particles and be in a different state of matter [5]. Forces, holding molecules in the cluster, could effect on the threshold energy of activation and ionization of molecules in a clusters, and result to broadening of energy levels. Large particle residence time increases the probability and intensity of energy exchange in a cluster that allows you to talk about “cluster catalysis” [6-7].
The regime (a) requires the maintenance of a low background pressure (Pb<10-2 Pa). Other limiting regime (c, Pb>1 Pa) applies only for expansion of a chock-wave-heated gas. For practical applications most important conditions correspond to regime (b, 1<Pb<10-2 Pa). The relatively high background pressure allows the nozzle to operate at a large flow rate and form supersonic flow with developed relaxation processes. We have experimentally investigated the gasdynamic parameters of pulsed expansion of different gases (He, Ar, N2) from sonic nozzles with diameters d=1mm and d=0.5mm. The main parameters of pulsed jet are settling time of pulsed jet and duration of steady-flow region.
Since the course of condensation is determined by the number of particle collisions during expansion, you must increase the gas flow rate from the source, what requires a
proportionate growth in the pumping performance of funds. Pulsed gas-jet sources allow you to succesfully solve this problem. The main advantage of pulsed sources compare to continuous flow devices is the high economic efficiency, explained by their relatively smaller dimensions, less stringent requirements on pumping systems, and lower consumption of high-cost materials. In addition, pulse sources easily compatible with powerful pulse activation systems: laser, discharge, etc.
2.Dynamics of Gas Pulsed Expansion Pulse regime assumes that the gas source operates for a
finite time with a certain sequence (frequency and pulse ratio). Therefore, the most important issue when using pulse source is the formation at required distance from the source the flow with sufficient duration and specified parameters, which similar steady-flow expansion.
Obviously the dynamics of free gas expansion is determined by the ratio of the momentum of the expanding gas to that of the background gas. Depending on stagnation pressure P0 and residual (background) pressure Pb we may distinguish three principal regimes of supersonic pulsed expansion [8]:
a) expansion into a region of very low background pressure (expansion into vacuum),
b) expansion into a continuous medium (flooded space), c) expansion into a region with reduced background gas
pressure (intermediate case).
Advances in Materials Physics and Chemistry Supplement: 2012 world Congress on Engineering and Technology
Copyright © 2012 SciRes. 31

A. Settling Time of Pulsed JetThe settling time of a nonsteady jet is defined as the time
interval from the moment of opening of the source to themoment of establishment of steady flow parameters at a givendistance from the nozzle. The settling time of a free jet isdetermined by motion of the front part of the nonsteady flow,which depends on the interaction of the expanding gas withthe background gas, namely depends on the ratio of themomentum of the expanding gas to that of the background gasdisplaced from the flow region. Under expansion into vacuum(regime a) the leading front of expansion gas move with thelimiting velocity Vmn of nonsteady flow:
Vmn=a*(������������� ���
where a* is sound velocity in the critical cross section of thenozzle. But settling time is determined by the maximumvelocity of steady flow Vms, which is depend on the totalenthalpy h0 of this gas:
Vms=�2h� = a*�(������������������������������������
It was found that under expansion into a region withreduced background pressure (regime c) the retarding actionof the background gas leads to that the leading front ofexpansion gas and the front of steady-flow region are the same.The boundary of a pulsed jet propagates with a velocitysignificantly smaller than the limiting steady-state value Vms
for a given gas [8].In order to generalize the experimental data, we used
dimensionless parameters including characteristics of theexpanding gas and the background gas, which play the role ofsimilarity criteria [9]. Using this date, it’s possible to calculatethe settling time of pulsed jet for actual conditions.
Figure 1. Generalized plot of settling time in dimensionless coordinates.
B. Duration of Steady�Flow RegionAt moment of switch off gas source, there arises a trailing
(secondary) rarefaction wave characterized by nonsteady flow.Propagation of this secondary rarefaction wave downstreamfrom the nozzle determines the trailing front of the steady flowregion. Therefore, a question naturally arises as to what is thetime of existence (or duration) of the steady flow at a givendistance from a pulsed jet source.
It was established that the length (duration) of the steadyflow region in a pulsed jet at a fixed distance from the sourceis independent of the ratio of heat capacities of expandinggases and is determined by the pulse duration at the nozzleexit and the ratio of stagnation and background pressures. Thetime of existence of the steady state in a pulsed gas jetmonotonically decreases downstream from the nozzle anddrops with increasing background gas pressure due to the lossof particles in the leading and trailing rarefaction waves; thislength increases with the initial momentum because thebackground gas is more intensively displaced from the flowregion [8]. As a result, a situation is possible where the flow ata finite distance from the source does not attain a steady stateeven despite the fact that at the nozzle necessary conditionsare satisfied.
II. Formation of high intensity cluster beamsUsing pulse source we carried out experimentally research onthe formation of intensive cluster ions beams from thesupersonic jets of Ar.
3. ExperimentalThe research was performed using the LEMPUS
experimental setup of Novosibirsk State University [10]. Thepulse valve with diameter of sonic nozzle 1 mm and theduration of gas pulse 1.3 ms was used. The stagnationpressure P0 varying from 1 kPa before 103 kPa. Themeasurements were performed by means of a molecular beammass-spectrometer method [11-12].
4. Results and discussionTo determine the optimal parameters for the formation of
an intense cluster beam measurements of the total intensity ofthe neutral molecular flow were made by varying thestagnation pressure P0 and the distance of the nozzle -skimmer xns. The measurements were performed using aclosed ionization pressure sensor Granville-Philips located onthe axis of the molecular beam. Since the clusters arecompletely destroyed by collisions with the walls inside thesensor, the equilibrium density of the gas in the sensor isproportional to the intensity cluster molecular beam.
In Fig. 3 shows the values of pressure on axis of molecularflow Pa and background pressure in the ionizer section Pb,measured simultaneously at a fixed pressure P0 = 5*105 Pa atdifferent nozzle-skimmer distances. Here and further thedistance nozzle - skimmer is measured in caliber (diameter ofthe nozzle throat), x/d*. There is an arrow shows the positionof the boundary of the jet - direct shock wave (Mach disk),calculated from the known empirical formula:
32 ���������� �� ��������

XM= 0.67*�P /Pk������������������������
Figure 2. The pressure on axis of molecular flow, Pa, background pressure in the ionizer section Pb, and pressure in the molecular beam Pmb
depend of nozzle-skimmer distances at P0 = 5*105 Pa.
where Pk is background pressure in the expansion chamber. Obviously, the background pressure in the ionizer chamber may influence the correctness of the sensor readings of the intensity of the molecular beam. Therefore, the true pressure in the molecular beam Pmb defined as difference between Pa and Pb.
When moving from the Mach disk to the nozzle increases leakage of gas through the skimmer into ionizer chamber according to the isentropic density distribution of gas in the jet (~ 1/x2, on the figure the dotted line). As a result, the background pressure Pb increases proportionally. The pressure of the molecular beam Pmb also dramatically increased in proportion to ~ 1/x2 after leaving the Mach disk (x/d* < 330). However, the increase in background pressure leads to molecular beam scattering, which leads initially (at x/d* ~ 240) to a deviation from linear growth, and then (at x/d* < 200) and a pressure drop Pmb. Thus, for these conditions the molecular beam is formed with a maximum intensity at distances nozzle - skimmer 150-200 calibers.
Using this algorithm of measurements, we calculated the intensity of the clustering molecular beam for several fixed stagnation pressure (Fig. 3). Despite the fact that the size of the jet (the distance to the Mach disk) changes markedly with increasing P0, the optimum distance of the nozzle - skimmer of about the same - 150-200 calibers. The maximum intensity (~ 2*1018 molecules/sm2*sec) is attained at P0 = 6*105 Pa.
It should be noted a significant non-linearity depending on the maximum intensity of the clustering molecular beam from the pressure P0: at P0 = 105 Pa, the maximum intensity of more Figure 3. The intensity of cluster molecular beam (molecules/sm2*sec)
depends of pressures P0 and nozzle-skimmer distances.
than 15 times smaller than at P0 = 3*105 Pa. One of the reasons is the influence of background gas in the expansion chamber. At low pressures transient regime of expansion formed with a blurring of shock waves limiting outside the core of the jet and, consequently, with a noticeable penetration of background gas, resulting in a decrease in the intensity of the molecular flow. In this case, at P0 = 105 Pa, there is no central Mach disk (calculated position - x/d* = 280).
Another important reason is the various stages of condensation of gas flow in a supersonic flow. As you know, in a free jet heavy particles (in this case – clusters) are concentrated at the jet axis as a result of gas-dynamic separation [4]. Accordingly, the intensity of the beam is determined clustering molecular condensate fraction (fraction of gas in a bound state) and the size of the clusters. For our conditions, we calculated the dimensionless similarity parameters for flows with condensation, Hagena`s parameter [13].
Using the mean cluster sizes intensities of the molecular beam were calculated in terms cluster/sm2*sec, the results are shown in Fig. 4. It is seen that, except for the very low pressure, with increasing P0 the flow of clusters on the axis of the jet decreases. This is explained by the previously mentioned factors - the proportion of output saturation and condensation on the continued growth of the average cluster size. Thus, the condensation at this stage continues, mainly
Copyright © 2012 SciRes. 33

due to consolidation of small clusters. So under such condition it is possible obtained a cluster beam very high intensity: up to 4-1014 clusters/sm2*sec.
Figure 4. The intensity of cluster molecular beam depends of pressures P0 and nozzle-skimmer distances.
As a result of experimental investigations the optimal conditions for the formation of a clustering molecular beam from supersonic jets of argon have been determined. A maximum intensity of 4*1014 clusters/cm2*sec for the clusters with an average size of 1000 molecules, and 8*1013 for
clusters with an average size of more than 20,000 molecules have been reached.
REFERENCES[1] L.A. Giannuzzi and F.A. Stevens. Introduction to Focused Ion
Beams: Instrumentation, Theory, Techniques and Practice. Springer Press. 2004.
[2] N.V. Popok and E.B. Campbell “Beams of atomic clusters: effect on impact with solid,” Reviews of Advanced Materials Science, vol. 11, pp. 19-45, 2006.
[3] I. Yamada, «Cluster ion beam process technology – 20 years of R&D history», Nuclear Instruments and Methods in Physics Research B, vol. 257, pp.632-638. 2007.
[4] H. Pauly, Atom, Molecule, and Cluster Beams II. Springer-Verlag, Berlin, 2000.
[5] Handbook of Nanophysics 2. Clusters and Fullerens. Ed. by Klaus D. Scattler. New York: CRC Press, 2011.
[6] V. Zh. Madirbaev, A. E. Zarvin, N. G. Korobeishchikov and R. G. Sharafutdinov, “Ion-cluster reactions initiated by an electron beam in mixtures of argon with methane and monosilane,” Phys. of the Solid State, vol. 44, pp. 515-517, 2002.
[7] V. Zh. Madirbaev and A. E. Zarvin, “On the possibility of a cluster-catalytic reactions for the synthesis of heavy hydrocarbons,” Book of Abstracts of the 7th Int. Seminar on Flame Structure and First Young Res. Sch. on Flame Study. Novosibirsk, July 11-15, p. 56, 2011.
[8] N. G. Korobeishchikov, A. E. Zarvin and V. Zh. Madirbaev, “Hydrodynamics of pulsed supersonic underexpandet jets: Spatiotemporal characteristic”, Tech. Phys., vol. 49, pp. 973-981, 2004.
[9] S. F. Chekmarev and N. V. Stankus, “Gasdynamic model and similar relations for the starting process in supersonic nozzles and jets”, Sov. Tech. Phys., vol. 29, pp. 920-925, 1984.
[10] A. E. Zarvin, N. G. Korobeishchikov, V. Zh. Madirbaev, G. G. Gartvich, V. V. Kalyada and V. S. Airapetyan, “A universal small-sized vacuum installation for gas-kinetic investigations”, Instrum. Exp. Tech., vol. 43, pp. 641-649, 2000.
[11] N. G. Korobeishchikov, A. E. Zarvin, V. Zh. Madirbaev and R. G. Sharafutdinov, “Condensation of argon, monosilane and their mixture in a pulse free jet”, Plasma Chem. Plasma Proc., vol. 25, pp. 319-349, 2005
[12] A. E. Zarvin, N. G. Korobeishchikov, V. V. Kalyada and V. Zh. Madirbaev, “Formation of mixed clusters in a pulsed helium-oxygen-isoprene supersonic jet”, Eur. Phys. J. D, vol. 49, pp. 101-110, 2008.
[13] O.F. Hagena, “Cluster ion sources,” Review of Science Instruments, vol. 63, pp. 2374-2379, 1992.
34 Copyright © 2012 SciRes.
A sewage sludge derived composite material for adsorption of antibiotics – kinetics
Pengfei Zhang and Rui Ding Department of Earth and Atmospheric Sciences
City College of New York New York, NY 10031, USA [email protected]
Mykola Seredych and Teresa J. Bandosz Department of Chemistry City College of New York
New York, NY 10031, USA [email protected]
Abstract—A novel sewage-sludge derived composite material was developed for the adsorptive removal of organic pollutants from water. In this study a batch adsorption study was carried out to examine the kinetics of antibiotics adsorption by this composite material. A pseudo-second order kinetics model fits the data extremely well, suggesting that chemical adsorption, rather than physical adsorption, is likely the main mechanism of the separation process.
Keywords- sewage sludge, composite material; adsorption kinetics; antibiotics; wastewater treatment
1. IntroductionAn estimated 100,000 to 200,000 tons of antibiotics are
produced each year [1] as human and veterinary medicine [2, 3], and as much as 30% to 90% of administered antibiotics can be excreted without being metabolized [4]. The excreted antibiotics are often discharged into surface waters or leached into soils and groundwater from manure-based fertilizers or sewage sludge [2, 5], contaminating aquatic and terrestrial environments. Even low concentration of antibiotics in the environment may lead to the development and spreading of antibiotic resistance. Therefore, there is an urgent need to develop advanced treatment technologies that can effectively remove antibiotics and other related pollutants from contaminated water, especially from drinking water sources.
In a recent study [6], we demonstrated that composite materials derived from the pyrolysis of sewage sludge and waste oil sludge were able to simultaneously remove a dozen or so antibiotics from water. The adsorption capacities of these composite materials are comparable to typical granular activated carbons [6, 7]. Physical adsorption, reactive adsorption and specific polar interactions were indicated as the mechanisms of the separation process [6]. The objective of this study was to examine the kinetics of antibiotics adsorption by one of those sewage sludge derived composite materials.
2.Materials and Methods A. Composite�Material�
The composite material (SSWO950) was obtained by pyrolysis of a mixture (50:50 ratio based on the wet mass) industrial waste oil sludge (WO) from Newport News
Shipyard (Newport News, VA, USA) and dewatered sewage sludge (SS) from Wards Island Water Pollution Control Plant (New York, NY, USA), at 950 oC in a nitrogen atmosphere in a fixed bed (horizontal furnace).
B. Batch�Adsorption�Experiment�Adsorption of a mixture of 11 antibiotics plus 2
anticonvulsants (see Table I for the list of compounds) was measured in closed batch systems at room temperature. One mL of the mixture solution (100 mg·L-1 of each compound) was mixed with 0.050 g of the SSWO950 material in amber glass vials. The sample vials were sealed and then shaken on an orbital shaker. Duplicate samples were taken at 2, 4, 6, 8, and 23.5 hours and analyzed for the kinetics study.
TABLE I. ANTIBIOTICS AND ANTICONVULSANTS TESTED IN THIS STUDY.
Category Name
Beta-lactam Amoxicillin Penicillin-G
Fluoroquinolones Enrofloxacin Ofloxacin
Sulfonamides Sulfadiazine Sulfamethazine Sulfamethoxa-zole
Macrolides Erythromycin
Tetracyclines Chlortetracycline Oxytetracycline
Other antibiotics Chloramphenicol
Anticonvulsants Carbamazepine Primidone
C. Sample�Analysis�All samples were analyzed using liquid chromatography-
tandem mass spectrometry (LC/MS/MS) with electron spray ionization (ESI) and multiple reaction monitoring (MRM). Details of the analysis can be found in Ding et al. [6].
D. Kinetic�Modeling�Both the pseudo-first order and pseudo-second order
kinetics models were used to fit the experimental data. The equation for the pseudo-first order model is as follows [8]:
dqt/dt= k1(qe – qt) (1)
where qe and qt are the sorption capacities (mg·g-1) at equilibrium and at time t, respectively, and k1 is the rate
Partially supported by the US Environmental Protection Agency
Advances in Materials Physics and Chemistry Supplement: 2012 world Congress on Engineering and Technology
Copyright © 2012 SciRes. 35
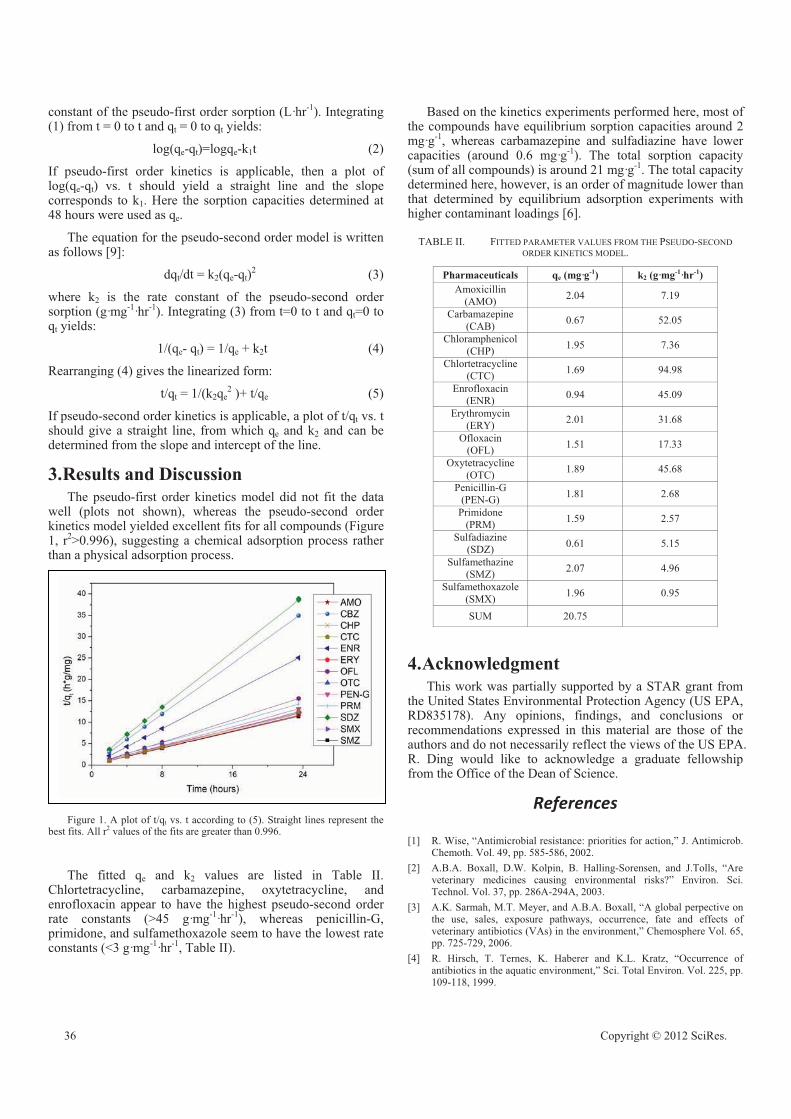
constant of the pseudo-first order sorption (L·hr-1). Integrating (1) from t = 0 to t and qt = 0 to qt yields:
log(qe-qt)=logqe-k1t (2)
If pseudo-first order kinetics is applicable, then a plot of log(qe-qt) vs. t should yield a straight line and the slope corresponds to k1. Here the sorption capacities determined at 48 hours were used as qe.
The equation for the pseudo-second order model is written as follows [9]:
dqt/dt = k2(qe-qt)2 (3)
where k2 is the rate constant of the pseudo-second order sorption (g·mg-1·hr-1). Integrating (3) from t=0 to t and qt=0 to qt yields:
1/(qe- qt) = 1/qe + k2t (4)
Rearranging (4) gives the linearized form:
t/qt = 1/(k2qe2 )+ t/qe (5)
If pseudo-second order kinetics is applicable, a plot of t/qt vs. t should give a straight line, from which qe and k2 and can be determined from the slope and intercept of the line.
3.Results and Discussion The pseudo-first order kinetics model did not fit the data
well (plots not shown), whereas the pseudo-second order kinetics model yielded excellent fits for all compounds (Figure 1, r2>0.996), suggesting a chemical adsorption process rather than a physical adsorption process.
Figure 1. A plot of t/qt vs. t according to (5). Straight lines represent the best fits. All r2 values of the fits are greater than 0.996.
The fitted qe and k2 values are listed in Table II. Chlortetracycline, carbamazepine, oxytetracycline, and enrofloxacin appear to have the highest pseudo-second order rate constants (>45 g·mg-1·hr-1), whereas penicillin-G, primidone, and sulfamethoxazole seem to have the lowest rate constants (<3 g·mg-1·hr-1, Table II).
Based on the kinetics experiments performed here, most of the compounds have equilibrium sorption capacities around 2 mg·g-1, whereas carbamazepine and sulfadiazine have lower capacities (around 0.6 mg·g-1). The total sorption capacity (sum of all compounds) is around 21 mg·g-1. The total capacity determined here, however, is an order of magnitude lower than that determined by equilibrium adsorption experiments with higher contaminant loadings [6].
TABLE II. FITTED PARAMETER VALUES FROM THE PSEUDO-SECOND ORDER KINETICS MODEL.
Pharmaceuticals qe (mg·g-1) k2 (g·mg-1·hr-1)Amoxicillin
(AMO) 2.04 7.19
Carbamazepine (CAB) 0.67 52.05
Chloramphenicol(CHP) 1.95 7.36
Chlortetracycline(CTC) 1.69 94.98
Enrofloxacin (ENR) 0.94 45.09
Erythromycin (ERY) 2.01 31.68
Ofloxacin(OFL) 1.51 17.33
Oxytetracycline (OTC) 1.89 45.68
Penicillin-G(PEN-G) 1.81 2.68
Primidone (PRM) 1.59 2.57
Sulfadiazine (SDZ) 0.61 5.15
Sulfamethazine (SMZ) 2.07 4.96
Sulfamethoxazole(SMX) 1.96 0.95
SUM 20.75
4.Acknowledgment This work was partially supported by a STAR grant from
the United States Environmental Protection Agency (US EPA, RD835178). Any opinions, findings, and conclusions or recommendations expressed in this material are those of the authors and do not necessarily reflect the views of the US EPA. R. Ding would like to acknowledge a graduate fellowship from the Office of the Dean of Science.
References�
[1] R. Wise, “Antimicrobial resistance: priorities for action,” J. Antimicrob. Chemoth. Vol. 49, pp. 585-586, 2002.
[2] A.B.A. Boxall, D.W. Kolpin, B. Halling-Sorensen, and J.Tolls, “Are veterinary medicines causing environmental risks?” Environ. Sci. Technol. Vol. 37, pp. 286A-294A, 2003.
[3] A.K. Sarmah, M.T. Meyer, and A.B.A. Boxall, “A global perpective on the use, sales, exposure pathways, occurrence, fate and effects of veterinary antibiotics (VAs) in the environment,” Chemosphere Vol. 65, pp. 725-729, 2006.
[4] R. Hirsch, T. Ternes, K. Haberer and K.L. Kratz, “Occurrence of antibiotics in the aquatic environment,” Sci. Total Environ. Vol. 225, pp. 109-118, 1999.
36 Copyright © 2012 SciRes.

[5] N. Kemper, “Veterinary antibiotics in the aquatic and terrestrial environment,” Ecol. Indi. Vol. 8, pp. 1-13, 2008.
[6] R. Ding, P. Zhang, M. Seredych, and T.J. Bandosz, “Removal of antibiotics from water using sewage sludge and waste oil sludge derived adsorbents,” Water Res., DOI: 10.1016/j.bbr.2011.03.031, in press.
[7] J. Rivera-Utrilla, G. Prados-Joya, M. Sanchez-Polo, M.A. Ferro-Garcia and I. Bautista-Toledo, “Removal of nitroimidazole antibiotics from
aqueous solution by adsorption/bioadsorption on activated carbon,” J. Hazard. Mater. Vol. 170, pp. 298-305, 2009.
[8] S. Lagergren, “About the theory of so-called adsorption of solution substances. kunglia srenska vertens Ka psakademiens,” Handlinger Vol. 24, pp. 147-156, 1898.
[9] Y. S. Ho, G. Mckay. “A. two stage batch sorption optimized design for dye removal to minimize contact time,” Trans. IChem. E. Vol. 76, pp. 313-318, 1998.
Copyright © 2012 SciRes. 37

Synthesis and Characterization of Poly(1-methoxy-4-octyloxy)-para-phenylene vinylen for Light-emitting diodes
application
Piched Anuragudom Department of Chemistry
Faculty of Liberal Arts and Science, Kasetsart University, Kamphaeng, Nakhon Pathom 73140, Thailand
Abstract— In this study, the conjugated polymer, poly(1-methoxy-4-octyloxy)-para-phenylene vinylene (MO-p-PPV) was synthesized and characterized. MO-p-PPV was synthesized according to Gilch polymerization mechanism by using 4-methoxyphenol as starting material in the presence of potassium tert-butoxide (1M in THF). The product was further purified by multiple precipitations in different solvents such as methanol, tetrahydrofuran, isopropyl alcohol and hexane. The final product was dried to afford MO-p-PPV as a red solid. The resulting polymer was completely soluble in common organic solvents. The structure of monomer and optical properties of polymer were characterized by proton nuclear magnetic resonance (1H-NMR) spectroscopy, UV-vis spectroscopy, and fluorescence spectroscopy. The UV-vis spectrum showed absorption maxima for MO-p-PPV at 491 nm. Similarly, fluorescence spectrum showed max emission at 540 nm.
Keywords-component; Poly(1-methoxy-4-octyloxy)-para-phenylene vinylen; Gilch polymerization; Light-emitting diodes
1. IntroductionDuring the past decade, an explosive growth of activity in
the area of organic electroluminescence has occurred in both academia and industry [1]. As the potential base material in organic light-emitting diodes (OLEDs), conjugated polymers have been widely explored. For example, since the discovery of electroluminescence in poly(p-phenylene vinylene) (PPV) [2,3], a wide variety of conjugated and semi-conjugated polymers have been used as the active emissive layer in OLED devices [4–7]. Polymer light-emitting diodes (PLEDs) are promising devices, especially for next generation active matrix displays. Solution deposition techniques, homogeneous large area thin films, reduced manufacturing process complexity, low-cost, high luminescence efficiency, large spectral range, and relatively simple device structures are some of the main reasons for an increased interest in polymer materials for
LED's [ ]. M. T. Bernius, M. Inbasekaran, J. O'Brien, and W. Wu, Adv. Mater., 12, 1737 (2000).
we report here the preparation of poly(1-methoxy-4-octyloxy)-para-phenylene vinylene (MO-p-PPV) for light emitting diodes application by using Gilch polymerization route. A typical procedure for the synthesis was described in the Experimental section.
2. Experiment Materials
4-methoxyphenol, 1-bromooctane, Sodium bromide, paraformaldehyde, potassium tert-butoxide (1 M solution in THF), KOH, glacial acetic acid, conc. H2SO4 were purchased from Aldrich Chemical Co. and used without further purification unless otherwise noted. THF was dried and purified by fractional distillation over sodium/benzophenone and handled in a moisture-free atmosphere.
Measurements 1H and 13C NMR spectra were recorded using a Bruker
avance 400 MHz, and chemical shifts were recorded in ppm. The data were processed using NUTS NMR Utility Transform Software (Acron NMR). The UV-vis spectra were recorded on a Perkin Elmer Lambda 19 UV-VIS-NIR spectrophotometer with baseline corrections and normalizations carried out using WinLab software. Fluorescence spectra were collected on a Perkin Elmer Luminescence Spectrometer LB 50.
Methoxy-4-octyloxy benzene (1)
4-methoxyphenol (10.0 g, 0.083 mol) was dissolved by 100 ml ethanol, 6.0 g (0.12 mol) of KOH and octyl bromide (22.4 g, 0.12 mol) were added and strired at 70 oC for 24 h. After the reaction, precipitate was collected by filtration and washed with ethanol. White crystalline 1 (67% yield) was obtained.
1,4-Bis(bromomethyl)-methoxy-4-octyloxy benzene (2)
Methoxy-4-octyloxy benzene (0.169 mol), Sodium bromide (0.097 mol), paraformaldehyde (0.166 mol) were dissolved in 24 ml of glacial acetic acid. 50% conc. H2SO4 in glacial acetic
Identify applicable sponsor/s here. (sponsors)
Advances in Materials Physics and Chemistry Supplement: 2012 world Congress on Engineering and Technology
38 Copyright © 2012 SciRes.

acid was added and the reaction was heated at 70 oC for 24 h. Then saturated NaHCO3 was added until the red color disappeared. The mixture was extracted three times with dichloromethane. The organic extracts were combined, washed with brine, and dried with magnesium sulfate. Upon filtering the solution and evaporating the solvent, a white solid was obtained, which was recrystallized in hexane and washed with cool methanol to give white crystals of pure 2 (60%).
Poly(1-methoxy-4-octyloxy)-para-phenylene vinylene (MO-p-PPV)
of 1,4-Bis(bromomethyl)-methoxy-4-octyloxy benzene (0.00238 mol) was dissolved in 25 mL of anhydrous THF under nitrogen, and a 10 mL of THF solution of potassium tert-butoxide was added. The mixture was stirred overnight at room temperature under nitrogen. The resulting polymer was precipitated into 100 mL of methanol, and the mixture was centrifuged. The supernatant was decanted, and the residue was re-dissolved in a minimum amount of THF. The crude polymer was then successively re-precipitated into methanol and propanol. Red crystalline (55%) was obtained.
(1) (2)
Scheme 1. Synthesis of poly(1-methoxy-4-octyloxy)-para-phenylene vinylene (MO-p-PPV).
3. Results and discussion
360 390 420 450 480 510 540 570 600 630 660 690
Inte
nsity
(a.u
.)
Wavelength (nm)
Figure 1 UV-Vis spectrum of poly(1-methoxy-4-octyloxy)-para-phenylene vinylene (MO-p-PPV) (1.0 x 10⁻⁴ M) prepared by Gilch polymerization in THF at room temperature.
510 540 570 600 630 660 690
Inte
nsity
(a.u
.)
Wavelength (nm)
Figure 2 Fluorescence spectrum of Poly (1-methoxy-4-octyloxy)-para-phenylene vinylene (MO-p-PPV) (1.0 x 10⁻⁵ M) Gilch polymerization in THF at room temperature (excitation 497 nm).
Figure 1 and 2 shows the UV-Vis absorption and fluorescence (FL) spectra of the MO-p-PPV synthesized via Gilch polymerization. The Gilch polymerization affords MO-p-PPV having a broad absorption band with max = 491 nm. This band can be attributed to �-�* transitions of the conjugated backbones. Fluorescence spectra obtained upon excitation at 497 nm. The Gilch polymerization affords MO-p-PPV having a strong emission band at 540 nm.
4. ConclusionsPoly (1-methoxy-4-octyloxy)-para-phenylene vinylene
(MO-p-PPV) was successfully synthesized by Gilch polymerization. UV-Vis absorption spectrum in THF showed the broad absorption band with max = 491 nm. The PFV exhibited a greenish fluorescence at max emission = 540 nm.
5. Acknowledgment I would like to thank Prof. Dr. Thomas Randall Lee at
Houston University for instruments.
REFERENCES
[1] Brown, A.R.; Bradley, D.D.C.; Burroughes, J.H.; Friend, R.H.; Greenham, N.C.; Burn, P.L.; Holmes, A.B.; Kraft, A. Appl. Phys. Lett. 1992,
[2] Karg, S.; Riess, W.; Dyakonov, V.; Schwoerer, M. Synth. Met. 1993, 54, 427.
[3] S.L. Issler, C.C. Torardi, J. Alloy. Compd. vol. vol. 229, 1995, pp. 54. [4] I. Kandarakis, D. Cavouras, Appl. Radiat. Isot. vol. 54, 2001, pp. 821.
Copyright © 2012 SciRes. 39

Photocatalytic of TiO2-SiO2 thin films co-doped with Fe3+
and thio-urea in the degradation of formaldehyde by indoor and outdoor visible lights
Charuwan Kaewtip, Kamolporn Accanit, Nat-a-nong Chaowai, Kanokpun Areerat,
Pasuree Reanjaruan and Virote Boonumnauyvitaya* Chemical Engineering Department
King Mongkut’s University of Technology Thonburi Bangkok 10140, Thailand
Email: [email protected]
Abstract— In this work the photocatalytic activity of TiO2-SiO2 thin films co-doped with Fe3+ and thio-urea in the degradation of the gaseous formaldehyde was investigaged by indoor and outdoor visible lights. The films were synthesized by Peroxo Titanic Acid (PTA) method. The physicochemical properties of prepared samples were characterized using SEM and UV-vis absorption spectroscopy. It was found that the average film thickness of all coated samples was about 394 � 5 nm. The band gap energy of un-doped and co-doped photocatalysts was 3.08 and 2.88 eV, respectively. The photocatalytic experimental results showed that the co-doped TiO2-SiO2 thin film yield higher photocatalytic efficiency. Under the outdoor light (sunlight in the shade condition) irradiation, with the initial concentrations of formaldehyde of 1000, 3000 and 5000 ppmV, the efficiencies of formaldehyde degradation were 94.7 %, 89.5% and 85.1 %, respectively. Under the indoor light (the fluorescent lamp) irradiation, with the same formaldehyde initial concentrations, the photocatalytic activities were 87.4%, 85.3% and 81.5%, respectively.
Keywords-perxo titanic acid; titanium dioxide; sunlight in the shade; formaldehyde
1. IntroductionFormaldehyde is a toxic volatile organic compound
(VOCs), which causes cancer and is harmful to health when uptake into human bodies. Therefore, purification of ambient air form this toxic gas is essential for improving indoor air quality and human being’s health [1]. Titanium dioxide (TiO2) is a promising tool for environmental purification due to its specific optical and electronic properties, low cost, chemical stability and non-toxicity [2-4]. However, the need of an ultraviolet (UV) excitation which accounts for only a small fraction of the total solar energy (�5%) hinders its utility for limited applications [5].
Many attempts have been made to enhance the utilization of solar energy by doping the base photocatalyst with co-dopants elements such as C and N [6], Fe3+ and C [7], and Fe3+ and N [8-9]. Ohno et al. reported that the effect of adsorbing Fe3+ on the N- or S- doped TiO2 and found that the photocatalytic efficiency under visible light region was about
twice as high as without Fe3+ doping [10]. One element can extend the response of TiO2 to visible light, the other can act as electron and hole traps. Then TiO2 can respond to visible light and present a high catalytic activity [11].
In our previous work [12], TiO2-SiO2 thin films with co-dopants of Fe3+ and N,S yielded high efficiency in formaldehyde degradation. However, the study was limited in small lab scale using fluorescent lamp as the light source. The objective of this work is to confirm the practical use of these films by studying the efficiency of formaldehyde degradation using co-doped TiO2-SiO2 thin films in a large cubic glass chamber under the outdoor light compared with the indoor fluorescent light.
2. Experimental
A. Catalysts�preparation�� All reagents were of analytical grade and used without further purification. The co-doped TiO2-SiO2 thin films were prepared using the peroxo titanic acid (PTA) approach combined with the sol–gel method. The procedures for co-doped PTA sol (solution A) preparing were as follows: First, 4.3 g of Titanyl sulfate (TiOSO4) was added to 150 cm3 deionized water. While under vigorous stirring, 26 cm3 of NH4OH (3 mol/dm3) was added to the solution. Next, the white precipitates were filtered and sufficiently washed four to six times with distilled water to remove residues of NH4+ and SO4
2� ions, then dispersed homogeneously in 112.5 ml of distilled water. The resulting sol was peptized in 25 cm3 of hydrogen peroxide (30%), and then stirred for 15 min. The obtained orange transparent sol was kept under reflux at 100 �C. Before adding the co-dopants, the PTA sol was kept at room temperature for 24 h. Dopants added into the TiO2 based on the mass of TiO2 1.64 g in PTA sol. Finally, CSN2H4 of 0.125 wt.% and Fe(NO3)3 of 1.0 wt.% were added into the PTA sol. The SiO2 (solution B) sol was prepared via the condensation reaction of methyltrimethoxysilane (MTMOS). First, 4.3 cm3 of MTMOS were hydrolyzed with the mixture of 8.22 cm3 of methanol, 2 cm3 of H2O, and 0.5 cm3 of HCl (0.055M) aqueous solution. After the solutions were vigorously stirred at 50°C for 60 min, the mixture of 8.22 cm3
Advances in Materials Physics and Chemistry Supplement: 2012 world Congress on Engineering and Technology
40 Copyright © 2012 SciRes.

of methanol and 3.2 cm3 of NH4OH (0.856M), which was stirred at 25 °C for 60 min, was added into the hydrolyzed MTMOS solution and stirred for 15 min. Then, solution B was added into solution A under stirring at room temperature for 15 min. The obtained sol was coated on a glass plate (100x100x3 mm) by spin coating machine, and then kept for drying for 24 h at room temperature before using. The obtained photocatalysts were characterized by Scanning electron microscopy (SEM) to determine the thickness of coted film on the glass plate. The optical transmission and absorption spectra of the films were measured using UV-vis spectrophotometer (U1900 UV/VIS, Hitachi) with the wave range of 200-1000 nm.
Wavenumber (nm)300 400 500 600 700 800 900 1000
Tran
smitt
ance
(%)
0
20
40
60
80
100
no doped filmco-doped film
Wavenumber (nm)200 300 400 500 600 700 800 900 1000
Abs
orba
nce
0.0
0.2
0.4
0.6
0.8
1.0
1.2
1.4
1.6
un-doped filmco-doped film
Figure 1. The schematic and components of glass reactor chamber (1) lid, (2) septum port, (3) fan hole, (4) fan, and (5) hygrometer and thermometer.
B. Photocatalytic�activity�of�formaldehyde�degradtion�
The experiments were conducted in a cubic 9.1 x 104 cm3 glass chamber where 70 pieces of coated glasses were attached around the inner wall. The schematic and components of glass reactor chamber showed in Fig.1. Injection and sampling of formaldehyde gas in the glass chamber were conducted through the septum port by means of a syringe. The initial concentrations of formaldehyde gas of 1000, 3000 and 5000 ppmV were used. The glass reactor chambers were covered with black fabric for shutting out light around 50-60 min until adsorption equilibrium conditions have been reached. Then the black fabric was removed to start the photocatalytic reaction. The chambers were placed indoor for fluorescent light and outdoor for sunlight (in the shade) exposures. The concentration of formaldehyde before and after photocatalytic reactions were measured by a gas chromatography (Shimadzu: GC2014) equipped with DB-WAX column.
3. Result and Discussion
C. Characterization�of�the�photocatalysts�
Cross sectional SEM image as shown in Fig. 2 shows a complete coverage of the substrate surface by the
photocatalysts film with the average film thickness 394 � 5 nm. The color of a coated !lm is opalescent-semitransparent due to the TiO2 powder dispersed in the !lm. The corresponding UV-Vis spectra for coated film are shown in Fig. 3. Compared with the un-doped film, the transmittance of the co-doped !lm was about 80% in the visible wavelength region and lower than those of the un- doped film. The difference in transmittance between the un-doped and the co-doped films was attributed to the adsorption of light by dopant. A signi!cant decrease in the transmittance below 400 nm can be assigned to absorption of light caused by the excitation of electrons from the valence band to the conduction band of TiO2 [13] Figure 2. SEM micrographs showing the cross section of the film thickness on glass substrate.
Figure 3. The UV-Vis transmittance spectra of the transparent films of un-doped and co-doped TiO2-SiO2 thin films.
Copyright © 2012 SciRes. 41

Figure 4. The UV-Vis absorption spectra of coated TiO2-SiO2 thin films
Fig. 4 shows the UV-Vis absorption spectra of un-doped and co-doped TiO2-SiO2 thin films. The absorption edge of un-doped is limited only to ultraviolet light region, whereas the absorption threshold values of co-doped photocatalyst is extended up to the visible light range. The energy band gap (Eg) is determined by the formula [14], Eg = 1239.8/ , where (nm) is the wavenumber of the absorption edge in the spectrum. The energy band gap of un-doped and co-doped TiO2-SiO2 thin films was 3.08 and 2.88 eV, respectively.
D. Photocatalytic�activity�� The formaldehyde degradation activity of the prepared photocatalytic films was determined and shown in Fig. 5. In dark condition, the formaldehyde adsorbed onto the all films within 30 min and approached equilibrium after 50-60 min. Under light irradiation, in both cases of indoor and outdoor conditions, all co-doped samples, demonstrate higher photocatalytic efficiencies than that of the un-doped photocatalysts. This could be attributed to the effect of the synergistic role of co-dopants in narrowing TiO2 band gap.
�
Reaction Time (min)
0 50 100 150 200 250 300
Form
alde
hyde
con
cent
ratio
n (p
pmV
)
0
1000
2000
3000
4000
5000
6000
controlun-dopedco-doped
Dark Sunlight in the shade c2.
Reaction Time (min)
0 50 100 150 200 250
Form
alde
hyde
con
cent
ratio
n (p
pmV
)
0
1000
2000
3000
4000
5000
6000
controlun-dopedco-doped
Dark Floresent irradiation c1.
Reaction Time (min)
0 20 40 60 80 100 120 140 160
Form
alde
hyde
con
cent
ratio
n (p
pmV
)
0
1000
2000
3000
4000
5000
controlun-dopedco-doped
Dark Sunlight in the shade b2.
Reaction Time (min)
0 20 40 60 80 100 120 140 160 180
Form
alde
hyde
con
cent
ratio
n (p
pmV
)
0
1000
2000
3000
4000
5000
controlun-dopedco-doped
Dark Floresent irradiation b1.
Reaction Time (min)
0 10 20 30 40 50 60 70 80
Form
alde
hyde
con
cent
ratio
n (p
pmV
)
0
200
400
600
800
1000
1200
1400
1600
controlun-dopedco-doped
Dark Sunlight in the shadea2.
Recation Time (min)
0 20 40 60 80 100 120 140 160 180
Form
alde
hyde
con
cent
ratio
n (p
pmV
)
0
200
400
600
800
1000
1200
1400
1600
controlun-dopedco-doped
Dark Floresent irradiation a1.
Figure 5. Photocatalytic decomposition profiles of gaseous formaldehyde by control (no photocatalyst) and photocatalysts chambers with different initial formaldehyde concentration a) 1,000 ppmV, b) 3,000 ppmV and c) 5,000 ppmV and different light source of irradiation.
42 Copyright © 2012 SciRes.

It is generally accepted that a dopant level can form above the valence band for the substitutional nitrogen, and below the conduction band for Fe3+ doping, both of which could decrease the band gap of TiO2 and improve the photocatalytic activity in the visible light region [15]. On the other hand, the co-doping of nitrogen and Fe3+ ion inhibits the recombination of the photogenerated electron and hole [16]. The effect of light source on the formaldehyde degradation efficiency is illustrated in Fig. 6. It is clearly observed in the figure that the formaldehyde degradation efficiency of sun light in shade is higher than that of fluorescent irradiation due tothe higer light intensity [17]. Figure 6. The photocatalytic efficiencies of the co-doped TiO2-SiO2 thin films with different of initial formaldehyde concentration.
4. Conclusion The co-doped TiO2-SiO2 thin films were synthesized by
using PTA sol as the TiO2 source. The prepared films showed the average thickness of 394 � 5 nm. The band gap energy of un-doped and co-doped photocatalysts was 3.08 and 2.88 eV, respectively. The co-doping of Fe3+ and N,S ion into TiO2 photocatalysts showed the highest photocatalytic activity of formaldehyde degradation. Under the sunlight in the shade condition, with the initial concentrations of formaldehyde of 1000, 3000 and 5000 ppmV, the efficiencies of formaldehyde degradation were 94.7 %, 89.5% and 85.1 %, respectively. For the fluorescent irradiation, with the same formaldehyde initial concentrations, the photocatalytic activities were 87.4%, 85.3% and 81.5%, respectively. Both iron ions and nitrogen species could lead to a narrowing of the band gap of TiO2. In addition, the co-doping of nitrogen and Fe3+ ion inhibits the recombination of the photogenerated electrons and holes.
5. Acknowledgment The authors gratefully acknowledge the !nancial support
from the Royal Golden Jubilee program and Senior Research Scholar Grant from Thailand Research Fund (TRF) and
National Research University Project of Thailand from the Office of the Higher Education Commission, Thailand.
References�
[1] S. Photong and V. Boonamnuayvitaya, "Preparation and characterization of amine-functionalized SiO2/TiO2 films for formaldehyde degradation," Appl. Surf. Sci., vol. 255, pp. 9311-9315, 2009.
[2] A. Fujishima and X. Zhang, "Titanium dioxide photocatalysis: present situation and future approaches," C.R. Chim., vol. 9, pp. 750-760, 2006.
[3] Y. Yu, J. Wang, and J.F. Parr, "Preparation and properties of TiO2/fumed silica composite photocatalytic materials," Procedia Engineering, vol. 27, pp. 448-456, 2012.
[4] Y. Wu, J. Zhang, L. Xiao, and F. Chen, "Properties of carbon and iron modified TiO2 photocatalyst synthesized at low temperature and photodegradation of acid orange 7 under visible light," Appl. Surf. Sci., vol. 256, pp. 4260-4268, 2010.
[5] X. Yang, "Photo-catalytic degradation of Rhodamine B on C-, S-, N-, and Fe-doped TiO2 under visible-light irradiation," Appl. Catal., B, vol. 91, pp. 657-662, 2009.
[6] B. Ahmmad, Y. Kusumoto, and M.S. Islam, "One-step and large scale synthesis of non-metal doped TiO2 submicrospheres and their photocatalytic activity," Adv. Powder Technol., vol. 21, pp. 292-297, 2010.
[7] B. Tryba, "Increase of the Photocatalytic Activity of TiO2 by Carbon and Iron Modifications," Int. J. Photoenergy, vol. 2008, pp. 2008.
[8] W.-X. Liu, J. Ma, X.-G. Qu, and W.-B. Cao, "Hydrothermal synthesis of (Fe, N) co-doped TiO2; powders and their photocatalytic properties under visible light irradiation," Res. Chem. Intermed., vol. 35, pp. 321-328, 2009.
[9] Z. Liu, Y. Wang, W. Chu, Z. Li, and C. Ge, "Characteristics of doped TiO2 photocatalysts for the degradation of methylene blue waste water under visible light," J. Alloys Compd., vol. 501, pp. 54-59, 2010.
[10] T. Ohno, Z. Miyamoto, K. Nishijima, H. Kanemitsu, and F. Xueyuan, "Sensitization of photocatalytic activity of S- or N-doped TiO2 particles by adsorbing Fe3+ cations," Appl. Catal., A, vol. 302, pp. 62-68, 2006.
[11] X. Sun, H. Liu, J. Dong, J. Wei, and Y. Zhang, "Preparation and Characterization of Ce/N-Codoped TiO2 Particles for Production of H2 by Photocatalytic Splitting Water Under Visible Light," Catal. Lett., vol. 135, pp. 219-225, 2010.
[12] C. Kaewtip, P. Chadpunyanun, and V. Boonamnuayvitaya, "Effect of Co-Dopants in TiO2–SiO2 Thin films on the Formaldehyde Degradation," Water Air Soil Pollut., vol. 223, pp. 1455-1465, 2012.
[13] L. Ge, M. Xu, and H. Fang, "Synthesis of titanium oxide layers on glass substrates with aqueous refluxed sols (RS) and photocatalytic activities," J. Mater. Sci., vol. 42, pp. 4926-4934, 2007.
[14] M. Yao, J. Chen, C. Zhao, and Y. Chen, "Photocatalytic activities of Ion doped TiO2 thin films when prepared on different substrates," Thin Solid Films, vol. 517, pp. 5994-5999, 2009.
[15] X. Cheng, X. Yu, and Z. Xing, "One-step synthesis of Fe-N-S-tri-doped TiO2 catalyst and its enhanced visible light photocatalytic activity," Mater. Res. Bull., vol. pp. in press.
[16] Y. Cong, J. Zhang, F. Chen, M. Anpo, and D. He, "Preparation, Photocatalytic Activity, and Mechanism of Nano-TiO2 Co-Doped with Nitrogen and Iron (III)," J. Phys. Chem. C, vol. 111, pp. 10618-10623, 2007.
Copyright © 2012 SciRes. 43

[17] T. Oyama, "Solar photocatalysis, photodegradation of a commercial detergent in aqueous TiO2 dispersions under sunlight irradiation," Sol. Energy, in press.
�
44 Copyright © 2012 SciRes.
Apatite Deposition on ZrO2 Thin Films by DC Unbalanced Magnetron Sputtering
Arisara Thaveedeetrakul and Virote Boonamnuayvitaya
Department of Chemical Engineering, Faculty of Engineering, KMUTT
Bangkok, Thailand Email: [email protected]
Nirun Witit-anun
Department of physics, Faculty of Science, Burapha University
Chon Buri, Thailand Thailand Center of Excellence in Physics /CHE, Ministry of
Education, Bangkok, Thailand
Abstract—Zirconia thin films deposited on 316L stainless-steel substrate were prepared by DC unbalanced magnetron sputtering from a metallic zirconium target at low temperature with the target-to-substrate distance (dt-s) of 100 mm and sputtering power of 180 W. High purity gas of Ar as the working gas and O2 as the reactive gas were used. The depositions were performed for 120 min at a total pressure of 0.5 Pa. The effect of thermal treatment on the HA formation was investigated. The bioactivity was assessed by investigating the formation of hydroxyapatite (HA) on the surface soaked in simulated body fluids (SBF). Films structure, surface morphology and chemical composition of the ZrO2 films and HA formation were characterized by X-ray diffraction (XRD), scanning electron microscopy (SEM), and FT-IR spectroscopy. The XRD results demonstrate the ZrO2 films are monoclinic phase. The annealed films show the higher film crystalline due to the rearrangement of film structure. After being immersed the samples in SBF, the bone-like apatite was observed on all ZrO2 films, but a denser and more continuous HA layer were observed on annealed films due to the crystallinity of ZrO2 films.
Keywords-component; zirconium dioxide; magnetron sputtering; hydroxyapatite; Simulated body fluid
1. IntroductionThin films of zirconium dioxide (ZrO2) or zirconia are
widely used in protective and thermal barrier coatings [1], optical filter [2], oxygen sensor , microelectronic devices and biocompatibility of bone implants [3-5]. It was considered an attractive ceramic for biomedical application due to its inertness, high strength, corrosion resistance, and fracture toughness. The ZrO2 have three crystalline polymorphs, namely: monoclinic, tetragonal and cubic [6]. Both the monoclinic and tetragonal phases exhibit excellent biocompatibility properties on their surfaces [7].
Bioactivity is widely accepted as the essential requirement for an artificial to exhibit chemical bonding to living tissues upon the formation of a bone-like apatite layer on its surface in any simulated body environment [8].
The formation of a bone-like apatite layer on biomaterials is assumed to be the precondition for their osteoinductivity to induce bone formation on the biomaterials in non-osseous site. The research method of bone-like apatite formation in vitro commonly is to immerse specimen in simulated body fluid (SBF) and hydroxyapatite (HA) layer can be formed on all kinds of bioactive materials [9]. The in vitro tests of zirconium hydrogel coating have found new bone-like apatite layer formation on the surface [7]. Clinical studies of ZrO2 thin films are now expected to be the useful as bone substitutes even under highly loaded conditions such as is found in femoral and knee joint since they exhibit high fracture toughness as well as high bond-bonding ability [10].
There are many methods to prepare the ZrO2 thin films., however, the sputtering technique is a very attractive process for producing metallic oxide with good uniformity at low temperature [11]. This technique has not yet been well studied for the deposition of ZrO2 films with the purpose of the applications mentioned.
In this study, the ZrO2 thin films were deposited by DC unbalanced magnetron sputtering technique followed by the thermal treatments. All samples were immersed in a SBF solution for demonstration the bone-like apatite on the ZrO2 films. The effect of the pretreatment on the formation of the HA was investigated.
2. Experimental Reactive magnetron sputtering, with zirconium target of 54
mm diameter, was used to produce the ZrO2 thin films with the sputtering power of 180 W. The coatings were deposited on 316L-stainless steel type substrate, 10 mm × 10 mm × 1 mm in size. The chemical pretreatment of the substrates was carried out by cleansing with propanol and acetone in ultrasonic bath for 15 min. The sputtering gases argon with a purity of 99.999% and reactive oxygen with a purity 99.999% of which flow rates of 1 and 4 sccm, respectively, were introduced to the chamber separately and controlled by the mass flow controllers (MKS type 247D). The target was sputter cleaned for 15 min at the argon pressure lower than 0.005 Pa to remove impurities from target surface. The dt-s was adjusted to 100 mm and the base pressure of the system was 0.005 Pa. The depositions were performed for 120 min at a
Advances in Materials Physics and Chemistry Supplement: 2012 world Congress on Engineering and Technology
Copyright © 2012 SciRes. 45

total pressure of 0.5 Pa. Some as-deposited ZrO2 films were annealed in air at the temperature of 800$C for 1 h.
The SBF solution that had ionic concentration close to human blood plasma, as shown in Table I, was prepared by dissolving reagent-grade NaCl, NaHCO3, KCl, K2HPO4•3H2O, MgCl2•6H2O, CaCl2, and Na2SO4 in ultra-pure water. The solution was buffered at pH of 7.4 with 1M HCl and tris (hydroxymethyl) aminomethane ((CH2OH)3CNH2) at 37$C. The samples were immersed into solution at 37$C for 7 days. Subsequent to immersion, the samples were removed from the solution, gently rinsed with the ultra-pure water, and then dried at room temperature.
The surfaces of the substrates before and after immersion of SBF solution were analyzed via X-ray diffractometer with a thin-film mode (TF-XRD) adjusted with CuK� radiation. The measured 2 angles were recorded from 20 to 40$ at a step rate 1$min-1. The morphology of the SBF-immersed samples was observed by the scanning electron microscopy (SEM). FT-IR spectroscopy was measured in transmission using the KBr pellet technique.
TABLE I. IONIC CONCENTRATIONS OF SBF IN COMPARISON WITH THOSE OF HUMAN BLOOD PLASMA
Concentration(mM) Blood Plasma SBF
Na+ K+ Ca2+ Mg2+ HCO3
- Cl- HPO4
2- SO4
2-
142.0 5.0 2.5 1.5 27.0
103.0 1.0 0.5
142.0 5.0 2.5 1.5 4.2
147.8 1.0 0.5
3. Result and Discussion A. Deposition of monoclinic ZrO2 and further annealing
It is well known that the sputtered films have lower packing density and annealing improved the packing density and improved crystallinity. X-ray diffraction patterns of the as-deposited and annealed films are shown in Fig. 1. The results also reveal that the as-deposited films are crystalline in nature. The monoclinic phase was formed without any phase mixing (JCPDS file no. 89-9066). The as-deposited and annealed films in Fig. 1 were characterized by three broad peaks with locating at 2 � 28.2$, 34.1$, and 35.3$, indicating the films contain monoclinic phase with the M(111), (002) and (200) orientations, respectively. The existence of pure monoclinic phase at high temperatures observed in the present work is similar to that noticed by Venkataraj et al. [12]. In addition, the ZrO2 thin film with heat treatment in Fig. 1a shows a narrower peak with higher intensity, implying a higher crystallinity, compared with the as-deposited film (Fig. 1b). These results reveal that the quality of ZrO2 film was
improved after annealing. These data indicate significant migration of atoms and thus changes in film atomic structures at high temperatures.
2 Theta20 25 30 35 40
Inte
nsity
M(1
11)
M(0
02)
M(2
00)
(a)
(b)
Figure 1. XRD patterns of the ZrO2 thin films deposited on 316L-SS type substrates: (a) annealing at 800$C and (b) as-deposited.
The mean crystalline size in the ZrO2 films is determined using the well-known Scherrer equation [13] on the basis of ZrO2 peak with higher intensity as shown in Table II. The crystal size calculated from the (111) peak of the annealed film is larger than the as-deposited films due to the increase of the atom and grain boundary mobility in the film [14]. These results reveal that the quality of ZrO2 film was improved after annealing.
TABLE II. FWHM AND CRYSTAL SIZE OF ZIRCONIA THIN FILMS M(111).
Sample FWHM (degrees)
Crystal size (nm)
as-deposited 800$C
0.90 0.59
18.45 28.16
B. HA formation on as-deposited and annealing ZrO2 films
2 Theta20 25 30 35 40
Inte
nsity
HA
(002
)
M(1
11)
HA
(211
)
M(0
02)
(a)
(b)
Figure 2. XRD patterns for the ZrO2 samples tested in SBF for 7 days: (a) annealing at 800$C and (b) as-deposited.
46 Copyright © 2012 SciRes.

The bioactivity of the ZrO2 films was assessed by SBF immersion tests. The samples after incubation in SBF for 7 days were analyzed by XRD to determine the crystal structure of the newly formed layers. Fig. 2 shows the formation of HA peaks as well as the monoclinic ZrO2 peaks for both as-deposited and annealed samples. Two new diffraction peaks at about 25.9$ and 31.8$ can be referred to crystalline apatite according to JCPDS file no. 09-0432. The low intensity and broad peak indicate that the amount of as-grown crystalline apatite on the ZrO2 thin film is small and the crystallinity is low. When the sample was annealed at 800$C, the HA peak became more intense and shaper (Fig. 2a). This may ascribe to dense of HA formation or high crystallinity of HA.
The calcium and phosphate ions required for hydroxyapatite generation on the film surface were derived from the SBF. The result obtained from the present study indicates that Zr-OH groups, abundant on the surface of the thin film, are able to induce apatite nucleation in a similar manner as Si-OH, Ti-OH, and Ta-OH group do. Nevertheless, Uchida et al. [7] found the apatite-forming ability of the gels with tetragonal or monoclinic structure was apparently much higher than that of the gel with amorphous structure. This implies that not all types of Zr-OH groups, but only Zr-OH group with specific arrangements based on tetragonal or monoclinic structure, are effective in inducing apatite nucleation.
(a)
(b)
Figure 3. SEM micrographs of HA formation after soaking in SBF solution for 7 days: (a) as-deposited and (b) annealing at 800$C.
The microstructures of the as-deposited and annealed ZrO2 films after soaked in SBF for 7 days were observed by SEM as shown in Fig. 3. Both the samples can induce hydroxyapatite form on the films surface. The HA particles was island-like and spherically shaped with diameter size about 2 to 3 μm. For the as-deposited sample (Fig. 3a), only a small amount of HA particles formed sparsely scattered on the surface of the sample. The morphology is very similar to that of the deposited apatite on the surface of zirconia gel through biomimetic processing utilizing SBF [7]. However, a denser and more continuous HA layer was observed on annealed films (Fig. 3b). The small HA particle size under the aggregation is about 600 nm in diameter. These results indicate that the annealed ZrO2 films with a high crystallinity are more bioactive compared with low crystallized structure.
In order to confirm the structure of the Ca-P layer, we performed FTIR analysis, as shown in Fig. 4. The phosphate group itself has a tetrahedral symmetry; resulting in four vibrational modes (symmetric stretch (\1) at 958 cm-1; asymmetric stretch (\2) at 430 - 460 cm-1; (\3) at 1041-1090 cm-1; (\4) at 575 - 610 cm-1) [15]. An OH- absorption peak at 3440 cm-1 can be seen in the spectra. The absorption peak at 1635 cm-1 can be assigned to absorbed H2O groups, which is a common characteristic of precipitates in aqueous solutions [16]. Furthermore, peaks between 1400 - 1450 cm-1 are due to the C�O stretching of CO3
2- groups, which indicate that the apatites formed on the ZrO2 thin films are bone-like carbonate-containing apatite [16].
Copyright © 2012 SciRes. 47

[5] X. Liu, A. Huang, C. Ding, P.K. Chu, Bioactivity and cytocompatibility of zirconia (ZrO2) films fabricated by cathodic arc deposition, Biomaterials, vol. 27, pp. 3904-3911, 2006.
Wavenumber (cm-1)60012001800240030003600
Tran
smis
sion
(%)
H2OCO3
2-
PO43-
PO43-
OH-
CO32-
[6] A.M. Alper, High Temperature Oxide Part II: Oxides of Rare Earths, Titanium, Zirconium, Hafnium, Niobium and Tantalum, Academic Press, New York, 1970.
[7] M. Uchida, H.-M. Kim, T. Kokubo, K. Tanaka, T. Nakamura, Structural dependence of apatite formation on zirconia gels in a simulated body fluid, J. Ceram. Soc. Jpn., vol. 110, pp. 710-715, 2002.
[8] T. Kokubo, Bioceramics and their Clinical Applications, Woodhead, England, 2008.
Figure 4. FT-IR spectra of HA formed on the samples in SBF for 7 days.
4. Conclusion Zirconium dioxide thin films of monoclinic phase have
been deposited by DC unbalanced magnetron sputtering and the film was subjected to thermal treatment. The annealed films show the higher film crystalline due to the rearrangement of film structure. After being immersed the samples in SBF, the bone-like apatite was observed on all ZrO2 films, but a denser and more continuous HA layer was observed on annealed films due to the crystallinity of ZrO2 films. These results show that the sputtered ZrO2 thin films exhibit good bioactivity.
[9] T. Kokubo, H. Takadama, How useful is SBF in predicting in vivo bone bioactivity?, Biomaterials, vol. 27, pp. 2907-2915, 2006.
[10] C. Piconi, G. Maccauro, Zirconia as a ceramic biomaterial, Biomaterials, vol. 20, pp. 1-25, 1999.
[11] Anderson, Sputtering by particle bombardment. I. Physical sputtering of single element solids, Springer-Verlag Berlin and Heidelberg GmbH & Co. K 1982.
[12] S. Venkataraj, O. Kappertz, C. Liesch, R. Detemple, R. Jayavel, M. Wuttig, Thermal stability of sputtered zirconium oxide films, Vacuum, vol. 75, pp. 7-16, 2004.
5. Acknowledgment This work was supported by the Royal Golden Jubilee of
Thailand Research Fund and the Department of Chemical Engineering at King Mongkut’s University of Technology Thonburi.
[13] B. D. Cullity, S.R. Stock, Elements of X-Ray Diffraction, third ed., Prentice Hall, New Jersey, 2001.
REFERENCES [14] M.M. Larijani, D. Najafi, M. Eshghabadi, The effect of oxidation temperature on the nano crystalline structure of ZrO2 films deposited on silicon and glass substrates, Crystal Research and Technology, vol. 46, pp. 956-960, 2011.
[1] B. Leclercq, R. Mévrel, V. Liedtke, W. Hohenauer, Thermal conductivity of zirconia-based ceramics for thermal barrier coating, Materialwissenschaft und Werkstofftechnik, vol. 34, pp. 406-409, 2003. [15] G.S. Kumar, E.K. Girija, A. Thamizhavel, Y. Yokogawa,
S.N. Kalkura, Synthesis and characterization of bioactive hydroxyapatite–calcite nanocomposite for biomedical applications, J. Colloid Interface Sci., vol. 349, pp. 56-62, 2010.
[2] Q. Zhang, X. Li, J. Shen, G. Wu, J. Wang, L. Chen, ZrO2 thin films and ZrO2/SiO2 optical reflection filters deposited by sol–gel method, Mater. Lett., vol. 45, pp. 311-314, 2000.
[16] D. Chen, E.H. Jordan, M. Gell, M. Wei, Apatite formation on alkaline-treated dense TiO2 coatings deposited using the solution precursor plasma spray process, Acta Biomater., vol. 4, pp. 553-559, 2008.
[3] M. Uchida, H.-M. Kim, F. Miyaji, T. Kokubo, T. Nakamura, Apatite formation on zirconium metal treated with aqueous NaOH, Biomaterials, vol. 23, pp. 313-317, 2002.
[4] J. Chevalier, What future for zirconia as a biomaterial?, Biomaterials, vol. 27, pp. 535-543, 2006.
48 Copyright © 2012 SciRes.

Low Temperature Electrical Transport in Double Layered CMR Manganite La1.2Sr1.4Ba0.4Mn2O7
Y.S. Reddy Department of Physics
Chaitanya Bharathi Institute of Technology, Gandipet Hyderabad, India
P. Kistaiah and C. Vishnuvardhan Reddy* Department of Physics
Osmania University Hyderabad, India
Abstract—The electrical transport behavior and magnetoresistance (MR) of a polycrystalline double layered manganite La1.2Sr1.4Ba0.4Mn2O7, synthesized by the sol-gel method, are investigated in the temperature range 4.2 K - 300 K. The sample exhibits an insulator-to-metal transition at 87 K (TIM) and the spin-glass (SG)-like behavior is observed below 50 K (TSG). The transport behavior is analyzed in the entire temperature range considering three different regions: paramagnetic insulating region (T>TIM), ferromagnetic metallic region (TSG<T<TIM) and antiferromagnetic insulating region (T<TSG) by fitting the temperature dependent resistivity data to the equations governing the conduction process in the respective temperature regions. The results show that the conduction at T>TIM follows Mott variable range hopping (VRH) process, while the two-magnon scattering process is evidenced at TSG<T<TIM which is suppressed with the applied magnetic field of 4 T. The low temperature conductivity data are also fitted with Mott VRH equation. The sample exhibits a large MR (�45%) over a temperature range 5 K – 50 K and it shows �32% MR at 5 K with a magnetic field of 0.5 T.
Keywords-Layered manganite; Magnetoresistance; Transport behavior; Variable range hopping; Magnon scattering
1. IntroductionThe discovery of colossal magnetoresistance (CMR) in La-
based double layered (DL) manganites La2-2xSr1+2xMn2O7 has provided an opportunity to explore the interaction among spin, charge and lattice in reduced dimensions [1,2]. These materials show large values of MR at moderate magnetic fields and proved to be promising materials for many technological applications. The (La,A)3Mn2O7 (A = Sr, Ca, Ba) perovskite compound with layered structure consists of the MnO2 bilayers which are respectively separated by the rock-salt-type (La,A)2O2 layers along c-axis [3]. Because of its structural anisotropy, it is expected to present the anisotropy of physical, electrical and magnetic properties. Further, the natural array of conducting ferromagnetic/non-magnetic insulating/conducting ferromagnetic junctions present in the structure of these materials may lead to large CMR at low magnetic field, i.e., low field magnetoresistance [4]. Because of the reduced dimensionality, the balance between ferromagnetic double exchange ((FM-DE) and
antiferromagnetic superexchange (AFM-SE) interactions between Mn ions is more subtle [5,6]. Therefore, one can expect that the slight changes in the size and/or concentration of (La,A) site ions can show significant effect on bulk transport and magnetic properties. Further, the Mn-O-Mn bond angle is about 180° in the (La,A)3Mn2O7 system and is about 155–170° in (La,A)MnO3 system. The bond-length can be altered by the internal pressure, i.e., by changing the size and/or concentration of (La,A) site ions, however, the variation of the Mn-O-Mn bond-length in Mn2O7 system is different from that in MnO3 system [7,8]. Therefore, the study of lattice effects on the magnetotransport properties in the (La,A)3Mn2O7 system might be useful in understanding the fundamentals of the CMR and its related properties.
We have prepared some DL manganite samples with different doping elements (Ca2+, Ba2+) at Sr2+ site with different doping levels with an aim to increase MR and TIM (insulator-to-metal transition temperature) and also to investigate the transport phenomena in these materials. In this paper, we present the results obtained for La1.2Sr1.4Ba0.4Mn2O7 which exists in three different regions: paramagnetic insulating region, ferromagnetic metallic region and antiferromagnetic insulating region in the temperature range 4.2 K – 300 K with a main focus on its transport behavior.
2. ExperimentHigh pure powders of La2O3, MnCO3, Sr(NO3)2 and
Ba(NO3)2.4H2O, in stoichiometric proportions, were used to obtain the nominal composition of La1.2Sr1.4Ba0.4Mn2O7. La2O3 and MnCO3 were converted into nitrates prior to use. All the nitrates were dissolved in the citric acid solution and then the pH was adjusted to 6 with ammonia solution. After getting the water evaporated from the solution, ethylene glycol was added to it and heated at about 90oC until a gel-type solution is formed. The gel was dried at 150oC and then decomposed at 250oC in air for 2 h to decompose nitrates and all organic materials. The resultant ash was ground to get a fine homogeneous powder. The powder was calcinated in air 1100oC for 10 h and then pressed into circular pellets. The pellets were finally sintered in air at 1400oC for 6 h.
The structural characterization was carried out by X-ray diffraction using X- pert pro system, M/S Pananlytical ( = 1.54056 Å) in the 2 range 20$ - 80$ with step size 0.01$ and a count time of 0.6 s per step. The results of powder X-ray diffraction suggest the formation of single phase with body-
Advances in Materials Physics and Chemistry Supplement: 2012 world Congress on Engineering and Technology
Copyright © 2012 SciRes. 49

centered tetragonal structure (space group: I4/mmm). The electrical resistivity at different applied magnetic fields (H = 0 T, 1.5 T and 4 T) is measured by standard four-probe method over the temperature range 4.2 K–300 K with the use of a superconducting magnet system of Oxford.
The conduction mechanism in PM semiconducting/insulating region in manganites is usually explained by four models: They are: (i) semiconduction (SC) model described by Arrhenius equation ^ = ^0exp(Ea/kBT) [9], (ii) nearest neighbor small polaron hopping (SPH) model described by ^ = ^0Tnexp(Ep/kBT), where n = 1 for adiabatic
hopping [10] and n = 1.5 for non-adiabatic hopping [11], (iii) Mott type of VRH model described by ^ = ^_Tnexp(T0/T)p, where p = 1/(d+1), d being the dimensionality of the system [12,13] and (iv) Efros-Shkloskii (ES) type of VRH model described by [14]. The value of characteristic temperature (T0) in Mott VRH model is given by 24/{LdkBN(EF), where L is localization length of trapped charge carriers (here, L = 10-10
m), N(EF) is density of the localized states at Fermi level and d is the dimensionality of the system. The Coulomb interaction in hopping regime which produces a gap in electronic density of states (DOS) is responsible for ES VRH type of conduction mechanism, whereas Mott VRH arises when such gap is filled. Each model predicts a different temperature dependence of the resistivity and fits the resistivity data in different temperature ranges.
3. Results and Discussion The temperature (T) dependent electrical resistivity (^) of
the sample at different magnetic fields is shown in Fig. 1. As the temperature is decreased from 300 K, the resistivity of the sample increases and reaches maximum at 87 K which is known as insulator-to-metal transition temperature (TIM). As the temperature is further lowered from TIM, an upturn of resistivity is observed at �50 K which is termed as spin-glass (SG)-like transition temperature (TSG) [7,8]. The SG-like behavior is attributed to the competing intra-bilayer FM-DE and inter-bilayer AFM-SE interactions which usually coexist in quasi 2D bilayer manganites and become dominant at low temperatures. When magnetic field is applied, TIM shifts to higher temperatures whereas SG-like transition region gets broadened due to the suppression of magnetic fluctuations with the applied magnetic field.
The sample exists in three different states at different temperatures and hence to explain the nature of conduction mechanism of the sample, the temperature dependent electrical resistivity data are analyzed in the in the entire temperature range (4.2 K - 300 K) in three different temperature regions: (i) paramagnetic (PM) insulating region (T>TIM), (ii) ferromagnetic (FM) metallic region (TSG<T<TIM) and (iii) antiferromagentic (AFM) insulating region (T<TSG).
Figure 1. Temperature dependent Electrical resistivity and MR plots of La1.2Sr1.4Ba0.4Mn2O7.
A. Conduction Mechanism at T>TIM
Figure 2. Plots of ln ^ - T-1/4 and ln ^ - T-1/3 for La1.2Sr1.4Ba0.4Mn2O7. The
solid lines give the best fits to Mott 2D and 3D VRH models.
In the present study, the ^-T data are analyzed by fitting the data to all the equations mentioned above. The ^-T data do not fit well to the equations of SC and SPH models; ES VRH gives reasonably good fittings, but the best fittings are obtained with Mott VRH model over a wide temperature range (Fig. 2). The Mott 2D and 3D VRH models give almost indistinguishable fittings for drawing any conclusion about dimensionality dependence, however, the results clearly point towards Mott type of VRH conduction mechanism in PM insulating region (T>TIM). The best fit parameters obtained with Mott 2D and 3D VRH models are listed in Table I and they are in good agreement with the previous reports on similar DL manganites [15,16]. The decrease in the values of T0 and the increase in the values of N(EF) with the magnetic field is due to the suppression of magnetic domain scattering with applied magnetic field.
TABLE I. THE BEST FIT PARAMETRES OBTAINED FROM MOTT 2D AND 3D VRH MODEL FITTINGS
Mott 3D VRH Mott 2D VRH H
(T)�0
(� cm) T0
(K) N(EF)
(eV-1cm-3) �0
(� cm) T0
(K) N(EF)
(eV-1cm-2)
50 Copyright © 2012 SciRes.

0 4
8.3×10⁻⁵ 4.5×10⁻⁴
1.6×10⁷ 1.0×10⁷
5.4×10²¹ 8.8×10²¹
4.7×10⁻³ 1.5×10⁻²
4.3×10⁵ 3.0×10⁵
2.1×10¹⁵
2.9×10¹⁵
B. Conduction Mechanism at TSG<T<TIM
The electron transport mechanism in the FM metallic region is usually understood by fitting the resistivity data to a general Zener-Double Exchange polynomial law ^ = ^0 + ^2T2 + ^nTn, where ^0 is the residual resistivity and is independent of temperature, ^2 is the resistivity contributed by electron-electron and electron-phonon scattering mechanisms and ^n is the resistivity coefficient corresponding to n, which takes values from 2.5 to 7.5 [14,17]. The value of n is included by taking spin fluctuations into account. Further, the low value of n (<4.5) corresponds to one-magnon scattering process, whereas the high value of n (|4.5) corresponds to two-magnon scattering process.
The transport behavior at T<TIM in polycrystalline bilayer manganites has not been studied much unlike the transport mechanism at T>TIM in layered manganites. Zhang et al. [6] found T9/2 dependence in single crystals of La1.2Sr1.8Mn2O7, but they did not include ^2T2 term. Therefore, an attempt is made to explore the nature of transport behavior at TSG<T<TIM in the present DL manganite sample.
In the absence of magnetic field, the FM metallic region is very small and hence we fitted the ^-T data (H = 1.5 T, 4 T) in the temperature region 45 K – 95 K with Zener DE polynomial law (Fig. 3). The ^-T data (H = 1.5 T) are well fitted with Zener DE polynomial law for n = 4.5 indicating the two-magnon scattering contribution to the conductivity along with electron-electron and electron-phonon scattering mechanisms. The ^-T data (H = 4 T) are nicely fitted with ^ = ^0 + ^2T2 suggesting the suppression of spin fluctuations with the magnetic field and the conduction in this region is mainly due to electron-electron and electron-phonon interactions [14]. The obtained best-fit parameters are: ^0 = 2826.11 } cm, ^2 = 0.0365 } cm K-2 and ^4.5 = 3.84 × 10⁻⁹ (H = 1.5 T) and ^0 = 2272.80 } cm, ^2 = 0.0369 } cm K-2 (H = 4 T). The applied magnetic field can decrease the magnetic domain boundary and therefore ^0 decreases.
Figure 3. Temperature versus resistivity plots of La1.2Sr1.4Ba0.4Mn2O7. The solid lines give the best fits to ^ = ^0 + ^2T2 + ^4.5T4.5 (H = 1.5 T) and
^ = ^0 + ^2T2 (H = 4 T)
C. Conduction Mechanism at T<TSG
The low temperature upturn of resistivity is a typical characteristic of DL manganites. The transport behavior of bilayer manganites in AFM insulating region (T<TSG) is very interesting and worthy of study. Zhu et al. [18] have found the band transport process, Zhang et al. [6] have showed that conductivity is proportional to T1/2 and Zhang et al. [19] fitted the upturn of resistivity using Mott VRH equation in similar DL manganites.
To explore the nature of conduction mechanism in AFM insulating phase, the �-T data at T<TSG are fitted to all the equations mentioned in section 3.A. and T1/2 dependence of conductivity is also examined. The T1/2 dependence of conductivity is a characteristic of weak localization effects in 3D disordered metals and indicate the contribution of electron-electron interactions to the conductivity. The best fittings are obtained with Mott VRH suggesting that the conduction at T<TSG is also governed by Mott VRH law (Fig.4). Here also, Mott 2D VRH and Mott 3D VRH equations give almost indistinguishable fittings and hence it is difficult to draw any
conclusion about dimensionality dependence. Figure 4. Plots of ln ^ - T-1/4 and ln ^ - T-1/3 for La1.2Sr1.4Ba0.4Mn2O7. The
solid lines give the best fits to Mott 2D and 3D VRH models.
D. Magnetoresistance In Fig.1, the right panel shows the variation of MR
(H = 4 T) with temperature. The MR - T curve displays no peak at TIM unlike the peak displayed at TIM by resistivity curves and this is a special feature of DL manganites [7,8]. The sample shows �40% MR at its TIM and the maximum MR is �50% at �20 K. It is noteworthy that the sample exhibits �45% MR in the temperature range 5 K – 50 K. This property of exhibiting CMR effect over a wide temperature region supplies the potential applications for layered perovskites.
Copyright © 2012 SciRes. 51

The variation of MR with applied magnetic field at 5 K and 90 K is shown in Fig. 5. The increase of MR with magnetic field is rapid at 5 K than that at 90 K which suggests that the suppression of magnetic frustration and spin scattering with applied magnetic field is more in SG-like region than that near the vicinity of TIM. The striking feature from these curves is that the sample shows � 32% MR at 5 K with applied magnetic field of 0.5 T which is indeed a sign of low field
magnetoresistance.
[3] T. Kimura, Y.Tomioka, H. Kuwahara, A. Asamitsu, M.Tamura, and Y.Tokura, “Interplane tunneling magnetoresistance in a layered manganite crystal”, Science, vol. 274, pp. 1698 – 1701, December 1996.
[4] Hong Zhu, XianMing Liu, KeQing Ruan, and YuHeng Zhang, “Magnetic inhomogeneity and variable-range hopping transport at temperatures above the ferromagnetic transition in La1.4Sr1.6Mn2-yTiyO7 system”, Phys. Rev. B,vol. 65, pp. 104424 (1-7), February 2002.
[5] E. O. Chi, Y.-U. Kwon, J.-T. Kim, and N. H. Hur, “Lattice effects on the magnetic and transport properties in La1.4Sr1.6-xAxMn2O7 (A = Ca, Ba)”, Solid State Commun., vol. 110, pp. 569, 1999.
[6] S. Okamoto, S. Ishihara, and S. Maekawa, “Orbital structure and magnetic ordering in layered manganites: Universal correlation and its mechanism”, Phys. Rev. B, vol. 63, pp. 104401 (1-6), February 2001.
[7] C. L. Zhang, X. J. Chen, C. C. Almasan, and J. S. Gardner, J. L. Sarrao, “Low-temperature electrical transport in bilayer manganite La1.2Sr1.8Mn2O7”, Phys. Rev. B, vol. 65, pp. 134439 (1-6), March 2002.
[8] S. Chatterjee, P. H. Chou, C. F. Chang, I. P. Hong, and H. D. Yang, “Lattice effects on the transport properties of (R,Sr)3Mn2O7 (R = La, Eu, Pr)”, Phys. Rev. B, vol. 61, pp. 6106 – 6113, March 2000.
[9] H. Zhu, D. Zhu, and Y. Zhang, “Effect of lattice expansion on the magnetotransport properties in layered manganites La1.4Sr1.6-yBayMn2O7”, J. Appl. Phys., vol. 92, pp. 7355 – 7361, December 2002.
[10] S. B. Ogale, V. Talyansky, C. H. Chen, R. Ramesh, R. L. Green, and T. Venkatesan, “Unusual electric field effects in Nd0.7Sr0.3MnO3”, Phys. Rev. Lett., vol. 77, pp. 1159 – 1162, August 1996.
[11] G. Jeffrey Snyder, R. Hiskes, S. Dicarolis, M. R. Beasley, and T. H. Geballe, “Intrinsic electrical transport and magnetic properties of La0.67Ca0.33MnO3 and La0.67Sr0.33MnO3 MOCVD thin films and bulk material”, Phys. Rev. B, vol. 53, pp. 14434 – 14444, June 1996.
[12] M. Jaime, H.T. Hardner, M.B. Salamon, M. Rubinstein, P. Dorsey, and D. Emin, “Hall-effect sign anomaly and small-polaron conduction in (La1-xGdx)0.67Ca0.33MnO3”, Phy. Rev. Lett., vol. 78, pp. 951-954, February 1997. Figure 5. The variation of MR with appline magnetic field for
La1.2Sr1.4Ba0.4Mn2O7.
4. ConclusionsIn conclusion, a DL manganite sample
La1.2Sr1.4Ba0.4Mn2O7 is investigated with respect to its MR and electrical transport behavior in the temperature range 4.2 K - 300 K. The conduction process at T>TIM is due to Mott VRH process and the metallic conduction is contributed by electron-electron scattering and two-magnon scattering at low magnetic fields and at higher fields magnon scattering mechanism is disappeared. The conductivity in SG-like region is also governed by Mott VRH process. The property of exhibiting large MR over a wide temperature range and low field magnetoresistance are found in this sample.
[13] M. Viret, L. Ranno, and J. M. D. Coey, “Colossal magnetoresistance of the variable range hopping regime in the manganites”, J Appl. Phys., vol. 81, pp. 4964 – 4966, April 1997.
[14] Yu Wang and Jorge J. Santiago-Aviles, “Large negative magnetoresistance and strong localization in highly disordered electrospun pregraphitic carbon nanofiber”, Appl. Phys. Lett., vol. 89, pp. 123119 (1-3), September 2006.
[15] D. S. Rana, C. M. Thaker, K. R. Mavani, D. G. Kuberkar, Darshan C. Kundaliya, and S. K. Malik, “Magnetic and transport properties of (La0.7-2xEux)(Ca0.3Srx)MnO3: Effect of simultaneous size disorder and carrier density”, J. Appl. Phys., vol. 95, pp. 4934 - 4940, May 2004.
[16] M. Matsukawa, M. Chiba, E. Kikuchi,R. Suryanarayanan, M. Apostu, S. Nimori, K. Sugimoto, and N. Kobayashi, “Effect of suppression of local distortion on the magnetic, electrical, and thermal transport properties of the Cr-substituted bilayer manganite LaSr2Mn2O7”, Phys. Rev. B, vol. 72, pp. 224422 (1-8), December 2005.
[17] M. H. Ehsani, P.Kameli, and M. E.Ghazi, “Influence of grain size on the electrical properties of the double-layered LaSr2Mn2O7 manganite”, J. Phys. Chem. Sol., vol. 73, pp. 744–750, 2012. 5. Acknowledgment
The authors are thankful to the centre director, UGC-DAE Consortium for Scientific Research, Indore, for providing experimental facilities.
[18] Aritra Banerjee, S. Pal, and B. K. Chaudhuria, “Nature of small-polaron hopping conduction and the effect of Cr doping on the transport properties of rare-earth manganite La0.5Pb0.5Mn1-xCrxO3”, J. Chem. Phys., vol. 115, pp. 1550-1558, July 2001.
[19] Hong Zhu, XiaoJun Xu, Li Pi, and YuHeng Zhang, “ Two-dimensional magnetic correlation and transport behavior of layered manganite La1.4Sr1.6Mn2-xCuxO7”. Phys. Rev. B, vol. 62, pp. 6754-6760, September, 2000.
REFERENCES[1] Y. Moritomo, A. Asamitsu, H. Kuwahara, and Y. Tokura, “Giant
magnetoresistance of manganese oxides with a layered perovskite structure”, Nature (London), vol. 380, pp. 141-144, March 1996.
[20] R. L. Zhang, W. H. Song, Y. Q. Ma, J. Yang, B. C. Zhao, Z. G. Sheng, J. M. Dai, and Y. P. Sun, “Influence of Co doping on the charge-ordering state of the bilayered manganite LaSr2Mn2O7”, Phys. Rev. B., vol. 70, pp. 224418 (1-6), December 2004.
[2] Y. Moritomo, A. Asamitsu, H. Kuwahara, and Y. Tokura, “Giant magnetoresistance of manganese oxides with a layered perovskite structure”, Nature (London), vol. 380, pp. 141-144, March 1996.
52 Copyright © 2012 SciRes.

The minimum energy principle in descriptionof nonlinear properties of orthotropic material
Tadeusz WEGNER Applied Mechanics Institute
Poznan University of Technology Poznan, Poland
e-mail address: [email protected]
Dariusz KURPISZ Applied Mechanics Institute
Poznan University of Technology Poznan, Poland
e-mail address: [email protected]
Abstract — In this paper the conception of theoretical determine the relations between material experimental characteristics is presented. On the base of stress-strain relations for nonlinear elastic anisotropic material and geometrical interpretation of deformation state, the general form of strain energy density function was introduced. Using this function and variational methods the relations between material characteristics were achieved. All considerations are illustrated by a short theoretical example.
Keywords – material characteristics; mechanical properties; deformation state components; strain energy density function; minimum energy principle; variational methods
1. IntroductionOne of the most important nature laws is the minimum
energy principle. Thought of this principle each physical match tends at minimization of its energetic state. So in the case of material the configuration of deformation state must satisfy the principle of minimum of energy. Because the discussed law introduces relations between deformation state components, the material characteristics must be mutually coherent. On important rule of energy, as a tool to description of material mechanical properties, call attention Ogden [1], Perzyna [2], [3], Petryk [4], [5], [6], Schroder [7], Wagner [8], Wegner [9] and other. The main aim of this paper is construction mathematical relations between material mechanical characteristics due to minimum of energy principle. For affirmation of generality of considerations the nonlinear elastic orthotropic material will be used.
2.Geometrical Interpretation of Deformation State and Strain Energy Density Function
The deformation of material requires the work of external load. Direct answer of material for application of external load program is the stress. Its value is dependent on load magnitude, deformation state and individual properties of material. So the relations between stress and strain (there be measure of deformation) are different for different materials. Connecting factors of strain and stress components are material
characteristics. These relations for nonlinear elastic orthotropic material can be written as
���
�
���
�
�
���
���
��
,
,)()(
)()(
)(
)()(
)()()(
,)(
)()(
)()(
33
3
22
2232
11
11313
33
3323
22
2
11
11212
33
3313
22
2212
11
11
!�
!�
!!�
!!
!�
!!
�!�
!!
!�
!!
�!
!�
!
EEv
Ev
Ev
EEv
Ev
Ev
E
(1)
where 321 ,, ��� and 321 ,, !!! are respectively principal stress
and strain components. i
iidef
iiE !(!!� )()
.
for 3,2,1 i and
j
idef
jijv!!
!.
)( for 3,2,1, ji " and are experimental
material characteristics obtained in uniaxial tension tests. As we can see the full description of material requires an experimental assignment of nine characteristics. There is oppressive for realization. Hence it is proper to search for dependences among them.
ji
A. Geometrical Interpretation of Deformation State Let’s assume that the external load program is such, that the
orthotropy directions and principal deformation directions are the same. Next separate the material piece in shape a cube, that edges are parallel to principal orthotropy directions. The deformation process of this elementary cube was illustrated below.
Advances in Materials Physics and Chemistry Supplement: 2012 world Congress on Engineering and Technology
Copyright © 2012 SciRes. 53

Figure 1. Interpretation of deformation state
Every deformation state response a point on deformation path C. On the end of this path we have a desired deformation state KKK ,, !!! . The motion along path C is initiated by changeable stress components. So every displacement along path C needs work.
321
B. Strain Energy Density Function The deformation work L can be expressed by the use of line
integral in the form
# $
C i idiL
3
1!� (2)
Because the space of deformation components is potential the deformation work is independent from the shape of deformation path C. So we can write
(3) %&'��
��
�
1,0 where.,,
33
22
11
tttt
CK
K
K
!!!!!!
and hence by the use of (2)
#$
1
0
3
1321321 ),,(),,( dttttW
i
Ki
KKKi
KKK !!!!�!!! (4)
where ),,( 321 !!!� i is the solution of system of equations (1). The strain energy W is a function of deformation state components.
3. The Principle of Minimum Energy Because the solution of system of equations (1) can be
write in the form
)...,,()( 3212 vvFE iiii ( !� (5)
for then the equation (4) can be written as ,3,2,1 i
#$
1
0
3
1232212321 ))(),...,(()(),,( dttvtvFtEW
i
Ki
KKi
Kii
KKK !!!!!!! . (6)
The right side of equation (6) is a functional due to functions )( iiE ! and )( jijv ! . Hence the detection of minimum of energy is equivalent the determination of minimum of functional (6). Let’s put that
. .(7)))(),...,(()(),...,,,,(3
12322123212321 $
i
Ki
KKi
Kii tvtvFtEvvEEEF !!!!
If (6) has a minimum, then the following assumptions must be satisfied
0 III)-I(3i1
))
*++
iEF , (8)
. and,3,2,1, for0 IX)-IV( jijivF
ij
" )) (9)
The equations (8) and (9) introduce (on the base of minimum of energy), the relations between material mechanical characteristics. So if single or twice indexed material characteristics are known then the determination of the next characteristics is possible.
4. An Example Let’s assume, that we have nonlinear elastic isotropic
material under flat state of stress (in plane 1O2). In such case the material physical properties are the same in all directions. It means that there are two material characteristics. Because the component of stress state in third direction is equal zero ( 03 � ), the deformation path C can be given as
%&'���
1,0 for:22
11 ttt
C K
K
!!!!
(10)
and the system of equation (1) reduces to
���
���
�
�(�
(
�(�
(
.)()(1)()(
,)()(1)()(
21
11222
21
22111
tvtvtvtttE
tvtvtvtttE
KK
KKKK
KK
KKKK
!!!!!
!�
!!!!!
!� (11)
The relation (6) simplifies to (12)
# �(�
��
(�
1
02
21
11221
21
221121 ]
)()(1)()(
)()(1)()([),( dt
tvtvtvtttE
tvtvtvtttEW K
KK
KKKKK
KK
KKKKKK !
!!!!!
!!!!!!!
!!!
Let’s take the function )(!E as known. The perturbation of functional (12) is possible due to functions and
. So on the base of assumptions (8) and (9) we have )( 1 tv K!
)( 2 tv K!
Identify applicable sponsor/s here. (sponsors)
54 Copyright © 2012 SciRes.

,0)]()(1[
)(])()()([0)( 2
21
22122211
1
�
(��,
))
tvtvtvtttEtvtE
tvF
KK
KKKKKKKK
K !!!!!
!!!!!!
(13)
,0)]()(1[)()]()()([0
)( 221
11212211
1
�
(��,
))
tvtvtvtttvtEtE
tvF
KK
KKKKKKKK
K !!!!!
!!!!!!
(14)
Because
2
12
1
21 )(and)(
!!
!!!
! � � vv , (15)
the conditions (13) and (14) can be written as
,0)()(1
)()()()(
21
1221 �
�!!
!!!!vv
vEvE (16)
or
)()(
)()(
2
1
2
1
!!
!!
EE
vv
. (17)
For nonlinear materials the relations (15) are the definition of transversal strain coefficient, analogous to classical Poisson ratio definition in linear theory. The condition (17) between transversal strain and changeable stiffness coefficients is a coherence condition for material characteristics of nonlinear isotropic materials, as a consequence of the minimum energy principle.
5. ConclusionsRelations between material characteristics results from
minimum energy principle. The strain energy density function
can be treated as functional of materials characteristics. The solution of system of equations (8), (9) is not trivial in case if we know at least one characteristic.
REFERENCES
[1] R.W. Ogden, “Non-linear elastic deformations” Dover Publications, Mineola, New York 1997.
[2] P. Perzyna, “Coupling of dissipative mechanisms of viscoplastic flow“ Arch. Mechanics 29, 1977, pp. 607-624.
[3] P. Perzyna, “The thermodynamical theory of elasto-viscoplasticity“ Engineering Transactions 53, 2005, pp. 235-316.
[4] H. Petryk, “On the second-order work in plasticity” Archives of Mechanics, 37. Warszawa 1985, pp. 503-520.
[5] H. Petryk, “The energy criteria of instability in the time-independent inelastic solids” Archives of Mechanics, 43. 4. Warszawa 1991, pp. 519-545.
[6] H. Petryk, “On stability and symmetry conditions in time independent plasticity” Archives of Mechanics, 43. 2 -3. Warszawa 1991, pp. 377-397.
[7] J. Schroder, P. Neff, “Invariant Formulation of Hyperelastic Transverse Isotropy Based on Polyconvex Free Energy Functions” International Journal of Solids and Structures, Vol. 40, 2003, pp. 401-445.
[8] D.R. Wagner, J.C. Lotz, “A non-linear anisotropic strain energy function for the annulus fibrosus” San Francisco: Orthopaedic Research Society; 2001.
[9] T. Wegner, D. Kurpisz “Phenomenological modeling of mechanical properties of metal foam” Journal of Theoretical and Applied Mechanics JTAM (in press).
Copyright © 2012 SciRes. 55

Synthesis of Aluminum-doped Zinc Oxide Nanowireshydrothermally grown on plastic substrate
Concepción Mejía García, Elvia Díaz Valdés, Ana Ma.Paniagua Mercado, Arturo F. Méndez Sánchez,Departamento de Física, Escuela Superior de Física yMatemáticas – IPN, Edif. 9 UPALM Col. San Pedro
Zacatenco, Deleg. GAM, México 07738 Mé[email protected]
José A. Andraca AdameCentro de Nanociencias y Micro y Nanotecnologías del IPN
UPALM, Luis Enrique Erro S/N, México 07738 México
Velumani Subramaniam, Josué Romero IbarraDepto. de Ing. Eléctrica, Sección de Estado Sólido, Av. IPNNo. 2508 Col. San Pedro Zacatenco, México 07360 México
Abstract—We report the synthesis of undoped ZnO and Al-doped ZnO (ZnO:Al) nanowires grown using a two-stepprocess: (a) preparation of the seed layer, and (b) growth ofthe nanostructures. In the first step, 10 mM solutions of zincacetate dihydrate and 1-propanol were spin coated onpolyethylene terephthalate (PET) substrate at 2000 rpm by 30s. Vertical nanowires were then grown by dipping thesubstrates in an equimolar solution of zinc nitrate hexahydrateand hexamethylenetetramine. As doping source, aluminumnitrate nonahydrate powders were added in the solution. In thesolutions, Al doping concentrations were established as 0.5 At%, 1.0 At %, 2.0 At % and 3.0 At %, respectively. Thehydrothermal process were carried out with a commerciallymicrowave at 140 W power setting. The nanowires werecharacterized optically and morphologically. XRD patternsshow the presence of ZnO, Zn(OH)2 and Zn6Al2O9. Scanningelectron microscopy analysis showed that the size of ZnOnanowires was 50 nm in diameter. The undoped ZnO andZnO:Al nanowires bandgap energy was obtained from opticaltransmission spectra.
Keywords- Nanowires, ZnO, ZnO:Al nanowires, spincoating, hydrothermal process.
1. IntroductionZnO is a promising material in the field of short
wavelength optoelectronics due to its wide and direct bandgapof 3.37 eV at room temperature [1]. Nanostructures based onthis semiconductor offer the benefit of material quality leadingto improved device efficiency such as UV nanolasers, fieldeffect transistors and solar cell electrodes [2-3]. Doping ZnOis an effective method in order to modify the physicalproperties. The ZnO:Al nanowire arrays are capable ofreaching the highest conductivity without deterioration inoptical transmission and cristallinity, and thus are promisingcandidates for field emision displays. ZnO:Al nanostructureshave been prepared by different methods (e. g. pulse laser
deposition and magnetron sputtering) and investigated theeffect of the Al doping concentrations on the structure.However these methods require complex procedures like hightemperatures or vacuum.
The hydrothermal ZnO nanowire synthesis has advantagesover the methods mentioned previously. Nevertheless, thetime required for the synthesis takes several hours or days. Analternative to reduce process time is the use of the rapidmicrowave heating process. In this work, the hydrothermalmethod is performed with a commercially microwave oven forfast heating of the material. With this procedure the processingtime, for ZnO and ZnO:Al nanowires grown on PET substrates,is decreased.
The undoped ZnO and ZnO:Al nanowires werecharacterized morphologically by scanning electronmicroscopy (SEM), structurally by X-ray diffraction andoptically by transmission measurements.
2.Experimental ProcedureUndoped ZnO and ZnO:Al nanowires were grown
hydrothermally based on the method developed by Husnu et al.[4]. This method consists of two-step process: (a) preparationof the seed layer, and (b) growth of the nanostructures. First, a10 mM solution of zinc acetate dihydrate and 1-propanol wasprepared. The solution was then spin coated on PET substrateat 2000 rpm by 30 s. After three cycles of spin coateddeposition, the deposit on the substrate was annealed at 100 °Cduring 5 min, and then a seed layer was obtained on the PETsubstrate. Secondly, the substrate was dipped in a mixture ofequimolar 25 mM zinc nitrate hexahydrate (Zn(NO3)2·6H2O)and hexamethylenetetramine (HMTA) solution in deionizedwater. As the doping source, aluminum nitrate nonahydrate(Al(NO3)3· 9H2O powders were added in the solution. In thesolutions, Al doping concentrations were established as 0.5 At%, 1.0 At %, 2.0 At % and 3.0 At %, respectively. Table 1shows Al concentrations for the ZnO:Al nanowire samples.The hydrothermal process was carried out heating with acommercially microwave oven at 140 W power setting atatmospheric pressure during 10 min. The X-ray patterns were
Advances in Materials Physics and Chemistry Supplement: 2012 world Congress on Engineering and Technology
56 Copyright . 2012 SciRes.

measured in Grazing-incidence small-angle X-ray scattering(GISAXS) with XPert PRO Diffractometer from Panalyticalusing Cu radiation (Kα = 1.54 Å), it is a technique used tostudy nanostructured surfaces and thin films. The sample was
Work supported by Instituto Politécnico Nacional through project SIP-IPN 20121689.
TABLE I. CONDITIONS OF GROWTH PARAMETERS.
Sample Al At %Z1 undopedZ2 0.5Z3 1.0Z4 2.0Z5 3.0
placed in one degree ( = 1 °). X-Ray mirror and soller slit(0.04 Rad) in incident optic and PIXcel ultrafast X raydetector for diffracted optic were used. The step size was 0.05and 300 s for time. 45 kV and 40 mA were used for tubepower. Optical transmission measurements were performed ina UV/VIS spectrometer Lambda Perkin Elmer in the region of300 nm to 1100 nm. SEM micrographs were obtained withsecondary electrons in a Zeiss MOD Auriga 39-16 microscopy.
3. Results and Disscusion
A. X-ray diffraction patterns
Figure 1 shows the X-ray diffraction patterns of the PETsubstrate, the undoped ZnO nanowires (sample Z1) and theZnO:Al (sample Z3). There were identified several crystallinephases as (C10H8O4)n, ZnO, Zn(OH)2 and Zn6Al2O9. The PETphase (C10H8O4)n has a triclinic structure with crystal latticedimension of 4.53Åx5.92Åx10.77Å (99.92ºx118.62ºx111.37º).Its reflections of highest intensities are located at 22.72º and26.11º 2degrees and its corresponding hkl are (-110) and(100). The ZnO phase has a hexagonal structure with crystallattice dimension of 3.25Åx3.25Åx5.20Å (90ºx90ºx120º). Thereflections of highest intensities are located at 31.76º, 34.32ºand 36.25º 2degrees and its hkl are (100), (002) and (010)respectively. The Zn(OH)2 phase has a tetragonal structurewith crystal lattice dimension of 8.22Åx8.22Åx14.34Å(90ox90ox90o). The reflections of highest intensities are locatedat 19.58o, 24.90o and 30.57o 2degrees and its correspondinghkl are (112), (004) and (213). The reflections of highestintensities, of the Zn6Al2O9 phase, are at 32.17o, 34.60o and36.49o 2degrees. Figure 2, in the region from 30º to 60º 2degrees, shows in detail the presence of the crystalline phasesidentified in the samples. From sample Z1 we appreciatereflections associated to PET, as well as, reflections of ZnO.Sample Z3 shows the presence of the ZnO, Zn6Al2O9 andZn(OH)2 crystalline phases. It is clearly observed that whenthe ZnO is doped with Al the Zn6Al2O9 phase is formed. Thereflections of Zn6Al2O9 phase are observed as shoulders in thebands of ZnO, in addition to the reflections present at 47.56ºand 56.78º 2 degrees. On the other hand, additionalreflections from Zn(OH)2 can be observed at 42.84º, 45.76º
and 50.91º 2 degrees and its hkl are (314), (107) and (008)respectively.
Figure 1. X-Ray diffraction patterns of the PET substrate, undoped ZnO(sample Z1) and ZnO:Al at 1.0 At % (sample Z3) processed in a microwaveoven at 140 W during 10 min.
Figure 2. X-Ray diffraction patterns, in the 30o to 60o 2 region of the PETsubstrate, undoped ZnO (sample Z1) and ZnO:Al at 1.0 At % (sample Z3)processed in a microwave oven at 140 W during 10 min.
Copyright . 2012 SciRes. 57
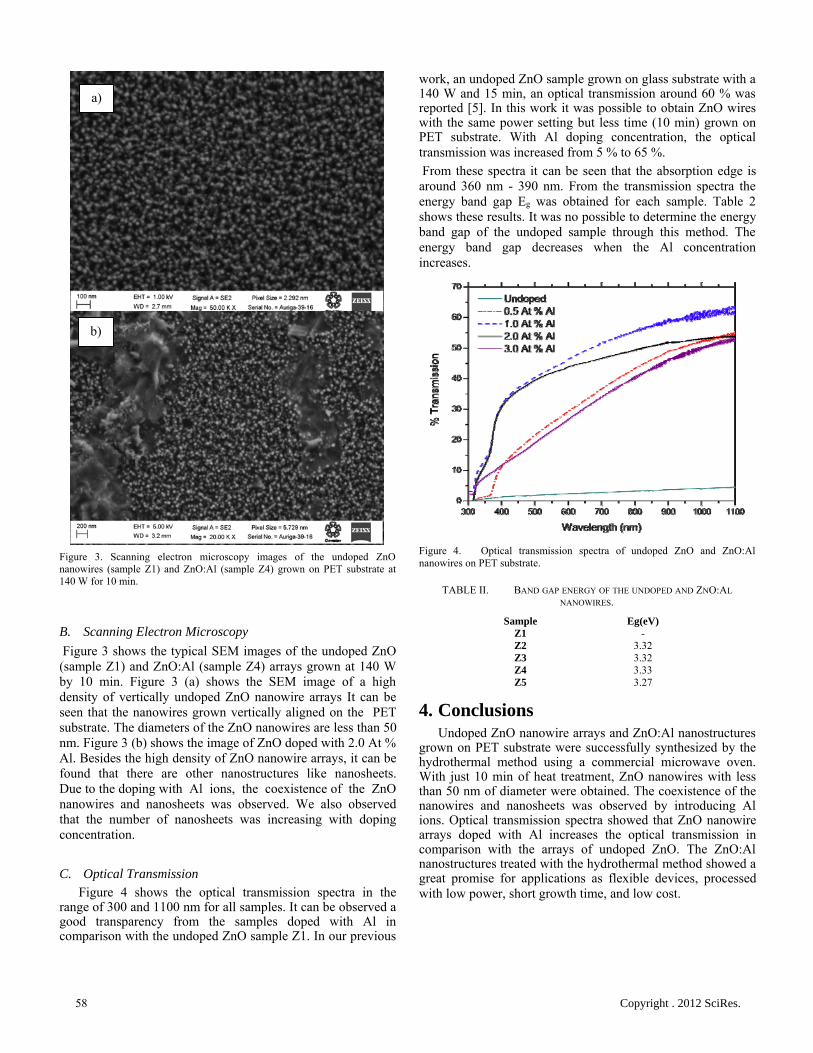
Figure 3. Scanning electron microscopy images of the undoped ZnOnanowires (sample Z1) and ZnO:Al (sample Z4) grown on PET substrate at140 W for 10 min.
B. Scanning Electron Microscopy
Figure 3 shows the typical SEM images of the undoped ZnO(sample Z1) and ZnO:Al (sample Z4) arrays grown at 140 Wby 10 min. Figure 3 (a) shows the SEM image of a highdensity of vertically undoped ZnO nanowire arrays It can beseen that the nanowires grown vertically aligned on the PETsubstrate. The diameters of the ZnO nanowires are less than 50nm. Figure 3 (b) shows the image of ZnO doped with 2.0 At %Al. Besides the high density of ZnO nanowire arrays, it can befound that there are other nanostructures like nanosheets.Due to the doping with Al ions, the coexistence of the ZnOnanowires and nanosheets was observed. We also observedthat the number of nanosheets was increasing with dopingconcentration.
C. Optical TransmissionFigure 4 shows the optical transmission spectra in the
range of 300 and 1100 nm for all samples. It can be observed agood transparency from the samples doped with Al incomparison with the undoped ZnO sample Z1. In our previous
work, an undoped ZnO sample grown on glass substrate with a140 W and 15 min, an optical transmission around 60 % wasreported [5]. In this work it was possible to obtain ZnO wireswith the same power setting but less time (10 min) grown onPET substrate. With Al doping concentration, the opticaltransmission was increased from 5 % to 65 %.
From these spectra it can be seen that the absorption edge isaround 360 nm - 390 nm. From the transmission spectra theenergy band gap Eg was obtained for each sample. Table 2shows these results. It was no possible to determine the energyband gap of the undoped sample through this method. Theenergy band gap decreases when the Al concentrationincreases.
Figure 4. Optical transmission spectra of undoped ZnO and ZnO:Alnanowires on PET substrate.
TABLE II. BAND GAP ENERGY OF THE UNDOPED AND ZNO:AL
NANOWIRES.
Sample Eg(eV)Z1 -Z2 3.32Z3 3.32Z4 3.33Z5 3.27
4. ConclusionsUndoped ZnO nanowire arrays and ZnO:Al nanostructures
grown on PET substrate were successfully synthesized by thehydrothermal method using a commercial microwave oven.With just 10 min of heat treatment, ZnO nanowires with lessthan 50 nm of diameter were obtained. The coexistence of thenanowires and nanosheets was observed by introducing Alions. Optical transmission spectra showed that ZnO nanowirearrays doped with Al increases the optical transmission incomparison with the arrays of undoped ZnO. The ZnO:Alnanostructures treated with the hydrothermal method showed agreat promise for applications as flexible devices, processedwith low power, short growth time, and low cost.
a)
b)
58 Copyright . 2012 SciRes.

5. AcknowledgmentsThe authors thank Esteban Basurto Cazares for the
technical support.
References[1] Lee C. Y., Li S. Y., Lin P., Tseng T. Y., IEEE Trans. NanoTechnol.
2006, 5, 216.
[2] Lai E., Kim W. Yang P., Nano Res, 2008, 1:123-128.
[3] Lupan O., Guérin V. M., Tiginyanu I. M., Ursaki V. V., Chow L.,Heinrich H., Pauporté, Journal of Photochemistry and Photobiology A:Chemistry , 2010, 211, 65-73.
[4] E. U. Husnu, Pritesh H., Nalin R., Sharvari D., William I., Gehan A. J.A., Nanotechnology 2008, 19, 255608.
[5] Mejía García C., Díaz Valdés E., Ortega Cervantes, Basurto CazaresE., J. Chem. Chem. Eng. 2012, 6, 61-64.
Advances in Materials Physics and Chemistry Supplement: 2012 world Congress on Engineering and Technology
Copyright . 2012 SciRes. 59

Morphology and electronic properties of hybrid organic-inorganic system: Ag nanoparticles embedded into CuPc
matrix
I.M. AristovaInstitute of Solid State PhysicsRussian Academy of Sciences
Chernogolovka, Russia
O.Yu.VilkovHelmholtz Zentrum Berlin Mat&Energy
Berlin, Germany
A.Pietzsch, M. TchaplyguineLund University
MAX-labLund, Sweden
O.V. MolodtsovaHASYLAB
DESYHamburg, Germany
V.Yu. AristovEuropean XFEL GmbH
Hamburg, Germany&
Institute of Solid State PhysicsRussian Academy of Sciences
Chernogolovka, Russia
Abstract— Materials with a high on-off resistance ratiocould become the basis for resistive random-access memory(RRAM). It is assumed that one of RRAM types can be basedon hybrid organic-inorganic systems, while particular attentionis focused on hybrid systems consisting of metal nanoparticles(NP) embedded in organic matrix (OM). In this investigationwe created and studied the hybrid organic-inorganic systemsmade of metal (Ag) nanoparticles embedded in organicsemiconductor material CuPc. The LEED patterns andNEXAFS data demonstrate that the CuPc films deposited onAu(001) substrate are highly ordered and molecular planes lieparallel to the gold surface. The metal atoms were depositedon the outer surface of the organic molecular film and self-assembled into nanoparticles due to surface and bulk diffusion.The properties of nano-composite materials seem to besignificantly dependent on the microstructure, i.e. the size,concentration, bulk- and size-distribution of nanoparticles;therefore we have studied by high resolution transmissionelectron microscopy the evolution of morphology of nano-composite films as a function of nominal metal deposition.The filled and empty electronic states of the hybrid organic-inorganic systems, energy level alignment at interfaces formedbetween metal nanoparticles and the organic semiconductorCuPc as well as the chemical interaction at the NP/OMinterface were studied by UPS, XPS and NEXAFS methods.
Keywords-hybrid materials; nanoparticles; organicmatrix; morphology; electronic properties; nonvolatilememory
Nowadays there are tremendous worldwide efforts to developnew memory devices for long-term storage of the information[1, 2]. The new kind of memory based on switchable resistivematerials is commonly ranked as resistive random-accessmemory (RRAM). Hybrid systems, mainly consisting ofinorganic nanoparticles (NP) blended into an organic matrixhave been proposed as one type of RRAM [3, 4]. Possiblememory architecture is obtained if an organic thin film
containing metal nanoparticls is sandwiched between cross-point arrays of electrodes – that consist of narrow metal stripes,running in perpendicular directions above and below the film(see Fig. 1).
Figure 1. Cross-point memory architecture
Advances in Materials Physics and Chemistry Supplement: 2012 world Congress on Engineering and Technology
60 Copyright © 2012 SciRes.

The resistivity at “cross-points” can be switched either ahigh- or low-conductivity state by applying a voltage, suitableto write or erase.
Above a threshold voltage the device suddenly switchesfrom a high-impedance state to a low-impedance state andremains in that state even when the power is off. Theresistivity in the high- and low conductivity state can differ by6-8 orders of magnitude [5]. The high-impedance state can berecovered by applying a voltage in the reverse direction. Thecorresponding state can then be probed by measuring thecurrent across the crosspoints at some lower voltages. Bydefining the two states it is possible to create digital memorydevices. These two states can be viewed as the realization ofnon-volatile electrical memory, thus rendering the structuressuitable for data storage.
Albeit, there is a rapid development in this area but theprecise memory mechanism is still unclear and manyquestions left unanswered [6-8]. Properties of the materialsformed with participation of nanometer-sized (tens or unitsnanometers) structural elements, are not identical with theproperties of bulk matter, so it is possible to consider suchnanostructures as a special state of substance. The propertiesof such composite films are strongly linked to the particles’nanostructure, i.e. the size, concentration, bulk- and size-distribution of respective nanoparticles. The most fertilemodel for mechanism that is responsible for the largedifference in resistivity between the high and low conductivitystates is based on charging of the NP, which leads to strongmodifications of the properties of the organic matrix material(see Review [5] and references therein). It is impossible tounderstand the underlying mechanism without comprehensiveinformation about the specific electron structure and interfaceinteractions between the NP’s and the thin organic film matrix.The aim of the present work was to investigate the diversemorphologically defined hybrid systems composed of silverNP’s (Ag NP’s) distributed in a CuPc (organic semiconductorcopper phthalocyanine) matrix, which is formed by moleculeswith a wide energy gap and delocalized π-orbitals.
Figure 2. N 1s NEXAFS spectra taken from CuPc film (7 nm thick),deposited on the Au(001) surface, taken at 3 different angles alpha betweenthe light polarization vector E and the normal to the sample surface n. Theinset indicates the experimental geometry. The lower energy features (396–404 eV) represent the π* resonances, whereas the features above 404 eV arerelated to the σ* resonances.
The organic semiconductor copper phthalocyanine matrix,CuPc thin film, for hybrid organic-inorganic system wasgrown on an atomically clean Au (001) surface by deposition
of organic molecules evaporated from an effusion cell underultrahigh-vacuum (UHV) conditions.
No residual contamination was detected in core-levelphotoemission (CL-PES) spectra. Morphology and ordering ofthe CuPc overlayer were evaluated by means of LEED andnear-edge x-ray absorption fine structure spectroscopy(NEXAFS) [9,10], which demonstrate that the CuPc films arehighly ordered and molecular planes lie parallel to the goldsubstrate. Fig. 2 reveal a very strong angular dependence ofthe N 1s − π* intensities (396–404 eV). At grazing incidence,when polarization vector E is almost perpendicular to thesubbstrate, the intensities of these π* signals show a maximum,while reaching a minimum, when E is almost parallel to thesubstrate. The angular dependence of the N 1s − σ* intensities(404—420 eV) reveals the opposite trend. This behaviortogether with registered LEED patterns demonstrates, that theCuPc molecules are well ordered with the molecular planeslying parallel to the Au(001) substrate. This observationproves that the CuPc–Au(001) substrate coupling is strongerthan the CuPc–CuPc interaction.Resistive evaporation of a high-purity silver wire woundaround a thoroughly degassed tungsten filament was used formetal deposition on the outer surface of the organic film. Dueto surface and bulk diffusion of deposited Ag atoms theembedded silver nanoparticles were self-assembled forming athree-dimensional Ag NP’s distribution in the bulk of theorganic semiconductor.
a)
b)
Figure 3. Microstructure of nanocomposite thin film composed of silverparticles embedded in CuPc matrix (TEM) for 2 different (a and b)magnifications. Nominal Ag deposition is 0.4 nm.
3 9 5 4 0 0 4 0 5 4 1 0 4 1 5
E h
P h o to n e n e r g y ( e V )
Inte
nsity
(ar
b. u
nits
)
N E X A F S N 1 s
C u P c / A u ( 0 0 1 )
Copyright © 2012 SciRes. 61

a)
b)
Figure 4. Microstructure of nanocomposite thin film composed of silverparticles embedded in CuPc matrix (TEM) for 2 different (a and b)magnifications. Nominal Ag deposition is 5.7 nm.
The size, concentration, size-distribution and shape of theresulting nanoparticles were studied using transmissionelectron microscopy (TEM) JEOL JEM-2100 operated at 200kV. Thus the microstructure and evolution of the morphologyof the nano-composite films as a function of nominal silvercoverage were studied (see Fig. 3 and 4).
The hybrid organic (CuPc) – inorganic (Ag) systems for TEMinvestigations were prepared under UHV conditions oncleaved NaCl single crystals as substrate using the same UHVchamber, evaporators and the same parameters (temperature,rate of CuPc deposition, organic film thickness, rate of silverdeposition, nominal silver coverage, etc.) as for the systemsgrown on Au(001) surface. In order to bind the nano-composite thin films these samples were then coated by anultra thin overlayer of amorphous carbon. Film separationfrom a substrate always occurs easily by dissolution salt inwater. Preliminary the film was cut by square pieces with theside of about 2-3 mm. Then samples are transferred on 250-mesh (250 lines/inch) copper grids for TEM investigations.Figs. 3-4 presents bright-field TEM images of nanocompositethin films microstructure. It composed of silver particles (theblack dots in the picture) embedded in an organicsemiconductor matrix CuPc for nominal Ag deposition of 0.4and 5.7 nm. The electron diffraction patterns for selected areasof the samples with corresponding silver deposition prove thatthe diffraction originates from silver NP’s. Figs. 3-4demonstrate that the size of the Ag NP’s strongly depends onsilver coverage. For nominal Ag deposition of 0.4 nm (Fig.3)
silver nanoparticles form some particle distribution, whilemetal nanoparticles are spherical. With further deposition oneobserves strong growth of individual grains. Large particleshave an irregular shape. The analysis of size distribution ofsilver nanoparticles allows to assume the following: due toincrease of nominal coverage of silver some nearbynanoparticles (because of increase their sizes) come to contactand coalesce, forming larger particles.Coalescence of two or more small particles in one largeparticle leads to reduction of particles surface area andtherefore to reduction of particles surface energy. Thus, weobserve the coalescence process of silver nanoparticlesembedded in the CuPc film surface. It leads to increase ofaverage diameter of the particles and thereby has an influenceon size distribution of silver nanoparticles.
The electronic structure (occupied and unoccupied states)of the hybrid organic-inorganic systems, the energy levelalignment at interfaces formed between Ag NP’s and theorganic semiconductor CuPc, as well as the chemicalinteraction at this interface were studied by CL-PES, valenceband PES (VB-PES) and NEXAFS methods. The workfunction (WF) changes induced by silver deposition on CuPcthin films were determined from VB-PES data using the cut-off procedure. All PES and NEXAFS measurements wereperformed at BESSY (Berlin) and MAX-Lab (Lund).
AcknowledgmentThis work was supported by the RFBR under grant no. 10-
02-00269 and grant no. 11-02-01253.
REFERENCES[1] Z. Liu, A.A. Yasseri, J.S. Lindsey, D.F. Bocian, Molecular MemoriesThat Survive Silicon Device Processing and Real-World Operation, Science,vol. 302, 2003, pp. 1543-1545.[2] J.C. Scott, Is There an Immortal Memory?, Science, vol. 304, 2004, pp.62-63; J.C. Scott and L.D. Bozano, Nonvolatile Memory Elements Based onOrganic Materials, Adv. Mater., vol. 19, 2007, pp. 1452-1463.[3] L.D. Bozano, B.W. Kenan, M. Beinhoff, K.R. Carter, P.M. Rice, J.C. Scott,Organic materials and thin-film structures for cross-point memory cells basedon trapping in metallic nanoparticles, Adv. Funct. Mater., vol. 15, 2005, pp.1933-1939.[4] Y.Yang, J.Ouyang, L. Ma, R.J.-H. Tseng, C.-W. Chu, Electrical Switchingand Bistability in Organic/Polymeric Thin Films and Memory Devices Adv.Funct. Mater., vol. 16, 2006, pp. 1001-1014.[5] D. Prime, S. Paul, and P.W. Josephs-Franks, Gold nanoparticle chargetrapping and relation to organic polymer memory devices, Phil. Trans. R. Soc.,vol. A367, 2009, pp. 4215-4225.[6] J.Y. Ouyang, C.W. Chu, C.R. Szmanda, L. Ma and Y. Yang,Programmable polymer thin film and non-volatile memory device, Nat.Mater., vol. 3, 2004, pp. 918-922.[7] D. Tondelier, K. Lmimoumi, C. Fery, and G. Haas, Metal/organic/metalbistable memory devices, Appl. Phys. Lett., vol. 85, 2004, pp. 5763-5765.[8] L. D. Bozano, B. W. Kenan, V. R. Deline, J. R. Salem, and J. C. Scott,Mechanism for bistability in organic memory elements, Appl. Phys. Lett., vol.84, 2004, pp. 607-609.[9] H. Peisert, T. Schwieger, J. M. Auerhammer, M. Knupfer, M. S. Golden, J.Fink, P. R. Bressler, and M. Mastet al., Order on disorder: Copperphthalocyanine thin films on technical substrates, J. Appl. Phys., vol. 90, 2001,pp. 466-469.[10] G. Cabailh, J. W. Wells, I. T. McGovern, A. R. Vearey-Roberts, A.Bushell, and D. A. Evans Synchrotron radiation studies of the growth andbeam damage of tin-phthalocyanine on GaAs(001)-1x6 substrates, Appl. Surf.Sci., vol. 234, 2004, pp. 144-148.
62 Copyright © 2012 SciRes.

Preparation and Property Analysis of Melamine Formaldehyde Foam
Dongwei Wang, Xiaoxian Zhang, Song Luo, Sai Li*;
School of Chemical Engineering, Sichuan University, Chengdu, China, 610065;
Email: [email protected]; [email protected]
Abstract- Melamine formaldehyde (MF) foam is kind of fire-retardant material and has great potential in acoustic and thermal insulation area. In this article, MF resin foam was prepared by microwave radiation. We discussed the thermal stability of MF foam and the effect of different emulsifiers on its morphology, apparent density, fire-retardancy and mechanical property. The decomposition temperature of MF foam we prepared is nearly 400 and the constitution of residue after combustion is made up of carbon and graphite. Emulsifier influenced the apparent density of MF foam and using coemulsifiers can get flexible foam with uniform cell size, good morphology and low apparent density. When the fire-retardant MF foam’s apparent density is low of 5.53 kg/cm-3, its value of LOI can reach 32.4. The mechanical property of foam is consistent with apparent density.
Keywords-Melamine formaldehyde resin; foam; emulsifier; morphology;
1. Introduction
MF foam is a kind of thermosetting plastic and has attracted much attention all over the world. Because of its properties as the low density, corrosion resisting, good autologous fire-retardancy and high thermal stability it can be used for a long time in the environment of temperature as high as 150 [1]. Up to now, only several companies including BASF, Illtec and Zhong Yuan Da Hua CO. can produce flexible MF foam [2]. This kind of MF foam has a skeleton of length/diameter (L/D) to 15 or even higher and can be practically used in acoustic area [3-4] due to its three-dimensional network structure and high cell-opening ratio. Many researchers have done lots of researches to solve its rigidity problem. For example, glycerol [5], isocyanate [6] as well as substituted melamine [7] had been
added into MF resin to improve its flexibility. As we all know, emulsifier can reduce the interfacial tension and increase the contact area between foaming agent and MF resin which is benefit to foaming. But different kinds of emulsifiers had different fields of application and apparent density caused by emulsifiers will affect the fire-retardancy and mechanical property. The corresponding basic research on foaming happens of MF foam with different emulsifiers has not been seen in recent papers. In this paper, we discussed the cell morphology with different emulsifiers under the radiation of microwave and apparent density, fire-retardancy and mechanical property caused by emulsifiers. These experimental results will provide significant theoretical foundation for producing superior MF foam.
2. Experiment
A. Materials
Melamine(99%), formaldehyde(37%), NaOH, petroleum ether(30~60 ), dimethyl silicone oil (H-201), tween-80, Octyl phenol ethoxylates (OP-10) and sodium dodecylbenzenesulfonate (SDBS), acetic acid and so on are analytically pure, they are all purchased from KeLong Reagent Corporation Chengdu.
B. Preparation of MF foam
Melamine and 37% formaldehyde with the molar ratio of 1:3 were added to flask with three necks equipped with motor stirrer, thermometer and condenser and heated to about 60 and kept for a few minutes until the solution became clear. Then 10%NaOH was dripped to adjust the pH of the solution to 8.5, and emulsifier can be added with the mass ratio 2% of the resin. And then the solution was kept to the temperature of about 85 for properly 2~3h till the viscosity of the system up to 2000 cm•Pa and cooled to
*The corresponding author
Advances in Materials Physics and Chemistry Supplement: 2012 world Congress on Engineering and Technology
Copyright © 2012 SciRes. 63

room temperature and MF resin was obtained. Took a certain amount of MF resin and about 3% acetic acid and 10% petroleum ether the mass ratio of the MF resin together were added and agitated vigorously to uniform and put into the microwave oven to foam without restraint of volume for about 5min. Finally the MF foam was put into air oven at 120 to wipe off water, residual formaldehyde and for further cross-linking to transfer ether bond to methylene [8].
C. Test and analysis
Fourier transform Infrared (FTIR) spectra were measured in the spectral range from 400 to 4000 cm-1, on a Nicollet 380 FT-IR, KBr tablet, Thermo Electron Corporation spectrometer, USA. Thermo gravimetric analysis (TG) was carried out with a Setaram Setsys TG-DTA, samples were heated from room temperature to 700 in a 50 ml/min flow of N2 and heating rates of 10 /min. Differential Scanning Calorimeter, DSC, GRN1-CDR-4P system, samples were heated from room temperature to 360 in a 50 ml/min flow of N2 and heating rates of 10 /min. Field Emission Scanning Electron Microscopy (FE-SEM, JEOL, JSM-6700F) to evaluate the morphology of the samples. The Limited Oxygen Index (LOI) test was performed according to the testing procedure of the ASTMD-2836 Oxygen Index Method. X-ray Diffraction, XPert Pro MPD, Philips, Netherlands, 5°�2�50°. Mechanics of compression test by universal testing machine at the rate of 5.0 mm/min until the deformation up to 70%, Instron 3360 series and RHW-50A system.
3. Results and Discussion
A. FTIR spectrum analysis The cross-linking in acid solution of
methylolmelamines can only form methylene [9]. However, two kinds of structure i.e. the methylene and ether bond should be both existed theoretically according to Fig.1.
The FTIR spectrum of pristine melamine and MF resin foam without aging as well as MF foam aging 2h in 120 are shown in Fig.2. In the melamine IR spectrum, 3415cm-1, 3123cm-1, 3476cm-1, 3336cm-1 represent the characteristic absorption peak of primary amine respectively, 1645cm-1, 1535cm-1are attributed to the absorption peak of triazinyl. It is apparent that the peak of 813 cm-1 exists in all these three IR spectrums which is the characteristic peak of triazinyl
[10]. Correspondingly, in the IR spectrum of MF resin foam without aging and MF foam aging 2h in 120 , it appears a new peak at 3440 cm-1, which represents the stretching vibration of O-H and N-H band with the peak of primary amine disappeared. These bands confirmed that melamine and formaldehyde are successfully cross-linked. The band of 2941cm-1 is corresponding to the stretching vibration of C-H. And the new peak at about 1320 cm-1 represents the vibration of methane. Especially, in the curve of MF foam without aging, 1079cm-1 showed that the structure of C-O-C is formed and after aging this peak disappeared which confirmed the theoretical prediction.
Figure1. The proper cross-linking ways of methylolmelamines in acid
circumstances
Figure2. FTIR spectrum of pure Melamine, MF foam without aging
and MF foam aging for 2h in 120
B. Thermal stability of MF foam
Fig.3 is the TG curve of MF foam. Its decomposition temperature is nearly 400 . During the weight loss from room temperature to 350 a series of small molecules including the residual water, foaming agent, emulsifier, formaldehyde and partly MF molecule with structural defects evaporated. These molecule structural defects are caused by the rapid cross-linking reaction when foamed by microwave radiation. Even when temperature is as high as 700 the residue still reserves about 20% of original weight.
64 Copyright © 2012 SciRes.

Figure3. TG curve of MF foam
Fig.4 is the DSC curve of MF foam. The sample was heated to the temperature of 360 which did not reach the decomposition temperature. There are just two endothermic peaks appeared in the DSC curve of MF foam. One small peak is at 150 and a relative sharp and larger peak at 184 , but it is different to the result given by Jiang [11]. We attributed the two peaks to the fact that part of the methylolmelamines did not participate in the process of cross-linking and the cross-linking reaction is not fully enough. As a consequence, in the process of temperature increasing at 150 the molecule further cross-linked and when temperature reached 180 this reaction finished. When temperature was above 180 there is no obvious endothermic peak which indicates that MF foam is amorphous polymer. Its glass transition temperature (Tg) is higher than 360 which attributes to the chemical cross-linking points restrict the movement of molecule chain segment.
Figure4. DSC curve of MF foam
In order to examine the constitution of residue, we detected the XRD curve after burning in muffle furnace in 500 for 30mins. From Fig.5 we can see there is no sharp peak without a wide peak of 2 angle at about 25° which is the characteristic peak of graphite structure and proved that the residue is made up of carbon [12]. The existence of compact carbon or graphite layer can isolate the inner side of foam from oxygen and then extinguish fire at the surface.
Thus MF foam can keep stable and integrity even after combustion.
Figure5. XRD of MF foam after burning for 30min in muffle at the
temperature of 500
C. Cell morphology with different emulsifiers
From Fig.6a to Fig.6e we can see the foam cell morphology is different with different kinds of emulsifiers as nonionic surfactant, ionic surfactant and co-surfactant as well. Nonionic surfactant H-201 sometimes even works as defoaming agent [13], thus the cell walls seem to be lots of flakes and pile up. The cell diameter is widely distributed and the cell skeletons are not obvious (Fig.6a). Tween-80 and OP-10 both belong to nonionic surfactant. It is known that nonionic surfactant will reduce or even loss the foaming ability when temperature is above cloud point [14]. Colin [15] put up a theory that surfactant aqueous solution will separate into two phases in the temperature above cloud point, i.e. a surfactant-rich phase and a surfactant-poor phase which will result in the antifoam action. However, the cell in Fig.6b and Fig.6c is relatively uniform when compared to Fig.6a and the cell skeletons are rather clear and much thinner. There are more cell walls in Fig.6b compared to Fig.6c in amount. These walls are so thin that when compressed by force foam easily appears powder residue and influences its further application. In Fig.6d the MF foam is made up of skeletons only. But skeletons are too thin to withstand force and the cell size distributes in large range. Considering that different surfactants works independently and has synergistic effect. When OP-10 and SDBS used together as coemulsifiers the morphology of MF foam appeared to be uniform three-dimensional network structure with cell size between 100�m and 200�m. This structure ensured MF foam has good flexibility.
Copyright © 2012 SciRes. 65

Figure6. From a to e is the cell morphology of MF foam with
emulsifier H-201, Tween-80, OP-10, SDBS, coemulsifiers of OP-10 and
SDBS
D. Apparent density and fire-retardancy of MF foam
Table.1 is the apparent density changes with different emulsifiers and the corresponding values of LOI. From H-201, Tween-80, OP-10, SDBS to OP-10 and SDBS as emulsifiers, the MF foam apparent density and value of LOI respectively reduced which due to the fact that emulsifier affects interfacial tension and then the foam volume and porosity. H-201, Tween-80 and OP-10 are all nonionic emulsifiers but H-201 sometimes worked as defoaming agent which caused the apparent density higher. For the system of MF resin, the ingredients are water-soluble. As a result, the emulsifying capacity of Tween-80 and OP-10 is limited, so the MF foam apparent density is relatively high. SDBS belongs to anionic emulsifier and it is suitable for this water-soluble system. But foaming agent of petroleum ether is oil-soluble, adding OP-10 and SDBS as coemulsifiers can make the emulsifying effect much better. Correspondingly, the MF foam apparent density reduces.
Values of LOI reduced from 36.8 to 32.4 with the apparent density reducing from 14.9kg/cm-3 to 5.53kg/cm-3. High density MF foam has low porosity and when burned oxygen cannot flow into the inner foam as easily as possible which will restrain combustion. On the contrary, low apparent density has high porosity and oxygen is easier to
flow into the inner foam and keep foam burning. As a consequence, the value of LOI is lower.
Table1. Apparent density changes with different emulsifiers and
corresponding values of LOI
emulsifier Apparent density(kg/cm-3) LOI
H-201 14.9 36.8
Tween-80 14.6 36.3
OP-10 12.5 35.8
SDBS 9.42 34.5
OP-10 and SDBS 5.53 32.4
E. Compression stress modulus changes of MF foam
Fig.7 is the compression stress/strain curves of MF foam with different emulsifiers. We can see with apparent density reducing from 14.9 kg/cm-3 to 5.53 kg/cm-3 the compressive stress modulus reduces from 0.02MPa to 0.004MPa when foams were compressed to 70%. For the MF foam with same apparent density, compressive modulus increases with increasing of deformation and did not achieve maximum. Because deformation caused by stress can make cell skeleton bend and twist. Fyodor [16] deemed that foam structure determined mechanical property with same apparent density. For higher density foam, the L/D of foam skeletons is lower and the contact among foam skeletons becomes closer. When the foam is compressed by stress its modulus is relatively higher and vice versa. The mechanical properties of MF foam with similar structure are consistent with the apparent density.
Figure7. The compressive stress/strain curves
IV. CONCLUSION AND OUTLOOK
Through the analysis of emulsifier influenced on MF foam morphology, apparent density and compressive modulus changes as well as fire-retardancy we got that emulsifier is very important to the foaming process. In the actual production SDBS and OP-10 works together as coemulsifiers can provide good emulsifying effect which is
66 Copyright © 2012 SciRes.

suitable for producing flexible MF foam with uniform cell size. The decomposition temperature of MF foam is up to about 395 and the value of LOI can reach 32.4 even when its apparent density is as low as 5.5kg/m-3, its fire-retardancy is good. Flexible MF foam with similar cell morphology exhibits the similar mechanical property and compression modulus is proportional to the foam apparent density.
In the future research of MF foam there are another two ways to improve its mechanical property. On the one hand, the molecule of MF has long rigid triazinyl and short flexible chain which caused MF foam fragile. So increasing the flexible chain through adding reactive additives such as alkylol amines can improve its flexibility. On the other hand, as the elastic rubber molecules with less cross-linking points if the three-dimensional structure MF molecules reduce the cross-linking degree the flexibility of MF foam will increase. Therefore if the reactive amino of melamine partly be substituted by other groups flexibility can be improved.
4. Acknowledgment
This research was supported by NSFC (20805033; 30901199), SRF for ROCS, SEM (2008890-19-9). The authors are grateful for the financial support.
RERFERENCES
[1] Z. S Hang, F. S Jang, F.Y Ju, S.J Ying, F.M Xu. Advances in preparation and application of melamine foam [J]. Thermosetting Resin, 2010, 25(4): 44-52. [2] D.W Wang, X.X Zhang, D.N Yang, S. Li. Advances in preparation and modification of melamine formaldehyde resin foam [J]. Highlights of Sciencepaper Online, 2012, 5(9): 794-800. [3] J Luc, R Ame´lie, D Mickael. Elastic and damping characterizations of acoustical porous materials: Available experimental methods and applications to a melamine foam [J]. Applied Acoustics. 2008, 69: 1129-1140. [4] K Naoki, U Takayasu, S Yasuhiro, M Hiroshi. Investigation of non-acoustical parameters of compressed melamine foam materials [J]. Applied Acoustics. 2009, 70: 595-604. [5] R.S Frank, J.M Alex. Aminotriazine-aldehyde foam modified with a primary triol [P]. US3093600, 1963-06-11 [6] I Yasno, H Shun, O Tatsnya. Melamine resin foam,
process for production thereof and melamine /formaldehyde resin condensate [P]. US5436278, 1995-07-25 [7] J Weise, W Reuther, G Turznik, et al. Melamine resin moldings having increased elasticity [P]. US5084488, 1992-01-28. [8] I.H Anderson, M Cawley, W Steedman. Melamine Formaldehyde resins I. an examination of some model compound systems [J]. Br. Polym. J., 1969, 1: 24-28. [9] S Kenji. Condensation of Methylolmelamine [J]. Bulletin of the chemical society of Japan, 1968, 41: 7-17. [10] F.Q Liu, K.Y Mao, D.H Zhang, X.Y Tang. Structure determination of melamine resins by Fourier transform-infrared spectroscopy [J]. Analytical Chemistry, 1990, 18(5): 409-413. [11] H Jiang. Study of property of Basofil fiber [J]. Synthetic fiber, 2003, 4: 18-20. [12] L Zhou. Fire Retardancy of EVA/Multi-walled Carbon Nanotubes Nanocomposites [J]. Chinese Plastics, 2009, 23(7): 23-29. [13] T Yasusaka, K Mitsuru. Modified silicone oil-in-water emulsion defoaming agent and defoaming method using it [J]. US 005431853A, 1995-11-7. [14] M.C Per, K Roland, S Per, K.C Hugo. Direct measurement of temperature-dependent interactions between non-ionic surfactant layers [J]. J. Chem. Soc., 1986, 82, 2735-2746. [15] A.B Colin, D Langevin. Why Do Ethoxylated Nonionic Surfactants Not Foam at High Temperature?[J]. Langmuir, 1997, 13(4): 599-601. [16] A.S Fyodor. Foamed Polymers. Cellular Structure and Properties [J]. Polymer science. 1983, 51: 155-219.
Copyright © 2012 SciRes. 67

Abrasive Wear Behavior of Different Thermal Spray Coatings and Hard Chromium Electroplating On A286
Super Alloy
Macid NURBA�
ESOGU, Chemical Eng. Dept. Eskisehir, Turkey
Elif Nazik ATABAY DURUL 1. Air Supply and Maintenance Center Command
Eskisehir, Turkey [email protected]
Abstract—In cases of decorative and functional applications, chromium results in protection against wear and corrosion combined with chemical resistance and good lubricity. However, pressure to identify alternatives or to improve conventional chromium electroplating mechanical characteristics has increased in recent years, related to the reduction in the fatigue strength of the base material and to environmental requirements (1). In the present study plasma sprayed coatings (aluminum oxide, Co-28Mo-8Cr-2Si, tungsten carbide, chrome carbide) and electrolytic hard chrome coatings abrasive wear properties have been compared. The wear tests were conducted with a Taber abraser, at room temperature.
Keywords-Thermal spray, abrasive wear, electrodeposited hard chrome, hardness, SEM.
1. IntroductionChromium has been widely used in surface finishing of
metals because of the favorable properties it imparts to substrates and because the processes used are relatively mature, well understood, widely specified, and cost effective (2). This coating is produced from a wet chemical bath containing hexavalent chromium ions (Cr+6). In all environmental regulations, Cr+6 is classified as a confirmed human carcinogen. Hard chromium plating produces large volumes of chromium containing toxic waste, air pollution and water contamination (3). Potential process substitutions for hard chromium plating are electroless nickel in certain applications, several nickel-tungsten composite plating, and spray applications such as plasma spray coatings (2). Plasma spraying is a process widely used in industry for depositing protective and functional coatings for a large variety of applications. Industrial sectors such as aerospace, automotive, energy, mining, biomedical, etc. take advantage of the unique properties of the sprayed coatings (4). The applications of thermal spray coatings are extremely varied, but the largest categories of use are to enhance the wear and/or corrosion resistance of a surface (2). The deposition methods for the wear protective coatings are atmospheric plasma spraying (APS) and high velocity oxygen fuel (HVOF) flame spray processes. Both of these methods have
their own characteristics, e.g. different spray particle velocities and flame temperatures. As a result, the coatings have different microstructures and properties (5).
2. Experimental Coatings As aforementioned, electroplated chrome and four kinds
of plasma spray were involved in the study. Their characteristics are listed in Table 1. The A286 super alloy was used as substrate materials for all five coatings. The thicknesses of coating layers were controlled in the range of 100-150 μm. The substrates were sand blasted prior to spraying using 36 grit alumina sand. Sulzer Metco 9MB plasma gun and GH / 732 nozzles were used. The spraying parameters were given in Table 2. Electroplated chrome coatings were produced in an industrial plant, using the industrial deposition parameters listed in Table 3. The de-hydrogenation thermal treatment (200 0C for 3 h) has also been performed on the coating.
Table 1. The characteristics of the present coating materials
Designation Composition (wt.%) Powder size (μm) Aluminum oxide Al2O3 %3 TiO2 -45 +11 T400 Co-28Mo-8Cr-2Si -45 +15 Tungsten carbide WC %12Co -45 +15 Chrome carbide %75 Cr3C2 %20 Ni %5
chromium -45 +5
Table 2. Spray parameters
Coating Materials Aluminum oxide
T400 Tungsten carbide
Chrome carbide
Plasma gases Ar + H2 Ar + H2 Ar + H2 Ar + H2 Plasma gases flow rates (scfh)
100 - 15 120 – 12,5
110 – 12,5
90 - 10
Plasma gases pressure (psig)
100 - 50 90 - 50 100 - 50 100 - 50
Current (amper) 500 500 400 500 Spray distance (inch) 4,5 4,5 4,5 4,5 Traverse speed %90 - 2 %80 %95 %100 Powder feeder carrier gas pressure (psig)
50 50 50 50
Powder feeder carrier gas flow (scfh)
13,5 13 13,5 15
Feed rate (g/min) 50 45 30 50 Air jet - Paralle,
50 psi Parallel , 60 psi
Parallel, 50 psi
Acknowledgment, Thank you 1. Air Supply and Maintenance Center Command Eskisehir, Turkey for the A286 super alloy materials supplied and analysis facilities
Advances in Materials Physics and Chemistry Supplement: 2012 world Congress on Engineering and Technology
68 Copyright © 2012 SciRes.

Table 3. Hard chrome deposition parameters
Bath composition CrO3 250 g/l; H2SO4 2.5 g/l; no additives
Bath temperature (0C) 52-57 Voltage (V) 2.5-3 Approximate current density (A/dm2) � 40 Bath stirring method Pneumatic stirring
A. Characterization Roughness was measured with Diavite DH-5, also hardness off each coating were measured by the Vickers microhardness tester (Wilson/Tucon) and given in Table 4.
Table 4. Coating roughness and Vickers microhardness of coatings
Coating Roughness; Ra (μm) (lt = 4,8 ; lc = 0,8)*
Standarddeviation
Vickers microhardness (HV 0.1)
Standarddeviation
Electrolytic hard chrome
144,2 16,87 662,27 4,56
Aluminum oxide
237,09 22,36 695,34 167,2
Co-28Mo-8Cr-2Si
248 29,05 484,93 45,23
Tungsten carbide
284,05 23,1 932,98 314,6
Chrome carbide
205,05 14,63 772,92 79,45
* = lt = traverse length; lc = cut off
The thicknesses of the coatings were determined by micro hardness tester (Wilson/Tucon). Scanning electron microscopy technique (SEM) was used to observe two different parts of the test coupons which performed abrasive wear test (right) and which didn’t (left).
B. Abrasive wear tests For abrasive wear tests, samples were prepared from A286 with 4mm thickness and 100 mm square, according to FED-STD-141C. AMS 5525 (A286 plate form), electrolytic hard chrome and aluminum oxide, Co-28Mo-8Cr-2Si, tungsten carbide, chrome carbide plasma spray coated test panels were subjected to abrasive wear test. The wear tests were conducted with a Taber abraser, at room temperature, using a 1000 g load and CS-17 abrading wheel. The results were analyzed by wear index (mg/1000 cycles) and total wear (mg/10000 cycles) data. Cycles to mg/1000 weight loss is shown in Table 5 and Figure 2, cycles to total mg weight loss is given in Table 6 and Figure 3.
3. Results and Comments In this study, heat treated electrolytic hard chrome and aluminum oxide, Co-28Mo-8Cr-2Si, tungsten carbide and chrome carbide plasma spray coated test coupons were characterized and abrasive wear behaviors were evaluated.
Figure 1. SEM micrographs of electrolytic hard chrome and plasma spray coatings (for each coating, left side picture non-weared, right side picture weared (From left to right electrolytic hard chrome, aluminum oxide, Co-
28Mo-8Cr-2Si, tungsten carbide, chrome carbide) (250 X))
Table 5. Abrasive wears weight loss (Cycles – weight loss, mg/1000)
Cycles mg / 1000
A286 K1 191 361 371 381
0 0 0 0 0 0 0
1000 0,02665 0,00958 0,0946 0,1405 0,22907 0,1655
2000 0,0091 0,00647 0,05117 0,072 0,07357 0,0677
3000 0,0054 0,00598 0,03313 0,0513 0,06627 0,0594
4000 0,01705 0,0057 0,0317 0,0332 0,05997 0,0236
5000 0,00995 0,0041 0,0281 0,0308 0,05827 0,0185
6000 0,00475 0,00325 0,05883 0,05155 0,06223 0,0485
7000 0,0167 0,0056 0,05597 0,0469 0,0543 0,02395
8000 0,00685 0,00355 0,0508 0,0455 0,0442 0,0124
9000 0,00715 0,00435 0,04853 0,0351 0,03363 0,0255
10000 0,01385 0,00445 0,04703 0,04295 0,02333 0,0217
Copyright © 2012 SciRes. 69

Table 6. Abrasive wears weight loss (Cycles – Total weight loss, mg)
Total mg
Cycles A286 K1 191 361 371 381
0 0 0 0 0 0 0
1000 0,02665 0,00958 0,0946 0,1405 0,22907 0,1655
2000 0,03575 0,01605 0,14577 0,2125 0,30263 0,2332
3000 0,04115 0,02203 0,1789 0,2638 0,3689 0,2926
4000 0,0582 0,02773 0,2106 0,297 0,42887 0,3162
5000 0,06815 0,03183 0,2387 0,3278 0,48713 0,3347
6000 0,0729 0,03508 0,29753 0,37935 0,54937 0,3832
7000 0,0896 0,04068 0,3535 0,42625 0,60367 0,40715
8000 0,09645 0,04422 0,4043 0,47175 0,64787 0,41955
9000 0,1036 0,04858 0,45283 0,50685 0,6815 0,44505
10000 0,11745 0,05302 0,49987 0,5498 0,70483 0,46675
Figure 2. Abrasive wear weight loss vs. number of cycles
Figure 3. Total weight loss vs. number of cycles: K : Electrolytic hard chrome, 19 : Aluminum oxide, 36 : Co-28Mo-8Cr-2Si, 37 : Tungsten
carbide, 38 : Chrome carbide Experimental data from abrasive wear tests were conclusive, indicating better results from the hard chrome coating. The abrasive wear resistance of plasma spray coatings and hard
chromium plating was evaluated and the results in terms of wear weight loss are represented in Table 5, Table 6 and Figure 2, Figure 3. The hard chromium plating on A286 substrate material shows better wear resistance properties. Hard chromium coating reduces the abrasion rate of the substrate material.An initially higher wear weight loss for the plasma spray coatings occurred, decreasing continuously and then nearly stabilized. However, the stabilized abrasive wear rates were still higher than the hard chrome coatings. The initial peak which is typical for plasma spray coatings (Figure 2) was due to the higher surface roughness. Table 4 figures out that the surface roughness values of all other coating materials are higher than those of electrolytic hard chrome. Plasma sprayed materials show rough surface properties, involving many pores, oxides and inclusions. It is possible to compare the tested coating materials with electrolytic hard chrome coatings on the SEM micrographs which were given in Figure 1. It can clearly be observed that the electrolytic hard chrome coatings show dense and smooth surface properties. On the other hand, the plasma spray coatings have porous coating structure.
In terms of hardness values, as it can be seen on Table 4, in comparison with the electrolytic hard chrome coated test coupons, similar or higher hardness values were reached by plasma spray coated test coupons.
As it can be seen in Table 5, Table 6 and Figure 2, Figure 3, aluminum oxide coatings show better abrasive wear resistance among all plasma spray coupons. This is due to high oxide content of the coating material. Coating of high oxide content is usually harder and is more wear resistant [6].
REFERENCES[1] M.P. Nascimento, R.C. Souza, I.M. Miguel, W.L. Pigatin, H.J.C.
Voorwald, Effects of tungsten carbide thermal spray coating by HP/HVOF
and hard chromium electroplating on AISI 4340 high strength steel, Surface
Coatings & Technology, vol. 138, pp. 113-124, 2001.
[2] ASM handbook Volume 5: Surface Engineering, 1994.
[3] B.Navinsek, P.Panjan, I.Milosev, PVD coatings as an environmentally
clean alternative to electroplating and electroless processes, Surface
Coatings&Technology, vol. 116-119 pp. 476-487, 1999
[4] L.Pawlowski, The Science and Engineering of Thermal Spray Coatings,
John Wiley, New York, 1995.
[5] D.Toma, W. Brandl, G. Marginean, Wear and corrosion behaviour of
thermally sprayed coatings, Surface Coatings & Technology, vol. 138 pp.
149-158, 2001.
[6] H.J.C. Voorwald, R.C. Souza, W.L. Pigatin, M.O.H. Cioffi, Evaluation of WC-10Co-4Cr thermal spray coatings by HVOF on the fatigue and corrosion strength of AISI 4340 steel, Surface Coatings & Technology, vol. 190, pp. 155-164, 2005.
70 Copyright © 2012 SciRes.

Ion mobility in the fluorite solid solutions 50PbF2–30BiF3–20K(Na)F according to 19F, 23Na NMR data
V.Ya. Kavun a, A.B. Slobodyuk a, I.A. Telin a, R.M. Yaroshenko a, I.G. Maslennikova a, V.K. Goncharuk a,
V.I. Kharchenko a, b a Institute of Chemistry, Far Eastern Branch of RAS, Vladivostok, Russia
b Far-Eastern Federal University, Vladivostok, Russia [email protected]
Abstract — Ion mobility in solid solutions of the fluorite structure 50PbF2–30BiF3–20KF (I) and 50PbF2–30BiF3–20NaF (II) was studied by NMR method. Analysis of 19F, 23Na NMR spectra made it possible to reveal the character of ion motions in the fluoride and sodium sublattices with temperature variation, to determine the types and temperature ranges in which they took place. It was found that the dominant form of ionic mobility in the samples I and II above 380 K was the diffusion of fluoride and sodium ions. According to preliminary results of electro-physical studies, the conductivity reached values of ~ 2×10⁻² – 10–3 S/cm above 500 K. The solid solutions I and II can be recommended as a basis for use in the development of new functional materials.
Keywords - solid solutions 50PbF2–30BiF3–20K(Na)F; ion mobility; ionic conductivity; 19F, 23Na NMR spectra; functional materials
1. IntroductionThe fluorite-related solid solutions are known to exhibit
fluorine ionic conductivity and may be used as solid electrolytes [1-4]. Solid electrolytes based on PbF2 [5] and BiF3, such as MBiF4 (M = K, Rb, Tl) [6, 7] and Pb1–xBixF2+x [1, 6, 8-10], are of special interest due to the high ionic conductivity of about 10–2 S/cm at 500 K. There are a few papers [1, 3, 7, 11] on the conductivity of fluorite solid solutions formed in the KF�BiF3 system. Contrary to earlier data [7], authors of [3] observed phase transitions in the solid solutions xKF–(1–�)BiF3 (0.35 � � � 0.50) attributed to transformation of the meta-stable fluorite-structured phase [12] into the stable form of a structure being similar to NaNdF4 compound. Under solid-phase interaction in the BiF3–KF system, it was found a formation of KBi2F7, KBiF4, and KBi3F10 compounds, as well as of a phase of variable composition in the range of 48-70 mol.% BiF3 [13]. X-ray analysis of the BiF3–NaF system showed a presence of the NaBiF4 compound and a phase of variable composition of the fluorite structure in the range of 65-73 mol.% BiF3 [14]. The diffusion of fluoride and sodium ions in the solid solutions Na1�xBixF1+2� of the fluorite structure and NaBiF4 were studied by 19F, 23Na NMR [15, 16]. It was noted in [15] that there was no motion of sodium ions in the NaBiF4 compound, whereas in the solid solutions, the diffusion of Na+ ions was observed. Ionic mobility in the fluorine sublattice of NaBiF4 compound was attributed to reorientation of fluorine-containing groups, and the number of high-mobile fluoride ions increased in the
solid solutions with temperature increase. Thus, in PbF2�BiF3, KF�BiF3, and NaF–BiF3 systems, the fluorite solid solutions of high ionic conductivity are formed, but there are no published data on ion mobility and transport properties in solid solutions in the ternary PbF2�BiF3�NaF system. As concerns the study of solid solutions in the PbF2�BiF3�KF system, some data were presented in our recent paper [17].
The purpose of this work was to consider ion mobility in the solid solution 50PbF2�30BiF3�20NaF and to compare obtained data with our earlier similar results for the solid solution 50PbF2�30BiF3�20KF [17].
2. ExperimentalOriginal materials for solid-phase synthesis of solid
solutions of the fluorite structure were the preliminarily vacuum dried bismuth trifluoride, lead difluoride, potassium and sodium fluoride (grade "chemically pure"). The mixtures of powdered fluorides were melted in a closed glassy carbon crucible in a dry box filled by argon at temperature of 700-800°C for 15 minutes. The sample single-phase and characterization as compounds of the fluorite structure were confirmed by X-ray diffraction analysis performed on a Bruker D8 ADVANCE diffractometer with CuK� radiation.
19F, 23Na NMR spectra were recorded on a multinuclear digital spectrometer Bruker AV-300 at Larmor frequencies of 282.404 and 79.4 MHz, respectively, in the temperature range of 150-450 K. The temperature accuracy was ± 2 K. Calculations of a rms width of NMR spectra (or the second moment S2, in G2) were performed using an original code by formulas given in [18]. The error in S2 value did not exceed 10%. The width �H of lines (at half height, in kHz), chemical shift (CS, 2 in ppm) and integral intensity of 19F NMR spectrum components were measured with the accuracy of 3%. The CS values of 19F NMR signals were determined relative to the reference C6F6 (CS of C6F6 is -589 ppm relative to gaseous F2, for which 2(F2) = 0 ppm), and of 23Na NMR signals – relative to the aqueous solution NaCl.
3. Results and DiscussionParameters of 19F NMR spectra and temperature ranges,
in which some particular type of ion motions took place in the fluoride sublattice of fluorite solid solutions in the ternary PbF2–BiF3–K(Na)F systems, were determined by nature of the alkali cation and its concentration. The shape of BiF3 line and the almost constant second moment (S2(F) = 55 G2) under
Advances in Materials Physics and Chemistry Supplement: 2012 world Congress on Engineering and Technology
Copyright © 2012 SciRes. 71

temperature variations within 290-420 K were the evidences that BiF3 was characterized by the absence of F– ion motion with frequencies �c > ��H (� 104 Hz) in this temperature range. Contrary to BiF3, in the lead difluoride �-phase there was diffusion of F– ions at temperatures above 370 K [19]. Introduction of potassium (sodium) fluoride into the PbF2–BiF3 system caused a sharp decrease of the activation energy of a local (diffusion) motion in the fluoride sublattice relatively to �-PbF2, as evidenced by nature of �H1/2(F) temperature dependences (Fig. 1).
Figure 1 Temperature dependences of 19F NMR spectrum width of solid solutions 50PbF2–30BiF3–20MF (M = Na, K).
19F NMR spectrum of the solid solution 50PbF2–30BiF3–20KF (I) at 150 K was a single, slightly asymmetric, line with �H = 42.7 kHz and CS = 126 ppm (Fig. 2). For solid solutions of fluorite structure, the CS anisotropy should be practically absent, and, hence, the observed spectrum asymmetry could be attributed to a presence of different fluoride ions in the lattice. Indeed, the experimental spectrum of this sample at 150 K could be decomposed into two Gaussian components with CS of 157 and 92 ppm indicated a presence of at least two different types of fluoride ions in the lattice. The same deconvolution procedure, done for 19F NMR spectra of fluorite solid solutions Na1�xBixF1+2x at 175 K, allowed to authors of [16] to attribute two revealed components to two different fluoride sublattices, formed by the cubic and cubic-octahedral clusters. Considering the absence of a plateau in the dependence �H1/2 = f(T) in the range of 200-150 K (Fig. 1), it may be concluded that the rigid lattice for fluoride subsystem was observed below 150 K. The temperature increase to 200 K caused a NMR spectrum transformation and registration of a new "narrow" component with CS = 118 ppm.
Fig. 2. Transformation of the 19F NMR spectra of solid solutions 50PbF2–30BiF3–20MF (M = Na, K) with temperature variation.
The observed changes in NMR spectra were due to an appearance of high-mobile fluoride ions (Ea < 23 kJ/mol) increased with temperature. As it follows from a ratio of the components integral intensities in the NMR spectrum, at 300 K, the number of high-mobile fluoride ions was about 95%. At 420 K, the NMR spectrum was a single line (�H = 2 kHz, S2 = 0.05 G2), its shape with accuracy up to 3% may be described by a weakly resolved pent tent (with a small share of the Lorentzian function) being characteristic for nuclei with an axially symmetric tensor of magnetic shielding. As a result of the NMR spectrum simulations at 450 K, the parameters of this tensor components were determined: �11 = �22 = 121.1, �33 = 114.75, and �iso = �( �11 + �22 + �33) = 119 ppm. The observed �H and S2(F) values indicated a dominant role of diffusion in the fluoride sublattice of solid solution 50PbF2–30BiF3–20KFat temperatures above 400 K.
19F NMR spectra of the solid solution 50PbF2–30BiF3–20NaF (II) of fluorite structure in the temperature range of 150-230 K consisted of a single, slightly asymmetric, line with �H = 41.5-38 kHz (Fig. 2). Nature of temperature dependence of the NMR spectrum second moment (Fig. 1) evidenced that, in this temperature range, the fluoride sublattice of sample II may be considered as rigid. Taking into account the above mentioned for 19F NMR spectra of the solid solution I, at 150 K, the sample II NMR spectrum may be represented as two components with CS of 151 and 106 ppm indicated an existence of at least two different positions of fluorine ions in the lattice. With the temperature increase from 230 to 300 K, the NMR spectrum transformation was observed, associated with a narrowing of the spectrum to 22.5 kHz and an appearance of a new "narrow" component with CS = 122 ppm above 245 K, indicated on a development of the ion local motion in the fluorine sublattice. The number of high-mobile fluoride ions increased with temperature, and, at 350 K, the ratio of integral intensities of the narrow and broad components (the number of mobile and immobile fluoride ions) was 87.5:12.5. At 380 K, the NMR spectrum consisted of a nearly Lorentzian line with �H = 5.3 kHz and CS = 121 ppm. Heating of the sample to 450 K caused a narrowing of the resonance line to 2.5 kHz and a decrease of the second moment to 0.15 G2. In this case, the spectral shape may be described by superposition of a weakly resolved pent tent, being characteristic for an axially symmetric tensor with parameters �11 = 123.8, �22 = �33 = 118, and �iso = 119.9 ppm, and a Lorentzian function. It should be noted that since the 19F NMR spectrum shape of samples I and II at 450 K was described by various pent tents (the tents were "flipped" relative to each other), so the tensor parameters were different. For example, a similar situation occured for a axially symmetric tensors described the 19F NMR spectra of polycrystalline M2AF6 samples with undistorted octahedrons AF6 [20]: at maximal shielding along the A-F bond there was a tent with �11 = �22, at minimal shielding – a "flipped" tent with �22 = �33. The observed �H and S2(F) values indicated a presence of diffusion in fluorine sublattice of the solid solution 50PbF2–30BiF3–20NaF at temperature above 400 K.
23Na NMR spectra (nuclear spin I = 3/2) of the solid solution 50PbF2–30BiF3–20NaF at temperature below 250 K consisted of a single symmetric line with CS = –17.5 ppm (the absence of satellites was due to averaging of the tensor of an electric field gradient at resonating 23Na nuclei), the resonance
72 Copyright © 2012 SciRes.

line width was determined by internuclear interactions of Na+ � Na+, Na+ � F�, and Na+ � Mn+. With the temperature increase from 150 to 420 K, the resonance line narrowing was observed (from 6.5 to 1.5 kHz), caused by a partial averaging of dipole-dipole interactions between sodium and fluorine nuclei due to an appearance of ion mobility in the fluoride subsystem, as well as, perhaps, by a transition of sodium ions to local motion (diffusion).
4. Conclusions1. The nature of ion mobility was studied in the solid
solutions 50PbF2–30BiF3–20K(Na)F with temperature variation. The introduction of potassium or sodium cations into the fluorite lattice PbF2–BiF3 system caused an improvement of ionic mobility. The observed transformations of 19F NMR spectra were associated with a gradual change in ionic dynamics in the fluoride sublattice with temperature, from the rigid lattice through local ionic motion to a translational diffusion of fluoride ions.
2. The presence of diffusion in the fluoride and sodium sublattices of the studied solid solutions indicated the existence of high ionic conductivity. According to the preliminary data of electro-physical research, conductivity in the solid solutions I and II reached values of ~2×10⁻² – 10–3 S/cm at temperature above 500 K, that allowed to recommend these systems as a basis for the development of new functional materials.
5. Acknowledgment The work was supported by the RFBR project (Grant No.
11-03-00229) and the FEFU project (Grant No. 3.2360.2011).
REFERENCES[1] R. Hagenmuller, J.M. Reau, C. Lucat., S. Matar, G. Villeneuve, “Ionic-
conductivity of fluorite-type fluorides,” Solid State Ionics, vol. 3–4, pp. 341–345, August 1981.
[2] J.M. Reau, P. Hagenmuller, “Fast ionic conductivity of fluorine anions with fluorite- or tysonite-type structures,” Rev. Inorg. Chem., vol. 19, No. 1-2, pp. 45–77, January-June 1999.
[3] P. Berastegui, S. Hull, “Structure and conductivity of some fluoride ion conductors,” Solid State Ionics, vol. 154–155, pp. 605–608, December 2002.
[4] V. Trnovcova, P.P. Fedorov, I. Furar, “Fluoride solid electrolytes,” Rus. J. Electrochem., vol. 45, No. 6, pp. 630-639, June 2009.
[5] N.I. Sorokin, P.P. Fedorov, B.P. Sobolev, “Superionic materials based on lead fluoride,” Inorg. Mater., vol. 33, No. 1, pp. 1-11, January 1997.
[6] C. Lucat, A. Rhandour, J.M. Reau, J. Portier, P. Hagenmuller, “Fast ionic conduction of fluorides with the fluorite-type structure,” J. Solid State Chem., vol. 29, pp. 373 – 377, September 1979.
[7] S. Matar, J.M. Reau, C. Lucat, J. Grannec, P. Hagenmuller, “Synthese et etude des proprietes de conductivite ionique des phases appartenant aux systemes KBiF4 - BiF3 et RbBiF4 - BiF3,” Mater. Res. Bull., vol. 15, pp. 1295–1301, September 1980.
[8] C. Lucat, J. Portier, J.M. Reau, P. Hagenmuller, J.L. Soubeyroux, “Etude par diffraction de neutrons de la solution solide Pb1-xBixF2+x: Correlations entre structure et conductivity ionique,” J. Solid State Chem., vol. 32., No. 3, pp. 279 – 287, May 1980.
[9] P. Darbon, J.M. Reau, P. Hagenmuller, “Evolution des proprietes de transport des solutions solides M1-xM'xF2+x (M = Sr, Pb; M' = Sb, Bi) et M1-xM''xF2+2x (M'' = Zr, Th) pour les faibles taux de substitution,” Solid State Ionics, vol. 2, No. 2, pp. 131 – 138, April 1981.
[10] Y. Ito, K. Koto, S. Yoshikado, T. Ohachi, “Anion disorder and its resulting ionic conductivity of [beta]-Pb1-xBixF2+x (x � 0.30) and [beta]-Pb1-xYxF2+x,” Solid State Ionics, vol. 18–19, pp. 1202 – 1207, January 1986.
[11] M.W. Shafer, G.V. Chandrashekhar, “Fluoride ion conductivity - composition relationships in the fluorite phase region of the KF–BiF3 system,” Solid State Ionics, vol. 5, pp. 629–632, October 1981.
[12] S. Matar, J.M. Reau, J. Grannec, L. Rabardel, “On a low-temperature form of KBiF4,“ J. Solid State Chem., vol. 50, pp. 1–6, November 1983.
[13] G.V. Zimina, P.P. Fedorov, A.Yu. Zamanskaya, B.P. Sobolev, “Solid-phase reaction in the BiF3-KF system,” J. Inorg. Chem., vol. 29, No. 5, pp. 1300 – 1304, May 1984.
[14] E.N. Novikova, P.P. Fedorov, G.V. Zimina, et al., “Structural diagram and conductivity of phases in the NaF-BiF3 system,” J. Inorg. Chem., vol. 26, No. 3, pp. 774–777, March 1981.
[15] J. Senegas, C. Chartier, J. Grannec, “NMR-Study of diffuse phenomena in the phases of the NaF–BiF3 system,” J. Solid State Chem., vol. 49, No. 1, pp. 99–106, August 1983.
[16] M. El Omari, E. Hafidi, M. El Omari, A. Abaouz, A. Yacoubi, J.M. Reau, J. Senegas, “Short-range order and diffusion processes in the Na1�xBixF1+2x anion-excess solid solution,” Mater. Let., vol. 53, pp. 138–144, March 2002.
[17] V.Ya. Kavun, N.F. Uvarov, A.S. Ulihin, A.B. Slobodyuk, E.B. Merkulov, R.M. Yaroshenko, V.K. Goncharuk, “Transport properties of fluoride-type solid solution in the KF-BiF3 and PbF2 – MF- BiF3 systems (M=K, Cs) studied by 19F NMR and conductivity measurements,” Solid State Ionics, in press.
[18] S.P. Gabuda, Yu.V. Gagarinskiy, S.A. Polishchuk, NMR in the Inorganic Fluorides. Moscow, Russia: Atomizdat, 1978.
[19] V.Ya. Kavun, A.B. Slobodyuk, E.A. Tararako, E.Yu. Mikhteeva, V.K. Goncharuk, N.F. Uvarov, V.I. Sergienko, “Synthesis, ion mobility, and superionic conductivity of (1-x)PbF2 – xMFn (M = Li, Na, K, Rb, Cs, Zr) solid solutions,” Inorg. Mater., vol. 41, No. 11, pp. 1388–1396, November 2005.
[20] V.Ya. Kavun, V.I. Sergienko, Diffusion Mobility and Ionic Transport in the Crystalline and Amorphous Fluorides of IV Group Elements and Antimonium (III). Vladivostok, Russia: Dalnauka, 2004.
Copyright © 2012 SciRes. 73

Influence of Waste Materials Containing Tungsten onMelting and Crystallization of Glass-ceramics
Shaomin LinResearch Institute of Environmental Chemistry and
TechnologyHanshan Normal University
Chaozhou, [email protected]
Bo Wang, Guishen Liu, Liqing Li, Xiaodong HouNational Center of Supervision and Inspection for Ceramic,
Sanitary and Plumbing FixtureChaozhou Supervision Testing Institute of Quality and
MetrologyChaozhou, China
Abstract—Influences of waste materials containing tungstenon melting and crystallization of glass-ceramics are discussedin this article. High temperature melting, nucleation andcrystallization of glass-ceramics were explored by means ofDTA, XRD and SEM. The high temperature meltingperformance of glass-ceramics ingredients can be effectivelyimproved by mixing the right amount of waste materialscontaining tungsten. But the additive amount should beproperly controlled, the mixing content of waste materialscontaining tungsten should be a range of 0.5 ~ 2.0 %. In theexperiment of glass-ceramics ingredients system, the moltensoftening temperature of base glass powder reduced about 20
by adding 1 % waste materials containing tungsten, andthe nucleation temperature reduced about 15 . Thenucleation and crystallization performance of glass-ceramicsmineral crystals can be promoted by mixing the right amountof waste materials containing tungsten. That is helpful toimprove the quality of glass-ceramics products.
Keywords-waste materials containing tungsten;glass-ceramics; melting performance; nucleation andcrystallization
1. IntroductionUtilizing industrial wastes and tailings as main raw
materials to manufacture glass-ceramics is of great significancefor the sustainable development of industry, not only caneffectively solve the pollution problem of industrial wastes, andcan realize resource recycling [1, 2]. But in China, theutilization rates of industrial wastes and tailings are much lessthan the developed countries. One important reason is that theindustrial wastes are various and their chemical compositionsand mineral structures are complex. Thus, the physical andchemical properties, composition and structure of industrialwastes must be researched before utilization as resource, inorder to adjust the formula ingredients and the productionprocess in time and avoid the adverse effects in actualproduction[3, 4].
Chaozhou region is the important ceramics industry base inChina, the ceramic production is very large. Ceramicproduction uses a lot of mineral resources, but also causes
many industrial wastes, such as kaolin tailings, etc. Thereasonable utilization of industrial wastes is the urgent need forthe sustainable development of ceramic industry.Glass-ceramics were prepared with kaolin tailings and fly ashas principal raw materials by powder sintering method, and theinfluences of waste materials containing tungsten on meltingand crystallization of glass-ceramics are discussed in thisarticle.
2. Materials and MethodsA. Materials
Industrial materials: kaolin tailings, fly ash and wastematerials containing tungsten.
The samples of kaolin tailings were collected from FTceramics plant and sieved through 60 mesh standard sieve. Thesamples of fly ash were collected from DT power plant andsieved through 200 mesh standard sieve. The chemicalcompositions are shown in Tab. 1.
TABLE I. CHEMICAL COMPOSITIONS OF KAOLIN TAILINGS AND FLY ASH
Sample SiO2Al2O
3
Fe2O3
CaO MgO K2O
Na2O Loss
Kaolintailings
( )73.74 15.10 0.35 0.24 1.16 5.65 1.26 3.28
Fly ash( ) 44.40 36.15 4.92 6.88 1.96 1.00 0.60 3.26
The samples of waste materials containing tungsten werecollected from XL tungsten plant, which using ion exchangerefining production process, and the tungsten content of wastematerials is about 1.97%.
B. Methods1) Preparation of glass-ceramics ingredients: According
to the chemical and mineral compositions of various wastematerials, the right formula system was designed, and theexperimental formula was shown in Tab. 2. The raw materials,such as kaolin tailings, fly ash, CaO, Na2CO3, BaCO3 and ZnO,were weighed according to the proportion of ingredients, andthe waste materials containing tungsten with different contents
�����������������������������������������!�������"� �� �#�����������������$���������������%��������
'( ���������� �� ��������

Figure 1. Comparison of the molten state of A series samples
(a) DTA curve of sample B0
(b) DTA curve of sample B1Figure 2. DTA curves of base glass powder of B series samples
were added respectively. Glass-ceramics ingredients wereprepared after mixed and grinded.
TABLE II. PROPORTIONS OF FORMULA COMPOSITIONS
Kaolintailings
( )
Fly ash( )
CaO( )
Na2CO3
( )BaCO3
( )ZnO( )
70.00 5.81 14.00 4.65 4.65 2.33
2) Preparation of base glass powder: The glass-ceramicsingredients were filled in corundum crucibles and melted inhigh temperature furnace. After heating up to 1420 withheating rate of 5~10 /min, the samples were melted at 1420
for 180 minutes, then were taken out for water-quenchingheat treatment in high temperature melting state. The base glasspowder of glass-ceramics was prepared after grinded andsieved through 20 mesh standard sieve.
3) Differential Thermal Analysis: The samples of baseglass powder were analyzed by DTA (DTA, Model TA-50H),after grinded and sieved through 200 mesh standard sieve.
4) Preparation of glass-ceramics samples: The base glasspowder was filled in corundum moulds and sintered in hightemperature furnace. The glass-ceramics samples wereprepared after the nucleation and crystallization in theappropriate thermal system. The nucleation temperature is inthe range from 920 to 980 , the crystallizationtemperature is in the range from 1130 to 1190 .
5) Samples analysis: The surface microstructure ofglass-ceramics samples was analyzed by SEM (SEM, ModelJSM-6360LA), after soaked in 4% HF solution for 60 secondsand dried. The mineral crystal compositions of glass-ceramicssamples were analyzed by XRD (XRD, Model D8ADVANCE), after grinded and sieved through 200 meshstandard sieve.
3. Results and DiscussionC. Influence of waste materials containing tungsten on high
temperature melting performanceIn order to research the influence of waste materials
containing tungsten on high temperature melting performanceof glass-ceramics ingredients, the raw materials were weighedaccording to the basic formula compositions. The wastematerials containing tungsten were added respectively with 0
, 0.5 , 1 , 2.5 and 5 , and the samples of A0, A1,A2, A3 and A4 were prepared. A series samples were filled inthe divided corundum moulds and melted in high temperaturefurnace at 1380 . Then the molten state of A series sampleswas observed after furnace cooling. The result is shown inFig.1.
Fig.1 shows that A series samples are melted and vitrified.There are a number of bubbles in molten mass of sample A0,and the bubbles reduce gradually from A0 to A2. Although thebubbles in samples A3 and A4 also is less, but the molten masscolor turned into dark brown gradually. That is because theimpurities in waste materials have adverse effect, when theadditive amount is too high. The high temperature meltingperformance of glass-ceramics ingredients can be effectivelyimproved by mixing the right amount of waste materialscontaining tungsten. But the additive amount should beproperly controlled, in order to avoid the adverse effect of theimpurities in waste materials. When the mixing content ofwaste materials containing tungsten is 1 %, the meltingperformance of ingredients system can be improvedeffectively.
D. Influence of waste materials containing tungsten onmolten softening temperature and nucleation temperatureIn order to research the influence of waste materials
containing tungsten on the molten crystallization process ofbase glass powder, the raw materials were weighed accordingto the basic formula compositions. Samples B0 and B1 wereprepared, and sample B1 was added 1 % waste materialscontaining tungsten. The samples of base glass powder of Bseries samples were analyzed by DTA, after melted,water-quenched, grinded and sieved through 200 meshstandard sieve. The results are shown in Fig.2.
Fig.2 shows the DTA curves of base glass powder ofsamples B0 and B1. The molten softening temperature ofsample B1 is about 825 , and that of sample B0 is about 845
. The nucleation temperature of sample B1 is about 885 ,and that of sample B0 is about 899 . After adding 1 % waste
�����������������������������������������!�������"� �� �#�����������������$���������������%��������
���������� �� �������� ')

materials containing tungsten, the molten softeningtemperature of base glass powder reduces about 20 and thenucleation temperature reduces about 15 .
E. Influence of waste materials containing tungsten onnucleation and crystallization behaviorIn order to research the influence of waste materials
containing tungsten on the molten crystallization process ofbase glass powder, the glass-ceramics samples C0 and C1 wereprepared after the nucleation crystallization processing, andsample C1 was added 1 % waste materials containing tungsten.The surface microstructure of glass-ceramics samples C0 andC1 was analyzed by SEM. The results are shown in Fig.3.
Fig.3 shows the SEM photographs of glass-ceramicssamples C0 and C1. Compared to the image of sample C1,there are many undeveloped crystal nucleus existing in theimage of sample C0. The crystal size of sample C1 is largerthan that of sample C0, and the crystal structure is morecompact. It is seen that the nucleation and crystallizationbehavior of glass-ceramics mineral crystals can be promoted bymixing the right amount of waste materials containing tungsten.That is helpful to improve the quality of glass-ceramicsproducts.
The mineral crystal compositions of glass-ceramics samplesC0 and C1 were analyzed by XRD, after grinded and sievedthrough 200 mesh standard sieve. The results are shown inFig.4.
Fig.4 shows the XRD patterns of glass-ceramics samplesC0 and C1. All the peaks were compared with JCPDS files.
(a) SEM photograph of sample C0 (×500)
(b) SEM photograph of sample C0 (×2000)
(c) SEM photograph of sample C1 (×500)
(d) SEM photograph of sample C1 (×2000)Figure 3. SEM photographs of glass-ceramics samples
�����������������������������������������!�������"� �� �#�����������������$���������������%��������
'& ���������� �� ��������

The XRD results show that the main crystalline phase ofglass-ceramics samples C0 and C1 is �-wollastonite. Comparedto the XRD pattern of sample C0, the characteristic peaks ofglass-ceramics sample C1 have higher intensities at 23.2°,25.4°, 26.9° and 30.0°. This once again shows that thenucleation and crystallization behavior of glass-ceramicsmineral crystals can be promoted by mixing the right amountof waste materials containing tungsten.
4. ConclusionsBased on these results, three conclusions can be derived.
3 The high temperature melting performance ofglass-ceramics ingredients can be effectively improvedby mixing the right amount of waste materialscontaining tungsten. But the additive amount should beproperly controlled, in order to avoid the adverse effect
of the impurities in waste materials. The mixingcontent of waste materials containing tungsten shouldbe a range of 0.5 ~ 2.0 %.
3 In the experiment of glass-ceramics ingredientssystem, the molten softening temperature of base glasspowder reduced about 20 by adding 1 % wastematerials containing tungsten, and the nucleationtemperature reduced about 15 . That is of greatsignificance for saving energy and reducingconsumption in the actual production.
3 The nucleation and crystallization performanceof glass-ceramics mineral crystals can be promoted bymixing the right amount of waste materials containingtungsten. That is helpful to improve the quality ofglass-ceramics products.
5. AcknowledgmentThis work was supported by the National Natural Science
Foundation of China (No. 21207027), the Science andTechnology Project of General Administration of QualitySupervision (No. 2008QK277), the Natural ScienceFoundation of Guangdong Province (No. 8452104101001541),the Science and Technology Project of Chaozhou (No.2008S21).
REFERENCES[1] Peixin Zhang, Qiye Wen, Jianhong Liu, Qianling Zhang, and
Xiangzhong Ren. Research progress in slag glass-ceramics [J]. MaterialsReview, 2003, 17(9): 46.
[2] Laiguang Hou, and Lingke Zeng. The current situation in comprehensiveutilization of ceramic waste [J]. China Ceramic Industry, 2005, 12(4):41-44.
[3] Liqing Li, Shuchao Zhang, Zhuangdun Lin, and Shaomin Lin. Influenceof particle size distribution of ingredients on melting behavior ofglass-ceramics [J]. Guangdong Chemical Industry, 2011, 38(8):256-257.
[4] Bo Wang, Weipo Liu, Xiaodong Hou, and Shaomin Lin. Influence ofingredient components on melting behavior of glass-ceramics [J].Guangdong Chemical Industry, 2011, 38(9): 226-227.
[5] Jinshu Cheng, Hong Li, and Liying Tang. Glass-ceramics(in Chinese).Beijing: Chemical Industry Press, 2006.
[6] Huidan Zeng, Zaide Deng, and Tingzhao Ying. Process principle andtechniques for sintered glass-ceramics of wollastonite system [J].Materials Review, 2000, 12(12): 26-28.
[7] Qin Jiang, Lei Lu, Wei Dong, Ying Zhao, and Lejun Zhang. Design forcomposition of multi-tailings slag glass ceramics and analysis ofmicrostructure [J]. Multipurpose Utilization of Mineral Resources, 2006,(5): 31-34.
[8] Xiaoping Feng, Feng He, and Lihua Li. Research on crystallizationbehavior of CaO-Al2O3-SiO2 system glass-ceramics [J]. Journal ofWuhan University of Technology, 2001, (11): 22-24.
[9] Feng He, Qiantao Li, Jinshu Cheng, and Wangkai Hu. Influencingfactors of the high temperature fluidity of CaO-Al2O3-SiO2 systemsintering building glass-ceramic powder [J]. Bulletin of the ChineseCeramic Society, 2004, (2): 93-95.
[10] M. Erol, S. Küçükbayrak, and A. Ersoy-Meriçboyu. Comparison of theproperties of glass, glass-ceramic and ceramic materials produced fromcoal fly ash [J]. Journal of Hazardous Materials, 2008, 153(1): 418-425.
(a) XRD pattern of sample C0
(b) XRD pattern of sample C1Figure 4. XRD patterns of glass-ceramics samples
�����������������������������������������!�������"� �� �#�����������������$���������������%��������
���������� �� �������� ''

Impacts of melt spinning and element substitution on electrochemical characteristics of the La–Mg–Ni-based A2B7-
type alloys
Yang-huan Zhang, Hong-wei Shang, Ying Cai, Zhong-hui Hou, Guo-fang Zhang
Key Laboratory of Integrated Exploitation of Baiyun Obo Multi-Metal Resources
Inner Mongolia University of Science and Technology Baotou, China
[email protected], [email protected], [email protected], [email protected],[email protected]
Yang-huan Zhang, Hong-wei Shang, Guo-fang Zhang, Dong-liang Zhao
Department of Functional Material Research Central Iron and Steel Research Institute
Beijing, China [email protected], [email protected],
[email protected], [email protected]
Abstract—The partial substitution of Zr for La has been performed in order to ameliorate the electrochemical hydrogen storage performances of La–Mg–Ni based A2B7-type electrode alloys The melt spinning technology was used to prepare the La0.75�xZrxMg0.25Ni3.2Co0.2Al0.1 (x=0, 0.05, 0.1, 0.15, 0.2) electrode alloys. The impacts of the melt spinning and the substituting La with Zr on the structures and the electrochemical hydrogen storage characteristics of the alloys were systemically investigated. The analysis of XRD and TEM reveals that the as-cast and spun alloys have a multiphase structure, composing of two main phases (La, Mg)2Ni7 and LaNi5 as well as a residual phase LaNi2. The electrochemical measurement indicates that both the substitution of Zr for La and the melt spinning ameliorate the electrochemical cycle stability of the alloys dramatically. Furthermore, the high rate discharge ability (HRD) of the as-spun (10 m/s) alloys notably declines with growing the amount of Zr substitution, while it first augments and then falls for the (x=0.1) alloy with rising the spinning rate.
Keywords-A2B7-type alloy; Substituting La with Zr; Melt-spinning; Electrochemical characteristics
1. IntroductionWith rapid development of electric equipments, the
requirement for new electrode materials with superior performances, especially high discharge capacity and electrochemical hydrogen storage kinetics, has become more and more pressing. The rare earth-based AB5-type alloys, although have been industrialized in large scale in China and Japan, are suffering a severe frustration on account of their limited discharge capacity of about 330 mAh/g. La–Mg–Ni-system AB3 and A2B7-type alloys have been considered to be the most promising candidates as the negative electrode materials of Ni–MH rechargeable battery in virtue of their higher discharge capacities (380–410 mAh/g) and low
production costs since Kadir et al. [1] and Kohno et al. [2] reported their research results. The National High Technology Research and Development Program of China (for short "863" Program) provides powerful financial support in order to promote the industrialization of these new-type alloys. Such a lot of efforts have been dedicated to realizing this target and dramatic progress has been achieved, about which Liu et al. have published a perfect summarization recently [3, 4]. However, the Chinese researchers in this area were deeply frustrated by a fact that the production of the new type alloys as the negative electrode in Ni–MH battery has not been found in China as a result of little poor electrochemical cycle stability of the electrode alloys. A serious challenge faced by researchers keeps intact, enhancing the cycle stability of the alloy without reducing its discharge capacity.
The element substitution has been regarded as one of the effective methods for improving the overall properties of the hydrogen storage alloys. In addition, the preparation technology is also extremely important for improving the performances of the alloys. Therefore, it is expected that the combination of an optimized amount of Zr substitution with a proper melt spinning technique may yield an alloy with high discharge capacity and good cycling stability. The A2B7-type La0.75�xZrxMg0.25Ni3.2Co0.2Al0.1 (x=0-0.2) alloys were prepared by melt spinning, and a systematic investigation on the effects of the substitution of Zr for La and the melt spinning on the electrochemical cycle stability and kinetics of the electrode alloys has been performed.
2. Experimental The chemical compositions of the alloys were La0.75-
xZrxMg0.25Ni3.2Co0.2Al0.1 (x=0, 0.05, 0.1, 0.15, 0.2). For convenience, the alloys were denoted with Zr content as Zr0, Zr0.05, Zr0.1, Zr0.15 and Zr0.2, respectively. The alloy ingots were prepared using a vacuum induction furnace in a helium atmosphere under a pressure of 0.04 MPa. A part of the as-cast alloys was re-melted and spun by melt-spinning with a rotating copper roller. The spinning rate was approximately expressed
Supported by National Natural Science Foundations of China (51161015and 50961009), National 863 plans projects of China (2011AA03A408), Natural Science Foundation of Inner Mongolia, China (2011ZD10 and 2010ZD05).
Advances in Materials Physics and Chemistry Supplement: 2012 world Congress on Engineering and Technology
78 Copyright © 2012 SciRes.

by the linear velocity of the copper roller. The spinning rates used in the experiment were 5, 10, 15 and 20 m/s, respectively.
The phase structures and compositions of the as-cast and spun alloys were characterized by XRD (D/max/2400). The thin film samples of the as-spun alloys were prepared by ion etching for observing the morphology with HRTEM (JEM-2100F).
The round electrode pellets in a 15 mm diameter were prepared by cold pressing a mixture of alloy powder and carbonyl nickel powder in the weight ratio of 1:4 under a 35 MPa pressure. After dried for 4 h, the electrode pellets were immersed in a 6 M KOH solution for 24 h in order to wet the electrodes fully before the electrochemical measurement.
Electrochemical measurements were performed at 30°C by using a tri-electrode open cell, consisting of a working electrode (the metal hydride electrode), a sintered Ni(OH)2/NiOOH counter electrode and a Hg/HgO reference electrode, which were immersed in a 6M KOH electrolyte. The voltage between the negative electrode and the reference electrode was defined as the discharge voltage. In every cycle, the alloy electrode was firstly charged with a constant current density of 300 mA/g. After resting 15 min, it was discharged at the same current density to cut-off voltage of –0.500 V.
The electrochemical impedance spectra (EIS), the hydrogen diffusion in alloy bulk and the Tafel polarization curves of the alloys were measured by an electrochemical workstation (PARSTAT 2273). The EIS of the alloy electrodes were measured in the frequency range from 10 kHz to 5 mHz at 50% depth of discharge (DOD). The Tafel polarization curves were measured in the potential range of –1.2 to +1.0 V (vs. Hg/HgO) with a scan rate of 5 mV/s also at 50% depth of discharge. For the potentiostatic discharge, the test electrodes in the fully charged state were discharged at 500 mV potential steps for 5000s, using the electrochemistry corrosion software (CorrWare).
3. Results and discussion A. Structural characteristics
The XRD patterns of the as-cast and spun La0.75-xZrx Mg0.25Ni3.2Co0.2Al0.1 (x=0-0.2) alloys are presented in Figure 1. It is evident that the melt spinning and Zr substitution bring on an obvious broadening of the major diffraction peaks of the alloys, to be ascribed to the refined grain and the stored stress in the grains by melt spinning and Zr substitution. It is found that the as-cast and spun alloys hold a multiphase structure, composing of two major phases (La, Mg)2Ni7 and LaNi5 as well as a residual phase LaNi2. The structures of the alloys maintain almost unaltered after partially substituted by Zr. The lattice parameters together with the abundances of the (La, Mg)2Ni7 and LaNi5 major phases in the alloys, which were calculated by Jade 6.0 software based on the XRD data, are listed in Table 1. It is found that the Zr substitution arouses an increase of the LaNi5 phase and a decrease of the (La, Mg)2Ni7 phase. Meanwhile, it also leads to a decrease of the lattice constants and cell volume of the two major phases, which is due to the fact that the atom radius of Zr is smaller than that of
La. Furthermore, the shrink of the cell volume, incurred by the substitution, justifies the successful alloying of Zr with (La, Mg)2Ni7 and LaNi5 major phases.
Figure 1. XRD profiles of the as-cast spun alloys: (a) Zr0.1, (b) As-spun (10 m/s)
Table1. Lattice parameters, abundances of LaNi5 and (La, Mg)2Ni7 major
phases
The TEM micrographs of the as-spun (10 m/s) La0.75-xZrx Mg0.25Ni3.2Co0.2Al0.1 (x=0-0.2) alloys are demonstrated in Figure 2. It can be seen from Figure 2 that the change of the morphologies of the alloys seems to be equivocal with the various of Zr content. However, the amplified morphologies of Figure 2 reveal that the as-spun Zr0 and Zr0.1 alloys display an entire crystalline structure. And some crystal defects such as
Lattice constants
Cellvolume
Phase abund-
anceSpinning rate Alloys Major
phasesA(nm) C(nm) V (nm3) (wt.%)
(La, Mg)2Ni7
0.5199 2.4406 0.5712 72.31 Zr0
LaNi5 0.5192 0.4180 0.0976 25.24 (La,
Mg)2Ni70.5142 2.4362 0.5578 66.03
Zr0.05 LaNi5 0.5130 0.4107 0.0936 31.02
(La, Mg)2Ni7
0.5071 2.4308 0.5413 64.25 Zr0.1
LaNi5 0.5059 0.4082 0.0905 34.08
(La, Mg)2Ni7
0.5031 2.4251 0.5315 60.97 Zr0.15
LaNi5 0.5011 0.4053 0.0881 36.50 (La,
Mg)2Ni70.4963 2.4174 0.5156 58.02
10 m/s
Zr0.2 LaNi5 0.4933 0.4021 0.0847 39.32
Copyright © 2012 SciRes. 79

subgrains and grain boundaries can be seen clearly. It is evident that Zr0.2 alloy displays an obvious amorphous-like structure, and the nanocrystalline region, the amorphous region as well as the transition region can be clearly viewed from the amplified morphology of Figure 2 (c), which seems to be conflicting with the result in Figure 1 due to no amorphous phase is detected by XRD observation. One probable reason is that the amorphous-like phase forms at some selective locations in the as-spun alloy and its amount is very small, thus, the XRD patterns could not detect its presence.
B. Electrochemical cycle stability and kinetics The capacity retaining rate (RN) is introduced as a token of
the electrochemical cycle stability of an alloy electrode, which is defined as RN=CN/Cmax ×100%, where Cmax is the maximum discharge capacity while CN is the discharge capacity at the nth charging–discharging cycle with a current density of 300 mA/g, respectively. The evolution of the capacity retaining rates (RN) of the La0.75-xZrxMg0.25Ni3.2Co0.2 Al0.1 (x=0-0.2) alloys with the cycle number is described in Figure 3. The slopes of the curves in Figure 3 prefigure the degradation rate of the discharge capacity during the charge-discharge cycling. The smaller the slope of the curve is, the better the cycle stability of the alloy will be. It is evident that the degradation rate of the discharge capacity of the alloys visibly declines with rising the spinning rate and the Zr content. In order to establish the relationship between the capacity retaining rates (RN) with the spinning rate and the Zr content, taking the capacity retaining rate (R100) at 100th cycling as a benchmark, the evolution of the R100 of the alloys with the spinning rate and the amount of Zr substitution is also inserted in Figure 3. It is found that the R100 values of the alloys markedly augment with growing the spinning rate and the Zr content. The R100 value of the Zr0.1 alloy grows from 73.21% to 82.07% as the spinning rate increases from 0 (as-
cast was defined as the spinning rate of 0 m/s) to 20 m/s and that of the as-spun (10 m/s) alloys augments from 69.25% to 83.09% as Zr content rises from 0 to 0.2.
It is convinced that the pulverization and oxidation of the alloy during charging-discharging cycle are the fundamental reason for the capacity decay of the electrode alloy. The lattice stress and the expansion of the cell volume, which are inevitable when hydrogen atoms entering into the interstitials of the lattice, are the real driving force lead to the pulverization and oxidation. The positive impact of the melt spinning on the cycle stability of the alloy is primarily ascribed to the remarkable refinement of the grains induced by melt spinning. The anti-pulverization capability of the alloy basically depends on its grain size. Therefore, it is understandable that the cycle stability of the alloy increases with growing the spinning rate. The benefaction of the Zr substitution on the cycle stability of the as-spun alloys is primarily ascribed to the formation of an amorphous phase induced by the melt spinning due to an amorphous phase improves not only anti-pulverization ability but also anti-corrosion and anti-oxidation abilities of the alloy electrode in a corrosive electrolyte [5].
The electrochemical hydrogen storage kinetics of an alloy electrode, which has been considered to be quite important for the practical application of hydride electrode in power battery, is symbolized by its high rate discharge ability (HRD), being calculated by formula: HRD=Ci /C100 ×100%, where Ci and C100 are the maximum discharge capacities of the alloy electrode charged-discharged at the current densities of i and 100 mA/g respectively. The current density dependence of the HRD values of the alloys is illustrated in Figure 4. In order to establish the relationship between the electrochemical hydrogen storage kinetics of the alloys with the spinning rate and the amount of Zr substitution, taking the 900 mA/g current density as a benchmark to calculate the HRD of the alloys, the
Fig y, ure 2. TEM micrographs of the as-spun (10 m/s) alloys: (a) Zr0 allo(b) Zr0.1 alloy, (c) Zr0.2 alloy
Figure 3. Evolution of the capacity retaining rates (RN) of the alloys with the cycle number: (a) Zr0.1 alloy, (b) As-spun (10 m/s)
80 Copyright © 2012 SciRes.
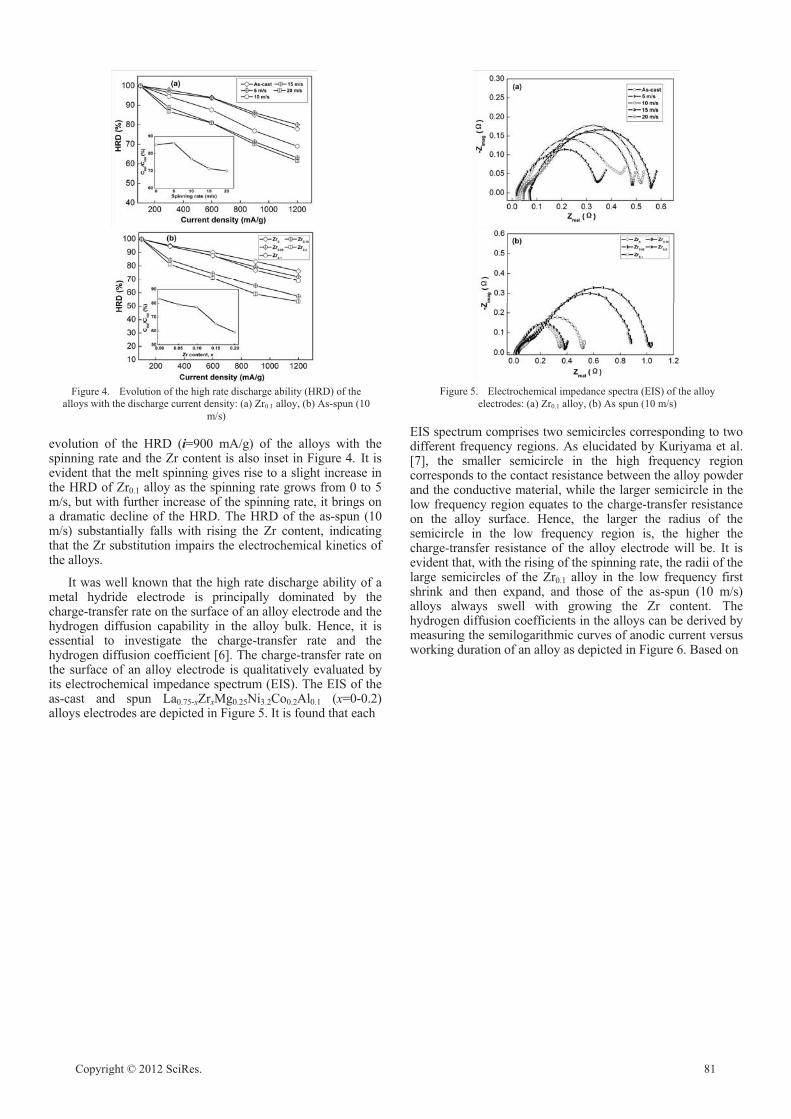
Figure 4. Evolution of the high rate discharge ability (HRD) of the alloys with the discharge current density: (a) Zr0.1 alloy, (b) As-spun (10
m/s)
Figure 5. Electrochemical impedance spectra (EIS) of the alloy electrodes: (a) Zr0.1 alloy, (b) As spun (10 m/s)
evolution of the HRD (i=900 mA/g) of the alloys with the spinning rate and the Zr content is also inset in Figure 4. It is evident that the melt spinning gives rise to a slight increase in the HRD of Zr0.1 alloy as the spinning rate grows from 0 to 5 m/s, but with further increase of the spinning rate, it brings on a dramatic decline of the HRD. The HRD of the as-spun (10 m/s) substantially falls with rising the Zr content, indicating that the Zr substitution impairs the electrochemical kinetics of the alloys.
It was well known that the high rate discharge ability of a metal hydride electrode is principally dominated by the charge-transfer rate on the surface of an alloy electrode and the hydrogen diffusion capability in the alloy bulk. Hence, it is essential to investigate the charge-transfer rate and the hydrogen diffusion coefficient [6]. The charge-transfer rate on the surface of an alloy electrode is qualitatively evaluated by its electrochemical impedance spectrum (EIS). The EIS of the as-cast and spun La0.75-xZrxMg0.25Ni3.2Co0.2Al0.1 (x=0-0.2) alloys electrodes are depicted in Figure 5. It is found that each
EIS spectrum comprises two semicircles corresponding to two different frequency regions. As elucidated by Kuriyama et al. [7], the smaller semicircle in the high frequency region corresponds to the contact resistance between the alloy powder and the conductive material, while the larger semicircle in the low frequency region equates to the charge-transfer resistance on the alloy surface. Hence, the larger the radius of the semicircle in the low frequency region is, the higher the charge-transfer resistance of the alloy electrode will be. It is evident that, with the rising of the spinning rate, the radii of the large semicircles of the Zr0.1 alloy in the low frequency first shrink and then expand, and those of the as-spun (10 m/s) alloys always swell with growing the Zr content. The hydrogen diffusion coefficients in the alloys can be derived by measuring the semilogarithmic curves of anodic current versus working duration of an alloy as depicted in Figure 6. Based on
Copyright © 2012 SciRes. 81

the model founded by White et al. [8], the diffusion coefficient (D) of the hydrogen atoms in the bulk of the alloy can be calculated by following formulae:
� taDCC
daFDi s 2
2
02 303.2)(6loglog ��4
56
789 �� �� ����
�dt
idaD log303.22
2
�� �� ����
In (2), dt
id log is the slope of the linear region of Figure 6,
which can be gained by origin 7.5 software in a walk. The alloy particle radius (a) is supposed to be a=15 �m. Thus, hydrogen diffusion coefficient D can be easily obtained, and the results are also presented in Figure 6. It is evident that with the rising of the spinning rate, the D values of the Zr0.1 alloy first mount up and then fall, and those of the as-spun (10 m/s) alloys monotonously drop with rising the Zr content.
The limiting current density (IL), another important electrochemical kinetics parameter which is mainly dominated by the hydrogen diffusion in the bulk of the alloy during anodic polarization [9], can be obtained by measuring the Tafel polarization curves of an alloy. The Tafel polarization curves of La0.75-xZrxMg0.25Ni3.2Co0.2Al0.1 (x=0-0.2) alloys are depicted in Figure 7, from which a clear inflection point in each anodic polarization curve can be seen, there being a limiting value of the current density which is defined as limiting current density (IL). It indicates that an oxidation reaction took place on the surface of the alloy electrode, and the generated oxidation product resists further penetration of hydrogen atoms [10]. The IL values of the alloys as a function of the spinning rate and the Zr content are also inset in Figure 7. It is visible that the IL values of the Zr0.1 alloy first rise and then decline, and those of the as-spun (10 m/s) alloys always decrease with growing the Zr content.
Based on the investigation of the electrochemical kinetics,
some elucidations can be provided as the reasons why the HRD of the Zr0.1 alloy has a maximum value with the variation of the spinning rate. Upon the refined microstructure by melt spinning, a lot of new crystallites and grain boundaries are generated, which may act as the fast diffusion paths for hydrogen absorption [11], enhancing the HRD of the alloy. However, it must be mentioned that the refinement of the grains resulted from the melt spinning severely impairs the charge-transfer rate on the alloy surface due to the fact that the refined grains effectively prohibit the pulverization of the alloy particles, a lower new surface of the alloy electrode being formed, decreasing the rate of charge transfer at the alloy-electrolyte interface. It is the above-mentioned contrary impacts engendered by melt spinning that lead to a maximum HRD of the alloys. Furthermore, the decreased HRD of the as-spun (10 m/s) alloys by Zr substitution is ascribed to the formation of a amorphous-like structure which not only increases the charge-transfer resistance of the alloy electrodes but also hinders the hydrogen diffusion from inner of the bulk to the surface, and subsequently results in the drop of the electrochemical kinetic property.
Figure 7. Tafel polarization curves of the as-cast and spun alloys: (a) Zr0.1 alloy, (b) As-spun (10 m/s) Figure 6. Semilogarithmic curves of anodic current vs. time responses
of the alloys: (a) As-spun (10 m/s), (b) Zr0.15 alloy
4. ConclusionsThe La-Mg-Ni system A2B7-type La0.75-xZrxMg0.25Ni3.2Co0.2
Al0.1 (x=0, 0.05, 0.1, 0.15, 0.2) electrode alloys were successfully synthesized by melt spinning. The as-spun Zr0 alloy exhibits an entire nanocrystalline and micro-crystalline structure, whereas the as-spun alloy substituted by Zr exhibits a amorphous-like structure. Both the melt spinning and the substitution of Zr for La markedly enhance the electrochemical cycle stability of the electrode alloys. The electrochemical kinetics, including the HRD, the hydrogen diffusion coefficients (D) as well as the limiting current density (IL) of the Zr0.1 alloy first increase and then decline with growing the spinning rate, and those of the as-spun (10 m/s) alloys
82 Copyright © 2012 SciRes.

monotonously fall with rising the Zr content, for which the refinement of the grains and the formation of the amorphous-like structure are principally responsible.
5. Acknowledgment This work is supported by National Natural Science
Foundations of China (51161015 and 50961009), National 863 plans projects of China (2011AA03A408), Natural Science Foundation of Inner Mongolia, China (2011ZD10 and 2010ZD05).
REFERENCES
[1] K. Kadir, T. Sakai, I. Uehara, “Synthesis and structure determination of a new series of hydrogen storage alloys: RMg2Ni9 (R=La, Ce, Pr, Nd, Sm and Gd) built from MgNi2 Laves-type layers alternating with AB5 layers,” J. Alloys Compd., vol. 257, pp. 115–121, 1997.
[2] T. Kohno, H. Yoshida, F. Kawashima, T. Inaba, I. Sakai, M. Yamamoto, and et al., “Hydrogen storage properties of new ternary system alloys: La2MgNi9, La5Mg2Ni23, La3MgNi14,” J. Alloys Compd., vol. 311, pp. L5–L7, 2000.
[3] Y.F. Liu, H. Pan, M. Gao and Q. Wang, “Advanced hydrogen storage alloys for Ni/MH rechargeable batteries,” J. Mater. Chem, vol. 21, pp. 4743–4755, 2011.
[4] Y.F. Liu, Y.H. Cao, L. Huang, M.X. Gao, H.G. Pan, “Rare earth–Mg–Ni-based hydrogen storage alloys as negative electrode materials for Ni/MH batteries,” J. Alloys Compd., vol. 509, pp. 675–686, 2011.
[5] Y.H. Zhang, B.W. Li, H.P. Ren, Y. Cai, X.P. Dong, X.L. Wang, “Investigation on structures and electrochemical performances of the as-cast and -quenched La0.7Mg0.3Co0.45Ni2.55–xFex (x=0–0.4) electrode alloys,” Int. J. Hydrogen Energy, vol. 32, pp. 4627–4634, 2007.
[6] A. Gasiorowski, W. Iwasieczko, D. Skoryna, H. Drulis, and M. Jurczyk, “Hydriding properties of nanocrystalline Mg2�xMxNi alloys synthesized by mechanical alloying (M=Mn, Al),” J. Alloys Compd., vol. 364, pp. 283–288, 2004.
[7] N. Kuriyama, T. Sakai, H. Miyamura, I. Uehara I, H, Ishikawa, T. Iwasaki. “Electrochemical impedance and deterioration behavior of metal hydride electrodes,” J. Alloys Compd., vol. 202, pp. 183–197, 1993.
[8] G. Zhong, B.N. Popov, and R.E.White, “Electrochemical Determination of the Diffusion Coefficient of Hydrogen Through an LaNi4.25Al0.75 Electrode in Alkaline Aqueous Solution,” J. Electrochem. Soc., vol. 142, pp. 2695–2698, 1995.
[9] B.V. Ratnakumar, C. Witham, JR. R.C. Bowman, A. Hightower, and B. Fultz, “Electrochemical studies on LaNi5–xSnx metal hydride alloys,” J. Electrochem. Soc., vol. 143, pp. 2578–2584, 1996.
[10] X.Y. Zhao, Y. Ding, L.Q. Ma, L.Y. Wang, M. Yang, and X.D. Shen, “Electrochemical properties of MmNi3.8Co0.75Mn0.4Al0.2 hydrogen storage alloy modified with nanocrystalline nickel,” Int. J. Hydrogen Energy, vol. 33, pp. 6727–6733, 2008.
[11] Y. Wu, W. Hana, S.X. Zhou, M.V. Lototsky, J.K. Solberg, V.A. Yartys, “Microstructure and hydrogenation behavior of ball-milled and melt-spun Mg–10Ni–2Mm alloys,” J. Alloys Compd., vol. 466, pp. 176–181, 2008.
Copyright © 2012 SciRes. 83

Laser Deposition of Tetrasulfonated Phthalocyanine Layers for Gas Sensors
Premysl Fitla, Martin Vrnataa, Dusan Kopeckya, Jan Vlceka, Jitka Skodovaa, Jaroslav Hofmanna, Vladimir Myslikb aDepartment of Physics and Measurement
bDepartment of Solid-State Engineering Institute of Chemical Technology
Technicka 5, Prague 6, CZ - 166 28, Czech Republic [email protected]
Abstract—Thin layers of nickel and copper tetrasulfonated phthalocyanines (NiPcTS and CuPcTS) were prepared by Matrix Assisted Pulsed Laser Evaporation method. The depositions were carried out with KrF excimer laser (energy density of laser radiation EL = 0.1 to 0.5 J.cm-2) from dimethylsulfoxide matrix. For both materials the ablation threshold EL-th was determined. The following properties of deposited layers were characterized: a) chemical composition (FTIR spectra); b) morphology (SEM and AFM portraits); c) impedance of gas sensors based on NiPcTS and CuPcTS layers in the presence of two analytes - hydrogen and ozone. The prepared sensors exhibit response to 1000 ppm of hydrogen and 100 ppb of ozone even at laboratory temperature.
Keywords-Matrix Assisted Pulsed Laser Evaporation; substituted phthalocyanines; gas sensors; impedance measurement
1. IntroductionMatrix Assisted Pulsed Laser Evaporation (MAPLE),
introduced by Piqué et al. in 1999, is one of the experimental laser deposition methods used for deposition of thin uniform films of organic [1] and even biological materials [2].
MAPLE is characterized by indirect contact of the laser radiation with deposited material. The target used for MAPLE consists of two substances; each has a different function during the deposition process. The first one is the deposited material itself, the second is a matrix, which has majority representation (approximately 95% of target) and has usually a character of low molecular weight volatile solvent of the deposited material. Both substances are mixed together and frozen to liquid nitrogen temperature to suppress sublimation of the matrix at low temperature. In case of correct setting of the deposition conditions, all the energy of laser pulse is absorbed by matrix. The matrix has two functions: (i) it protects the environment of a fragile deposited material from high-energy laser radiation and (ii) serves as an energy transmitter from electromagnetic radiation to kinetic energy of the molecular oscillation motion, which causes ablation of a deposited material to a plasma state and its subsequent
deposition. Selection of a suitable matrix is therefore essential for successful and non-destructive deposition of a material.
Figure 1. Principle of MAPLE method.
The mechanism of MAPLE deposition is shown in Fig.1. Frozen target is placed in a vacuum and impinged by pulses of laser radiation, whose energy is absorbed preferentially by the matrix, which leads to local overheating of the frozen target, followed by abrupt release of the matrix – so-called surface ablation of target. Through collective collisions, matrix molecules pull the molecules of the deposited material and impart them sufficient kinetic energy required to overcome the target-substrate distance. Large molecules of the deposited material have lower vapor pressure than volatile small molecules of matrix and therefore they are less often pumped away by vacuum system; so the substrate is gradually covered with a thin layer of deposited material with minimum content of matrix molecules.
The most significant group of chemical gas sensors operates on the basis of ability of thin semiconductive layers (=sensitive layers) to chemisorb various gaseous analytes on their surfaces with subsequent exchange of electrons between analyte and sensitive layer [3]. While reducing gases posses ability to act as electron donors, the oxidizing ones are electron acceptors, i.e. they extract electrons from the sensitive layer. At present, some classes of organic substances (conducting polymers [4], complexes of organic ligands with metallic cation [5] etc.) are intensively investigated as
Advances in Materials Physics and Chemistry Supplement: 2012 world Congress on Engineering and Technology
84 Copyright © 2012 SciRes.

prospective materials for sensitive layers. In general, the suitable materials can be characterized as organic molecules containing conjugated system of double bonds, where {-electrons form delocalised and highly polarizable system which exhibits ability to enter reversible interaction with the analyte.
Among organocomplexes, both phthalocyanines and substituted phthalocyanines are known to be excellent materials for gas sensing [6], [7]. However, when one selects proper method for depositing sensitive layer, there is a significant difference between them: while phthalocyanines are almost insoluble in all solvents, some of their substituted derivatives exhibit a good solubility in low molecular solvents. Due to this fact substituted phthalocyanines (unlike non-substituted ones) can be deposited by MAPLE method.
The presented paper deals with preparation of gas sensor sensitive layers based on tetrasulfonated phthalocyanines (NiPcTS and CuPcTS). The depositions were carried out from dimethylsulfoxide matrix by MAPLE method, providing tool for gentle, non-destructive and easily adjustable grown of organic materials. Responses of prepared sensors to hydrogen and ozone are also presented.
2. ExperimentalA. Deposition�of�NiPcTS�and�CuPcTS�thin�layers�by�MAPLE�method�In our experiments MAPLE instrumentation was carried
out as follows: Powder of NiPcTS or CuPcTS (Sigma-Aldrich) was diluted in dimethylsulfoxide matrix to obtain solution containing 0.2 weight%. Dimethylsulfoxide matrix was recently proved to be proper for depositions with KrF excimer laser [8]. After sonification the resulting solution was filtered and then frozen by liquid nitrogen. The freezing process proceeded in a tubular mould so as to produce targets for MAPLE in the form of tablets (approx. 40 mm in diameter and 10 mm thick). Then the deposition conditions were set (KrF excimer laser operating at 248 nm; energy density of laser radiation EL ranging from 0.1 to 0.5 J.cm-2; repetition rate of laser pulses frep = 10 Hz, pulse duration 15 ns; residual pressure in the deposition chamber 10-4 Pa; working atmosphere during depositions was 3 Pa of nitrogen; target-substrate distance 35 mm).
B. Characterization�of�chemical�composition��and�morphology�of�the�layers�Chemical composition of the deposited layers was
analyzed from the IR spectra scanned by the Attenuated Total Reflection Fourier Transform Infrared spectroscopy (ATR FTIR). The spectra were scanned using a BRUKER IFS 66 V device (diamond crystal) in the interval of wavenumbers from 600 to 1800 cm-1covering finger-print of MePcTS molecules.
The surface morphology of the samples deposited on polished silicon wafer was acquired using Atomic Force
Microscopy (AFM). The AFM images were taken on Veeco Digital Instruments CP II apparatus. For sample characterization, ‘Tapping mode’ rather than ‘Contact mode’ was chosen to minimize damage to the sample surfaces. A Veeco oxide-sharpened silicon probe RTESPA-CP attached to a flexible microcantilever was used at its resonant frequency of 300 kHz. The image resolution was 256×256 pixels. Layers morphology was further characterized by Scanning Electron Microscopy (SEM) with JEOL JSM-7500F instrument.
C. Measuring�of�gas�sensor�response�In order to test gas sensing properties the layers were
deposited onto alumina sensors substrates (2.0 x 2.5 mm2) equipped with interdigital electrodes (Fig.2). The sensor impedance was measured in "pure" synthetic air (as a reference atmosphere) and in synthetic air containing 1000 ppm of hydrogen or 100 ppb of ozone respectively. The impedance measurements were performed with a HP4192LF impedance analyser with frequency of testing signal from 15 Hz to 10 MHz and amplitude remained constant at 100 mV. The obtained data were represented as Nyquist diagrams - i.e. they are plotted as imaginary part of complex impedance vs. real part of complex impedance with frequency of testing signal as a parameter. From Nyquist diagrams the so called phase-angle sensitivity Spa [deg.] of sensors was evaluated. The detailed definiton of Spa is in [9], [10] and see also Fig.3.
3. Results and Discussion D. Determination�of�ablation�threshold�
The depositions made by KrF laser in the range of energy density of laser radiation from 0.1 to 0.6 J·cm-2 can be assembled into a dependence of growth rate on laser fluence, known as the ablation curve (Fig.4). On basis of these curves, the ablation thresholds EL-th were determined to be EL-th ~ 0.2 J·cm-2 for NiPcTS and EL-th ~ 0.3 J·cm-2 for CuPcTS. Ablation
Figure 2. Sensor substrate - front side with interdigital electrodes (left);
back side with resistance heating (right).
Identify applicable sponsor/s here. (sponsors)
Copyright © 2012 SciRes. 85

Figure 3. A typical Nyquist diagram of gas sensor with MePcTS
sensitive layer in synthetic air (reference) and measured gas (1000 ppm of hydrogen). In this example phase-angle sensitivity Spa is evaluated as a
difference of sensor impedance arguments (� angle) for 1 MHz frequency of testing signal.
Figure 4. Ablation curves for NiPcTS (top) and CuPcTS (bottom).
threshold is a parameter important from the practical point of view, as it corresponds to energy density sufficient for effective layer grown on one side, while there is no excessive photo- and heat- stress of deposited material on the other side.
E. FTIR�spectra�of�source�substances�and�deposited�layers�Infrared spectra of source substances were compared to
those of deposited materials (Fig.5 a,b and Fig. 6a,b) in order to evaluate the degree of material decomposition during MAPLE process. Both materials were deposited at energy densities corresponding to their ablation threshold. Analyzing spectra of
Figure 5a,b. FTIR spectrum of NiPcTS: source material (a); layer
deposited at EL-th = 0.2 J·cm-2 (b).
Figure 6a,b. FTIR spectrum of CuPcTS: source material (a); layer deposited at EL-th = 0.3 J·cm-2 (b).
source materials (Figs. 5a and 6a) one may notice that absorbtion bands are rather wide. This phenomenon can be attributed to occurrence of traces of mono-, di- and tri- sulfonated phthalocyanines in commercially distributed metal tetrasulfonated phthalocyanines (MePcTS). Nevertheless, it is apparent, that in both cases the transfer of material by MAPLE method was nondestructive, as the positions and in most cases also amplitudes of absorbtion maxima are retained when comparing Fig.5a with 5b or Fig.6a with 6b. An overview of absorption bands of phthalocyanines is summarized in [11].
F. Layers�morphology�The layers deposited at ablation thresholds were also
studied by SEM (Fig.7) and AFM (Fig.8) methods. The portraits resulting from these methods reveal that the structure of MAPLE deposited layer is rather segmented with large relative surface; these properties are favourable for applications in gas sensing (the detection process is localized on the surface of sensitive layer).
Figure 7. SEM portraits of NiPcTS (left) and CuPcTS (right).
86 Copyright © 2012 SciRes.

Figure 8. AFM portrait of NiPcTS.
G. Impedance�measurements�and�phase�angle�sensitivity��The NiPcTS and CuPcTS layers were deposited to sensor
substrates, the impedance of obtained structures was measured and phase-angle (Spa) sensitivity to 1000 ppm of hydrogen and 100 ppb of ozone evaluated. The results are summarized in sequention of Figs. 9-12.
Figure 9. Phase-angle sensitivity of NiPcTS to 1000 ppm of hydrogen.
Figure 10. Phase-angle sensitivity of NiPcTS to 100 ppb of ozone.
Figure 11. Phase-angle sensitivity of CuPcTS to 1000 ppm of hydrogen.
Figure 12. Phase-angle sensitivity of CuPcTS to 100 ppb of ozone.
The sensors exhibit the highest phase-angle sensitivity (Spa ranging from 5 to 12 deg) at approx. 500 kHz frequency of measuring signal in all cases. CuPcTS sensors have also secondary maximum in the vicinity of 100 Hz. As for temperature dependence of Spa - the sensors were tested at operating temperatures 25 - 90°C, because at higher temperatures reaction of MePcTS with atmospheric oxygen can start. There was also found certain low-temperature sensitivity - i.e. measurable sensor response at 25°C.
4. ConclusionsTetrasulfonated metal phthalocyanines were deposited by
MAPLE method from dimethylsulfoxide matrix. It was proved that for energy density of laser radiation corresponding to ablation threshold the molecular structure of MePcTS remained preserved. The prepared layers have porous structure with large relative surface -properties suitable for sensor applications. The sensors based on deposited layers were successfully tested for detection of hydrogen and ozone; low temperature sensitivity was observed, hence these sensors are able to operate at laboratory temperature .
5. Acknowledgment This work was supported by Grant Agency of the Czech
Republic (GA�R) projects No. P108/11/1298 and P108/12/P802 and also financial support from specific university research (MSMT No. 21/2012).
REFERENCES�[1] A. Piqué, R.A. McGill and D.B.Chrisey, “Growth of organic thin films
by the matrix assisted pulsed laser evaporation (MAPLE) technique,” Thin Solid Films, vols. 355-356, pp. 536-541, 1999.
Copyright © 2012 SciRes. 87

[2] D.B. Chrisey, A. Piqué and R.A. McGill, “Laser deposition of polymer and biomaterial films,” Chem. Rev., vol. 103, pp. 553-576, 2003.
[3] W. Göppel and K. D. Schierbaum, “SnO2 sensors: current status and future prospects,” Sens. Actuators B, vol. 26/27, pp. 1–12, 1995.
[4] S. Carquigny, “Ammonia gas sensor based on electrosynthesized polypyrrole films,” Talanta, vol. 78, pp. 199-206, 2009.
[5] D. Delmare and C. Bied-Charreton, “Grafting of cobalt porphyrins in sol-gel matrices:application to the detection of amines,” Sens.Actuators B, vol. 62, pp.136-142, 2000.
[6] S. Nespurek, “Soluble phthalocyanines: Perspective materials for electronics,” Mol. Liq. Cryst., vol. 468, pp. 355-373, 2007.
[7] Y.Q. Chen, W.M. Zhang and G.A. Li, “Saw gas sensor with copper tetrasulfonated phthalocyanine film,” Sens. Actuators B, vol. 20, pp. 247-249, 1994.
[8] R. Fry�ek, F.Vysloužil, V. Myslík, M.Vr�ata, D. Kopecký, O. Ekrt, P. Fitl, M.Jelínek, T. Kocourek and R. Šipula, “Deposition of organic
metalocomplexes for sensor applications by MAPLE,” Sens. Actuators B, vol. 125, pp. 189-1949, 2007.
[9] V. Myslík, F.Vysloužil, M. Vr�ata, Z. Rozehnal, M. Jelínek, R. Fry�ek and M. Kovanda, “Phase ac-sensitivity of oxidic and acetylacetonic gas sensors,” Sens. Actuators B, vol. 89, pp. 205-211, 2003.
[10] P. Fitl, V. Myslík, M. Vr�ata, J. Náhlík, D. Kopecký, J. Vl�ek, J. Hofmann, J. Lan�ok, “Sensing properties of tin acetylacetonate-based thin films doped with platinum,” Sens. Mater., vol.24, pp. 75-86, 2012.
[11] M. Fukui, “Structural characterization of phthalocyanine Langmuir-Blodgett multilayer assemblies by ft-ir spectroscopy,” Chem. Phys. Lett., vol. 177, pp. 247-251, 1991.
88 Copyright © 2012 SciRes.

Polypyrrole micro/nanostructure prepared using azo dyes with different substituents
Dusan Kopecky, Jitka Skodova, Martin Vrnata, Premysl Fitl Department of Physics and Measurements Institute of Chemical Technology, Prague
Prague, Czech Republic [email protected]
Abstract—This contribution deals with simple way of polypyrrole structure modification. Using azo dyes in polymerization reaction as soft-template with similar molecular structure but different type and distribution of substitution groups lead to formation of one-dimensional and newly also three-dimensional polypyrrole micro/nanostructures. These structures are characteristic with geometrical symmetry and uniformity. Geometry of prepared structures was studied by scanning electron microscopy (SEM) and by methods of image analysis; nanotubes are hundreds of nm in diameter and units of μm in length, new tree-dimensional structures have units of μm in diameter. Infrared spectra (ATR-FTIR) confirmed that azo dyes work only as intermediate supporting structures without reaction with polypyrrole.
Keywords- polypyrrole; nanostructure; azo dye; soft-template
1. IntroductionConducting polymers (CP) are popular organic
semiconducting materials which have been attracting attention since discovery of their electrical conductivity in the 1970s. Usually the conductivity of CP is around tenths or units of S·cm-1 [1] and charge transfer is predominantly directed by variable range hopping mechanism due to highly disordered physical structure with predispositions to slowly self-degradation of conjugation by atmospheric oxygen or water vapors. For some application as plastic electronic, sensors or actuators there should be better to dominate intrinsic band conductivity with long term stability [2].
Last decade of intensive research showed some remarkable properties of CP – namely their ability to organize themself under certain conditions into highly ordered systems. CP are able to create uniform structured shapes with micrometric or even nanometric sizes (nanostructures), for example nanotubes, nanowires, nanorods [3]. This could be the potential future solution of their designated disadvantages and further, there is possibility to obtain material with higher specific surface.
These known shapes are often collectively called 1-D structures of conducting polymers. The description is based on a widely used simplification which assumes that structural properties of 1-D polymer structure are predominantly determined by its longest dimension (which is always orders of magnitude larger than the other two).
1-D structured CP could be synthesized using either template or special template free procedures. There are two means of template synthesis, the so-called hard and soft template method. The hard template method uses zeolites and membranes as a hard template, but the necessity of template removing after synthesis is very limiting.
On the other side the so called soft-template synthesis, using intermediate supporting structures of auxiliary substances (micellar systems, surfactants etc.), brings many advantages: (i) change in temperature synthesis, time synthesis or molar ration of reactants can influence the geometric dimension of the prepared 1-D structures, (ii) it is effective, cheap and simple method, (iii) template autonomously degrades after the reaction is over and therefore it is easily removed from solution without damaging of prepared polymer nanostructure [4].
Soft-template method presented here is based on supposed reaction of azo dye and oxidant which create temporary supporting structure. After addition of the monomer (in our case pyrrole), polymer (polypyrrole) forms on its surface resulting in less or more ordered systems. Some of them should be considered as 3-D structures thanks to their spatial symmetry. All uses only two basic types of azo dye molecular structures as a soft-template; substantial difference is in the type of azo dye substituents and their position on the skeleton of molecule.
The molecular structure of azo dyes significantly affects the structure of prepared structured polymer. Therefore it must be reflect strength, number and distance of ligands in a molecule of azo dye, acidobasic properties, degree of molecule planarity, etc.
2. Experimental Pyrrole, ferric chloride (FeCl3), Methyl Orange, Methyl
Red, Congo Red, Acid RED 1, Orange G, Sunset Yellow FCF and Tropaeolin O Sodium Salt (all purchased from Sigma-Aldrich) were used as received without further modifications. The molecular structures of azo dyes are shown in Fig. 1.
The synthesis process of the structured PPY was as follows: ferric chloride (oxidant) was dissolved in 200 ml of 5 mM solution of azo dye and deionized water. Then 700 μl pyrrole monomer was added dropwise in the first two hours of synthesis to the solution. Molar ratio of reactive monomer : oxidant : azo dye was 10:10:1 for all synthesis. The solution was tempered at 5 °C and stirred during synthesis at constant
Advances in Materials Physics and Chemistry Supplement: 2012 world Congress on Engineering and Technology
Copyright © 2012 SciRes. 89

speed. Due to complex structure of prepared PPY, remnants of a template must be removed by Soxhlet extraction. The prepared PPY was extracted with ethanol until extraction reagent was colorless (up to one week). The prepared structures of PPY were dried at 45 °C in vacuum drier.
Figure 1. Chemical structures of used azo dyes: a) Methyl Orange, b) Methyl Red, c) Congo Red, d) Acid RED 1, e) Orange G, f) Sunset Yellow FCF, g)
Tropaeolin O Sodium Salt.
For comparison unstructured PPY was also synthesized. Molar ration of reactants (oxidant : monomer) was 1:1 in aqueous environment.
The structures of prepared PPY were observed by Scanning Electron Microscope (SEM) JEOL model JSM-7500F. Structure of prepared PPY was confirmed by Attenuated Total Reflection Fourier Transform Infrared spectroscopy (ATR-FTIR) BRUKER IFS 66v with diamond ATR attachment.
3. Results and Discussion Characteristic shape of unstructured PPY is shown on
SEM image Fig. 2 a). This sample was synthesized by standard chemical polymerization without presence of azo dye. As seen, unstructured PPY has characteristic fruticose formations that create highly disordered arrangement.
Fig. 2 b-h) show SEM images of structured PPY prepared by the soft-template method using different azo dyes. It is apparent that azo dyes, as an auxiliary substance, significantly affect the structure of prepared PPY. The most evident is this capability in the case of Methyl Orange, Acid Red 1 and Sunset Yellow. In all these cases there are created symmetrical
micro/nanostructures. Methyl Orange and Acid Red 1 contribute to the formation of 1-D PPY structure. Dimension of these PPY nanotubes are approximately 80 nanometers in diameter and hundreds of nanometers in length. Dimension of PPY nanotubes prepared from Acid RED 1 are approximately 340 nanometers in diameter and units of microns in length.
Figure 2. Structures of PPY prepared by: a) without azo dye, b) Methyl
Orange, c) Methyl Red, d) Congo Red, e) Acid RED 1, f) Orange G, g) Sunset Yellow FCF, h) Tropaeolin O Sodium Salt.
PPY synthesized in presence of Sunset Yellow FCF
creates brand new type of formations. There are observed symmetrical 3-D structures. Probably, the Sunset Yellow FCF molecule allows creating more spatially-oriented complex of supporting structure in polar solvent, due to suppressing of hydrophilic and hydrophobic molecule polarization by SO3
- polar groups.
Other azo dyes with the same molecular structure – Orange G, Tropaeolin O – are more polarized due to spreading out of polar substitution groups on and in polar solvent they are probably forced to create poorly soluble phase which suppress supporting structure formation. In this case PPY has the same
90 Copyright © 2012 SciRes.

structure as unstructured sample. Last sample prepared in Congo Red is comprised from “crushed stone” like formations.
Further important observation concerns degree of structure spreading in the whole volume of native liquor. Methyl Orange is the only (from all tested azo-dyes) soft-template which creates micro/nanostructures in the entire volume and also at different molar ratios (10:10:1, 10:10:0,5, 10:10:0,1). On the other side Acid RED 1 and Sunset Yellow FCF create nanostructures in insulated spatially distributed domains at higher molar ratio only (10:10:1). This is probably connected with the molecular structure of azo dye which affect still poorly understand mechanism of supporting structure creation.
Figure 3. Overview of ATR-FTIR spectra of PPY prepared in the presence of: a) Methyl Orange, b) Methyl Red, c) Congo Red, d) Acid Red 1, e) Orange G, f) Sunset Yellow FCF, g)
Tropaeolin O Sodium Salt.
The main task of ATR-FTIR measurements was to verify the chemical structure of prepared PPY and to detect potential residue of azo dye used during synthesis. Interpretation of the spectra was focused on the region 1800 - 600 cm-1, the so called “finger print area”. Interpretation of PPY spectra could be difficult because of variable degree of conjugation of PPY backbone and a large number of different types of disturbances (non-linear shape of the polymer chain, oxidation by air oxygen, etc.). Nevertheless, in all cases it was
confirmed PPY as a basic unit of all formations (Fig. 3). The unstructured PPY spectrum contains following characteristic peaks: 1527 cm-1 (C-C, C=C stretching), 1427 cm-1 (C=C, C-N stretching), 1270 cm-1 (C-H, C-N in plane deformation), 1129 cm-1 (breathing vibration of the PY ring), 1086 cm-1 (C-H, N-H in plane deformation), 997 cm-1 (C-H in plane deformation), 956 cm-1 (C-C out of plane deformation), 849 cm-1 and 727 cm-1 (C-H, N-H out of plane deformation), 646 cm-1 (C-C out of plane deformation). These peaks are evident in presented spectra of structured PPY. Slight shifts in spectra cannot be attributed to direct chemical reaction between pyrrole and azo dye, but only to changes in degree of conjugation of polypyrrole chains. It is apparent that used azo dye acts only as a supporting structure for forming polymer structure and after polymerization it self-degrades.
4. Conclusion This contribution deals with preparation of PPY
micro/nanostructures by soft-template method. As a soft-template seven different azo dyes were used. Using Methyl Orange and Acid RED 1 lead to formation of 1-D structures. New type (3-D structure) of PPY structure was observed for Sunset Yellow as soft-template.
5. Acknowledgment (Heading 5) This work was supported by Grant Agency of the Czech
Republic (GA�R) projects No. P108/11/1298 and P108/12/P802 and also financial support from specific university research (MSMT No. 21/2012).
REFERENCES�
[1] N. V. Blinova, J. Stejskal, M. Trhová, J. Prokeš, M. Omastová, “Polyaniline and polypyrrole: A comparative study of the preparation”, Eur. Polym. J., vol. 43, pp. 2331-2341, 2007.
[2] U. Lange, N. V. Roznyatovskaya, V. M. Mirsky, “Conducting polymers in chemical sensors and arrays”, Anal. Chimica Acta, vol. 614, pp. 1-26, 2008.
[3] X. Yang, Z. Zhu, T. Dai, Y. Lu, “Nanotubes via a reactive self-degraded template”, Macromol. Rapid Commun.vol. 26, pp. 1736-1740, 2005.
[4] D. Zhang, Y. Wang, “Synthesis and applications of one-dimensional nano-structured polyaniline: An overview”, Mater. Sci. Eng., B, vol. 134, pp. 9-19, 2006.
Copyright © 2012 SciRes. 91

BPSCCO superconducting films grown by spray pyrolysis technique: systematic study of the relationship between Pb
content and annealing conditions
Elvia Díaz Valdés, Concepción Mejía García, Ana María Paniagua Mercado, Arturo Méndez Sánchez Departamento de Física, Escuela Superior de Física y Matemáticas – IPN
Edif. 9 UPALM Col. San Pedro Zacatenco, Deleg. GAM, México 07737 México [email protected]
Abstract—Actually recent investigation in developing semiconducting-superconducting composites based in CdS and Bi-based superconductors has attracted interest in processing thin superconducting films. In this work are reported Bi-Pb-Sr-Ca-Cu-O (BPSCCO) thin films grown on MgO substrates by spray pyrolysis technique from a solution containing Bi(NO3)3, Pb(NO3)2, Sr(NO3)2, Ca(NO3)2 and Cu(NO3)2, with a subsequent solid state reaction for growing the Bi-based superconducting phases. Annealed films were characterized by X-ray diffraction, atomic absorption spectroscopy and resistance measurements. Interdependence between Pb content, annealing time and temperature, in the formation of superconducting phases was studied applying a fractional factorial design 3III
4-2. Interrelation between Pb content, ta and Ta exists. The presence of Pb is necessary to stabilize the high-Tc phase but its content depends on the annealing conditions.
Keywords-Superconductivity: BPSCCO superconducting films, spray pyrolysis deposition, Pb content, annealing conditions, experimental design.
1. IntroductionThe discovery of high-Tc superconductors has attracted much attention for their technological applications as bulk material as well as thin films, as for example, electronic devices, conductor tapes, and superconducting quantum interference devices. For the preparation of thin films, several physical and chemical techniques have been used: pulsed laser deposition [1], r. f. sputtering [2], magnetron sputtering [3], atomic layer epitaxy [4], chemical vapor deposition [5] and chemical deposition (spray pyrolysis) [6]. Most of them are high vacuum deposition techniques that produce superconductor thin films by sequential layer-by-layer deposition of the constituent elements. The precursor films obtained by means of this sequential deposition needs oxidation of the deposited layer with complete evaporation of the volatile gases present. The spray pyrolysis technique does not need subsequent oxidation because the complete thermal decomposition and oxidation of the deposited layers can be controlled [7]. On the other hand, Bi-based films are already used in low current as well as power applications [8, 9]. Among the high-Tc ceramic
superconductors, the Bi-based system has been extensively studied because of its high critical temperature, especially with the partial substitution of Pb in Bi and Sr sites since it promotes the stabilization of the 2223 phase when grown from the 2212 phase [10]. It has been found that the nominal composition and thermal treatment parameters such as heating rate, annealing temperature, annealing time, as well as, oxygen content play an important role in the formation of high-Tc phases and the thermodynamic stability of these phases [6]. However, it has not been reported the interdependence between Pb content, annealing temperature and annealing time on growing the high-Tc superconducting Bi-phases. The influence of the Bi content upon the critical temperature Tc values, the c-axis lattice parameter and the surface morphology of the synthesized films is also recognized. Studies of Pb-substituted Bi2Sr2Ca2Cu3O8+ single crystals indicate a reduction in Tc values of the overdoped samples. When growing the Bi-based films, many technological parameters are involved in such a process that influences the final properties of the synthesized films. In our previous studies we observed a loss of Pb during the annealing treatment [11]. This Pb-loss led to the transformation of the high-Tc (2212 and 2223) phases to the low-Tc (2201) phase or others no superconductor phases. This phenomenon was caused by exposition of the precursor annealing in a free air ambient into which Pb evaporates. In studies done on material in volume has been reported that in the Bi-based system the partial substitution of Pb in Bi sites promotes the stabilization of the high-Tc 2223 phase for following reasons: a) Pb diminishes the melting point of the compound which is convenient for the formation of the high-Tc (2223) phase; b) Pb can have a catalytic effect and/or of stabilization for the high-Tc phase since accelerates the reaction between the phase of low-Tc and the atoms of Ca through Ca2PbO4 and, c) Bi and Pb tend to form Bi-O, Pb-O layers in the crystalline structure of the superconducting phases because their atomic radios are very closed. By these reasons it is important to keep the Pb in the structure in order to obtain high-Tc (2223) phase [10].
Work supported by Instituto Politécnico Nacional through project SIP- IPN 20121703.
In the present work, we report on the deposition of Bi-Pb-Sr-Ca-Cu-O films using the spray pyrolysis technique and the
Advances in Materials Physics and Chemistry Supplement: 2012 world Congress on Engineering and Technology
92 Copyright © 2012 SciRes.

interdependence between Pb content, annealing temperature, annealing time and covering material, applying a fractional factorial design 3III
5-3.
2.Experimental Procedure Bi-Pb-Sr-Ca-Cu-O (BPSCCO) thin films grown on MgO substrates were prepared by the spray pyrolysis technique following the two-step procedure described in detail elsewhere [6]. An aerosol atomized ultrasonically from an aqueous nitrate solution of Bi, Pb, Sr, Ca, and Cu components with a cation ratio 1.4:x:2:2:3 (where x is the nominal lead content) was sprayed for 5 min over single-crystalline MgO substrate. Three such cycles were applied with a total film thickness of approximately 5 �m. These BPSCCO precursor films were then annealed at 840 ºC, 850 ºC and 860 ºC in air to become superconducting. The growth parameters studied by applying a fractional factorial design 3III
5-3 were covering material, annealing time (ta), annealing temperature (Ta) and the nominal Pb content (x) before annealing. Influence of each parameter was investigated in a chosen interval for its three values i.e. minimum, medium and maximum value. Table 1 shows values of those parameters used for each experimental run. The superconducting pellets, precursor films and plate-shaped crystalline MgO were used to cover the precursor films in order to avoid the lead evaporation and to observe which type of cover helps to maintain the composition of the superconducting film most close to the nominal composition. Annealed precursor films were in direct contact with the covering material. The superconducting pellet composition was closed to Bi2Pb0.3Sr2Ca2Cu3O2; the covering precursor film composition and the composition of the investigated precursor film were the same, i.e. with the cation ratio 1.4:x:2:2:3 where x is the lead content before annealing. The chemical composition of the films was measured by atomic absorption spectroscopy. Samples were then characterized by X-ray diffraction (XRD) with CuK radiation using the Siemens D500 diffractometer. The R vs. T dependence was measured by using the standard four-point resistance method. The chemical composition was determined by measurements of atomic absorption spectroscopy using an Analyst 300 Perkin Elmer Spectrometer.
TABLE I. GROWTH PARAMETER CONDITIONS, WHERE ta IS THE ANNEALING TIME, Ta IS THE ANNEALING TEMPERATURE AND x IS THE
NOMINAL LEAD CONTENT.
Sample No
Material used to cover the precursor film
ta[h]
Ta
[�C]x
[mole]
1 superconducting pellet 1 840 0.7 2 superconducting pellet 15 850 1.4 3 superconducting pellet 29 860 2.1 4 precursor film 1 850 2.1 5 precursor film 15 860 0.7 6 precursor film 29 840 1.4 7 plate-shaped crystalline MgO 1 860 1.4 8 plate-shaped crystalline MgO 15 840 2.1 9 plate- shaped crystalline MgO 29 850 0.7
3. Results and DisscusionA. X-ray diffraction patterns Figures 1 and 2 show respectively X-ray diffraction patterns from films 2 and 7. These films were prepared according to the conditions shown in Table 1. From figure 1 we observe that in order to grow the (Bi-Pb)2Sr2Ca2Cu3O2 phase denominated Bi-Pb-2223 so as the Bi-2212 phase, an annealing temperature of 850 ºC during 15 h and Pb content of 1.4 mole are required (film 2). This indicates that to obtain the high-Tc Bi-based superconductor phases, annealing temperatures smaller than 860 ºC, annealing times longer than 1 h and Pb content between 0.7 and 2.1 moles are required. In contrast, for the film 7, in order to grow those superconducting phases an annealing temperature of 860 ºC during 1 h and Pb content of 1.4 mole are required. At the same way, this indicates that in order to obtain the high-Tc Bi-based superconducting phases, annealing temperatures longer than 850 ºC, annealing times smaller than 15 h and Pb content between 0.7 and 2.1 mole are required. Therefore it can be observed that an adequate Pb-content of 1.4 for annealing temperatures between 840 ºC and 860 ºC, and annealing times between 1 h and 29 h exists. On the other hand, to observe the effect, in the growing of superconductor Bi-based, using different conditions to those above mentioned, figures 3 and 4 from films 5 and 9 are shown. From figure 3 we can observe that the Bi2Sr2.01Ca0.94Cu1.92O7.87 phase, related to that denominated Bi-2212 phase, was grown using an annealing temperature of 860 ºC during 15 h and Pb content of 0.7 mole. With those conditions it was no possible to grow the Bi-2223 phase, because of the effect of annealing temperature, higher than 850 ºC, and those one from the Pb content, lower than 1.4 mole, even when the annealing time was established in 15 h. Figure 4 shows the growing of the Bi1.6Pb0.595
Sr2.675Ca2.675Cu3O2 phase and a Bi-deficient phase Bi0.33Pb3.4
Sr2.6Ca2.3Cu2O2, with an annealing temperature of 850 ºC during 29 h and Pb content of 0.7 mole.
Copyright © 2012 SciRes. 93

Figure 1. X-Ray diffraction pattern for Bi1.4Pb1.4Sr2Ca2Cu3O2/MgO film, prepared following the experimental conditions of sample 2.
Figure 2. X-Ray diffraction pattern for Bi1.4Pb1.4Sr2Ca2Cu3O2/MgO film
prepared following the experimental conditions of sample 7.
Figure 3. X-Ray diffraction pattern for Bi1.4Pb0.7Sr2Ca2Cu3O2/MgO film
prepared following the experimental conditions of sample 5.
With those conditions it was no possible to grow the Bi-2223 and Bi-2212 phases, because the annealing time was higher than 15 h and Pb content was lower than 1.4 moles, even when annealing temperature was established at 850 ºC. Those results show interdependence between Pb content, annealing temperature and annealing time.
B. Resistance vs. Temperature dependenceResults of the R vs. T measurements, from all the
superconducting films gave Tc0 values between 23 and 99 K, are listed in Table 2. Figure 5 shows the electrical behavior for all samples. Most of them show a metallic behavior before the superconducting transition. Samples 2 and 7 gave the highest Tc values of 91 and 99 K, respectively. After thermal treatment,
samples 3 and 8 were very thin and it was no possible to measure their Tc0 values because of missing conductive paths.
Figure 4. X-Ray diffraction pattern for Bi1.4Pb0.7Sr2Ca2Cu3O2/MgO film
prepared following the experimental conditions of sample 9.
According to X-ray diffraction results and R vs. T dependence for samples 2 and 7 it is observed that covering material does not have influence in the result. While sample 2 was covered with a superconducting pellet, sample 7 was covered with an MgO substrate. In both films the same electrical behavior was obtained approximately. From these results we can observe that covering the film helps to keep partial vapor pressure of Pb and so avoid its evaporation. Also it was verified that Pb reduces the melting point of the film and therefore high annealing temperatures (860 ºC), high annealing times (29 h) and high Pb content cause the evaporation of the material, i. e., the combination of Pb content equal to 2.1 mol, annealing time of 29 h and annealing temperature of 860 ºC which are the limit conditions, result in negative form in the superconducting properties of the film.
TABLE II. RESULTS OF FINAL Pb CONTENT (xf) DETERMINED BY ATOMIC ABSORPTION SPECTROSCOPY AND THE CRITICAL TEMPERATURE
VALUES, Tc0, OF THE Bi-BASED FILMS.
Sample xf[mole]
Tc0[K]
1 0.4 37
2 0.2 91
3 0.3 –
4 2.3 65
5 0.4 23
6 1.3 45
7 1.9 99
8 2.4 –
94 Copyright © 2012 SciRes.
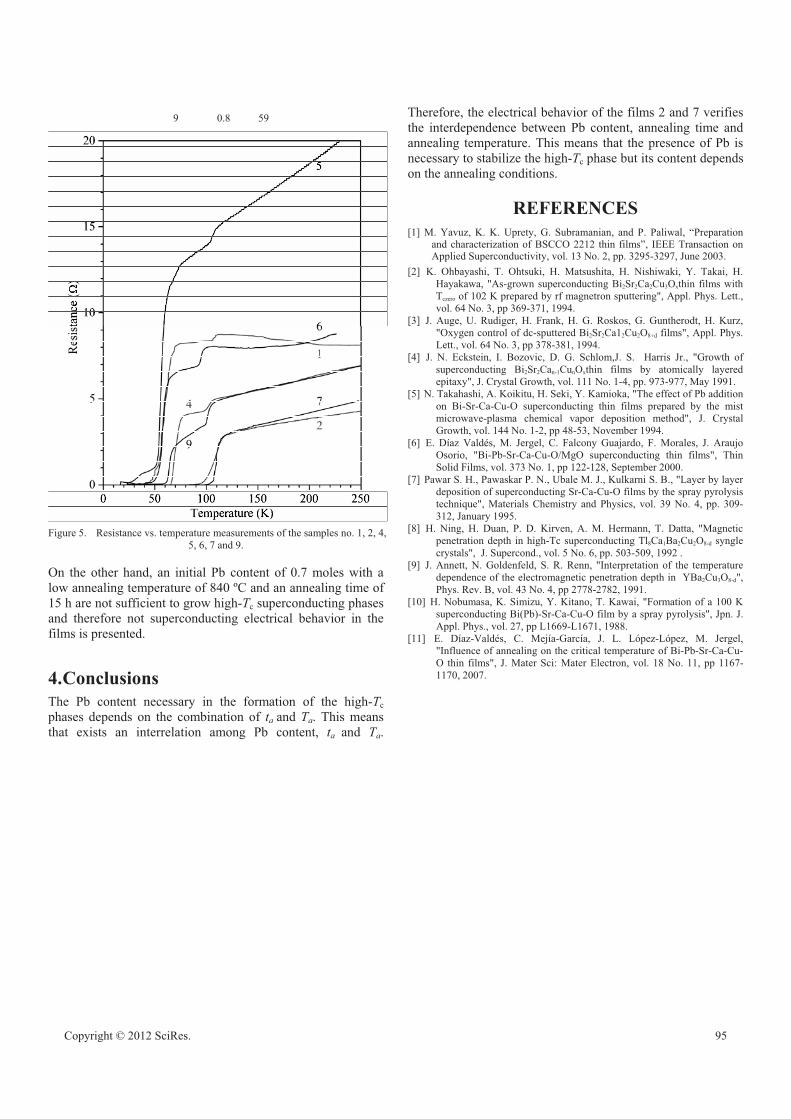
9 0.8 59
Figure 5. Resistance vs. temperature measurements of the samples no. 1, 2, 4, 5, 6, 7 and 9.
On the other hand, an initial Pb content of 0.7 moles with a low annealing temperature of 840 ºC and an annealing time of 15 h are not sufficient to grow high-Tc superconducting phases and therefore not superconducting electrical behavior in the films is presented.
4.ConclusionsThe Pb content necessary in the formation of the high-Tc phases depends on the combination of ta and Ta. This means that exists an interrelation among Pb content, ta and Ta.
Therefore, the electrical behavior of the films 2 and 7 verifies the interdependence between Pb content, annealing time and annealing temperature. This means that the presence of Pb is necessary to stabilize the high-Tc phase but its content depends on the annealing conditions.
REFERENCES[1] M. Yavuz, K. K. Uprety, G. Subramanian, and P. Paliwal, “Preparation
and characterization of BSCCO 2212 thin films”, IEEE Transaction on Applied Superconductivity, vol. 13 No. 2, pp. 3295-3297, June 2003.
[2] K. Ohbayashi, T. Ohtsuki, H. Matsushita, H. Nishiwaki, Y. Takai, H. Hayakawa, "As-grown superconducting Bi2Sr2Ca2Cu3Oxthin films with Tczero of 102 K prepared by rf magnetron sputtering", Appl. Phys. Lett., vol. 64 No. 3, pp 369-371, 1994.
[3] J. Auge, U. Rudiger, H. Frank, H. G. Roskos, G. Guntherodt, H. Kurz, "Oxygen control of dc-sputtered Bi2Sr2Ca12Cu2O8+d films", Appl. Phys. Lett., vol. 64 No. 3, pp 378-381, 1994.
[4] J. N. Eckstein, I. Bozovic, D. G. Schlom,J. S. Harris Jr., "Growth of superconducting Bi2Sr2Can-1CunOxthin films by atomically layered epitaxy", J. Crystal Growth, vol. 111 No. 1-4, pp. 973-977, May 1991.
[5] N. Takahashi, A. Koikitu, H. Seki, Y. Kamioka, "The effect of Pb addition on Bi-Sr-Ca-Cu-O superconducting thin films prepared by the mist microwave-plasma chemical vapor deposition method", J. Crystal Growth, vol. 144 No. 1-2, pp 48-53, November 1994.
[6] E. Díaz Valdés, M. Jergel, C. Falcony Guajardo, F. Morales, J. Araujo Osorio, "Bi-Pb-Sr-Ca-Cu-O/MgO superconducting thin films", Thin Solid Films, vol. 373 No. 1, pp 122-128, September 2000.
[7] Pawar S. H., Pawaskar P. N., Ubale M. J., Kulkarni S. B., "Layer by layer deposition of superconducting Sr-Ca-Cu-O films by the spray pyrolysis technique", Materials Chemistry and Physics, vol. 39 No. 4, pp. 309-312, January 1995.
[8] H. Ning, H. Duan, P. D. Kirven, A. M. Hermann, T. Datta, "Magnetic penetration depth in high-Tc superconducting Tl8Ca1Ba2Cu2O8-d syngle crystals", J. Supercond., vol. 5 No. 6, pp. 503-509, 1992 .
[9] J. Annett, N. Goldenfeld, S. R. Renn, "Interpretation of the temperature dependence of the electromagnetic penetration depth in YBa2Cu3O8-d", Phys. Rev. B, vol. 43 No. 4, pp 2778-2782, 1991.
[10] H. Nobumasa, K. Simizu, Y. Kitano, T. Kawai, "Formation of a 100 K superconducting Bi(Pb)-Sr-Ca-Cu-O film by a spray pyrolysis", Jpn. J. Appl. Phys., vol. 27, pp L1669-L1671, 1988.
[11] E. Díaz-Valdés, C. Mejía-García, J. L. López-López, M. Jergel, "Influence of annealing on the critical temperature of Bi-Pb-Sr-Ca-Cu-O thin films", J. Mater Sci: Mater Electron, vol. 18 No. 11, pp 1167-1170, 2007.
Copyright © 2012 SciRes. 95

Development And Characterization Of Ultra Low Cement Castable Cordierites By Thixotropic Properties Mixtures
Ana M. Paniagua-Mercado1, Arturo Méndez-Sánchez, Elvia Díaz Valdés, Concepción Mejía García.
Depto. de Física, Escuela Superior de Física y Matemáticas Instituto Politécnico Nacional, Col. Lindavista, CP 03778,
México D. F., México e-mail: [email protected]
Paulino Estrada Díaz, Sector-Ceramics and Refractories
Manuchar International México D. F., México
e-mail: [email protected]
Abstract- The main target in this investigation was to take advantage of the reology properties of the tixotropic mixes in Ultra Low Cement Castables (ULCC). The cordierite phase in refractory mix can be obtained using raw materials with magnesium oxide in its composition, such as, Mg(OH)2 or H2Mg3(SiO3)4 (Talc mineral), with a content of 63.5% SiO2, 31.7% MgO and 4.8% H2O. In this investigation, as magnesium source, a commercial calcined magnesite with 90% MgO was used. This mineral was selected instead of Talc mineral, because this last contains more impurities in its composition that tend to form more amounts of liquid phases with low fusion points. For this work two different ULCC mixes were designed. These were fired at 1260 ºC, the cordierite phase was quantified in each mix.
Keywords-Reology, Thixotropic mixtures, ultra low cement castables, cordierite.
1. Introduction There are in the market, several industrial methods and a wide of conventional raw materials to produce cordierite mixes (MgO Al2O3 SiO2). The complete phase transformation is around 1300 ºC depending on the raw material used in the mix [1]. The industrial application is mainly focus where high thermal shock resistant, low thermal expansion and corrosion resistance are demanded. Such is the case of the cordierite refractory plates used for the conventional firing of sanitary and tableware, or recently used as substrate material in microelectronics [2]. The main manufacturing processes to develop cordierite phase are the sol-Gel method [3], co-precipitation [4], solid-state reaction [5] and by slurry. Aluminosilicate based ultra low cement castables (ULCC) are widely used mainly in the Steel and cement industries due to improved refractory properties at high temperatures. The bonding system in ultra low cement castables is achieved by using high alumina calcium aluminate cement. Increasing the cement content in the concrete mix also increases the amount of liquid phases as the anorthita
(CaAl2Si2O8) and gelenite (Ca2Al2SiO7). These both tend to reduce the amount of free silica and decrease, in an important way, its chemical corrosion resistance. This last affects negatively their mechanical properties at high temperatures and in consequence the thermal shock resistant comes down. The lime/silica ratio is very important in the formation of liquid phases and its viscosity at high temperatures, because it affects the strength and corrosion resistance [6]. The use of very low amounts of high alumina cement in ULCC is principally to avoid the liquid phases formation inside the refractory matrix. Other important variable is the particle size distribution because it has a major impact in the reology of ULCC and in the final physical properties [7].
2. Experimental Procedure Table I shows the chemical formulation of the two concrete mixes tested in this investigation. For each one of the designed mixes the preparation was as follows. First, the raw materials were dry mixed for at least 1 minute, after that, the deflocculant (sodium tripolifosfate); the polypropylene fibers and the high alumina cement were added to the final mix. At once, the water was added slowly and mixed 10 second more. After the mix was placed in a vibratory table (3000 cps), for no more than 30 seconds up to the mix, it got a thixotropic behavior.
Work supported by Instituto Politécnico Nacional through project SIP-IPN 20120167.
TABLE I. CHEMICAL FORMULATION OF MIXTURES
Compound MIX I (%) MIX II (%) Al2O3 47.92 47.49
SiO2 20.86 41.02
CaO 0.80 1.08
Advances in Materials Physics and Chemistry Supplement: 2012 world Congress on Engineering and Technology
96 Copyright © 2012 SciRes.

MgO 27.15 7.37
Fe2O3 1.08 0.82
TiO 1.22 1.19
K2O 0.65 0.66
Na2O 0.29 0.31
After the vibratory step, the mix was allowed to dry and it was set for 12 hours at room temperature (25 ºC). Afterwards the mix was dried 24 h in a laboratory stove at 110 ºC. Finally, the mix was calcined between 1260 °C - 1280 °C during 5 h, in a gas furnace. In order to determine the cordierite forming and main phases present, the calcined samples were analyzed by X-ray diffraction in a Siemens D-���� ���������������� ��¡� ¢�� ��� £¤� �¥� �¡�� ¦��§§-Brentano configuration, in a 2- range of 10º - 120º. Micrographs of each one of the two calcined mixes were obtained with secondary electrons, at 800X of magnification, in a scanning electron microscopy JEOL-6300.
3. Results and Discussion A. Chemical Analysis Specific raw materials were selected to design the ULCC cordierites. Oxide or other non-clay powders generally have poor workability when they are mixed with water and settling rapidly at lower water levels. For this reason, it was utilized some deflocculating chemicals to get a thixotropic behavior. In ULCC mix the amount of water is a problem because higher amount of water, than that required, is to the detriment of the final physical properties of the refractory concrete as %Porosity and density (see table II).
B. Physical Properties The physical properties of the mixtures were calculated and they are shown in table III. The physical properties reported for the mix I, with a greater amount of fine particles than for mix II, table III, the fines are because the raw materials used for mix I are more than for mix II, show that it was required more water in its preparation than for mix II. It can be also observed from mix I, that at higher water content in the mixII, the density decreases and the porosity too, Table III. Increases water resulting in a negative effect for the final physical properties. For Mix II, with a greater amount of coarse particles, until the raw mix, the demand of water was lower than for mix I, and this was reflected in its final physical properties.
TABLE II. PHYSICAL PROPERTIES OF THE MIXTURES
Mix/Property
Setting Time (min)
Water Mixed (mL)
Density (g/cm3)
Absorption (%)
Porous (%)
MIX I 160 12.5 1.95 13.8 27.0
MIX II 80 8.5 2.07 9.6 20.0
TABLE III. GRANULOMETRY AND DENSITY OF RAW MATERIALS
Raw materials Particle Size Density
(μm) (g/ml)
Magnesium Oxide 590 3.10
Calcined Kaolin 74-2380 2.52
Microsilica 44 2.70
High Alumina Cement 53 0.90
Calcined Bauxite 74 3.15
C. X-ray Diffraction In the patterns of X-ray diffraction shown in figure 1, the different phases contained in the mixes I and II are presented. These were quantified with the peaks getting by X-ray diffraction of mixes burned.
Figure 1. Patterns of X-ray Diffractions: (a) mix I, (b) mix II burned.
The X-ray diffraction patterns reported a higher amount of cordierite phase for mix I than for mix II, as it is observed in table IV. The mix I had a big amount of fine particles which contributed in an important way to the formation of the cordierite phase, however, it was utilized a bigger amount of water for its preparation and the physical properties for this
(a)
(b)
Copyright © 2012 SciRes. 97

mix were poor in comparison with those ones of the mix II. Other main phases detected in this analysis were mullite, cristobalite, alpha-alumina and magnesium oxide. It is necessary to remark that particulate size distribution is a very important factor in the quantity and type of phases formed for this ULCC.
TABLE IV. PHASE QUANTITY IN THE MIXTURES
MIX/ Phase
Cordierite (%)
Mullite (%)
Cristobalite (%)
��Al2O3
(%)
MgO (%)
MIX I 31.87 18.64 35.23 8.04 6.22
MIX II 14.27 29.00 37.29 5.18 14.26
D. Scanning Electron Microscopy In the micrographs shown in figure 2 we can observe material like flakes corresponding to cordierite, and liquid phases with composition of Fe2O3, Na2O, K2O and GeO formed with the presence of SiO2 and detected by Micro analyses of SEM, all of these have low fusion points.
4. Conclusions 1. It was processed a refractory Cordierite ULCC mix, with level of cordierite phase commercially acceptable and with thixotropic properties. 2. The main physical properties of this type of ULCC are subjected to a very restricted particle sizes distribution to obtain the better physical properties after fired. 3. Further research work must be doing to improve in a better way the cordierite performance phase and also the final physical properties of the castable.
Figure 2. Micrographs: (a) mix I and (b) mix II.
REFERENCES
[1] R.S. Lamar, M.F. Warner, Reaction and fired property studies of cordierite compositions J. Am. Ceram. Soc., 37, 12, pp. 602–610, 1954.
[2] L. A. Radzikhovskii, Cordierite bodies wity improved refractoriness. Keramika No. 6 p.p.21-22, June 1980.
[3] C.A. Bertran, N.T. da Silva, G.P. Thim Citric acid effect on aqueous sol–gel cordierite synthesis, J. Non-Cryst. Solids, 273, pp. 140–144, 2000.
[4] M. Awano, H. Takagi, Y. Kuwahara Grinding effects on the synthesis and sintering of cordierite J. Am. Ceram. Soc., 75, 9, pp. 2535–2540, 1992.
[5] ¨©�ª�¬���®���¤����¥������������������������¯������ ��������²¯��³©¶�©�thesis, 1981. Middle East Technical University, Ankara.
[6] H. Sarpoolaky, K. Ahari, W. Lee, Ceram. Int., 28, , 487-493, 2002. [7] E. A.Firoozjaei, A. Saidi, A.Monshi, P. Koshi, The effect of
microsilica and refractory cement content on the properties of andalusite based Low cement castables used in aluminium casthouse, Ceramic 56, 411-421, 2010.
(a)
(b)
98 Copyright © 2012 SciRes.

Increasing The Burned Time And Mechanical Properties With New Mix As Flame Retardant Based In Hexametaphosphate Of Sodium And
Borax In Textile 100% Acrylic Fabrics.
M. Olvera-Graciaa*, L. Mercado-Velazqueza.aInstituto Politécnico Nacional, ESIT – Sección de estudios de Posgrado e investigación, Av. IPN, Ed. 8 U.P.A.L.M., 07738, México D.F., México.
A.M. Paniagua-Mercadob,bInstituto Politécnico Nacional, ESFM - Departamento de Ciencia de Materiales, Av. IPN, Ed. 9 U.P.A.L.M., 07738, México D.F., México.
*E-mail: [email protected]. 55 57296000 ext. 55228. Fax: (55)11132414
Abstract-It has been worked with textile fabrics of Acrylic 100 % , that have as final use the Tapestry, this fabrics have been impregnated with a two products flame retardant: Commercial Retardant, which is formed by a combination of a resin polymeric and acid phosphoric and Borax (Na2B4O5(OH)4•8H2O)with Sodium Hexametaphosphate (Na16P14O43). These Retardants has the advantage of the fact that it can be applied to the substrates mixed with water in the relation 1:1, 1:2 or pure. In order to reduce the flammability, Textile fabrics are coated with flame retardants. The flame retardant capabilities, mechanical properties and structural characteristics of the textile fabrics before and after the use of these products were investigated throughout the special textile methods for inflammability and mechanical resistibility. After the use of the flame retardants the mechanical properties of the fabrics were improved or at least remained the same as compared to fabrics without any treatment. The use of Borax / Sodium Hexametaphosphate /Water results in the essential increase of combustion retardation time about 2 minutes as compared with 8 seconds for untreated fabrics.
Keywords- Acrylic, Borax, Flame Retardants, Sodium Hexametametaphosphate, Textile Fabrics
1. Introduction
Flame retardants in their various forms have been used in passive protection of timber and other building materials, including metal structures in many textiles and synthetic fibers, as well in a wide variety of technical applications of plastics, mainly in the electronics industry [1, 2]. Flame retardants can be incorporated into a material either as active or as additives ones. The active components are incorporated into the polymeric structure of some types of plastics. This method is preferred because it produces more stable and uniform properties. Additives are also cheaper and versatile. However, they have the disadvantage to modify the properties of base materials. This is the case of the polybrominated flame retardants, which usually of view are applied as coatings or mix during the processing of materials such as plastics and fibers [3, 4]. From a technical standpoint, the effectiveness of fireproof coating is based on two fundamental aspects in depending on type of fibers. In natural fibers, as cotton and wool, it is important to maintain their properties such as of touch, comfort, etc., which do not have other heat-resistant fibers, the durability of retardant effect against washing, the use and a competitive cost. In synthetic fibers, the possibility of fireproof material limits the importance of the application in the dyeing, which only has the effectiveness in blends with natural fibers, because of the strength of the effect brought by the incorporation of the additive mass versus fixation by impregnation [5, 6]. Regarding fireproof coating for synthetic fibers, the main interest is treatment of polyester fibers
Advances in Materials Physics and Chemistry Supplement: 2012 world Congress on Engineering and Technology
Copyright © 2012 SciRes. 99

not only due to their commercial importance, either alone or in blend with other fibers, but also because of the obtained success with this fiber at flame retardant treatment as compared with other synthetic fibers [7]. Extreme flammability of the acrylic fibers is caused by strong exothermic reaction of pyrolysis that takes place at temperature of 300 ºC for most commercial variants. This reaction gives rise to the formation of flammable nitriles and monoxide carbon. In order to control this reaction it is possible to add a flame retardant to the fiber for appreciably promotion the carbonization [8, 9]. The replacement of acrylic fibers by fireproof modacrylic ones is often useful, but this replacement has the disadvantage because of a very high cost of these fibers. This is the reason why there is interest of application of fireproof coating for this type of fibers to retard of flame and at the same time this coating must not affect the mechanical properties of fabrics impregnated.
2. Experimental Procedure
Two flame retardant products based on Borax and Sodium Hexametaphosphate was used in order to coat textile fabrics with the composition 100% acrylic. Also the textile fabrics were coated with a commercial flame retardant for comparison. The process of coating was carried out by the immersion method, which consists of completely submerge of the fabric in a bath containing the aqueous solutions of flame retardant products. After the coatings of the fabrics were characterized with microscopy (SEM) JEOL-6300 in order to analyze the effect of the flame retardant products on the fabric. The flammability tests for the samples with or without flame retardant products were carried out in order to observe their behavior under fire. The tension test too was made to the samples to observe the effect of the coatings on the mechanical properties. For tensile test were used the NMX-A-059-INNTEX, whereas for ripped test a NMX-A-109-INNTEX and for inflammability test the ASTM-D6413. 3. . Results and Discussion
A. Mechanical Properties
A.1Tension Results
After the use of the flame retardants the mechanical properties of the fabrics were improved or at least remained the same as compared with the fabrics without any treatment, because the retardants form a coated on the textiles, the better results for the tension test are
those for the mix Borax/Hexametaphosphate of Sodium/Water in the warp and weft. The results of tension test in original samples and after the treatment with different retardants are summarized in Table 1.
Table 1 Results of the Tension Test (Kgf). Fiber
OriginalCommercialRetardant Pure
CommercialRetardant/ Water 1:1
Borax 100g/l
Borax 200g/l
Borax/Hexame taphosphate of Sodium
Warp 52.52 53.12 53.06 53.47 54.71 65.74
Weft 46.15 46.12 47.12 47.83 51.62 63.03
A.2 Ripped test
Only in two values the resistance to rip is equal to the original of the acrylic warp with the commercial retardant and with the mix of Borax/Hexametaphosphate of Sodium/Water as seen in table 2. It is agreement with the values of elongation. The lost of elongation made the acrylic more stiffness and the sample lost resistance to rip.
Table 2 Results of the Ripped Test (Kgf) Fiber
OriginalCommercialRetardant Pure
Commercial Retardant/ Water 1:1
Borax 100g/l
Borax 200g/l
Borax/Hexame taphosphate of Sodium
Warp 9.84 8.49 9.70 7.63 6.20 9.29
Weft 9.81 6.66 7.31 7.63 5.36 5.68
A.3 Inflammability
The flame retardant capabilities of the textile fabrics before and after the use of the flame retardant products were investigated using the special textile methods for inflammability. The results of the inflammability tests after the use of different products are presented in Table 3.
Table 3 Results of the Inflammability Resistance Tests (Sec.) Fiber
Original Borax 100g/l
Borax 200g/l
Borax/Hexame taphosphate of Sodium
Warp 8.62 99.71 147.93 157.85
Weft 8.53 114.07 143.27 146.88
From this table one can observe that the burning time of the fabrics treated with the solution based on Borax (Na2B4O5(OH)4•8H2O)increased in several times in dependence on Borax concentration. The treatment with the solution Borax/Hexametaphosphate of Sodium (Na16P14O43) leads to the same results. So, these flame retardant products can stop the combustion of fabrics on certain distance before the sample with the commercial retardant product will be completely consumed. The possible explanation of such result is due to decomposition of Borax and liberation of water, which retards the fire propagation in the sample.
100 Copyright © 2012 SciRes.

This process takes place because of low melting point (75 ºC) of Borax. For the fabrics after treatment with solution contained Borax and Hexametaphosphate of Sodium the same results were obtained. If Borax forms water at the moment of its decomposition then the Hexametaphosphate of Sodium, which is the compound contained phosphorus and oxygen, at the decomposition gives rise phosphoric acid (H3PO4), which reacts with the hydroxyl groups released by the Borax producing of dehydration. The dehydrated materials, which were formed from the Borax, generated remaining carbon relatively fire-resistant, which functioned like a barrier and inhibited the degradation and protected the material from the pyrolisis.
A.4 Scanning Electron Microscopy
SEM was used in order to observe how the flame retardants have been deposited onto coated fibers figure 1 it can be seen the formation of small crystallites on the fiber surface after immersing in the solution with Borax. From this image it can be concluded that the covering processes of the acrylic fiber by two different retardant materials are different. At the same time Borax, also does not interact with the fiber chemical structure, however instead of the film formation crystallites grew on the fiber surface.
Figure 1 SEM micrograph of the sample coated with Borax 100g/l /Hexametaphosphate of Sodium to 100g/l (1000X).
4. IV Conclusions
The flammability tests the fabrics with the prepared new flame retardant products showed very good results such as 8 seconds of combustion for the untreated fabric and 2 minutes for the fabric treated with the solution of Borax / Hexametaphosphate from Sodium /Water. This result shows the essential increase of combustion retardation time. The gained time space is very important as during these 2 minutes at a conflagration it is possible to save lives or to control the fire. The tension Test
Resistance is better with the mix of Borax and Hexametaphosphate than the original Acrylic. The scanning electron microscopy shows that the flame commercial retardant is deposited on the surface of the fabric as a thin film and the solutions based on Borax and Hexametaphosphate of Sodium were deposited in the form of crystals on surface. These coatings do not produce any new chemical species within the internal structure of the fiber.
REFERENCES[1] J. Detrell, 1998 Comportamiento al calor de los materiales textiles. Tecnitex Documentación. Terrassa, España. [2] I. Cuadra, A. Belkis, G. Infante, L. Beltrán, C. Melian, 2001 Estudio del comportamiento de la combustión de diferentes tejidos utilizados como ropas protectoras. Revista Latinoamericana de Tecnología Textil, 13, 37-45. [3] K. Kandola, A.R. Horrocks, P. Myler, D. Blair, 2002. The effect of intumescents on the burning behavior of polyester-resin-containing composites. Composites: Part A,Applied science and manufacturing, 33, 805-817. [4] M.J. Tsafack, J. Levalois-Grützmacher, 2006. Flame retardancy of cotton textiles by plasma- induced graft-polymerization (PIGP) Surface & Coatings Technology, 201,2599–2610. [5] M.J. Tsafack, J.Levalois-Grützmacher, 2007. Towards multifunctional surfaces using the plasma-induced graft-polymerization (PIGP) process: Flame and waterproof cotton textiles. Surface & Coatings Technology, 201,5789–5795. [6] M.J. Tsafack, J.Levalois-Grützmacher, 2007. Plasma-induced graft-polymerization of flame retardant monomers onto PAN fabrics Surface & Coatings Technology, 201,3503– 3510. [7] D. Weifu, Z. Xiaohong, L.Yiqun, W. Qingguo, G. Hua, G. Jianming, S. Zhihai, L. Jinmei, H. Fan, Q. Jinliang, 2006. Flame retardant nanocomposites of polyamide 6/clay/silicone rubber with high toughness and good flowability Polymer, 47, 6874-6879. [8] E. Baysal, M. Altinok, S. Colak, K. Ozaki, H. Toker, 2007. Fire resistance of Douglas fir (Pseudotsuga menzieesi) treated with borates and natural extractives. Ioresource Technology, 98, 1101–1105. [9] A. J. De Saja, M.A. Rodríguez, M.L. Rodríguez, Materiales, 2005. Estructura, Propiedades y Aplicaciones, Ed. Thomson.
Copyright © 2012 SciRes. 101

Influence of Humidity on Yield Stress Determination by Slump Test of Slip-Prone Clayey Soils and Their Relation
with the Chemical Properties.
Arturo F. Méndez-Sánchez, Ana M. Paniagua-Mercado1, Karen E. Nieto-Zepeda, Leonor Pérez-Trejo, Elvia Diaz Valdés, Concepción Mejía García
Escuela Superior de Física y Matemáticas, Instituto Politécnico Nacional, Edif. 9 Unidad Profesional Adolfo López Mateos, Col. Lindavista, C. P. 07738, México D. F., México.
1e-mail: [email protected]
Abstract—In this work, the yield stress evaluation as a function of water content for slip-prone clayey soils is studied in order to understand how yield stress decreases as water content increases, and their relation with the chemical properties. The clayey soil samples were taken from the region of Teziutlán-Puebla-Mexico. Yield stress was calculated using the slump test in cylindrical geometry. Results show three zones. The first one shows an exponential decrement on yield stress due to lower water content in accord with clayey soils with high content of illita, followed by a second region where yield stress decreases dramatically at a certain critical water concentration, and the third one where yield stress dependence is not well-defined since the clayey soil flow is seen. Finally, it is discussed how yield stress variation due to the water increment influences the landslide risk increment.
Keywords-Clayey Soil, Yield Stress, Slump Test, Microstructure, illita
1. IntroductionThere are a few studies focused to analyze the modified
physical parameters before a landslide occurrence [1-3]. Reference [1] implemented a debris-flow monitoring system employing real-time rain gauge data. The pre-warning for the time of landslide triggering derives from the critical rainfall peak obtained from historical events, involving regional rainfall patterns and geological conditions. Reference [2] proposed equations of state of soil prone to slum-type settlement, which take into account the degree of wetting in the initial stage. These equations were developed using models of deformation of the continuous and experimental results of cohesion and the angular coefficient of internal friction as well as the bulk compression and shear modulus. Those authors proposed a plasticity function that decreases exponentially when the wetting content in the soil is increased. It is clear that plasticity function is one of the most important modified parameters before of a landslide occurrence by rainfall. Hence, landslides can take place because of load excess generated by a water saturated soil overcoming yield stress [4-6], as well as,
infiltrated water excess in the soil (decrement of the pore pressure) produces a yield stress decrement and the internal load overcomes the decremented yield stress.
In this work, the yield stress evaluation as a function of water content for slip-prone clayey soils due rainfall is studied in order to understand how yield stress is decremented by the water content. Yield stress was calculated for several water concentrations using the slump test in cylindrical geometry. Particularly, samples of the region of Teziutlán-Puebla-Mexico were tested and the results were analyzed and compared with the historical daily rain data of October 1999, when a landslide occurred in the zone. In addition, a comparison of the chemical microstructure and the compound determination using Energy Dispersive Spectroscopy by X-ray dispersion was performed. As well, clayey soils were characterized by SEM observation and X-ray diffraction.
2. Experimental ProcedureThe studied clay corresponds to high risk zone located in
the Aurora neighborhood in Teziutlán-Puebla-Mexico, where a landslide took place due to high rainfall in October 1999 [7]. The zone where the sample was taken corresponds to a transition zone of two physiographic units-the transversal volcanic belt and oriental mountain chain. Andosol is the predominant soil derived from volcanic materials; also, there are ignimbrites and clayey soils. This kind of soil is characterized by a variable high capacity of acquiring water and humidity.
Microanalyses of chemical composition were performed with an energy dispersive spectroscopy technique (EDS) attached to a scanning electron microscope FEI, Sirion. In addition, X-ray diffraction experiments were carried out employing a MMA, GBC diffractometer in order to determine the clayey compounds, by using CoK� radiation (=1.789Å) in the 2- range of 5-120 degrees with a 0.02 step and 0.5s as step width and step counting time respectively.
The samples were sifted with a standard mesh No. 8 (2.36 mm) mesh in order to eliminate larger debris. Samples of 0.3
Advances in Materials Physics and Chemistry Supplement: 2012 world Congress on Engineering and Technology
102 Copyright © 2012 SciRes.

kg of clay were prepared at 30-40 wt% of water concentration, and slump test experiments were carried out [8]. The method consists of filling a cylindrical frustum with the material to be tested in the specified way; lifting the frustum off and allowing the material to collapse under its own weight (Figure 1). The height of the final slumped material is measured and the difference between the initial and final heights is called the slump height (s). Figure 1 outlines the experimental procedure.
Figure 1 Slump test diagram, a) frustum filling, b) frustum lifting, c) collapsed material, and d) slump height measurement.
Yield stress value (�y) was calculated by the equation of Pashias and coworkers, expression 1.
:;
<=>
?�
HsgHy 2
121@� . (1)
Where @ is the material density, g is the gravity, s is the slump height, and H is the frustum height. In this case, the slump height was measured at room temperature, after 40 seconds lifting the frustum off, as was suggested in a previous work [9, 10].
3. Results and Discussion Fig. 2 shows SEM micrographs of clayey soil. It can be
observed a granular shape with a fibrous surface of individual particles. Table 1 shows the chemical composition determined by EDS analysis. High contents of aluminum and silicon were detected as expected for this type of material. Besides, a low content of Iron and Titanium was observed in this material. Fig. 3 shows the particle size distribution. It can be seen that 60% of the particle sizes are in the range between 300 and 1250 microns, the 10% are in the interval 1250- 2360 microns, and the rest 30% of the particle size is shorter than 200 microns.
TABLE I. CHEMICAL COMPOSITION OF CLAYEY SOIL.
Element Wt% Int. Error O 49.09 0.55 Al 18.17 0.59 Si 23.1 0.55 Ti 1.42 3.37 Fe 8.23 1.46
Total 100
The X-ray diffraction analysis of clayey soil shows the presence of compounds, such as illite (39.79%), gibbsite (33.74%) and cristobalite (26.47%). The peak identification is shown in Fig. 4 and the Percentage of mineralogical phases is shown in Table 2.
Figure 2 SEM images at a) 500x and b) 1000x, granular shape with fiber conformation.
Figure 3 Particle size distribution of the clayey soil.
a)
b)
20
40
60
80
100
0.1 10
5
10
15
20
25
30
35
Finus
Particle size distribution Gauss fit
Freq
uenc
y (%
)
Particle size (mm)
Cum
ulat
ive
frequ
ency
Cumulative frequency Sigmoidal fit
Copyright © 2012 SciRes. 103

Figure 4 X-ray diffraction pattern of the clayey soil.
Fig. 5 shows the plot of yield stress, �y, versus water concentration expressed in weight percentage. In the case of contents lower than 35.5 wt%, the yield stress decreases exponentially with concentration. The regression equation is also shown. These results are in agreement with Sultanov and Khusanov’s model [2], as well as with that reported by Sánchez-Crúz [9]. These authors studied a clayey soil with the presence of illite, which showed a similar behavior. In the case of contents between 35.5 wt% and 36 wt%, the yield stress shows an abnormal behavior and it decreases substantially, up to 50 percent of its initial value. At this point, it is possible to elucidate an increment in the landslide risk, since the sample has changed from solid-plastic to solid-viscous behavior. It is important to mention that this decrease in yield stress was not predicted by the Sultanov and Khusanov’s model, in spite of having included the plastic and the viscous behavior in their model. For higher water concentrations (>36 wt %), a non-linear decrement on yield stress is seen and it differs from the exponential or power-law behavior. We believe that this response is due to a combination of non-Newtonian behavior and yield stress and this is not possible to separate them in the slump test.
Additionally, upper horizontal axis in Fig. 5 shows the variation of yield stress versus equivalent millimeters of rainfall. In this case, it was supposed that all of the water was absorbed by the clayey soil. Millimeters of rainfall (h) were calculated by using the expression 2.
AVh w . (2)
TABLE II. PERCENTAGE OF MINERALOGICAL PHASES.
Element Percentage % SiO2 39.79
KAl2(SiAlO10)(OH)2 33.74 Al2O3H2O 26.47
Total 100.00
Figure 5 Yield stress versus water percentage concentration.
Where VW is the water volume in the frustum, and A is the frustum cross section.
Under this assumption, it can be seen that only 23 mm of water are enough for the soil to start to flow. However, this value is lower in comparison with the historical rainfall data obtained in the studied geographical zone [7], where the maximum rainfall peak was reached (360 mm of water) the day before the landslide and considering that in the previous ten days, an unusual accumulated rainfall reached 908 mm (compared with the medium annual rain 1593 mm). This difference arises from the small quantity of the rainfall absorbed by the soil (nature’s soil) and by the fact that most of the water moves down due to the region´s inclination (23 degrees). In order to clarify this, it would be necessary to carry out the yield stress determination immediately after the occurrence of a landslide and measure the absorbed rainfall water.
4. ConclusionsYield stress determination as function of water content by a
slump test for a clayey soil from a Teziutlán-Puebla-Mexico zone was performed. The results showed an exponential decrement of yield stress followed by an abrupt reduction of it with the increase in water concentration. From this value, an increment of the risk of landslide was revealed. At high water content (36%), a decrease in yield stress was observed, and a more complex behavior was exhibited. Finally, a correlation of yield stress with rainfall was done, but results were below the values reported in the literature.
5. Acknowledgment The authors thank to Professor V. M. López-Hirata by his
useful comments.
0 20 40 60 80 100 1200
100
200
300
400
500
600
700
3313
1
1
3
3
(2)21 1111
3
2
1
22
2
Cou
nts
Degrees 2-Theta
1) SiO22) K Al2(Si3AlO10)(OH)23) Al2O3!33H2O
30 32 34 36 38 400
50
100
150
200
250
300
350
21.0 21.5 22.0 22.5 23.0 23.5 24.0 24.5 25.0
Yiel
d st
ress
(Pa)
Water concentration (%)
Yield stress measurements�
y=170.7157e-.08397 *C
Rainfall milimeters (mm)
104 Copyright © 2012 SciRes.

REFERENCES[1] C. Chien-Yuan, C. Tien-Chen, C. Y. Fan-Chieh, Y. Wen-Hui, T. Chun-
Chieh, “Rainfall duration and debris-flow initiated studies for real-time monitoring,” Environment Geology, vol. 47, p.p. 715–724, 2005.
[2] K. S. Sultanov, B. E. Khusanov, “State equations for soils prone to slump-type settlement with allowance for degree of wetting,” Soil Mechanics and Foundations Engineering, vol. 38, No. 3, p.p. 80-86, 2001.
[3] I.A. Caldiño-Villagómez, I. Bonola-Alonso, G. Salgado-Maldonado,“Estudio experimental del esfuerzo de cedencia con relación al flujo de lodos y debris,” Asociación Internacional de Ingeniería e Investigaciones Hidro-Ambientales vol. 8, [Memorias del XXII Congreso Latinoamericano de Hidráulica, Guayana, Venezuela].
[4] D. F. Van Dine, R. F. Rodman, P. Jordan, J. Dupas, “Kuskonook Creek, an example of a debris flow analysis,” Lanslides vol. 2, p.p. 257-265, 2005.
[5] R. M. Iverson, “The physics of debris flows,” Reviews of Geophysics, vol. 35, No. 3, p.p. 245–296, 1997.
[6] R. P .Denlinger, R. M. Iverson, “Flow of variably fluidized granular masses across three-dimensional terrain 2. Numerical predictions and experimental tests,” Journal of Geophysical Research, vol. 106, No. b1, p.p. 553–566, 2001.
[7] P. Flores Lorenzo, I. Alcántara Ayala, “Cartografía morfogenética e identificación de procesos de ladera en Teziutlán, Puebla,” Investigaciones geográficas Boletín, vol. 49, p.p. 7-26, 2002.
[8] N. Pashias, J. Boger, D.V. Summers, D. J. Glenister, “A fifty cent rheometer for yield stress measurement,” Journal of Rheology, vol. 40, No. 6, p.p. 1179-1189, 1996.
[9] P. Sánchez Crúz, “Análisis del esfuerzo de cedencia de suelos arcillosos como posible indicador de un derrumbe,” Bachelor Thesis, ESFM, Instituto Politécnico Nacional, Mexico, 2008.
[10] A. F. Méndez-Sánchez, L. Pérez-Trejo, A. M. Paniagua Mercado, “Determinación del esfuerzo de cedencia para suelos vulnerables a deslizamientos originados por lluvias,” Boletín de la Sociedad Geológica Mexicana, vol. 63,No 2, p.p. 345-352, 2011.
Copyright © 2012 SciRes. 105

Preparation of high Ga content Cu(In,Ga)Se2 thin films by sequential evaporation process added In2S3
Toshiyuki Yamaguchi, Kazuma Tsujita Department of Electrical and Computer Engineering,
Wakayama National College of Technology, Gobo, Wakayama 644-0023, Japan
e-mail [email protected]
Shigetoshi Niiyama, Toshito Imanishi Industrial Technology Center of Wakayama Prefecture,
60 Ogura, Wakayama-shi, 649-6261, Japan
Abstract— High Ga content Cu(In,Ga)Se2 thin films incorporated sulfur were prepared by sequential evaporation from CuGaSe2 and CuInSe2 ternary compounds and subsequently Ga2Se3, In2Se3 and In2S3 binary compounds. The In2S3/(Ga2Se3+ In2Se3) ratio was varied from 0 to 0.13, and the properties of the thin films were investigated. XRD studies demonstrated that the prepared thin films had a chalcopyrite Cu(In,Ga)Se2 structure. The S/(Se+S) mole ratio in the thin films was within the range from 0 to 0.04. The band gaps of Cu(In,Ga)Se2 thin films increased from 1.30 eV to 1.59 eV with increasing the In2S3 /(Ga2Se3+ In2Se3) ratio.
Keywords-Cu(In,Ga)Se2 thin film; solar cell; high Ga content; sulfur incorporation; sequential evaporation
1. IntroductionPhotovoltaic power system has received considerable
attention for safety and clean energy resources. It is necessary to fabricate low cost and high efficient solar cells in order to spread the PV system widely. Chalcopyrite Cu(In,Ga)Se2 is a potential absorber material for high efficiency thin film solar cell because of its favorable band gap and high absorption coefficient for solar radiation. The band gap energy of Cu(In,Ga)Se2 thin films varies from about 1.0eV to 1.7eV according to the increase in CuGaSe2 molar fraction which makes it also promising for single-junction and multi-junction solar cell applications [1]. Conversion efficiencies for Cu(In,Ga)Se2 based solar cells have been significantly improved over recent years and achieved the value of 20% by three-stage process using a multisource vacuum evaporation system equipped with elemental Cu, In, Ga and Se sources [2, 3]. The Ga/(In+Ga) ratio of this absorber was around 0.3, which showed a band gap Eg of about 1.14 eV. It is expected to improve the efficiency by increasing its band gap until 1.4 eV due to a better matching solar spectrum. The conversion efficiencies of Cu(In,Ga)Se2 thin film solar cells decreased with increasing a Ga/(In+Ga) mole ratio above 0.3 [4]. For example, the efficiencies of Cu(In,Ga)Se2 thin film solar cells were 12% for Ga/(In+Ga) mole ratio of 0.73 (Eg=1.5 eV) and 10% for that of 0.91 (Eg=1.62 eV), respectively [4]. On the other hand, a performance of Cu(In,Ga)Se2 thin film solar cell with a Ga/(In+Ga) mole ratio of around 0.3 was improved by sulfurization of the film surface such as InS treatment by a wet
process [5] and annealing in S vapor atmosphere [6]. We have proposed the process using a vacuum deposition apparatus with three evaporation boats which was the sequential evaporation technology from CuGaSe2 and CuInSe2 ternary compounds [7, 8]. Our proposed process has advantages to be able to easily control a Ga/(In+Ga) mole ratio in Cu(In,Ga)Se2 thin films by changing the amount of CuGaSe2 and CuInSe2 evaporating materials in the first step and to use inexpensive equipment for preparation of an absorber layer. In this study, one evaporation source was added in our vacuum deposition apparatus. In2S3 was added as an evaporation material in the third step of our sequential evaporation process and the prepared thin films and solar cells were investigated.
2. ExperimentalA. Preparation of Cu(In,Ga)Se2 Thin Films Added In2S3
The evaporating materials of CuGaSe2 and CuInSe2 were synthesized by reacting stoichiometric amounts of high-purity elements (Cu, In, Ga, Se) in sealed and evacuated quartz ampoules. The detail procedure was described in Reference [9]. The CuInSe2 and CuGaSe2 ingots were removed from the quartz ampoules. In2Se3, Ga2Se3 and In2S3 compounds available in the market were used as an evaporating material. Mo layer used as a back contact was prepared by rf magnetron
0
100
200
300
400
500
600
Tem
pera
ture
[]
Time
CuI
nSe 2
+C
uGaS
e 2Preh
eatin
g
In2S
e 3+
Ga 2
Se3
In2S
3
Se
Fig. 1. Schematic profile of our sequential evaporation process.
Advances in Materials Physics and Chemistry Supplement: 2012 world Congress on Engineering and Technology
106 Copyright © 2012 SciRes.

sputtering onto soda-lime glass substrate in Ar ambient. Our evaporation process consists of the four steps, which schematic profile was shown in Fig. 1. Before fabrication of Cu(In,Ga)Se2 thin films, the Mo/soda-lime glass substrates were heated in vacuum for 5min at 500oC with infrared lamp. After cooling down to 200oC, in the first step, Cu-In-Ga-Se layer was evaporated from CuGaSe2 and CuInSe2 compounds onto the Mo/soda-lime glass. The CuGaSe2/(CuGaSe2+ CuInSe2) mole ratio of the evaporating materials kept at constant of 0.8. In the second step, In-Ga-Se layer was deposited from In2Se3 and Ga2Se3 compounds at a substrate temperature of 490oC. The (In2Se3+Ga2Se3)/(CuGaSe2+ CuInSe2) mole ratio kept at constant of 0.2. In the third step, S was deposited from In2S3 compound at a substrate temperature of 490oC.The In2S3/(In2Se3+Ga2Se3) mole ratio was varied from 0 to 0.13 in this experiment. Finally, only Se was effused at the same substrate temperature.
B. Fabrication of Solar Cells The solar cells with a configuration of Al/ZnO:Al/i-
ZnO/CdS/Cu(In,Ga)Se2/Mo/SLG substrate were fabricated. CdS buffer layer with a thickness of 70 nm was deposited by the chemical bath deposition technique using a CdI2 (2.0x10⁻³
M)-thiourea (0.166M)- ammonia (1M) aqueous solution during heating from room temperature to 65oC. i-ZnO buffer layer with a thickness of 100 nm was deposited by rf-magnetron sputtering from non-doped ZnO target in Ar gas at room temperature. Transparent conductive ZnO:Al film with a thickness of 0.4 �m was subsequently deposited by rf-magnetron sputtering from a 2wt%Al2O3 doped ZnO target in Ar gas at room temperature. Al grids for the front electrode were formed by a vacuum evaporation with W boat using a metal mask. No antireflection coating was applied. The size of a solar cell is 5mmx5mm.
C. Characterization The surface composition of thin films were determined by
an electron probe microanalysis (EPMA). The effective range of electron for production of the characteristic X-rays in EPMA analysis is roughly estimated to be around 0.4�m for Cu(In,Ga)Se2 thin films [10]. The growth orientation of thin films was studied by X-ray diffraction (XRD) in the --2- mode using Cu K� radiation. The surface and cross-section morphology and grain size of the thin films were studied by scanning electron microscopy (SEM). Current-voltage characteristics of solar cells were measured using standard 1-sun (AM1.5, 100mW/cm2) illumination. The quantum efficiencies of solar cells were measured using a spectrophotometer with illumination normalized against calibrated photodiode.
3. Results and Discussion D. Film Composition
From EPMA analysis, the thin films prepared at various In2S3/(In2Se3+Ga2Se3) mole ratio had almost a stoichiometry composition in I-III-VI2 compound. Figure 2 shows the compositional ratio of Ga/(In+Ga) and S/(Se+S) in the thin
films. In this experiment, the CuGaSe2/(CuGaSe2+CuInSe2) mole ratio in the evaporating materials was kept at constant of 0.8. The Ga/(In+Ga) mole ratio in the thin films prepared in the range of In2S3/(In2Se3+Ga2Se3) mole ratio from 0 to 0.13 was within the range from 0.855 to 0.747. The Ga/(In+Ga) mole ratio slightly decreased with increasing the In2S3/(In2Se3+Ga2Se3) mole ratio due to the presence of In in the third step. These values are considered to be a high Ga content which is the purpose of this study. On the other hand, the S/(Se+S) mole ratio in the tin films increased from 0 to 0.04 with increasing the In2S3/(In2Se3+Ga2Se3) mole ratio. A slightly S incorporation into the thin films was confirmed from
0
0.02
0.04
0.06
0.08
0.1
0
0.2
0.4
0.6
0.8
1
Ga/
(In+
Ga)
In2S3 /(In2Se3+Ga2Se3)
Ga/(In+Ga) S/(Se+S)
S/(S
e+S)
Fig. 2. Compositional ratio of the prepared thin films determined by EPMA.
15 25 35 45 55 65 75 85
Inte
nsity
[a.u
.]
2[deg]
In2S3/(In2Se3+Ga2Se3)=0.13
0.0
0.04
0.09
112
220
204
204
116
316
400
Fig. 3. XRD patterns of the thin film prepared at In2S3/(In2Se3+Ga2Se3)=0- 0.13.
Copyright © 2012 SciRes. 107

EPMA analysis.
E. Crystal Structure Figure 3 shows XRD patterns for the thin films prepared at
In2S3/(In2Se3+Ga2Se3) mole ratio of 0 to 0.13. XRD spectrum exhibited several peaks corresponding to diffraction lines of the chalcopyrite phase in Cu(In,Ga)Se2, in particular split of 220/204 and 312/116 diffraction lines. The 112 diffraction line was the strongest. The position of X-ray diffraction peaks for Cu(In,Ga)Se2 thin films prepared at various In2S3/(In2Se3+Ga2Se3) mole ratio was almost same although the Ga/(In+Ga) and S/(Se+S) mole ratio in the thin films was slightly different.
F. Grain Size SEM micrographs of the cross section of Cu(In,Ga)Se2 thin
films prepared at In2S3/(In2Se3+Ga2Se3) mole ratio of 0 to 0.13 are shown in Fig. 4. This Cu(In,Ga)Se2 thin films had a high Ga content such as Ga/(In+Ga) mole ratio of the range from 0.855 to 0.747. The grain size in Cu(In,Ga)Se2 thin film was estimated to be smaller than 1.0�m. It is well known in general that efficiencies of polycrystalline solar cells increase with increasing grain sizes in the absorber materials. Therefore, the large grain growth in Cu(In,Ga)Se2 thin films is required for the fabrication of high-performance photovoltaic devices. In comparison with Fig. 4 (a) and (b), the grain size in Fig. 4 (b) was seemed to be larger than that in Fig. 4 (a), suggesting
the promotion of the grain growth by slightly In2S3 supplying.
G. Band gap Engineering The solar cells with a configuration of ZnO:Al/i-
ZnO/CdS/Cu(In,Ga)Se2/Mo/soda-lime glass substrate were fabricated by using Cu(In,Ga)Se2 thin films prepared at In2S3/(In2Se3+Ga2Se3)=0-0.13. The best solar cell demonstrated Voc=500mV, Isc=19.07mA/cm2, FF=0.39 and A=4.1% without AR-coating, which used Cu(In,Ga)Se2 thin
film prepared at In2S3/(In2Se3+Ga2Se3)=0.04. The efficiencies for Cu(In,Ga)Se2 thin film solar cells were not so good. However, the remarkable change was observed in the quantum efficiency of Cu(In,Ga)Se2 thin film solar cells, which was shown in Fig. 5. The quantum efficiency from 400 nm to 600nm for Cu(In,Ga)Se2 thin film solar cells prepared at In2S3/(In2Se3+Ga2Se3)=0.04 and 0.09 increased rather than that at In2S3/(In2Se3+Ga2Se3)=0. Moreover, the absorption band edge in the long wavelength region shifted to the short wavelength range with increasing In2S3/(In2Se3+Ga2Se3) mole ratio. For a direct transition, the dependence of the absorption coefficient � on the photon energy h. is given by
�h.=A(h.-Eg)1/2. (1)
Assuming a very short minority carrier diffusion length Ln, the quantum efficiency QE can be approximated by
0
20
40
60
80
100
300 500 700 900 1100
Qua
ntum
Eff
icie
ncy[
%]
Wavelength[nm]
InS=0InS=0.04InS=0.09InS=0.13
Fig. 5. Quantum efficiency of Cu(In,Ga)Se2 thin film solar cells prepared at In2S3/(In2Se3+Ga2Se3)=0-0.13.
Fig. 4. SEM micrographs of the cross-section of Cu(In,Ga)Se2 thin films prepared at In2S3/(In2Se3+Ga2Se3) =0-0.13.
(a) In2S3/(In2Se3+Ga2Se3)=0.0 (b) 0.04
QE=1-exp(-�W) (2)
where W is the width of the space charge region. From eq. (1) and (2), the following equation is deduced
In(1-QE)xh.=-WA(h.-Eg)1/2 (3)
so that a plot of [h.xIn(1-QE)]2 against h. can be used to extrapolate the band gap Eg [11]. From this manner, the band gaps estimated from the QE spectra were changed from 1.30 eV to 1.59 eV, which shown in Fig. 6 including the open circuit voltage Voc of Cu(In,Ga)Se2 thin film solar cells. The value of band gap is expected to be 1.56eV for Cu(In,Ga)Se2 thin film with Ga/III=0.855 from the data reported by Paulson et al [12]. However, the band gap of 1.30eV obtained from Cu(In,Ga)Se2 thin film prepared at In2S3/(In2Se3+Ga2Se3)=0 in this experiment was extremely a small value. It has been reported that efficient Cu(In,Ga)Se2 thin film solar cells with Ga/(In+Ga) mole ratio of 0.3 fabricated by three stage process had a double graded band gap structure [13]. Therefore, it is presumed that the value of 1.3 eV demonstrates the bottom of
(c) 0.09 (d) 0.13
108 Copyright © 2012 SciRes.

the double graded band gap structure. This result is suggestive that Cu(In,Ga)Se2 thin film solar cells with a high Ga/(In+Ga) mole ratio have a deep valley structure. The deep valley prevents the carrier collection and causes the deterioration of solar cell performance. The similar tendency for Cu(In,Ga)Se2 thin film solar cells with Ga/(In+Ga) mole ratio of 0.3 fabricated on Mo coated Ti foils by three stage process has been reported [14]. On the other hand, Cu(In,Ga)Se2 thin film prepared at In2S3/(In2Se3+Ga2Se3)=0.04 demonstrated a band gap of 1.4 eV, which was suitable for a better matching solar spectrum. Thus the cell performance was improved. Therefore, In2S3 slightly supplying is one of the promising methods to
improve the performance of Cu(In,Ga)Se2 thin film solar cells.
4. ConclusionFor photovoltaic device applications, Cu(In,Ga)Se2 thin
films were prepared by sequential evaporation process. The effect of In2S3 supplying in the third step was examined. XRD study showed that Cu(In,Ga)Se2 thin films had a chalcopyrite structure. EPMA analysis demonstrated that Cu(In,Ga)Se2 thin films have Ga/(In+Ga) mole ratio of 0.855-0.747 and S/(Se+S) mole ratio of 0-0.04. From SEM micrograph, Cu(In,Ga)Se2 thin films were formed with small grains. From the quantum
efficiency analysis, Cu(In,Ga)Se2 thin film solar cells with a high Ga/(In+Ga) mole ratio prepared by sequential evaporation process had a deep valley structure, which was the most remarkable point in this study. This result indicates that it is expected to obtain the improvement in Cu(In,Ga)Se2 thin film solar cells with a high Ga/(In+Ga) mole ratio by controlling an adequate double graded band gap structure. The performance of Cu(In,Ga)Se2 thin film solar cell was improved by using slightly In2S3 compound in the third step.
5. Acknowledgment This study was supported in part by a Grant-in-Aid for
Scientific Research from the Ministry of Education, Culture, Sports, Science and Technology in Japan.
0
200
400
600
800
1
1.1
1.2
1.3
1.4
1.5
1.6
1.7
0 0.05 0.1 0.15
Ban
dgap
[eV
]
In2S3 /(In2Se3+Ga2Se3)
Bandgap VocREFERENCES
[1] T. Yamaguchi, J. Matsufusa and A. Yoshida, Jpn. J. Appl. Phys. 31, 1992, pp. L703-L705.
[2] P. Jackson, D. Hariskos, E. Lotter, S. Paetel, R. Wuerz, R. Menner, W. Wischmann and M. Powalla, Prog. Photovolt. Res. Appl., 2011, DOI: 10.1002/pip.1078.
V]
c[m
Vo
[3] I. Repins, M. A. Contreras, B. Egaas, C. DeHart, J. Scharf, C.L. Perkins, B. To and R. Noufi, Prog. Photovolt. Res. Appl. 16, 2008, pp. 235-239.
[4] M. A. Contreras, K. Ramanathan, J. AbuShama, F. Hasoon, D. L. Young, B. Egaas and R. Noufi, Prog. Photovolt. Res. Appl. 13, 2005, pp. 209-216.
[5] T. Wada, Y. Hashimoto, S. Nishiwaki, T. Satoh, S. Hayashi, T. Negami and H. Miyake, Solar Energy Materials and Solar Cells 67, 2001, pp. 305-310.
[6] D. Ohashi, T. Nakada and A. Kunioka, Solar Energy Materials and Solar Cells 67, 2001, pp.261-265. Fig. 6. Dependence of band gap and open circuit voltage on
In2S3/(In2Se3+Ga2Se3) mole ratio. [7] T. Yamaguchi, M. Naka, S. Niiyama and T. Imanishi, J. Physics and Chemistry of Solids 66, 2005, Issue 11, pp.2000-2003.
[8] T. Yamaguchi, Y. Asai, K. Yufune, S. Niiyama and T. Imanishi, Phys. Status Solidi C 6, No. 5, 2009, pp.1229-1232.
[9] T. Yamaguchi, Y. Asai, S. Niiyama, T. Imanishi, Proc. of 2011 World Congress on Engineering and Technology (Shanghai, Oct.28-30, 2011, IEEE) Vol. 4, pp.601-604.
[10] J. I. Goldstein, D. E. Newbury, P. Echlin, D. C. Joy, C. Fiori and E. Lifshin: Scanning Electron Microscopy and X-ray Microanalysis, Plenum Press, New York, 1981.
[11] G. Zoppi, I. Forbes, R. W. Miles, P. J. Dale, J. J. Scragg and L. M. Peter, Prog. Photovolt. Res. Appl. 17, 2009, pp.315-319.
[12] P. D. Paulson, R. W. Birkmire and W. N. Shafarman, J. Appl. Phys. 94, 2003, pp.879-888.
[13] M. A. Contreras, B. Egaas, K. Ramanathan, J. Hiltner, A. Swartzlander, F. Hasoon and R. Noufi, Prog. Photovolt. Res. Appl. 7, 1999, pp.311-316.
[14] T. Yagioka and T. Nakada, Appl. Phys. Express 2, 2009, 072201
Copyright © 2012 SciRes. 109

Thermal Degradation Kinetics of iPP/Pd NanocompositePrepared by a Drying Process
Jae-Young Lee, Hong-Ki LeeHydrogen Fuel Cell Parts and Applied Technology RIC
Woosuk Univ., Wanju, [email protected]
Sung-Wan HongDept. of Cosmetics, Woosuk Univ.
Samnye, Korea
Il-Yub ChoiDept. of Enviro. Eng., Univ. of Seoul
Seoul, Korea
Abstract— Palladium (Pd) nanoparticles were incorporatedinto isotactic polypropylene (iPP) film by a one-step dryprocess. iPP film was exposed to the sublimed Pd(acac)2 vaporin a glass vessel at 180oC. The Pd nanoparticles were observedby transmission electron microscope (TEM), and it was foundthat metallic nanoparticles were selectively loaded on theamorphous regions between the lamellae in iPP. Thermaldegradation kinetics was investigated by introducing the dataof thermogravimetric analysis (TGA) to Flynn & Wallequation. TGA data showed that thermal degradationtemperature (Td) of the neat iPP was improved about 35oC byloading 0.27 wt% Pd nanoparticles. Thermal degradationactivation energy (Ed) for iPP/Pd nanocomposite was 227.85kJ/mol while that of neat iPP was 220.57 kJ/mol. These resultsmeant that the Pd nanoparticles acted as a retardant in thethermal degradation of neat iPP polymer chain.
Keywords- Pd nanoparticles; polymer nanocomposite;isotactic polypropylene; thermal degradation; Flynn & Wallequation
1. IntroductionUniformly dispersed metallic nanoparticles into a polymer
matrix can offer new functional materials in the variousapplications such as catalysts, optics, senses, magnetics andelectrics. Therefore many researchers have investigated todevelop new methods for the preparation of polymer/metalnanocomposites avoiding their easy oxidation, contamination,and aggregation problems, and these methods are mainlyclassified into five: (1) a metallic precursor solution and apolymer solution are mixed in a reactor, and then the metallicprecursor is reduced to the metallic nanoparticles duringstirring, heating and evaporating the solvent [1-3]; (2) ametallic precursor is dissolved in a monomer and then isthermally reduced during the polymerization at high reactiontemperature [4, 5]; (3) a colloidal metallic nanoparticles pre-prepared by other methods are mixed with a polymer solutionor monomer and then it was evaporated or polymerized [6, 7];(4) a metallic precursor is dissolved in a solvent and thesolution impregnates into a polymer matrix, and then metallicnanoparticles are generated by treating with reduction agentsor thermolysis [8, 9]; and (5) sublimed metallic precursor
molecules penetrate into a polymer matrix and are reduced toself-assembled metallic nanoparticles [10, 11]. The methods1~4 are wet process, while the last method 5 is a dry process.
Crystalline polypropylenes have strong mechanicalproperties and their numerous and versatile applications canbe easily achieved by wide range of PP homopolymers andcopolymers and by easy processability. Therefore they arewidely used as bumpers and dashboards in automobiles, OPPfilms, fibers for membranes, pipes, etc., and the crystallinity isone of the most important factors for the determination of theproperties [12, 13]. The explanation of the crystal structure inPP is started by stereo-isomerism. When PP monomers arepolymerized, all the neighboring methyl groups in the PPchain can have two stereo-isomeric positions. If all the methylgroups arrange on the same side of the zigzag plain, it isdefined as isotactic polypropylene (iPP), and if they arrangealternatively, it is called as syndiotactic PP (sPP), and each haspolymorphism of crystal structure resulting from variousthermal and solvent conditions [12, 14].
It was reported that the onset temperature of the thermaldegradation, Td of alkyl polymer chains was improved by theincorporation of very small amount of palladium (Pd)nanoparticles [10, 11]. Especially the Td values for crystallinepolymers were remarkably increased, that is, Td ofsyndiotactic polystyrene was improved about 50oC through theincorporation of 1.5 wt% of Pd nanoparticles. It was maybedue that the dry process, the above method 5 could incorporatemetallic nanoparticles into the polymer films without thedestruction of bulk shape and even without the change ofcrystallinity, because metallic nanoparticles were generatedand positioned on the amorphous regions in sPS. However thatof atatic polystyrene was improved only about 18oC by 1.68wt% Pd nanoparticles, while that of nylon 6 even decreasedabout 52.8oC by 15.6 wt% Pd nanoparticles.
In this study, Pd nanoparticles were incorporated into iPPvia the above method 5 and the thermal degradation kineticswas studied by Flynn & Wall equation [15, 16] as follows:
)()(log
457.0 1�
�
TddREd
�
�����������������������������������������!�������"� �� �#�����������������$���������������%��������
��� ���������� �� ��������

where, Ed was activation energy for the thermal degradation, Rwas the universal gas constant, 8.314 kJ/mol, � was heatingrate, and T-1 was the inversion of the absolute temperature at aselected degradation fraction, �. Ed values could be calculatedfrom the linear relationships between log� and T-1 at each
Figure 1. One-step dry process.
selected degradation fraction, �, which was obtained from thedynamic thermogravimetric analysis (TGA) curves at variousheating rates.
2. ExperimentalA. Materials
Palladium(II) bis(acetylacetonate), Pd(acac)2 waspurchased from Johnson Matthey Materials Technology,which was recrystallized in acetone prior to its usage. iPP wasobtained from Chisso Ltd. (Japan) whose molecular weight,Mn was 224,000 and polydispersity index, Mw/Mn was 2.5.The iPP pellets were processed into a film with the thicknessof 100 �m by press molding and the humidity was removed invacuum oven for 24 hr at 40oC.
B. Incorporation of Pd Nanoparticles into iPP Film2 mg of Pd(acac)2 was weighed in a glass vessel (30 ml)
and the iPP film was positioned uprightly in the vessel asshown in Fig.1. Then air in the vessel was exchanged bynitrogen three times to prevent the formation of palladium
Figure 2. TEM micrographs of cross sections of iPP/Pd nanocomposite filmsprepared by the exposure to Pd(acac)2 vapor for 30 min. (A) was the image ofunstained specimen, while (B) is the image of stained specimen with RuO4.The insets showed the aggregation consisted of over 10 nanoparticles.
oxide and the vessel was dipped into 180oC oil bath in vacuoin order to expose the Pd(acac)2 vapor to the iPP filmuniformly for 0, 30, 60 and 120 min, respectively. Finally, thepenetrated vapor was reduced to Pd nanoparticles during thesame step without any additional treatment.
C. TEM ObservationTransmission electron microscopy (TEM) was employed
with a LEO922 energy-filtering transmission electronmicroscope (Carl Zeiss Co. Ltd., Germany) at an acceleratingvoltage of 200 kV. Thin section was prepared by cryo-ultramicrotomy at -60oC after embedding in a light curableresin system (D-800, JEOL DATUM, Japan). The averagediameter of Pd nanoparticles and its number density displayedon TEM image were statistically estimated by the imageprocessing software (analySIS, Soft Imaging System Co. Ltd.).
D. TG AnalysisTo study the thermal degradation kinetics,
thermogravimetric analysis (TGA) was employed using athermal analysis system (TG/DTA 6200, EXTRA 6000 series,Seiko Instruments Inc., Japan). The analysis was carried out ata N2 flow rate of 200 ml/min to prevent the oxidation of thecomposites. 5 mg film chip was used as sample and dynamicrun was carried out from room temperature to 600oC atheating rates of 5, 10, 15 and 20 oC/min. The sensitivity of theTGA apparatus is 0.2 mg, and thus the minimum content to bemeasured was 0.004 wt% of a 5 mg sample.
3.Results and DiscussionFig.2(A) showed TEM micrograph of a cross section of
iPP film incorporated with Pd nanoparticles which wasprepared by the exposure to Pd(acac)2 vapor for 30 min andthe TEM image (B) was obtained from the same specimenexcept only staining with RuO4. In the image (A), very few ofPd nanoparticles were generated and some of them formedaggregations containing 2~4 nanoparticles, even over 10particles was shown in the inset of the image (A). The averagediameter of the individual nanoparticles was 7.5 nm with astandard deviation of 1.8 nm. The staining with RuO4 washelpful tool to observe the lamellar morphologies in acrystalline polymer because it was selectively stained on theamorphous regions which were formed by tie moleculesjointing the lamellae. As shown in Fig.2(B), Pd nanoparticlesexpressed as black dots selectively positioned on theamorphous regions expressed as black lines, and the inset ofthe image (B) showed the aggregated area with 9 nanoparticleswhere it was stained more darkly. It meant that the area withmany nanoparticles had large defect point in the crystalstructure so that many RuO4 compounds could stain that area.
�����������������������������������������!�������"� �� �#�����������������$���������������%��������
���������� �� �������� ���

-1.0
-0.8
-0.6
-0.4
-0.2
0.0TG
350 400 450 5000.0
0.1
0.2
0.3
0.4
Pd loading time(loading weight)
0min (0 wt%) 30min (0.27wt%) 60min (0.39wt%) 120min (0.57 wt%)
DTG
(m
in-1)
Temperature (oC)
Figure 3. TGA and DTG curves for iPP/Pd nanocomposites prepared atdifferent Pd(acac)2 exposure time.
350 400 450 500-1.0
-0.8
-0.6
-0.4
-0.2
0.0
dcb
Temperature (oC)
TG aHeating ratea : 5 oC/minb :10 oC/minc :15 oC/mind :20 oC/min
Figure 4. TGA curves for iPP/Pd (0.27 wt%) nanocomposite at differentheating rates.
Fig.3 showed the dynamic TGA and DTG curves foriPP/Pd nanocomposites with various amounts of the Pdnanoparticles. The heating rate was at 10 oC/min in nitrogen
TABLE I. Relationships between log� and T-1 for the iPP/Pd(0.27 wt%) Nanocomposite.
1.30 1.35 1.40 1.45
0.6
0.8
1.0
1.2
1.4
� =�0.05 0.10 0.15 0.20 0.25 0.30 0.35 0.40 0.45 0.50
log�
1/T x 1000 (K-1)
Figure 5. Isoconversional plots of log� vs.1/T for iPP/Pd (0.27 wt%)nanocomposite.
atmosphere. It was clearly shown that the incorporation of thePd nanoparticles shifted the TGA curves to higher temperature.It implied that the thermal stability was remarkably improvedby the incorporation of Pd nanoparticles. In the TG curve ofneat iPP, there was almost no weight loss before 372oC and itdecreased very slowly until 404oC, but it was very quicklydecreased after that temperature and almost all polymer chainswere degraded abruptly between 404~482oC. However, theTGA curve of the iPP/Pd nanocomposite prepared by theexposure to Pd(acac)2 vapor for 30 min was very differentfrom that of neat iPP. It showed no weight loss before 409oC,slow decrement until 439oC, and abrupt degradation between439~483oC, where the Pd incorporation weight of the samplewas 0.27 wt%. It was an amazing result that the thermalstability of the neat iPP was improved by 35oC via theincorporation of such very small amount of the Pdnanoparticles. In here, the incorporation weight of Pdnanoparticles was obtained from the prolysis at 1,000oCnitrogen atmosphere in an electric furnace for 3 hr. In theDTG curves, compared to that of iPP/Pd nanocomposite, thesteeper slope in the former part and the similar slope in thelatter part of the neat iPP maybe said that the Pd nanoparticlesmainly contributed to the improvement in the initialdegradation of neat iPP, and it was maybe due thatnanoparticles positioned on the defects of crystal structureheld the polymer chains tightly until higher temperature. Fig.3also showed that the increasing Pd content from 0.27 wt% to0.57 wt% could not bring the better results as was expected.
�log�
T-1x10³(K-1)0.05 0.10 0.15 0.20 0.25 0.30 0.35 0.40 0.45 0.50
0.701.001.181.30
1.4251.4061.3881.377
1.4131.3941.3751.366
1.4061.3881.3681.360
1.3981.3791.3401.352
1.3971.3781.3591.351
1.3941.3751.3561.348
1.3911.3721.3531.345
1.3881.3691.3511.342
1.3871.3661.3481.340
1.3841.3641.3461.337
�����������������������������������������!�������"� �� �#�����������������$���������������%��������
�� ���������� �� ��������

In order to estimate the thermal degradation rate, the TGAdata at various heating rates were introduced to Flynn & Wallequation. Fig.4 showed the TGA curves for the iPP/Pd (0.27wt%) nanocomposite at the heating rates of 5, 10, 15 and 20oC/min. The temperature values at � = 0.05 for each heatingrate were 428.30, 438.16, 447.26, and 452.95oC, respectively.To get Ed value at each �, these values were converted to T-1
and introduced to the Flynn & Wall equation together withlog� listed in TABLE I. Using the same procedure, thetemperatures at different � for each heating rate were obtained
0.0 0.2 0.4200
210
220
230
240
iPP/Pd (0.27wt%) Neat iPP
E d (kJ/
mol
)
�
Figure 6. Ed value tendency of neat iPP and iPP/Pd (0.27 wt%) nanocompositeaccording to increasing degradation fraction, �.
from Fig.4, and the T-1 values were also listed in TABLE I.Then a straight line for each � was plotted by the relationshipbetween log � and T-1 data for Flynn & Wall equation, asdisplayed in Fig.5. The linear correlation for � = 0.05 wasexpressed as log � = -12.25×10³ · T-1 + 18.19. So, the Ed valuewas calculated from the slope, -12.25×103 = -0.457·Ed/R, sothat the Ed value at � = 0.05 was 222.86 kJ/mol. The Ed valuesfor various � were also obtained through the same procedureand shown in Fig.6. The average Ed value for iPP/Pd (0.27wt%) nanocomposite was 227.85 kJ/mol, which was verysimilar value, 228 kJ/mol calculated from Kissinger equation[11]. The Ed value for neat iPP was also calculated by thesame procedure and we obtained the average value of 220.57kJ/mol, which was also displayed in Fig.6 and was 7.28kJ/mol lower. These results meant that the Pd nanoparticlescould act as a retardant in the thermal degradation of neat iPPpolymer chain.
4. ConclusioniPP/Pd nanocomposites were prepared by the incorporation
of Pd(acac)2 vapor into free-standing iPP film in one-step dryprocess and thermal degradation kinetics was investigated byTGA and Flynn & Wall equation. TEM observation showedthat very few Pd nanoparticles was generated selectively onthe amorphous regions in the crystalline iPP and 0.27 wt% Pd
nanoparticle was incorporated into iPP film through theexposure to Pd(acac)2 vapor for 30 min. However, such a verylow content of Pd nanoparticles have positive effect on thethermal degradation of the neat iPP, that is 0.27 wt% Pdnanoparticles improved the thermal degradation temperatureby 35oC. Ed value for iPP/Pd (0.27 wt%) nanocomposite was227.85 kJ/mol while that of neat iPP was 220.57 kJ/mol.However the increasing Pd content from 0.27 wt% to 0.57wt% could not bring any improvement in thermal degradation.
5. AcknowledgmentThis work was supported by the Program of Regional
Innovation Center which was conducted by the Ministry ofKnowledge Economy of the Korean Government. This workwas also supported by Woosuk University (2012).
[1] M. M. Demir, M. A. Gulgun, Y. Z. Menceloglu, B. Erman, S. S.Abramchuk, and E. E. Makhaeva, "Palladium nanoparticles byelectrospinning from poly(acrylonitrile-co-acrylic acid)-PdCl2 solutions.Relations between preparation conditions, particle size, and catalyticactivity," Macromolecules, vol. 37, pp. 1787-1792, 2004.
[2] D. S. dos Santos Jr., P. J. G. Goulet, N. P. W. Pieczonka, O. N. OliveiraJr., and R. F. Aroca, "Gold nanoparticle embedded, self-sustainedchitosan films as substrates for surface-enhanced Raman scattering,"Langmuir, vol. 20, pp. 10273-10277, 2004.
[3] S. Porel, S. Singh, S. S. Harcha, D. N. Rao, and T. P. Radhakrishnan,"Nanoparticle-embedded polymer: In situ synthesis, free-standing filmswith highly monodisperse silver nanoparticles and optical limiting,"Chem. Mater., vol. 17, pp. 9-12. 2005.
[4] C. Lu, C. Guan, Y. Liu, Y. Cheng, and B. Yang, "PbS/Polymernanocomposite optical materials with high refractive index," Chem.Mater., vol. 17. pp. 2448-2454, 2005.
[5] A. J. Haes, S. Zou, G. C. Schatz, and R. P. Van Duyne, "Nanoscaleoptical biosensor: short range distance dependence of the localizedsurface plasmon resonance of noble metal nanoparticles," J. Phys. Chem.B, vol. 108, pp. 6961-6968, 2004.
[6] Z. H. Mibhele, M. G. Salemane, C. G. C. E. van Sittert, J. M.Nedeljkovi¸, V. Djokovi¸, and A. S. Luyt, "Fabrication andcharacterization of silver-polyvinyl alcohol nanocomposites," Chem.Mater., vol. 15, pp. 5019-5025, 2003.
[7] K. J. Klabunde, J. Habdas, and T. G. Cardenas, "Colloidal metalparticles dispersed in monomeric and polymeric styrene and methylmethacrylate," Chem. Mater., vol. 1, pp. 481-483, 1989.
[8] S. G. Boyes, B. Akgun, W. J. Brittain, and M. D. Foster, "Synthesis,Characterization and properties of polyelectrolyte block copolymerbrushes prepared by atom transfer radical polymerization and their use inthe synthesis of metal nanoparticles," Macromolecules, vol. 36, pp.9539-9548, 2003.
[9] S. Yoda, A. Hasegawa, H. Suda, Y. Uchimaru, K. Haraya, and T. Tsuji,"Preparation of platinum and palladium/polyimide nanocomposite filmas a precursor of metal doped carbon molecular sieve membrane viasupercritical impregnation," Chem. Mater., vol. 16, pp. 2363-2368, 2004.
[10] J. Y. Lee, S. Horiuchi, and H. K Choi, "Effect of palladiumnanoparticles on the thermal degradation kinetics of � crystallinesyndiotactic polystyrene," J. Ind. Eng. Chem., vol. 12, pp. 862-867, 2006.
[11] J. Y. Lee, Y. G. Liao, R. Nagahata, and S. Horiuchi, "Effect of metalnanoparticles on thermal stabilization of polymer/metal nanocompositesprepared by a one-step dry process," Polymer, vol. 47, pp. 7970-7979,2006.
[12] J. Varga, "Polypropylene: structure andmorphology," ed. by J. Karger-Kocsis, Chapman & Hall, London, 1995.
[13] J. Junkasem, J. Menges, and P. Supaphol, "Mechanical properties ofinjection-molded isotactic polypropylene/roselle fiber composites," J.Appl. Polym. Sci., vol. 101, pp. 3291-3300, 2006.
�����������������������������������������!�������"� �� �#�����������������$���������������%��������
���������� �� �������� ���

[14] X. Sun, H. Li, J. Wang, and S. Yan, "Shear-induced interfacial structureof isotactic polypropylene (iPP) in iPP/fiber composites,"Macromolecules, vol. 39, pp. 8720-8726, 2006.
[15] J. H. Flynn, "Degradation kinetics applied to lifetime predictions ofpolymers," Polym. Eng. Sci., vol. 20, pp. 675-677, 1980.
[16] J. Y. Lee, H. K. Lee, M. J. Shim, and S. W. Kim, "Thermaldecomposition Characteristics of epoxy network chemically toughenedwith liquid rubber using dynamic TG analysis," J. Ind. Eng. Chem., vol.6, pp. 250-255, 2000.
�����������������������������������������!�������"� �� �#�����������������$���������������%��������
��( ���������� �� ��������

Evaluation of UV optical fibers behaviorunder neutron irradiation
Dan Sporea, Adelina Sporea Laser Metrology Laboratory,
National Institute for Laser, Plasma and Radiation Physics Magurele, Romania
Mirela Ancuta, Dumitru Barbos, Maria Mihalache, Mirea Mladin
Institute for Nuclear Research Pitesti, Romania
Abstract- Degradation of UV transmitting optical fibers under nuclear reactor neutron exposure is reported. Four type of optical fibers (solarization resistant, H2-loaded; UV transmission standard OH; UV enhanced transmission, high OH, H2-loaded; high OH, deep UV enhanced) were exposed to neutron fluences up to 4 x 10¹⁷ n/cm2. The optical transmission was measured off-line over the 200 nm – 900 nm spectral range and the build-up of color centers was monitored.
Keywords- irradiation effects; neutron; optical attenuation; UV optical fibers
1. IntroductionIn the last 30 years optical fibers were extensively studied
in order to assess their possible use in radiation environments for communications, sensing, remote control, light guides, robotics etc. [1-3]. Optical fibers and, by extension, optical fiber-based systems have a great potential for such applications considering their advantages such as: capabilities to work under strong electromagnetic fields; possibility to carry multiplexed signals (time, wavelength multiplexing); small size and low mass; ability to handle multi-parameter measurements in distributed configuration; possibility to monitor sites far away from the controller; their availability to be incorporated into the monitored structure; wide bandwidth for communication applications. In addition, these systems are free of hazards such as fire, explosion, and contamination. All these facts recommend them for space or terrestrial applications (spacecraft on board instrumentation, nuclear facilities, future fusion installations, medical treatment and diagnostics premises, medical equipment sterilization), embedded into various all-fiber or hybrid sensors or as light-guides for control and diagnostics. In these implementations optical fiber systems accept real-time interrogation capabilities, provide spatially resolved answers (the capability to build array detectors), make possible on-line/ real time investigations [4].
Different types of optical fibers (silica-based, plastic, sapphire) and glass types were investigated under various irradiation conditions: gamma-ray, X-ray, electron beam, neutron, proton, alpha particles [4-7]. Exposed to ionizing
radiation, silica optical fibers exhibit effects such as: radiation induced absorption (RIA), radiation induced luminescence (RIL), increase of the optical radiation scattering as it propagates over the fiber length, thermo-luminescence, change of the waveguide refractive index. Attempts were made to reformulate the problem and to use these effects as a measure of the dose rate/total dose of the radiation to which the optical fiber is exposed [4, 8]. A special situation appears in the case of multimode optical fibers projected for UV-visible transmission, when the degradation of the optical transmission is more evident [9-11].
The present paper reports for the first time, according to our knowledge, the evaluation of UV optical fibers degradation under neutron irradiation, exposed in a research nuclear reactor.
2. Experiment The optical fiber samples we investigated fall into four
different categories: solarization resistant, H2-loaded; UV transmission standard OH; UV enhanced transmission, high OH, H2-loaded; high OH, deep UV enhanced. They are all commercially available products, from two manufactures. In Table 1 the characteristics of the irradiated optical fiber samples are specified.
The optical transmission of optical fibers samples was measured in the Laser Metrology Laboratory, at the National Institute for Laser, Plasma and Radiation Physics (NILPRP), before the irradiation process.
Neutron irradiation was performed at TRIGA SSR research reactor, operated by the Institute for Nuclear Research. In this investigation channel J7 belonging to the beryllium reflector of the reactor was used. The TRIGA-SSR reactor is a nuclear reactor whose active area is supplied with LEU fuel in zirconium hydride matrix type.
This fuel feeds stainless steel bars, these bars being grouped in boxes of 5 x 5 pins. The total length of fuel pellets is 57.5 cm. In the active zone the axial flux distribution is not uniform, and can be represented by a cosine function. This distribution is maintained outside the active area, so it follows the neutron source distribution. For this reason, it is necessary to know this
Authors acknowledge the financial support through the grant PN 09 39 03 01/2012 - Program NUCLEU and grant 12084/2008 – Program “Parteneriate”, both awarded by the National Authority for Scientific Research.
Advances in Materials Physics and Chemistry Supplement: 2012 world Congress on Engineering and Technology
Copyright © 2012 SciRes. 115

flux distribution. The irradiation process run in two phases, for the neutron flux of 3x10¹³ n·cm-2s-1 calculated for the lower end of the optical fibers, and a neutron flux of 7x10¹³ n· cm-2s-1
calculated for the upper end of the optical fibers, and different exposure times were employed (from 60 s to 4 h) to obtain different fluences (1015 n/cm2, and respectively 1017 n/cm2).
TABLE I. CHARACTERISTICS OF THE INVESTIGATED OPTICAL FIBERS
Sample name Optical fiber type Core diameter
(�m)
Cladding diameter
(�m)
Buffer diameter
(�m)
Buffer
Maximum operating
temperature (C)
Sample length (cm)
NP 1
solarization resistant, H2-loaded, step-index, multimode
200 220 280 Aluminum 400 12
NP 2
UV transmission, step index, multimode, standard OH
200 220 320 Nylon coating 100 12
NP 3
UV enhanced transmission, extended spectral response, high OH, H2-loaded, step-index, multimode
400 440 480 Polyimide 300 12
NP 4
high OH, deep UV enhanced, step-index, multimode
600 660 710 Polyimide 300 12
The characterization of the neutron irradiation channel was done by neutron activation analysis applied to a set of activation foil detectors, followed by the deconvolution of the neutron spectrum deduced from the measured reaction rates. This characterization was performed by measuring the neutron flux density and the spatial distribution, relative to the information provided by the monitoring system. The axial profile of the J-7 channel as resulted from the above mentioned characterization is given in Fig. 1.
To characterize the J-7 neutron channel, was developed a set of flux monitors consisting of: An5%-Al-Al Dy5%, Lu5%-Al-Al Mn1%, In100%, Fe100% Al100% Ni100%, Mg100%. The set was completed with two additionally irradiated monitors coated by a 1mm thick cadmium layer: Au5%-Al-Al and Mn1%, in order to evaluate the contribution of intermediate neutrons at the respective monitors’ resonances. The irradiation time for each flux monitor was selected to obtain a sufficient activity level to enable the measurements precisely without extra handling precautions. Fig.2 illustrates the integral spectrum obtained for channel J-7 at the end the measurements.
After the radiation exposure, the irradiated optical fibers were transferred and stored in Post Irradiation Examination Laboratory for "cooling"/ disintegration of the radioactive products, to allow handling and safe transfer to NILPRP for further investigations. At this stage, the samples were subjected to gamma spectrometry measurements for all isotopes emitting gamma radiation with energy of 60 keV and 2.5 MeV, with gamma-ray line intensity greater than 4% range for the determination of activation products. Measurements were performed using a chain of high-resolution gamma spectrometry calibrated in efficiency for different distances and consisting of an HPGe detector and a multichannel analyzer with 8192 channels, coupled to the data acquisition system. Following gamma spectrometry measurements some gamma radioactive impurities were found: 124 Sb, Sc 46, Zn 65, I 152 and 137 Cs. The general set-up for the off-line optical absorbance measurements is similar to that we used previously [10, 11] but, for the purpose of this investigation, it has a better S/N ratio (1,000:1 full signal), 16 bits A/D conversion resolution, a dynamic range of 25,000:1, a greater quantum
efficiency in the UV range (65 % at 250 nm), spectral resolution 1.2 nm, a sensitivity of 0.065 counts/e-, and a minimum OD detection level of 0.4 [4].
Figure 1. The axial profile corresponding to the irradiation channel used
Figure 2. The integral spectrum of neutrons corresponding to the irradiation channel used
116 Copyright © 2012 SciRes.

For the optical set-up used (this value is determined by two factors: first, the core of the connecting optical fibers and the core of the samples are different, and second, the sample optical fibers have no fixed connectors, hence, a biasing level which limits the set-up lowest detectable OD). Such a detecting scheme makes possible a better tracking of the color centre development in the UV spectral range and enables a higher range of absorption levels to be detected (O.D. of 4.4). For the reported optical absorption curves, the signal was averaged over three detected acquisitions with a value of 2 for the box car parameter. Irradiation and off-line measurements were carried out at room temperature.
3. ResultsFigs. 3 to 6 represent the results of the spectral optical
absorption measurements for the tested optical fibers after they were irradiated with neutrons in a research reactor. For comparison the curves corresponding to the non-irradiated case and for two fluencies (1.8 x 10¹⁵ and 4.3 x 10¹⁷ n/cm2) are superposed. According to data from the literature [12, 13], we were interested to observe the change of the optical transmission at specific wavelengths, corresponding to expected color centers:
a) = 248 nm, ODC(II) twofold coordinated silicon (or according to some authors an oxygen deficiency center),
b) = 265 nm, non bridging-oxygen hole color center,
c) = 320 nm, bound chlorine center,
d) = 330 nm, molecular chlorine center,
or peroxy linkage,
e) = 630 nm, non bridging-oxygen hole color center,
Based on the available post irradiation information, two of the optical fibers (samples NP 1 and NP 2) exhibit a degradation of the optical transmission at = 630 nm, for the high neutron flux. At a low flux value this phenomenon is not present.
For sample NP 3 the influence of the chlorine related color center can explain the increase of the optical absorption in the 300 nm – 600 nm spectral range, may be combined with the effect due to the non bridging-oxygen hole color center.
The molecular chlorine center ( = 330 nm) is less present in sample NP 4, at higher neutron flux. At the lower neutron flux, samples NP 1 and NP 2 proved to be more sensitive to neutron irradiation for ODC(II) and non bridging-oxygen hole color center ( = 248 nm and = 265 nm).
Figure 3. The optical spectral absorption for sample NP 1.
Figure 4. The optical spectral absorption for sample NP 2.
Figure 5. The optical spectral absorption for sample NP 3.
The presence of the non bridging-oxygen hole color center is confirmed by the degradation of the optical transmission at the two characteristic wavelengths ( = 265 nm and = 630 nm).
Copyright © 2012 SciRes. 117

Less vulnerable at shorter wavelengths seems to be the optical fiber NP 3, as the optical absorption is lower in this case, at the highest neutron flux.
Figure 6. The optical spectral absorption for sample NP 4.
It is known that high neutron fluxes induce mechanical degradation of the irradiated glass. In order to check this assuption electron microscopy investigations were carried out on optical fiber samples before and after irardiation. Fig. 7 illustrates the deffects induced in the glass as this was subjected to neutrons.
Figure 7. Electron microscopy image of an irradiated optical fiber sample
4. ConclusionsThe study of the UV optical fibers exposed to high neutron
fluxes from a nuclear reactor is reported for the first time. The effect of this irradiation on the formation of color center in the
UV spectral range was studied along with the mechanical degradation of the optical fibers samples.
REFERENCES
[1] B. Brichard, and A. Fernandez Fernandez, “Radiation effects in silica glass optical fibers”, Short Course Notebook, New Challenges for Radiation Tolerance Assessment, 8th European Conference on Radiation and its Effects on Components and Systems, pp. 95-138, September 2005
[2] F. Berghmans, “Ionizing radiation effects on optical components”, NATO Advanced Study Institute, Optical Waveguide Sensing & Imaging in Medicine, Environment, Security & Defence, pp. 127-165, October 2006
[3] F. Berghmans, B. Brichard, A. Fernandez Fernandez, A. Gusarov, M. Van Uffelen. And S. Girard, “An Introduction to Radiation Effects on Optical Components and Fiber Optic Sensors”, Optical waveguide sensing and imaging, W.J. Bock, I.Gannot, and S. Tanev, Eds. Springer Series B: Physics and Biophysics, Dordrecht, The Netherland, 2008, pp. 127-166.
[4] D. Sporea, A. Sporea, S. O’Keeffe, D. McCarthy and E. Lewis, “Optical Fibers and Optical Fiber Sensors Used in Radiation Monitoring”, in Selected Topics on Optical Fiber Technology, M. Yasin, S. W. Harun and H. Arof, Eds., Intech, 978-953-51-0091-1, 2009, pp. 609-652.
[5] B. Brichard, A. Fernandez Fernandez, H. Ooms, F. Berghmans, M. Decréton, A. Tomashuk, S. Klyamkin, M. Zabezhailov, I. Nikolin, V. Bogatyrjov, E. Hodgson, T. Kakuta, T. Shikama, T. Nishitani, A. Costley, anada G. Vayakis, “Radiation-hardening techniques of dedicated optical fibres used in plasma diagnostic systems in ITER”, J. Nucl. Mater., Vol. 329–333, pp. 1456–1460, 2004.
[6] B. Brichard, P. Borgermans, A. Fernandez Fernandez, K. Lammens, and M. Decréton, “Radiation effect in silica optical fiber exposed to intense mixed neutron–gamma radiation field”, IEEE T. Nucl. Sci., Vol. 48, No. 6, pp. 2069-2073, December 2001.
[7] A. Alessi, S. Agnello, D.G. Sporea, C. Oproiu, B. Brichard, and F.M. Gelardi, “ Formation of optically active oxygen deficient centers in Ge-doped SiO2 by �- and �-ray irradiation”, J. Non-Cryst. Solids, Vol. 356, pp. 275–280, 2010.
[8] S. Girard, Y. Ouerdane, C. Marcandella, A. Boukenter, S. Quenard, and N. Authier, “Feasibility of radiation dosimetry with phosphorus-doped optical fibers in the ultraviolet and visible domain”, J. Non-Cryst. Solids, Vol. 357, pp. 1871–1874, 2011.
[9] S. Girard, and C. Marcandella, “Transient and Steady State Radiation Responses of Solarization-Resistant Optical Fibers”, IEEE T. Nucl. Sci.,Vol. 57, No. 4, pp.2049 – 2055, 2010.
[10] D. Sporea, and R. Sporea, “Setup for the in situ monitoring of the irradiation-induced effects in optical fibers in the ultraviolet-visible optical range”, Rev. Sci. Instrum., Vol. 76, No. 11, 2005.
[11] D. Sporea, S. Agnello, and F.M. Gelardi, “Irradiation Effects in Optical Fibers”, in Frontiers in Guided Wave Optics and Optoelectronics, B. Pal, Ed., Intech, ISBN 978-953-7619-82-4, 2010, pp. 49-66.
[12] V.B. Gavrilov, A.I. Golutvin, Yu.S. Gershtein, M.V. Danilov, A.A. Zamyatin, V.G. Izraelyan, V.G. Isaev, V.A. Kolosov, S.V. Koleshov, D.O. Litvintsev, S.K. Morshnev, F.D. Ratnikov, V.Yu. Rasinov, V.L. Stolin, A.L. Ul’yanov and Yu.K. Chamorovskii, “Absorption spectra of pure quartz fiber lightguides irradiated with �-quanta from a 60Co source”, Instrum. Exp. Tech., vol. 40, no4, pp. 457-466, 1997.
[13] G. Lu, G.F. Schötz, J. Vydra and D. Fabricant, “Optical fiber for UV-IR broadband spectroscopy”, in: Optical Astronomical Instrumentation, SPIE Vol. 3355, S. D'Odorico (Ed.), pp. 884-891, 1998.
118 Copyright © 2012 SciRes.

Adsorption Of Cu(II), Ni(II), Zn(II), Cd(II) And Pb(II) OntoKaolin/Zeolite Based- Geopolymers
Bassam El-EswedZarka University College, Al-Balqa Applied University,P.O. Box 313, Zarka, Jordan.Email:[email protected],
Rushdi Ibrahim YousefChemistry Department, Faculty of Science, PreparatoryYear Program, King Faisal University, P.O. Box. 380, Al-Ahsaa 31982. Saudi Arabia. Email: [email protected].
Mazen AlshaaerDeanship of Academic Research, University of Jordan,Amman 11942, Jordan.Email: [email protected]
Imad HamadnehDepartment of Chemistry, Faculty of Sciences, Universityof Jordan, Amman 11942, Jordan.Email: [email protected].
Fawwaz Khalili*
Department of Chemistry, Faculty of Sciences, University of Jordan, Amman 11942, Jordan.
Email: [email protected].
AbstractThis work deals with geopolymers based on local Jordanianresources, namely, kaolin and zeoltitic (phillipsite) tuff. Thegeopolymers were prepared from these two materials by areaction with an alkali solution at 80ºC. The research groupof the present work has demonstrated in previous work thataddition of zeolitic tuff to kaolin based-geopolymersincreases the adsorption capacity toward Cu(II) metal ioncompared to zeolite-free geopolymers, while retaining highmechanical strength. The aim of the present work is toextend our work and to study the effect of changinggeopolymers components (zeolitic tuff and kaolin) on theiradsorption properties toward Cu(II), Ni(II), Zn(II), Cd(II)and Pb(II) metal ions. Both isothermal and kinetic studiesrevealed that increasing the zeolitic tuff: kaolin ratioimproves the adsorption capacity of geopolymer towardmetal ions. The adsorption capacity of the geopolymers of150: 50 zeolites: kaolin content was found to be higher thanthat of the raw materials themselves. The rate of adsorptionof geopolymers was found to be lower than that of rawmaterials due to kinetic limitations imposed by theformation of geopolymerization network. The selectivity ofgeopolymers toward adsorption of metal ions was found tobe distinct from raw zeolite and kaolin where the adsorptiononto geopolymers was found to be more preferential forsmall size metal ions (Cu(II), Ni(II), Zn(II)) than for largesize metal ions (Pb(II), Cd(II)). The adsorption of Cu(II) andPb(II) onto geopolymers did not decrease with competitionwith other metal ions, which indicates cooperativeadsorption. The adsorption process of metal ions ontogeopolymers was found to be reversible that indicates that
metal ions are bound by physical cation exchange to theexchangeable sites of unreacted phillipsite and newamorphous geopolymer sites. Leaching of metal ions fromraw kaolin was much more effective than geopolymers andzeolite because of compact structure of geopolymers.
Keywords- Geopolymers; kaolin, zeolitic tuff,adsorption, heavy metal ions.
1. IntroductionSeveral methods have evolved over the years on
the removal of heavy metal ions present in industrialwastewaters and soils. These are chemical precipitations,conventional coagulation, reverse osmosis, ion exchange,and adsorption. Out of these methods, adsorption appears tobe the most widely used for the removal of heavy metals [1].Substances like kaolin and zeolites have assumed a wideapplication in this regard [2-4].
This work deals with geopolymers based on localJordanian resources, namely, kaolin and zeoltitic(phillipsite) tuff. The geopolymers were prepared previouslyfrom 1:1 mass ratio of these two materials by a reaction withan alkali solution at 80ºC. The research group of the presentwork has demonstrated in previous work that addition ofzeolitic tuff to kaolin based-geopolymers increases theadsorption capacity toward Cu(II) metal ions compared tozeolite-free geopolymers, while retaining high mechanicalstrength [5,6]. These geoplymers can be used as
�����������������������������������������!�������"� �� �#�����������������$���������������%��������
���������� �� �������� ��*

construction materials for water treatment, storage andtransportation. The process used in the present work is ofmuch lower cost than the most popular metakaolin basedgeopolymers which, involves calcination of kaolin at 600 ºCwhich requires large amounts of energy and completedissolution of metakolin which requires large amount ofbase [7].
The exact mechanism of the geopolymerization isnot known precisely. It was suggested that Na+ or K+ fromalkaline solution to exchange the hydrogen ions on thebroken edges of the clay. Because of this ion exchange,repulsion between the Na+ ions will dissolute some clayparticles [8]. The breakdown of the solid aluminosilicateinto smaller ‘monomers’ where Al is already tetrahedrallycoordinated is followed by polycondensation of thesemonomers into the geopolymer [9,10]. Because of thesereactions, solid, hard, and stable materials withhydroxysodalite, feldspatiod, or zeolite like structure areformed [11].
When aluminum is four coordinated to oxygenatoms, a negative charge is created and therefore thepresence of cations such as Na+ is essential to maintainelectric neutrality in the geopolymeric matrix(hydroxysodalite). Hydroxysodalite, which ranges fromamorphous to microcrystalline material, consists of SiO4 andAlO4 tetrahedral linked alternately by sharing all the oxygenatoms [11]. Positive ions (Na+, K+, Li+, Ca2+, Ba2+, NH4+,and H3O+) must be present in the framework cavities tobalance the negative charge of Al in the four-foldcoordination.
Little work was found in the literature on theadsorption behavior of geopolymers. Li et al. [12] studiedthe adsorption of methylene blue (MB) dye ontogeopolymeric adsorbent based on fly ash. The synthesizedgeopolymer was found to have much higher adsorptioncapacity towards MB (0.12 mmol MB/g adsorbent) than flyash itself (5.6 x 10⁻³ mmol MB/g adsorbent). Wang et al.[13] reported an amorphous aluminosilicate geopolymerresulting from solid-state conversion of fly ash. Thesynthesized geopolymer was found to have a higheradsorption capacity towards Cu2+ ion (1.4 mmol Cu/gadsorbent) than the fly ash it self (1.6x10⁻³ mmol Cu/gadsorbent). A Geopolymer of Jordanian kaolin and zeolitictuff prepared by the research group of the present article wasfound in previous works to have adsorption capacity of 8.06mmol MB/g adsorbent and 0.83 mmol Cu/ g adsorbent [6]and 0.36 mmol Pb/ g adsorbent (at pH 6) [14]. Cheng et al.[15] demonstrates that at pH 4, the adsorption capacity ofmeta-kaolin based geopolymer toward Pb(II), Cu(II), Cr(III)and Cd(II) was 0.71, 0.77, 0.38, 0.60 mmol/g adsorbent. Theaim of the present work is to extend previous studies and tostudy different kaolin: zeolitic tuff geopolymeric samples inorder determine the best ratio of the geopolymer that givesthe highest adsorption capacity toward Cu(II), Ni(II), Zn(II),
Cd(II) and Pb(II). The main concern is determining theoptimum zeolitic content in the geopolymer that willprovide a material with high efficiency for waterpurification.
2. Materials and MethodsII.1 Materials
Preparation and characterization of Jordaniankaolinite and zeolitic (phillipsite) tuff were discussed in ourprevious works [6, 14, 16].
II.2 Fabrication of geopolymeric samples
Seven geopolymeric samples with different zeoliticcontent were prepared from kaolinitic Jordanian soil (K),functional reactive filler (zeolitic tuff, Z), and alkali solutionas shown in Table 1.
The zeolitic tuff and kaolinitic soil were mixed indifferent ratios (Table 1), and then the sodium hydroxidesolution was added. After mixing, a semi-dry mixture wasformed. After molding, compacting, curing at 80ºC, thesamples were ground and sieved into aggregate size between250-500 �m. Then the product was washed with excessamount of distilled water (to remove unreacted alkali), driedat 100ºC and kept in a desiccator.
Table 1. Composition of synthesized geopolymers in gramsGeopolymer K Z NaOH Water
G1 200 0 14 44
G2 175 25 14 40
G3 150 50 14 36
G4 125 75 14 32
G5 100 100 14 28
G6 75 125 14 24
G7 50 150 14 20
II.3. Characterization of geopolymers
XRD pattern and SEM pictures were obtained forgeopoplymers G5 and G7 in order to determine the fate ofkaolinite and phillipsite in the geopolymers sample.
II.4. Kinetics of adsorption of metal ions ontogeopolymers and raw materials
A 0.5000 g sample of geopolymers (G1-G7) and rawmaterials (Z and K) were independently placed in a 500 mL-conical flask, to which 250 mL of 100 ppm of a standardsolution of a metal ion (Cu(II), Ni(II), Zn(II), Cd(II), Pb(II))prepared in 0.1 M NaCl was added . The solution wasadjusted to pH 4 and shaken in the shaker water bath at
�����������������������������������������!�������"� �� �#�����������������$���������������%��������
� � ���������� �� ��������

25°C and 320 rpm. A 1.0 mL sample of the solution waswithdrawn at different contact times (0 - 72 h) and diluted to5 mL with distilled water, then filtered by microfilter andcentrifuged. The concentrations of metal ions weremeasured using the atomic absorption spectrometer (Varian,AA-250 plus).
II.5. Adsorption isotherms of metal ions ontogeopolymers and raw materials
Adsorption of single metal ions: Standard solutions (10–100ppm) of metal (Cu(II), Ni(II), Zn(II), Cd(II, Pb(II)) in 0.1MNaCl at pH 4 were prepared (pH adjustment usingNaOH/HCl). Conical flasks were filled with 50 ml of theprepared standard solutions of metal ions and 0.05 g ofgeopolymer (G1- G7) or raw materials (K, Z). A 10.0 mLportions from each conical flask were withdrawn after 24 hof shaking in water bath at 25ºC and 320 rpm and filtered bymicrofilters (0.45�m Nylon). The concentrations of metalions were determined using the atomic absorptionspectrometer.
Adsorption of multiple metal ions: The same procedureabove was followed, but using standards prepared fromcombination of metal ions (Cu(II), Ni(II), Zn(II), Cd(II,Pb(II)). Analysis using atomic absorption was made for thefour elements in each sample.
II.6. Desorption of metal ions
A 0.5 g of geoplymers or raw materials was shaken with 250mL of 1000-ppm solution of metal ions at pH 4 and 0.1 MNaCl ionic strength for 24 h. The solution was then filteredand dried in an oven at 100 C. The solid was then leachedwith 250 mL of 0.1 M NaCl solution at different contacttimes ranging from 0.25-72 h, where 1.00 mL was pipettedat each time, and diluted to 5.00 ml and analyzed for metalions concentration using atomic absorption spectrometer.
3. Results and DiscussionIII.1 Characterization of geopolymers
The XRD patterns of geopolymers G5, G7, raw materialszeolite, and kaolin are presented in Figure 1.
The phillipsite peaks were more noticeable in the patterns ofG7, which is of higher zeolitic content. The kaolin peakswere observed in the case of G5 and G7, indicatingincomplete dissolution of kaolin. The new phase ofgeopolymer was not detected because this new phase isamorphous.
Figure 1. XRD patterns of geopolymers G5, G7, and raw materials K and Z.
The SEM graphs (Figure 2) of geopolymers G5 and G7indicates the presence of crystalline phillipsite immersed inamorphous geopolymeric material.
Figure 2. SEM of geopolymers G5 and G7, respectively.
4 8 12 16 20 24 28 32 36 40 44 48 52 56 60
2-�(degree)
Inte
nsity
(a.u
)
G5
G7
K
Z
�����������������������������������������!�������"� �� �#�����������������$���������������%��������
���������� �� �������� � �

III.2. Adsorption kinetics
The effect of contact time on the amount of metal ions(Pb(II), Cd(II), Cu(II), Ni(II), Zn(II)) adsorbed ontogeopolymers and raw materials was investigated. A sampleof this data is given in Figure 3 for Ni(II). Among severalkinetic models employed (first order, pseudo-second order,intraparticle diffusion, film diffusion)
Figure 3. Plots of Qt (mmol/g adsorbent) versus t (min) for kinetic study ofadsorption of Ni(II) onto geopolymers G1, G3, G5, G7 and raw materials Zand K
to fit Qt - t data, the pseudo-second order model wasselected depending on the correlation coefficient values ofthe models. Thus, pseudo-second order kinetics model (eq. 1)[17] was used to fit the kinetics data of adsorption of metalions onto geopolymers and raw materials. The linear form ofthe pseudo-second order kinetics model is:
t/Qt=1/(kQe2)+t/Qe …………………..1
Where Qe is the amount of metal ion adsorbed atequilibrium (mmol metal ion/g adsorbent); t is the time(min); Qt is the amount of metal ion adsorbed (mmol metalion/g adsorbent) at time t; k is the rate constant of pseudo-second order adsorption (g adsorbent/ mmol metal ion.min).By plotting t/Qt versus t (Figure 4, for Ni(II)), the value ofthe slope 1/Qe and the intercept 1/(kQe2) can be used fordetermination of Qe and k .
The results of Qe and k obtained for Cu(II), Ni(II), Zn(II),Cd(II) and Pb(II) are presented in Figure 5. It is clear fromFigure 5, that the amount of adsorption of metal ions ontogeopolymers (Qe) is higher than that of raw materials.
Figure 4. Plots of t/Q (min. mmol-1. g adsorbent) versus t (min) for kineticstudy of adsorption of Ni(II) onto geopolymers G1, G3, G5, G7 and rawmaterials Z and K.
0
0.1
0.2
0.3
0.4
0.5
0.6
0 2000 4000 6000 8000
G1
G3
G5
G7
Z
K
Time (min)
Qt
y�=�3.757x�+�747.6R?=�0.976
y�=�2.459x�+�995.1R?=�0.966
y�=�1.959x�+�504.3R?=�0.989
y�=�1.744x�+�714.6R?=�0.963
y�=�5.026x�+�298.4R?=�0.997
y�=�5.596x�+�464.2R?=�0.995
0
5000
10000
15000
20000
25000
30000
0 1000 2000 3000 4000 5000 6000 7000
G1 G3G5 G7Z K
0.000
0.100
0.200
0.300
0.400
0.500
0.600
0.700
G1 G2 G3 G4 G5 G6 G7 Z K
Pb
Cd
Cu
Ni
Zn
0.0000.0200.0400.0600.0800.1000.1200.1400.1600.1800.200
G1 G2 G3 G4 G5 G6 G7 Z K
Pb Cd
Cu Ni
Zn
Adsorbent
Qe(m
mol
met
al/g
adso
rben
t)
Adsorbent
k
B
A
Time (min)
t/Q
�����������������������������������������!�������"� �� �#�����������������$���������������%��������
� ���������� �� ��������

Figure 5. Variation of (A) equilibrium adsorption capacity Qe and (B) rateconstant k calculated from pseudo-second order kinetic model with changeof composition of geopolymer.
Thus, the geopolymerization process that resulted fromdissolution of aluminosilicate monomers followed bypolymerization of theses monomers creates new cationexchange sites. The amount of equilibrium adsorptioncapacity (Qe) of metal ions onto the geopolymers increaseswith increasing zeolitic content of the geopolymers. Thismay be due to the increasing phillipsite content, whichincreases adsorption efficiency. Nevertheless, the rateconstant of adsorption (k) of kaolinite is higher than that ofgeopolymer and zeolite, which indicates that the sheetstructure of kaolinite imposed less kinetic limitations thanzeolite and geopolymers. It seems that the three dimensionalstructure of geopolymer is similar to zeolite.
When comparing the amount metal ions adsorbed,the obtained trends of Qe are:For G1-G7: Ni, Cu, Zn > Cd, PbFor Z: Cu > Cd > Ni > Zn > PbFor K: Cu= Ni > Zn > Pb > CdThe difference in behavior of zeolite, kaolinite andgeopolymers indicates the unique structure of thegeopolymers. The structure of geopolymer may be socondense that it is more accessible for small size metal ionslike Cu, Ni, Zn than large one like Cd and Pb.
III.3 Adsorption isotherms
The adsorption isotherms of metal ions (Pb(II), Cd(II),Cu(II), Ni(II), Zn(II)) onto synthesized geopolymers andraw materials were investigated. The Langmuir equation(eq. 2) is the most popular equation for modeling adsorptionisotherms [18]:
Q=QmKC/(1+KC) …………………….2
Where, Q is the amount of metal ions adsorbed (mmolmetal/g adsorbent), Qm is the adsorption capacity (mmolmetal/g adsorbent), K is the affinity constant (L/mmolmetal), and C is the equilibrium concentration of metal ions(mmol metal/L). Langmuir equation can be linearized in theform (eq. 3) [18]:
C/Q=(1/Qm)C+1/(QmK) ..……………..3
The values of adsorption capacity (Qm) and affinityconstants K were determined from the slope and interceptsof the plots of C/Q versus C. The values of Qm are presentedin Figure 6 for the metal ions investigated. Geopolymer G7,which has the highest zeolitic content, has higher adsorptioncapacity toward metal ions than raw materials K and Z. Theadsorption capacity of small size metal ions like Cu and Znis higher than those of large size one like Cd and Pb. Theseresults are similar to those obtained from the kinetic study.
It is obvious from Figure 6 that increasing the zeolitic tuffcontent of geopolymers (moving from G1 to G7) leads to anincrease of adsorption capacity of geopolymers toward
III.4. Multiple adsorption
In the case the multiple metal ions adsorption (Figure 6),one should expect a decrease of adsorption capacity ofgeopolymers compared to single metal ions adsorption dueto competition between metal ions. This was observed in thecase of raw zeolite. On the other hand, in the case ofkaolinite, a reverse trend was observed, where adsorptioncapacity Qm increases with competition, which indicatecooperative adsorption. The adsorption capacity of Cd(II),Ni(II), Zn(II) onto geopolymers decreases with competitionin a similar manner to the adsorption of metal ions ontozeolite. However, the adsorption of Cu(II) onto geopolymersincreases with competition like adsorption of metal ionsonto kaolinite. The adsorption of Pb(II) onto geopolymerswas not affected significantly by competition. Thus, theadsorption sites of geopolymers are unique and differentfrom that of zeolite and kaolinite. The cooperativeadsorption is evident in the case of adsorption of Cu(II) ontogeopolymers and in the case of adsorption of metal ionsonto kaolinite.
III.5. Desorption study
The adsorption process of metal ions onto geopolymers wasfound to be reversible. After 24 h leaching with 0.1M NaClsolution, about 60% of the adsorbed metal ions weredesorbed from geopolymer loaded with metal ions solution.This indicates that metal ions are bound by physical cationexchange and could be exchanges with Na+. The results ofleaching geopolymer loaded with Cu(II) ions are shown inFigure 7. Leaching of metal ions from raw kaolin was muchmore effective than geopolymers and zeolite because ofcompact structure of geopolymers.
0.000
0.100
0.200
0.300
0.400
0.500
0.600
G1 G2 G3 G4 G5 G6 G7 Z K
Pb
Cd
Cu
Ni
Zn
Adsorbent
Qm
A
�����������������������������������������!�������"� �� �#�����������������$���������������%��������
���������� �� �������� � �

Figure 6. Langmuir adsorption capacity (Qm, mmol metal/g adsorbent) forgeopolymers and raw materials at pH 4, (A) single and (B) multiple metaladsorption .
Figure 7. The %leaching of Cu(II) from geopolymers and rawmaterials loaded with Cu(II) as a function of time. Leaching wascarried out using 0.1 M NaCl solution.
4. ConclusionBoth isothermal and kinetic studies revealed that increasingthe zeolitic tuff: kaolin ratio improves the adsorptioncapacity of geopolymer toward metal ions. The adsorptioncapacity of the geopolymers of 150:50 zeolites: kaolincontent was found to be higher than that of the raw materialsthemselves. The rate of adsorption of geopolymers wasfound to be lower than that of raw materials due to kinetic
limitations imposed by formation of geopolymerizationnetwork. The selectivity of geopolymers toward adsorptionof metal ions was found to be distinct from raw zeolite andkaolin where the adsorption onto geopolymers was found tobe more preferential for small size metal ions (Cu(II), Ni(II),Zn(II)) than for large size metal ions (Pb(II), Cd(II)). Theadsorption of Cu(II) and Pb(II) onto geopolymers did notdecrease with competition with other metal ions thatindicates cooperative adsorption. The adsorption process ofmetal ions onto geopolymers was found to be reversible,which indicates that metal ions are bound by physical cationexchange to the exchangeable sites of unreacted phillipsiteand new amorphous geopolymer sites. Leaching of metalions from raw kaolin was much more effective thangeopolymers and zeolite because of compact structure ofgeopolymers.
5. AcknowledgmentThe authors would like to express great thanks for theScientific Research Support Fund of the Ministry of HigherEducation and Scientific Research, Amman – Jordan,project (number S1/22/2009).
REFERENCES[1] K.G. Bhattacharyya and S.S. Gupta. Advances in Colloid and InterfaceScience 140 (2008), 114-131.
[2] P. Srivatava, B. Singh, M. Angove. J. Colloid. Interface Sci. 290 (2005)28-38.
[3] I. Heidmann, I. Christl, C. Leu, R. Kretzschmar. J. Colloid. InterfaceSci. 282 (2005) 270-282.
[4] Ahmed Alfara, E. frackowiak, F. Beguin. Applied Surface Science 228(2004) 84-92.
[5] M. Alshaaer, B. El-Eswed, I. Yousef, F. Khalili, H. Khoury, Low-costSolid Geopolymeric Material for Water Purification, Ceramic TransactionsVolume 207, page 265 -271, 2009.
[6] R. Yousef, B. El-Eswed, M. Alshaaer, F. Khalili and H. Khoury, Theinfluence of using Jordanian natural zeolite on the adsorption, physical, andmechanical properties of geopolymers products, Journal of HazardousMaterials, 165 (2009) 379-387.
[7] R. Cioffi, L. Maffucci, L. Santoro " Optimization of geopolymersynthesis by calcination and polycondensation of kaolinitic residue"Resources, Conservation and Recyclic 40 (2003) 27-38.
[8] G.M. Gemerts, R. Mishre and J. Wastiels, Stabilization of KaoliniticSoils from Suriname for Construction Purposes, Vrije Universiteit Brussel,Brussels, Belgium, 1989.
[9] H. Rahier, J. Wastiels, M. Biesemans, R. Willem, G. Van Assche, B.Van Mele, Reaction mechanism, kinetics and high temperaturetransformations of geopolymers, J. Mater. Sci. 42 (2007) 2982-2996
[10] P. Duxon, A. Ferandez-Jimenez, J.L. Provis, G.C. Luckey, A. Palomo,J.S.J. van Deventer, Geopolymer technology: the current state of the art,Mater. Sci. 42 (2007) 2917-2933.
0.000
0.100
0.200
0.300
0.400
0.500
0.600
G1 G2 G3 G4 G5 G6 G7 Z K
Pb
Cd
Cu
Ni
Zn
Adsorbent
Qm
B
0
20
40
60
80
100
0 10 20 30 40 50 60 70 80
G1 G2 G3G4 G5 G6G7 Z K
Time (hours)
%L
each
ing
�����������������������������������������!�������"� �� �#�����������������$���������������%��������
� ( ���������� �� ��������

[11] M. Alshaaer, Stabilization of kaolinitic soil from Jordan forconstruction purposes, M. Sc. thesis, Vrije Universiteit Brussel, Brussels,Belgium, 2000.
[12] L. Li, S. Wang, Z. Zhu, Geopolymeric adsorbents from fly ash for dyeremoval from aquous solution, J. Colloid Interface Sci. 300 (2006) 52-59.
[13] S. Wang, L. Li, Z.H. Zhu, Solid-state conversion of fly ash to effectiveadsorbents for Cu removal from wastewater, J. Hazrd. Mater. B 139 (2007)254-259.
[14] Bassam El- Eswed, Rushdi I. Yousef, Mazen Alshaaer, FawwazKhalili, Hani Khoury "Alkali solid-state conversion of kaolin and zeolite toeffective adsorbents for removal of lead from aqueous solution"Desalination and Water Treatment, 8 (2009) 124–130.
[15] T. W. Cheng, M. L. Lee, M.S. Ko, T.H. Ueng, S. F. Yeng. AppliedClay Science 56 (2012) 90-96.
[16] Rushdi I. Yousef, Bassam El-Eswed,, Mazen Alshaaer, FawwazKhalili, Hubert Rahier. Degree of reactivity of two kaolinitic minerals inalkali solution using zeolitic tuff or silica sand filler Ceramics International,In Press, Corrected Proof, 2012.
[17] Y. Ho "Pseudo-isotherms using a second order kinetic expressionconstant" Adsorption 10, 151-158, 2004.
[18] Shaw, D. J. "Introduction to Colloid and Surface Chemistry". (chapter5). Butterworth –Heinemann, Oxford (1992)
�����������������������������������������!�������"� �� �#�����������������$���������������%��������
���������� �� �������� � )

Fabrication of Sn coatings on alumina balls by mechanical coating technique and
relevant process analysis
Liang Hao, Yun Lu, Hiromasa Sato, Kazuki Chiba Graduate School & Faculty of Engineering
Chiba University Chiba, Japan
[email protected] (Liang Hao), [email protected] (Yun Lu)
Abstract—Sn coatings were fabricated by mechanical coating technique for the first time. The coatings were characterized by XRD and SEM, among others. The SEM showed that the coatings had an irregular and uneven morphology. The influence of the rotation speed of planetary ball mill on the evolution and formation of the coatings was also investigated. The results indicated that continuous Sn coatings can be formed under a moderate rotation speed. In other words, the coatings cannot be formed when rotation speed was too high or too low. The evolution of the coatings was examined and discussed. The results showed that it followed the universal evolution law of metal coatings which included four stages. However, the exfoliation of the coatings was not seen even the milling time reached 30 h.
Keywords-Sn coatings; mechanical coating technique; adhesion; cold welding; film evolution.
1. IntroductionTo develop nickel-based superalloy for gas turbine
application, Benjamin and his colleagues at the International Nickel Company (INCO) developed mechanical alloying, well known as ball milling around 1966. Since then, ball milling has been developed to prepare a variety of equilibrium and non-equilibrium alloy phases that cannot or were difficult to be prepared by traditional techniques [1]. The non-equilibrium phases synthesized include supersaturated solid solutions, metastable crystalline and quasicrystalline phases, nanostructures and amorphous alloys, among others. Our group developed a novel coating technique derived from ball milling to prepare metal (alloy) coatings and TiO2/metal composite photocatalyst coatings and named it mechanical coating technique (MCT) [2, 3]. MCT is based on the principle of collision, friction and abrasion among grinding mediums and milled powders during ball milling. By this technique, Ti-Al coatings [4], Fe-Si coatings [5], Cu-Ni solid solution coatings [6], were prepared by other researchers. We also fabricated Cu coatings [7], Fe coatings [8] and Zn coatings [9] on alumina balls by MCT and investigated the evolution of these coatings. However, a universal law for evolution of metal coatings during the process of mechanical coating is still unknown. The
influence of a series of processing parameters including rotation speed on the evolution and formation of metal coatings still needs to clarify. The influence of the intrinsic properties of metal powder on the evolution and formation of the coatings are also important not only for mechanical coating technique but also for mechanical alloying and mechanical pulverization.
The aim of this paper is to try preparing continuous Sn coatings by mechanical coating technique. In addition, we will try to summarize the universal law for the evolution of metal coatings during mechanical coating process. The influence of rotation speed on the evolution and formation of the coatings will be studied.
2. Experimental A. Fabrication of Sn coatings
35 g Sn powder (apparent density: 3.72 g/cm3) and 30 g Al2O3 balls (average diameter: 1 mm) were used as the coating material and the substrates respectively. They were charged into a bowl made of alumina with a dimension of 75 mm × 70 mm (250 ml). The mechanical coating was then performed by a planetary ball mill (Pulverisette 6, Fritsch). To investigate the influence of the rotation speed, the rotation speed of the planetary ball mill was set between 100 and 300 rpm. The milling time was from 4 to 40 h. To ensure the safety of mechanical milling process, a 10-minute milling operation was followed by a 2-minute cooling interval in order to avoid an excessive heating of the bowl although a temperature rise may promote the welding between metal powder particles. The schematic diagram of mechanical coating can be seen in our early work [8].
B. Characterization Before the characterization of all the Sn-coated Al2O3 balls,
they were treated by ultrasonic cleaning (frequency: 28 kHz) in acetone to remove the Sn particles that did not strongly adhere to Al2O3 balls. The phase composition and the change of the surface coverage of Al2O3 balls with Sn was examined by a XRD analyzer (JDX-3530, JEOL) with Cu K� radiation at 30 kV and 20 mA. The surface morphologies and the microstructures of the cross sections of the Sn-coated Al2O3 balls were observed by SEM (JSM-6510, JEOL).
Advances in Materials Physics and Chemistry Supplement: 2012 world Congress on Engineering and Technology
126 Copyright © 2012 SciRes.

3. Results and discussion C. Fabrication and evolution of Sn coatings
The XRD patterns of the Sn-coated Al2O3 balls after the mechanical coating at 150 rpm for different milling times are given in Fig. 1. From these figures, the diffraction peaks of alumina can be seen although they were rather weak when milling time was 4 h. With the increase of milling time to 8 h, the peaks of alumina cannot be seen any more while those of tin were rather strong. It means that the surfaces of Al2O3 balls were totally coated with Sn particles. In other words, continuous Sn coatings might be formed at that time. With further increase of milling time to 20 h, the peaks of alumina still did not appear. It suggests that continuous Sn coatings were not destroyed and hence the surfaces of Al2O3 balls were not exposed.
30 40 50 60 70
Al2O3Sn
Rela
tive
inte
nsity
(a. u
.)
2 Theta (deg)
4 h
8 h
12 h
16 h
20 h
Figure 1. XRD patterns of the Sn-coated Al2O3 balls after the mechanical coating at 150 rpm for different milling times.
The SEM images of the cross sections of the Sn-coated Al2O3 balls after the mechanical coating at 150 rpm for different milling times are shown in Fig. 2. It can be seen that discontinuous Sn coatings were formed when milling time was 4 h. When it came to 8 h, totally continuous Sn coatings were formed. With further increase of milling time, the thickness of the coatings was increased. The SEM images of the surface morphologies of the Sn-coated Al2O3 balls after the mechanical coating at 150 rpm for different milling times are given in Fig. 3. As discussed in Fig. 1 and Fig. 2, discontinuous Sn coatings were formed when milling time was 4 h. Continuous coatings were formed when it came to 8 h. It can be found that the surfaces of the coatings were rather uneven and many bulges of Sn particles were also formed. With further increase of milling time, the coatings became relatively even and the bulges of Sn particles seemed not obvious. The morphology change of the coating should relate to the collision and friction among the
Al2O3 balls coated with Sn and the inner wall of the bowl. Under repeated and great collision force and friction force, Sn bulges were flattened or worn down.
Figure 2. SEM images of the cross sections of the Sn-coated Al2O3 balls after the mechanical coating at 150 rpm for different milling times: (a) 4 h, (b) 8 h, (c) 12 h, (d) 16 h, (e) 20 h and (f) 30 h.
Figure 3. Surface morphologies of the Sn-coated Al2O3 balls after the mechanical coating at 150 rpm for different milling times: (a) 4 h, (b) 8 h, (c) 12 h, (d) 16 h, (e) 20 h and (f) 30 h.
Copyright © 2012 SciRes. 127
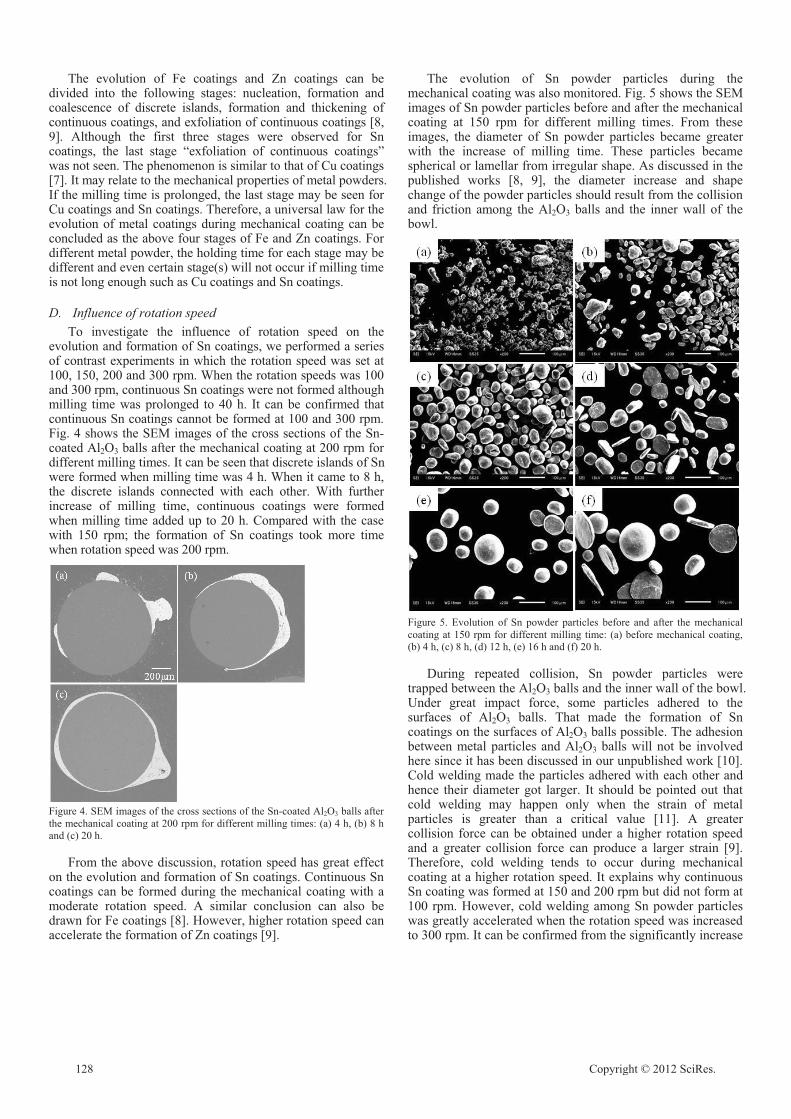
The evolution of Fe coatings and Zn coatings can be divided into the following stages: nucleation, formation and coalescence of discrete islands, formation and thickening of continuous coatings, and exfoliation of continuous coatings [8, 9]. Although the first three stages were observed for Sn coatings, the last stage “exfoliation of continuous coatings” was not seen. The phenomenon is similar to that of Cu coatings [7]. It may relate to the mechanical properties of metal powders. If the milling time is prolonged, the last stage may be seen for Cu coatings and Sn coatings. Therefore, a universal law for the evolution of metal coatings during mechanical coating can be concluded as the above four stages of Fe and Zn coatings. For different metal powder, the holding time for each stage may be different and even certain stage(s) will not occur if milling time is not long enough such as Cu coatings and Sn coatings.
D. Influence of rotation speed To investigate the influence of rotation speed on the
evolution and formation of Sn coatings, we performed a series of contrast experiments in which the rotation speed was set at 100, 150, 200 and 300 rpm. When the rotation speeds was 100 and 300 rpm, continuous Sn coatings were not formed although milling time was prolonged to 40 h. It can be confirmed that continuous Sn coatings cannot be formed at 100 and 300 rpm. Fig. 4 shows the SEM images of the cross sections of the Sn-coated Al2O3 balls after the mechanical coating at 200 rpm for different milling times. It can be seen that discrete islands of Sn were formed when milling time was 4 h. When it came to 8 h, the discrete islands connected with each other. With further increase of milling time, continuous coatings were formed when milling time added up to 20 h. Compared with the case with 150 rpm; the formation of Sn coatings took more time when rotation speed was 200 rpm.
Figure 4. SEM images of the cross sections of the Sn-coated Al2O3 balls after the mechanical coating at 200 rpm for different milling times: (a) 4 h, (b) 8 h and (c) 20 h.
From the above discussion, rotation speed has great effect on the evolution and formation of Sn coatings. Continuous Sn coatings can be formed during the mechanical coating with a moderate rotation speed. A similar conclusion can also be drawn for Fe coatings [8]. However, higher rotation speed can accelerate the formation of Zn coatings [9].
The evolution of Sn powder particles during the mechanical coating was also monitored. Fig. 5 shows the SEM images of Sn powder particles before and after the mechanical coating at 150 rpm for different milling times. From these images, the diameter of Sn powder particles became greater with the increase of milling time. These particles became spherical or lamellar from irregular shape. As discussed in the published works [8, 9], the diameter increase and shape change of the powder particles should result from the collision and friction among the Al2O3 balls and the inner wall of the bowl.
Figure 5. Evolution of Sn powder particles before and after the mechanical coating at 150 rpm for different milling time: (a) before mechanical coating, (b) 4 h, (c) 8 h, (d) 12 h, (e) 16 h and (f) 20 h.
During repeated collision, Sn powder particles were trapped between the Al2O3 balls and the inner wall of the bowl. Under great impact force, some particles adhered to the surfaces of Al2O3 balls. That made the formation of Sn coatings on the surfaces of Al2O3 balls possible. The adhesion between metal particles and Al2O3 balls will not be involved here since it has been discussed in our unpublished work [10]. Cold welding made the particles adhered with each other and hence their diameter got larger. It should be pointed out that cold welding may happen only when the strain of metal particles is greater than a critical value [11]. A greater collision force can be obtained under a higher rotation speed and a greater collision force can produce a larger strain [9]. Therefore, cold welding tends to occur during mechanical coating at a higher rotation speed. It explains why continuous Sn coating was formed at 150 and 200 rpm but did not form at 100 rpm. However, cold welding among Sn powder particles was greatly accelerated when the rotation speed was increased to 300 rpm. It can be confirmed from the significantly increase
128 Copyright © 2012 SciRes.
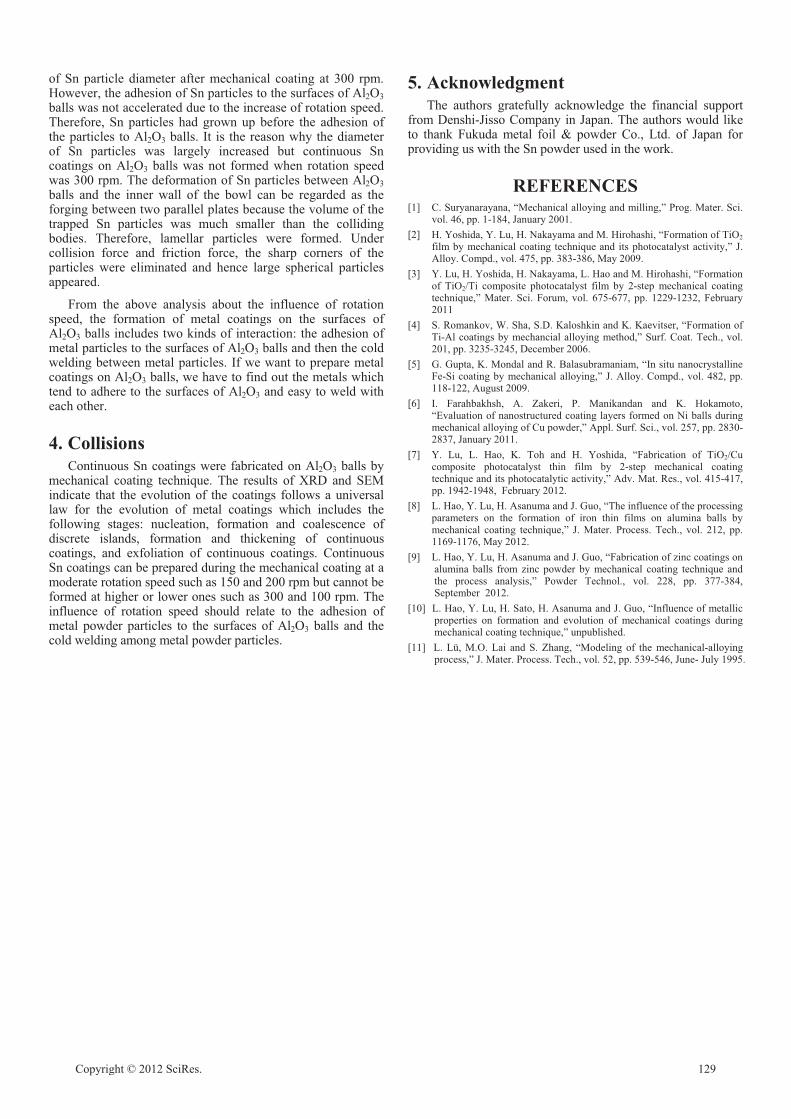
of Sn particle diameter after mechanical coating at 300 rpm. However, the adhesion of Sn particles to the surfaces of Al2O3 balls was not accelerated due to the increase of rotation speed. Therefore, Sn particles had grown up before the adhesion of the particles to Al2O3 balls. It is the reason why the diameter of Sn particles was largely increased but continuous Sn coatings on Al2O3 balls was not formed when rotation speed was 300 rpm. The deformation of Sn particles between Al2O3 balls and the inner wall of the bowl can be regarded as the forging between two parallel plates because the volume of the trapped Sn particles was much smaller than the colliding bodies. Therefore, lamellar particles were formed. Under collision force and friction force, the sharp corners of the particles were eliminated and hence large spherical partiapp
re to the surfaces of Al2O3 and easy to weld with each other.
l2O3 balls and the cold welding among metal powder particles.
cles [3] Y. Lu, H. Yoshida, H. Nakayama, L. Hao and M. Hirohashi, “Formation of TiO2/Ti composite photocatalyst film by 2-step mechanical coating technique,” Mater. Sci. Forum, vol. 675-677, pp. 1229-1232, February 2011
eared.
From the above analysis about the influence of rotation speed, the formation of metal coatings on the surfaces of Al2O3 balls includes two kinds of interaction: the adhesion of metal particles to the surfaces of Al2O3 balls and then the cold welding between metal particles. If we want to prepare metal coatings on Al2O3 balls, we have to find out the metals which tend to adhe
4. CollisionsContinuous Sn coatings were fabricated on Al2O3 balls by
mechanical coating technique. The results of XRD and SEM indicate that the evolution of the coatings follows a universal law for the evolution of metal coatings which includes the following stages: nucleation, formation and coalescence of discrete islands, formation and thickening of continuous coatings, and exfoliation of continuous coatings. Continuous Sn coatings can be prepared during the mechanical coating at a moderate rotation speed such as 150 and 200 rpm but cannot be formed at higher or lower ones such as 300 and 100 rpm. The influence of rotation speed should relate to the adhesion of metal powder particles to the surfaces of A
5. Acknowledgment The authors gratefully acknowledge the financial support
from Denshi-Jisso Company in Japan. The authors would like to thank Fukuda metal foil & powder Co., Ltd. of Japan for providing us with the Sn powder used in the work.
REFERENCES[1] C. Suryanarayana, “Mechanical alloying and milling,” Prog. Mater. Sci.
vol. 46, pp. 1-184, January 2001. [2] H. Yoshida, Y. Lu, H. Nakayama and M. Hirohashi, “Formation of TiO2
film by mechanical coating technique and its photocatalyst activity,” J. Alloy. Compd., vol. 475, pp. 383-386, May 2009.
[4] S. Romankov, W. Sha, S.D. Kaloshkin and K. Kaevitser, “Formation of Ti-Al coatings by mechancial alloying method,” Surf. Coat. Tech., vol. 201, pp. 3235-3245, December 2006.
[5] G. Gupta, K. Mondal and R. Balasubramaniam, “In situ nanocrystalline Fe-Si coating by mechanical alloying,” J. Alloy. Compd., vol. 482, pp. 118-122, August 2009.
[6] I. Farahbakhsh, A. Zakeri, P. Manikandan and K. Hokamoto, “Evaluation of nanostructured coating layers formed on Ni balls during mechanical alloying of Cu powder,” Appl. Surf. Sci., vol. 257, pp. 2830-2837, January 2011.
[7] Y. Lu, L. Hao, K. Toh and H. Yoshida, “Fabrication of TiO2/Cu composite photocatalyst thin film by 2-step mechanical coating technique and its photocatalytic activity,” Adv. Mat. Res., vol. 415-417, pp. 1942-1948, February 2012.
[8] L. Hao, Y. Lu, H. Asanuma and J. Guo, “The influence of the processing parameters on the formation of iron thin films on alumina balls by mechanical coating technique,” J. Mater. Process. Tech., vol. 212, pp. 1169-1176, May 2012.
[9] L. Hao, Y. Lu, H. Asanuma and J. Guo, “Fabrication of zinc coatings on alumina balls from zinc powder by mechanical coating technique and the process analysis,” Powder Technol., vol. 228, pp. 377-384, September 2012.
[10] L. Hao, Y. Lu, H. Sato, H. Asanuma and J. Guo, “Influence of metallic properties on formation and evolution of mechanical coatings during mechanical coating technique,” unpublished.
[11] L. Lü, M.O. Lai and S. Zhang, “Modeling of the mechanical-alloying process,” J. Mater. Process. Tech., vol. 52, pp. 539-546, June- July 1995.
Copyright © 2012 SciRes. 129
AlSi11/ Si3N4 interpenetrating composites Tribology properties of aluminum matris composites
Hongyan WANG, Shouren WANG*, Gaozhi LIU School of Mechanical Engineering
University of Jinan Jinan, China
Yingzi WANG School of Materials Science
University of Jinan Jinan, China
Abstract— In present work, the metal-ceramic interpenetrating composites (IPCs) as AlSi11/ Si3N4 are fabricated by infiltrating technique. IPCs exhibit special characterization of brittle ceramic reinforced phase introduced by ductile metal matrix phase. During the sliding wear processes, IPCs exhibit four wear mechanism such as initial adhesive wear, mixed adhesive and abrasive wear, adhesive wear and final abrasive wear. Reinforcements inhibit plastic flow and restrict propagation of wear cracks. Increase in the volume fraction of reinforcement leads to improvement in the wear resistance. Under higher load and lower round speed conditions, the friction coefficients are lower than that of relative conditions.
Keywords-interpenetrating composites; Si3N4; aluminum; network structure;tribology
1. Introduction It is well known that metal–ceramic interpenetrating
composites (IPCs) exhibit superior performance, mechanical stability and failure tolerance such as excellent wear resistance, high fracture toughness and high hardness [1-3]. IPCs have attracted considerable attention as result of their unique mechanical properties, which can be widely used in aerospace and automotive industries and other structural applications [4]. Especially, aluminum matrix composites reinforced by Si3N4 have the potential for use in aerospace applications owing to Si3N4 ceramics processing higher Young’s modulus, combined with lower density, higher melting point and excellent oxidation resistance. Moreover, metal-ceramic interpenetrating composites have a large use in the occlusal contact area accompanying with high forces, such as mechanical production of oil pump, piston, die and bearing [5].
Tribology properties of IPCs can generally be enhanced by introducing a secondary phase (s) as three dimensional network structure into the metal matrix materials. There is a plethora of papers by experimentalists who have studied the wear behavior of metal composites reinforced by ceramics secondary phases [6]. However, there has little work to study the abrasive behavior of Si3N4/AlSi11 interpenetrating composites. The abrasive wear resistance of Si3N4/AlSi11 interpenetrating composites has been found to be significantly lower than that of AlSi11 metal owing to the changes of microstructure, the morphology, the volume fraction and mechanical properties of
three-dimensional network reinforcing phase, and interface between matrix and reinforcement.
So, in present paper, an attempt has been made to evaluate the dry sliding wear behavior of Si3N4/AlSi11 interpenetrating composites over a range of loads and sliding speeds. The microstructures of them are discussed. And, the sliding wear mechanisms of them are studied.
2. Experimental Procedure A reticulated polyurethane (PU) was chosen as a template
to prepare the porous perform (skeleton as the reinforcement of IPCs) by the replica technology. The pore size of the PU was about to 5-10 ppi (pores per inch). Si3N4 powder (Si3N4 97%, diameter 100 �m) was used as starting material. The sintering temperature is 1400°C at 200°C/h.
The composition of the alloys used in this study was Al-11wt.%Si which chemical composition is shown in Table 1. In order to eliminate the influence of impurities, the melt need to be refined. Alloy was melted in a clay–graphite crucible under Ar atmosphere. The liquid metal was infiltrated into the preform skeleton by pressure infiltration technology. Si3N4/AlSi11 interpenetrating metal-ceramic composites reinforced by different volume fraction as 12, 20%, respectively, were fabricated. The micro-structural characterization of IPCs and porous perform were performed on a scanning electron microscope (SEM. Hitachi, S-2500) which was shown in Figure 1. Samples for making micrographs were mounted in a holder and polished using SiC papers (up to 2000 grit). The microstructures of matrix were characterized using SEM equipped with an energy dispersive spectroscopy (EDS) which was shown in Figure 2.
The specimens were subjected to wear test under dry sliding condition. The tests were conducted on 6mm diameter, 35 mm long cylindrical specimens against a rotating steel disc which is covered by corundum sand paper. A pin-on-disc wear test machine was used for carrying out wear tests (Figure 3). The tangential friction force and wear depth were monitored with the help of electronic sensors. These two parameters were measured as a function of load and sliding distance. For each type of material, tests were conducted at four different nominal loads (100, 150, 200 and 250 N) at different sliding speed as
Advances in Materials Physics and Chemistry Supplement: 2012 world Congress on Engineering and Technology
130 Copyright © 2012 SciRes.

100, 200, 300 and 400 rpm. Wear tests were carried out at temperature of 200°C without lubrication for 20 min.
Table 1 Chemical composites of metal matrix Cu Mg Si Fe Mn
Zn Ti Al 4.7600 0.5900 17.0600 0.1890 0.0160 0.0060 0.0016 Bal.
Figure 1. 3-D network structure and interpenetrating composites:
(a)skeleton and (b) IPCs
(b)
Figure 2. Al matrix alloy and its EDS analysis: (a) SEM micrograph of Al matrix alloy and (b) EDS analysis
Figure 3. Pin-on-disc wear test machine
3. Results and Discussion Due to IPCs possessing a continuous metal network
with VAlSi11|VSi3N4, it has a high toughness. Due to IPCs possessing interpenetrating ceramic phase, it has a higher Young’s modulus, hardness and load bearing capacity than MMCs. Wear resistance properties research for IPCs is interesting. There are many factors in½uencing on wear behavior, which make it difficult to compare results from different laboratories or different testing methods [7]. The friction coefficients were tested with different time under different load which were shown in Figure 4 (a). It is shown that under lower load, the friction coefficient curve is not steady, while under higher load, it is steady. Under higher load conditions, the friction coefficients are lower than lower load conditions. Figure 4 (b) shows the friction coefficients- time relations under different round speed. It is shown that under lower round speeds, the friction coefficients are higher than higher round speeds. The reason is that higher load and round speeds causes soft matrix metal covering with the wear surface. This effect would require more testing to con!rm and explain it. It is well known that the wear resistance of the IPCs increases with increasing Si3N4 content. The width and depth of the wear grooves of the Si3N4 12wt.% composites are narrower and shallower than those of Si3N4 20wt.% composites. The grooves become even more indistinct with the increasing Si3N4 content.
400�m
400�m
(a)
(b)
matrix
reinforcement
(a)
Copyright © 2012 SciRes. 131

0 200 400 600 800 10000.300.320.340.360.380.400.420.440.460.480.500.520.540.560.580.60
fric
tion
coef
ficie
nt
time/s
100N 150N 200N 250N
(a) Friction coefficient-time curve under different load
100 200 300 400 500
0.15
0.20
0.25
0.30
0.35
0.40
0.45
0.50
fric
tion
coef
ficie
nt
time/s
100rpm 200rpm 300rpm400rpm
(b) Friction coefficient-time curve under different speed
Figure 4. Friction coefficient-time curve under different wear conditions
Figure 5 shows the worn surface of IPCs and its metal matrix. It is shown that with an increase in test time, the morphology of the worn surface changes from fine scratches to distinct grooves. The worn surfaces of the metal matrix and the ceramic skeleton are different significantly. There is light and shallow scratch on the surface of ceramic reinforcement which is shown in Figure 5 (a). The surface exhibits a fractured and broken characterization. It is shown that ceramic skeleton is undergone abrasive wear. There are smooth and rough areas to be seen. The smooth areas are due to the polishing effect at the start of the wear test. The damaged layer formed during this polishing stage is fatigued with further sliding distance. The revealing angular ceramic grains cause microcracks forming and result in the damaged spall. There is a severe surface damage on the surface of metal matrix which is shown in Figure 5 (b). Some deep and symmetrical furrows on the worn surface of metal matrix are observed which are described as local damage and even fractured flakes. The metal matrix showed adhesive wear with extensive plastic deformation, evidenced by smearing at the edge of the wear track.
Figure 5. The worn surface of : (a) ceramic reinforcement and (b) metal
matrix
This cyclic wear process is illustrated schematically in Figure 6. The overall wear processes divided into four stage as initial stage (I), continual stage (II), middle stage (III) and final stage (IV). Each individual stage is not steady state process. In initial abrasive wear process (Figure 6a), the wear surface is surrounded by matrix material that is subjected to compressive loading. Owing to relatively soft and ductile performance of the matrix, this stage is relatively short and considered as the conventional wear mechanism. On the other words, metal matrix alloy was cut by the counter as plates, which was either removed out of the cells or smeared along the sliding direction. With the continuing abrasive wear, the reinforcement phase is gradually exposed and the compressive load is carried by matrix and reinforcement together (Figure 6b). Owing to the high modulus of ceramic reinforcement relative to the matrix, however, this stage is hold for long time. With the wear processes going on, the soft and ductile matrix gradually recedes away and the compressive load is carried primarily by reinforcement phase (Figure 6c). In the finial stage, the exposed reinforcement phase finally failed by fracture due to its brittleness (Figure 6d). Then the wear surface turn flat and the first stage repeat again. This cyclic processes result in the removal of materials and occurrence of abrasive wear. The four stage wear behavior has also been observed by other researchers [8-10]. The AlSi11/Si3N4 interpenetrating composites showed a similar transition processing as initial adhesive wear (I), mixed adhesive and abrasive wear (II), adhesive wear (III) and final abrasive wear (IV).
80�m
100�m
(a)
(b)
132 Copyright © 2012 SciRes.

4. Conclusions A AlSi11/Si3N4 interpenetrating composites (IPCs) were
fabricated by infiltrating technique. The friction coefficient related to wear load, wear speed and wear time were discussed. The worn surface damage of IPCs is studied based on the lower and upper extreme cyclic wear behavior. Owing to the special topology structure characteristic, aluminum alloy reinforced with ceramic network structure can improve dry sliding wear resistance. Reinforcements inhibit plastic flow and restrict propagation of wear cracks. Increase in the volume fraction of reinforcement leads to improvement in the wear resistance. Reinforcements are crushed into small pieces regardless of the morphology of original reinforcement present in the composite, hence wear resistance of composite is marginally affected by the reinforcement volume fraction. The wear mechanisms in IPCs could be classified into four modes as initial adhesive wear (I), mixed adhesive and abrasive wear (II), adhesive wear (III) and final abrasive wear (IV).
Ceramic skeleton
Metal matrix
(a) initial stage
Ceramic skeleton Metal matrix
5. Acknowledgment This work was supported by the National Natural Science
Foundation of China (Grant No. U1134101) and the Natural Science Foundation of Shandong Province (ZR2011EMM003) and science technology development project of ministry of education of Shandong (J10LD19).
(b) continual stage
REFERENCES Ceramic skeleton [1] WANG Shouren, GENG Haoran, WANG Yingzi, “Si3N4/Mg
Composites with an interpenetrating network”, Journal of Materials Science, vol. 41(17), pp.5751-5757, April 2006.
Metal matrix
[2] WANG Shouren, GENG Haoran, WANG Yingzi, The Abrasive Wear Properties of Si3N4-Al-Mg Metal Matrix Composites, Journal of Materials Engineering and Performance, vol. 15(5), pp.1-4, August 2006.
[3] HongChang, JonBinner, RebeccaHigginson, PaulMyers, PeterWebb, GusKing, “Preparation and characterisation of ceramic-faced metal–ceramic interpenetrating composites for impact applications”, vol. 46, pp.5237-5244, March 2011.
(c) middle stage [4] WANG Shou-ren, WANG Yong, Changchun LI, Qing CHI, ZHenyi
FEI ,The dry sliding wear behavior of interpenetrating titanium trialuminide/aluminium composites”, Applied Composite Materials, vol. 14, pp.129-144, March 2007.
Ceramic skeleton [5] Y. Sahin, The prediction of wear resistance model for the metal matrix composites vol. 258, pp.1717-1722, March 2005.
Metal matrix [6] Hong Chang, Rebecca Higginson, Jon Binner, “Microstructure and property characterisation of 3-3 Al(Mg)/Al2O3 interpenetrating composites produced by a pressureless in!ltration technique”, Journal of Materials Science, vol. 45, pp.662-688, October 2010.
[7] Jami Winzer, Ludwig Weiler, Jeanne Pouquet, Jürgen Rödel, “ Wear behaviour of interpenetrating alumina–copper composites”, Wear, vol. 271, pp.2845-2851, May 2011.
[8] H.Akbulut, M.Durman, F.Ylmaz, “Dry wear and friction properties of �-Al2O3 short !ber reinforced Al-Si (LM13) alloy metal matrix composites”, Wear, vol. 215, pp.170–179, March 1998. (d) final stage
[9] Y.Iwai, T.Honda, T.Miyajima, Y.Iwasakiy, M.K.Surappa ,J.F.Xu, “Dry sliding wear behaviour of Al2O3 !ber reinforced aluminium composites”, Compos. Sci.Technol., vol.60, pp 1781–1789, September 2000.
Figure 6. Wear processing of interpenetrating composites
[10] A.Wang, H.J.Rack, “Transition wear behaviour of SiC particulate and SiC whisker reinforced 7091 Al metal matrix composites, Mater. Sci. Eng. A, vol.147, pp.211–224, June 1991.
Copyright © 2012 SciRes. 133

Mixing Enhancement In A Coaxial Jet Mixer
Valery Zhdanov Rostock University
Department of Technical Thermodynamics 18059 Rostock, Germany
Egon Hassel Rostock University
Department of Technical Thermodynamics 18059 Rostock, Germany
Abstract— Experimental investigations of mixing in a coaxial jet mixer have been carried out applying Particle Image Velocimetry (PIV) and Planar Laser Induced Fluorescence (PLIF) methods simultaneously. A developed turbulent jet of an aqueous solution of Rhodamine 6G issued from the nozzle was mixed with co-flow water. Velocity and scalar fields were studied quite far downstream flow to control the formation of a quasi homogeneous mixture. The intensity of mixing was varied by mouthpieces with rectangular and triangular vortex generators of different sizes installed in the nozzle. The formation length of the quasi homogeneous mixture was reduced about 10 jet diameters by the tabs. The triangular tabs were more effective than the rectangular ones.
Keywords - mixing; turbulent flow; vortex generators; PIV; PLIF
1. IntroductionMixing enhancement of gas and fluid flows is interesting
for different technical applications from turbo-jet engines to jet mixers in chemical industry. In jet co-flows passive and active methods are applied already long time to increase mixing. If active methods (acoustic radiation, jet oscillation, nozzle vibration and so on) require an additional energy to influence the flow, passive ones solve the same problem using the flows energy by changing initial conditions of the mixing layer formation. For this purpose nozzles of different forms (square, triangle and lobed nozzles [1-6]) and nozzles with vortex generators [1, 7-11] are usually used. These tools enhance mixing in comparison with round nozzles of correspondent sizes in subsonic and supersonic flows [9].
Nozzles with vortex generators (tabs) intensify mixing stronger than any no round nozzles or the active methods (periodic forcing). As have been noted in [8]… “ in terms of the jet centerline velocity decay, none of these active methods produces as much effect as observed with the tabs”. The effectiveness of tabs was demonstrated in studies of jet flows issued from nozzles with the formation of laminar [1, 8- 10] or turbulent boundary layers [9, 12]. On the base of these investigations a physical model of tabs effect was proposed: a pair of counter-rotating streamwise stationary vortices was generated behind the tab and these vortices changed the vorticity distributions in the flow downstream [8-10]. As a sequence of this action, the cross section of the original round
jet was hard distorted. The jet diameter was reduced in one direction and became wider in the other direction (jet bifurcation). The extent and the form deformation depended on the number of tabs. Two sources for the generation of streamwise vorticity behind the tab have been identified [11]. The dominant source (denoted as 1) comes from the pressure hill formed upstream of the tab. The second source (denoted as 2), again owing to the pressure gradients on the tab’s surface, is the vortex shed from the sides of the tab. The application of the tabs in nozzles of different configurations has shown the higher effectiveness of the triangular vortex generators [1, 9].
The effect of tabs has been investigated mostly by Pito tube, Laser Doppler Anemometry (LDA) or Thermo Anemometry systems in studies of the jet flows. The mixing enhancement was estimated by the intensity of the mean velocity decay or calculating the entrainment (the “mass flux”) [1, 9]. This integral quantity was used as the primary measure for the comparative study and due to the fact details of mixing were hided. As has been shown in the reference [13], the scalar field develops faster than the velocity one and to get more comprehensive information on mixing the direct measurements of scalar variations are required.
In the present study the development of velocity and scalar fields in the coaxial jet mixer is studied applying PIV and PLIF methods simultaneously. The measurements interval extended long enough downstream the nozzle to control the formation of a quasi-homogeneous mixture. Apart from the known investigations, where the issued jets were characterised by some art of boundary layers, the present study deals with mixing of developed turbulent jet flow. As was noted in the reference [8], the tab effect was observed only if the tab height was large relative to the boundary-layer thickness of the issued jet. A tab with height substantially smaller than the boundary-layer thickness was not effective.
2. Experimental Set Up A. Equipment
The measurements have been carried out in the closure water channel (Fig.1).
Mixing of fluids took place into a coaxial jet mixer. The clear water from tank 1 was pumped to buffer tank 2 and through tube 3 (L=5 m) entered mixer 4. Dye solution of Rh 6G from tank 5 pumped through heat exchanger placed in tank
Advances in Materials Physics and Chemistry Supplement: 2012 world Congress on Engineering and Technology
134 Copyright © 2012 SciRes.

2, came to vessel 9, where the air was removed from the fluid and finally was ejected through nozzle 6 into the coflow. The mixed fluids were collected in tank 7 to eliminate the dye before being drained into the environment. The accuracy of the flow rate in both supply lines was not worse of �1 %.
Figure 1. Scheme of the water channel
The test section of the channel consists of the mixer and equipment. The mixer was formed by two co-axial tubes: glass tube 1 with an inner diameter of D = 0.05 m and steel tube 2 with an inner diameter of d = 0.01 m (nozzle), which was co-axially positioned with an accuracy of ±0.1 mm (Fig.2).
Figure 2. Scheme of the test section
The horizontal length of the nozzle was equal 60d, so the developed flow was formed at the nozzle exit. To reduce the image distortion of the object in flow due to the curvature of the mixer surface it was placed into the glass rectangular box filled with the water.
Identical CCD cameras (14 - bit PCO 1600, with a resolution of 1600x1200 pixels and frame rate of 30 fps at full resolution) were used to measure the velocity and scalar fields. The cameras were placed on a common assembly plate and they observed the same flow image using the beam splitter plate (BP) (Fig.2). The assembly plate was fixed to the profile fastened on a linear stage. This stage also carried lenses and mirror which were needed to produce a laser sheet of 0.7(103
m thickness, and a laser Nd:YAG. The mutual displacement of the cameras and the laser sheet, the lenses and the laser did not change when the measurements at different distances from the nozzle were carried out. Both cameras were equipped with Nikkor 50 mm lens and separating rings PK-11A. The image magnification was 0.173 for both cameras. The image
acquisitions run in double frame mode for both cameras with a frequency of 15 Hz. The host computer synchronized the cameras and the laser. The pulse laser Nd:YAG (Nano 50-50) had a pulse width of 5 ns, a variable pulse repetitive rate of 4–50 Hz, and the energy stability of 50 mJ ± 2% at 532 nm.
B. Running Conditions of Experiments The investigations have been carried out for the coflow-to-
jet flow rate ratio equal to 5 at which the exit jet velocity was turbulent at the Reynolds number Red =104.
The intensity of mixing was controlled by mouthpieces that were installed in the nozzle (Fig.3).
Figure 3. The mouthpieces applied in experiments, from left to right D0, D1, D2 - D3
Four mouthpieces with the same inner diameter (d=0.01 m) were used: the reference one without tabs (D0), the mouthpiece with rectangular tabs h = 1.5( 10-3 m (D1), the mouthpieces with triangular tabs h=1.3 and 1.8( 10-3 m (D2) and (D3) correspondently. So, the influence of sizes and configurations of the tabs on mixing can be estimated. The exit cross sections of the mouthpieces were reduced to 12 % for D1 and to 8 and 16% for D2 and D3 in comparison with the cross section of the reference one (D0). This reduction of cross sections resulted in the higher exit velocities because the value of the jet flow rate was the same in these investigations.
The laser sheet crossed the mixer in the vertical plane along its centre line (z = 0). This light was reflected from the particles in the flow and exited the dye molecules, which started to radiate the light at the longer wavelength. The reflected light off the particles was collected by camera with the laser-line band pass interference filter 532nm (Edmund Optics). The radiated light of the dye molecules passed through the broad pass filter BP600 nm with 50nm FWHM (Edmund Optics) and was collected by another camera.
Preliminary studies of different but uniform dye concentrations of Rh 6G were executed. A short glass cylindrical volume identical to the mixer was filled with dye solutions and placed into the same glass box with the water. Series of 200 images were recorded and then averaged at each pixel. Besides, series dark images were recoded to determine the grey value offset for each pixel. The difference of these images yields the light intensity distribution that corresponds to the determined dye concentration. Due to the each pixel calibration, the Gaussian nature of the laser beam, which results in the variations of the dye intensity over the laser sheet, were taken into account.
To calculate statistical characteristics of the velocity and scalar fields of the mixed flows 2000 images were captured by each camera at seven positions along the mixer length.
ND:YAG
LIF Camera
PIV Camera
Lens
coflow
Rh 6G
Linear Stage
BP
Mirror
12
Profile
xy
z
Copyright © 2012 SciRes. 135

3. ResultsThe jet bifurcation was developed just behind the nozzle
with the mouthpieces D1-D3. Therefore the measurements were done for two positions of these mouthpieces in the planes differing by 45°. At first the mouthpiece was installed in the nozzle so that the vertical laser sheet coincided with the two opposite tabs (the plane of 0°). In this case the pairs of the counter-rotating vortices generated by the tabs produced the vertical fluxes to the jet axis, i.e. the positive cross velocities appeared at the lower jet part and the negative one at the upper jet part (Fig.4a).
Figure 4. The distributions of the cross velocity (a) longitudinal velocities (b) and concentrations (c) just behind the nozzle at different positions of the mouthpieces
The longitudinal velocity and scalar profiles in this plane became narrower (left part of Fig.4b, c). The second row measurements were done when the mouthpieces were rotated by 45°. At this position the fluxes generated by the vortices from different pairs were ejected outside the jet axis and the velocities and concentrations profiles became wider (right part of Fig. 4b, c). The distributions of the velocity and concentrations in the measured cross sections were normalized on their values at the mixer centre line (U0 and C0).
The jet bifurcation decays downstream and in the cases of the mouthpieces of D1 and D2 the longitudinal velocity and fluctuations profiles at the distance x/D=3 did not differ in both measured plans while the concentrations profiles showed some differences even downstream in the case of D2 (Fig.5). The jet expanded stronger than the jet issued from the reference mouthpiece.
Figure 5. The velocity and concentration distributions behind the mouthpieces D0 and D2 at the distance x/D=3.0
The velocity field started to be uniform at x/D=9 where the fluctuations did not practically distinguish for all considered cases (Fig.6a). The cross velocity and its fluctuations had the same order and varied a few across the mixer (Fig.6b). The uniform scalar field was formed already at x/D=7 when mouthpieces D1-D3 were used (Fig.6c). The difference in the concentration distributions in two planes was already insignificant. The application of the mouthpiece D3 provided the faster formation of the quasi-homogeneous mixture in comparison with the other mouthpieces.
Figure 6. The velocities and scalar distributions at the distance x/D = 7, 9
136 Copyright © 2012 SciRes.

Decays of the normalized longitudinal mean velocities, concentrations and their fluctuations along the mixer axis downstream the nozzle demonstrate the dynamics of the tabs influence on mixing (Fig.7a, b).
Figure 7. Decay of the velocity and concentration fields in the mixer with different mouthpieces
Exit values of the velocity and concentration (Ui, Ci) and the values of these parameters at the mixer axis (U0 and C0) at the measured cross sections were used for the normalization of the fluctuations downstream the flow. The first normalisation shows the evolution of velocity and scalar fields along the mixer length and the second one gives the dynamics of the fluctuation–to-local velocity ratio. This parameter presents the development of the turbulence level in the flow. The correlation of the present measurements with the known ones [13] was quite well.
The tabs forced the co-flow entrainment into the jet. The entrainment started earlier and was accompanied by the decrease of the mean velocity and the concentration, and by the growth of the fluctuations. Maximum of the fluctuations was moved to the nozzle directions (at x/D=0.3 for D3). Because the mean values of the velocity and the concentration decreased stronger than the fluctuations ones, the local ratios u’/U0, c’/C0 at the mixer axis increased downstream. The scalar parameters decayed faster than the velocity one.
The advantage of the triangle tabs in mixing, as already has been noted in the references [1, 9], can be seen within the interval of 0 < x/D < 3 for the mouthpiece D2 against D1. With smaller blockage effect the mouthpiece D2 more intensively involved the co-flow fluid to the jet and resulted in the same mixture quality to the distance x/D=5.
The formation of the quasi-homogeneous mixture, where the velocity and scalar gradients fast degenerated and the fluctuations distributions across the mixer were nearly uniform, was completed in the case of the mouthpiece D3 minimum
about 10d earlier in comparison with the case when the jet was issued from the mouthpiece D0.
4. ConclusionsMixing in the coaxial jet mixer was investigated applying
simultaneously methods PIV and PLIF. The development of the velocity and concentration field was controlled by the mouthpieces with different tabs installing in the nozzle. The mixing enhancement has been observed at all kinds of investigated tabs, i.e., the tabs of relative small sizes (0.13 + h/d + 0.18) are quite effective also in the developed turbulent jet. The advantage of the triangular tabs against the rectangular ones also has been supported.
The cross fluxes generated by tabs resulted in the earlier entrainment of the co-flow fluid to the jet and forced the jet to expand faster.
5. Acknowledgment The study has been supported by the German Research
Foundation (DFG).
REFERENCES[1] K. B. M. Q. Zaman, “Spreading characteristics of compressible jets from
nozzles of various geometries”, J. Fluid Mech. vol. 383, pp. 197-228, 1999
[2] S. C. M. Yu, L. P. Chua, and X. K. Wang, “Measurements in the Near Field of a Confined Coaxial Square Jet”, AIAA J. vol. 42, pp.61-69, January 2004
[3] W. R. Quinn, “Near-Field Measurements in an Equilatera Triangular Turbulent Free jet”, AIAA J. vol. 43, pp. 2574-2585, December 2005
[4]� D. E. Nikitopoulos, J. W. Bitting, B. Rouge, and S. Gogineni, “Comparisons of Initially Turbulent, Low-Velocity-Ratio Circular and Square Coaxial Jets”, AIAA J. vol. 41, , pp.230-239, February 2003
[5] L. L.Smith, A. J. Majamaki, I. T. Lam, O Delabroy, A. R.Karagozian, F. E Marble, and O. I.Smith, “Mixing Enhancement in a Lobed Injector,” Phys. Fluids, vol. 9, pp. 667–678, 1997
[6] A. J. Majamaki, O. I. Smith, and A. R. Karagozian, “Passive Mixing Control via Lobed Injectors in High-Speed Flow”, AIAA J. vol. 41, pp 623-632, April 2003
[7] L. J. S. Bradbury and A. H. Khadem, “The distortion of a jet by tabs”, J.Fluid Mech. vol. 70, pp. 801-813, 1975
[8] M. Samimy, K. B. M. Q. Zaman and M. F. Reeder, “Effect of Tabs on the Flow and Noise Field of an Axisymmetric Jet”, AIAA J. vol. 31, pp. 609-619, April 1993
[9] M. Q. Zaman, M. F. Reeder and M. Samimy, “Control of an axisymmetric jet using vortex generators”, Phys. Fluids, vol. 6, pp. 778-794, February 1994
[10] M. F. Reeder and M. Samimy, “The evolution of a jet with vortex-generating tabs: real-time visualization and quantitative measurements”, J. Fluid Mech. vol. 311, pp. 73-118, 1996
[11] J. K. Foss, K.B.M.Q. Zaman, “Large- and small scale vertical motion in a shear layer perturbed by tabs”, J. Fluid Mech. vol. 382, pp. 307-329, 1999
[12] �S. C. M. Yu and P. K. Koh, “Experimental Investigation of Two-Stream Mixing Flow with Multiple Tabs”, AIAA J. vol. 39, pp. 996-1005, June 2001
[13] V. Zhdanov, N. Kornev, E.Hassel and A. Chorny, “Mixing of confined coaxial flows”, Int. J. Heat and Mass Transfer, pp. 3942-3956, 2006
Copyright © 2012 SciRes. 137

Biodiesel Production From Rubber Seed Oil Using A Limestone Based Catalyst
Jolius Gimbun1,2, Shahid Ali1, Chitra Charan Suri Charan Kanwal1, Liyana Amer Shah1, Nurul Hidayah Muhamad @ Ghazali1, Chin Kui Cheng1,2, Said Nurdin1
1Faculty of Chemical Engineering and Natural Resources, 2Centre of Excellence for Advanced Research in Fluid Flow (CARIFF)
Universiti Malaysia Pahang, 26300 Gambang, Pahang, Malaysia.
Abstract—This paper presents the potential of limestone based catalyst for transesterification of high free fatty acid (FFA) rubber seed oil (RSO). Pre-calcinated limestone known as clinker was activated using methanol and transesterification was performed under reflux with constant stirring. Mineral composition of the catalyst was analysed using x-ray fluorescence (XRF) with in build x-ray diffraction (XRD). The rubber seed oil was obtained using both microwave and soxhlet extraction using hexane as solvent. FFA content and fatty acid methyl ester content were determined using gas chromatography mass spectrometry (GC-MS). The results showed an efficient conversion (up to 96.9%) of high FFA rubber seed oil to biodiesel. The results suggest that the catalyst employed in this work is not negatively affected by moisture and free fatty acids and can be recycled very easily without significant loss in its activity. The highest conversion of 96.9% was achieved from catalyst activated at 700°C, with catalyst loading of 5 wt. %; methanol to oil molar ratio of 5:1; reaction temperature of 65°C and reaction time of 4 hours. The biodiesel produced in this work is within the limits of specification described by American standard test method (ASTM D6751).
Keywords-biodiesel; microwave extraction; cement clinker; rubberseed oil
1. IntroductionBiodiesel has been touted as a viable alternative to the
traditional petroleum-derived fuels due to environmental concern and sustainability issue. There are several sources of vegetable oil suitable for production of biodiesel such as palm oil, jatropha, soy bean and some selected species of forest seeds. Recently, the European Union is critical to the biofuel production using edible oils such as palm oil, corn, soy bean and maize, which are also consumed as food. These open a new avenue of producing a biodiesel using a non-food source crop such as the seed of the rubber tree (HeveaBrasiliensis). Malaysia has an estimated acreage of 1,021,540 hectares of rubber plantation in 2009 [1] producing an estimated average of more than 120 thousand tons of rubber seeds annually and this project aims to utilize these unused seeds to produce biodiesel. The rubber seed contain approximately about 40%
kernel with 20-25% moisture. The dried kernel contains 40-50% of oil [2] which translates to a potential production over 20 million litres of oil per year. The rubber seed oil has a high free fatty acid content, which mean the use of alkaline catalysts such as sodium hydroxide to produce biodiesel is unfavorable [2] because of the formation of relatively large amounts of soaps, leading to product loss and difficulty in the separation and purification of the biodiesel produced [3]. Thus, this work aims to overcome this issue by using a limestone based heterogeneous catalyst.
Heterogeneous base catalysts have advantages of being reusable, noncorrosive, show greater tolerance to water and free fatty acids (FFAs) in feedstock, improve biodiesel yield and purity, have a simpler purification process for glycerol and are easy to separate from the biodiesel product [4–7]. Calcium oxide (CaO) is one of the most common used heterogeneous base catalysts for the transesterification of vegetable oil. Producing biodiesel using CaO as a solid base catalyst has many advantages, such as higher activity, mild reaction conditions, reusable and low cost [4-7]. Liu et al. [6] shows that CaO powder can give about 95% conversion of soybean oil to biodiesel in present of excess methanol (12:1) at temperature of 60 °C and reaction time of 3 hours. Hsiao et al. [7] achieved 96.6% of conversion of soybean oil to biodiesel using a microwave assisted transesterification with 3% wt. of nanopowderCaO catalyst, methanol/oil ratio of 7:1, reaction temperature of 65°C and residence time of 1 hour. Use of nanopowderedCaO has several drawbacks because the nanopowder is not readily available and hence require a high energy to manufacture, furthermore, catalyst recovery or separation will be challenging for nanoparticle. This work aims to prepare a cheaper catalyst from limestone that is easy to recover apart from providing an efficient conversion of vegetable oil to biodiesel.
2. Materials and Methods A. Chemicals
Chemicals were obtained from various sources namely Merck Malaysia (dried methanol 99.9%, KOH pellets, hexane HPLC grade), John Kollin Chemicals (ethanol, 99.9%), R&M chemicals (diethyl ether), and Sigma-Aldrich (fuller earth, phenolphthalein, methyl heptadecanoate GC grade, n-hexane, acetone).
Advances in Materials Physics and Chemistry Supplement: 2012 world Congress on Engineering and Technology
138 Copyright © 2012 SciRes.

B. Rubber Seeds The Rubber seeds were collected during maturation period
from the rubber tree plantation area located near KampungPandan, Kuantan, Pahang, Malaysia. They were washed to remove dirt and stored at 4°C until extraction. Rubber seeds were first de-shelled and dried at 60°C for 3 hours. The dried seeds were finely crushed using Waring Commercial Lab Blender and then subjected to drying in an oven at 45°C overnight.
C. Soxhlet Extraction (SE) Hundreds grams of ground seeds were subjected to a total
extraction time of 4 hours at 60°C and 250 ml of n-hexane was used as a solvent. After the extraction was completed oil–solvent mixture was subjected to evaporation process under vacuum (BUCHI® Rotavapor R-200) at 60°C to evaporate the solvent and recover the extracted oil.
D. Microwave Assisted Extraction (MAE) 250 g of crushed seed was put into a glass jar and the oil
was extracted with 500 ml of n-hexane for 30 minutes at 64°C and power of 200W using the Milestone Micro synth ATC-FO 300. The n-hexane was then separated from the crude rubber seed oil using a rotary evaporator.
E. Analysis of Rubber Seed Oil and Biodiesel The extracted RSO and biodiesel was being analyzed for its
lipid and ester content respectively. Standard ASTM D6751 methods were being used to find, acid value (ASTM D664), calorific value (ASTM D240), kinematic viscosity (ASTM D445), moisture content (ASTM D2709), flash point (ASTM D93), specific gravity (ASTM D287) and cetane number (ASTM D613).
F. Catalyst Activation The limestone based cement intermediate called clincker
was obtained from Pahang Cement atKuantan Malaysia. Detail chemical composition of the clinker obtained from X-ray florescence with in-build XRD (ARL 8660S) is shown in Table 2 which indicates a significant CaO content (66.6%) useful for transesterification process. Clinker was crushed and ground to reduce the particle size around 200 �m to ensure a large surface area per unit mass. The catalyst activation was performed by soaking with methanol followed by calcination at 700°C for 7 hours in the furnace (Carbolite, CWF1215).
TABLE I. CLINKER ANALYSIS WITH XRF-XRD
Element CaO SiO2 Al2O3 Fe2O3 MgO SO3 K2O Na2O P2O5 TiO2
Wt. % 66.61 21.92 6.33 4.00 0.73 0.46 0.92 0.12 0.03 0.30
G. RSO and Biodiesel Composition Analysis Oil and FAME composition of seed oil was determined
using gas chromatography mass spectroscopy (GC-MS) according to ASTM D6584. Samples from the extraction and biodiesel production process were taken and dissolved in HPLC grade hexane before being injected into the GC-MS. Tri-acylglycerides (TAG) analysis was performed on Agilent 7890A GC System equipped with Agilent 7683B Series Injector, 5975C Inert MSD and a DB-1 column (30 m × 0.25 mm × 0.25 �m films), with a temperature range of 60 – 340°C,
while the FAME produced were analyzed on HP-5 column (30 m × 0.25 mm × 0.25 �m) with a temperature range of 60°C to 325°C. Identification of the peaks was performed by comparing retention times with those of library standards analyzed under the same conditions. FAME and fatty acid composition was determined as in Table 3. The most abundant fatty acids in RSO were linoleic, stearic, and palmitic acids. While the FAME is mainly of methyl linolelaidate and methyl vaccinate.
TABLE II. FAME AND FATTY ACID COMPOSITION OF RSO
Properties This work Ramadhas et al. [2] Fatty acid composition (%)
Palmitic acid C16:0 10.29 10.2 Stearic acid C18:0 8.68 8.7 Oleic acid C18:1 20.07 24.6 Linoleic acid C18:2 58.5 39.6 Linolenic acid C18:3 0.8 16.3
FAME content (%) Methyl palmitate 7.7 Methyl stearate 3.9 Methyl linolelaidate 43.2 Methyl vaccenate 45.1 Others 3.1
Specific gravity 0.92 0.91 Calorific value (MJ/kg) 38.96 37.5 Acid value (mg KOH/g) 35.14 34
H. Transesterification and purification of rubber seed oil The catalyst of various amount ranged from 3 to 7 wt% was
dispersed in methanol at temperature ranged from 50 to 70°C for a period of time prior to contact with the preheated feedstock, providing a robust transesterification catalyst system. Transesterification were performed at various residence time ranged from 0.5 to 4 hours with aid of agitation. Water soluble methanol and glycerol were removed by washing intensely with water. The biodiesel produced was filtered to remove the catalyst and residual methanol was vacuum evaporated. Fuller earth was used to reduce the moisture content of the product. Eppendorf 5810R centrifuge was used to remove the fuller earth, residual catalyst and glycerol followed by analysis of its properties according to ASTM D6751 standard. All experiments were repeated three times, and the value reported in this paper was the average value.
3. Results and Discussions I. Comparison of Soxhlet and Microwave Asissted
Extraction Comparison of extraction efficiency of rubber seed oil
using soxhlet and microwave extraction is presented in Fig. 1. The results suggest that microwave extraction is better than the conventional soxhlet method because the yield of oil extracted is much higher at 40% compared to the soxhlet at 36%. Furthermore, microwave extraction is much faster at 15 minutes compared to about 6 hours for the soxhlet method. This is due to microwave heating which interact selectively with the free solvent molecules present in the homogenized solution; this leads to localized heating, and the temperature increases rapidly. Thus, such systems undergo a dramatic expansion, with subsequent rupture of cell walls, allowing the oil to flow outwards from the inside of finely crushed seeds [8].
Copyright © 2012 SciRes. 139

In contrast the soxhlet extraction is diffusion driven where the solvent diffuses into the matrix and extracts the components by solubilization, hence a slow process. The yield of oil recovered from rubber seed in this work is in agreement with earlier work by Ramadhas et al. [2]. The MAE method is more efficient in terms of yield and time consumption for the extraction process. Therefore, microwave extraction method will be used for the remainder of this work.
Figure 1. Comparison of soxhlet and microwave assisted extraction
J. Influence of Methanol to Oil Molar Ratio Theoretically the stoichiometry of transesterification
reactions requires 3 mole of alcohol for every mole of triglyceride in order to produce 3 mole of methyl ester and 1 mole of glycerol as by product. However, it is not always possible to achieve an optimum transesterification using a 3:1 ratio since yield of glycerol and conversion is not always perfect.Results in Fig. 2 shows the increasing trend of conversion rate with the methanol/oil molar ratio ranging from 2:1 to 4:1, but afterwards shows a slight decline in conversion rate with the methanol/oil molar ratio going from 5:1 to 6:1. At first, excess methanol increases the solubility of the by-product (glycerol) [7] which then may initiate the reversible reaction to reduce the conversion. The optimum methanol/oil molar ratio was observed at4:1.Excess methanol can be removed easily by washing withwater, and its residual may be removed using rotary evaporator.
Figure 2. Effect of methanol to oil ratio (4 wt.% catalyst, 55°C)
K. Influence of Catalyst Loading Fig. 3 shows the conversion of RSO to biodiesel increases
when the amount of catalyst increased from 2.0 to 6.0 wt.%
with the methanol to oil ratio of 4:1, but decreased when the amount of catalyst exceeded 6.0 wt.%.This is due to reversible nature of the transesterification process [9] whereby the catalyst concentration levels greater than 6 % may have favored the backward reaction. The results suggest that optimum catalyst loading for RSO transesterification is 6 wt.% with conversion of 92.3%.
Figure 3. Effect of catalyst loading (Temperature 55°C, Methanol:Oil 4:1)
L. Influence of Temperature Generally, as the reaction temperature increases, the rate of
reaction increases as they are affected by temperature through the Arrhenius equation.Fig. 4 shows the conversion increases from 65.4% to 96.9%when the temperature increased from 40°C to 65°C. Higher temperature improves the efficiency of transesterification, which in turn enhances the RSO conversion. However, increasing the temperature above 65°C does not significantly affect the RSO conversion; in fact conversion reduces slightly to 95.8% when temperature increases to 70°C. This is due to methanol evaporation at temperature higher than 64.7°C (methanol boiling point) and hence oil to methanol ratio cannot be maintained to achieve a desirable reaction. Optimumtemperature for RSO transesterification with limestone based catalyst is around 65°C.
Figure 4. Effect of temperature to (methanol:oil 4:1, catalyst loading 5% wt.)
M. Catalyst Recycability The most important advantage of using heterogeneous
material as catalysts is the ability to recycle and reuse. The catalyst was collected for reuse using a filter paper and washed with acetone to remove the impurities of the mixture
140 Copyright © 2012 SciRes.
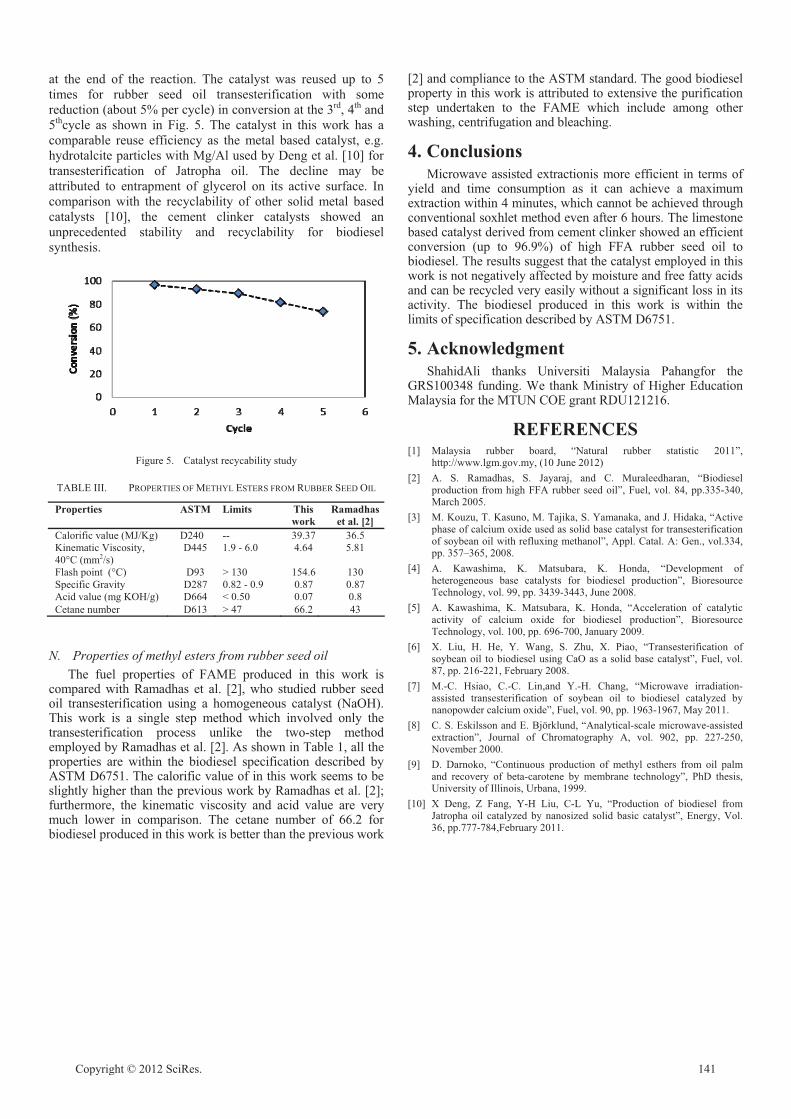
at the end of the reaction. The catalyst was reused up to 5 times for rubber seed oil transesterification with some reduction (about 5% per cycle) in conversion at the 3rd, 4th and 5thcycle as shown in Fig. 5. The catalyst in this work has a comparable reuse efficiency as the metal based catalyst, e.g. hydrotalcite particles with Mg/Al used by Deng et al. [10] for transesterification of Jatropha oil. The decline may be attributed to entrapment of glycerol on its active surface. In comparison with the recyclability of other solid metal based catalysts [10], the cement clinker catalysts showed an unprecedented stability and recyclability for biodiesel synthesis.
Figure 5. Catalyst recycability study
TABLE III. PROPERTIES OF METHYL ESTERS FROM RUBBER SEED OIL
Properties ASTM Limits This work
Ramadhaset al. [2]
Calorific value (MJ/Kg) D240 -- 39.37 36.5 Kinematic Viscosity, 40°C (mm2/s)
D445 1.9 - 6.0 4.64 5.81
Flash point (°C) D93 > 130 154.6 130 Specific Gravity D287 0.82 - 0.9 0.87 0.87 Acid value (mg KOH/g) D664 < 0.50 0.07 0.8 Cetane number D613 > 47 66.2 43
N. Properties of methyl esters from rubber seed oil The fuel properties of FAME produced in this work is
compared with Ramadhas et al. [2], who studied rubber seed oil transesterification using a homogeneous catalyst (NaOH). This work is a single step method which involved only the transesterification process unlike the two-step method employed by Ramadhas et al. [2]. As shown in Table 1, all the properties are within the biodiesel specification described by ASTM D6751. The calorific value of in this work seems to be slightly higher than the previous work by Ramadhas et al. [2]; furthermore, the kinematic viscosity and acid value are very much lower in comparison. The cetane number of 66.2 for biodiesel produced in this work is better than the previous work
[2] and compliance to the ASTM standard. The good biodiesel property in this work is attributed to extensive the purification step undertaken to the FAME which include among other washing, centrifugation and bleaching.
4. ConclusionsMicrowave assisted extractionis more efficient in terms of
yield and time consumption as it can achieve a maximum extraction within 4 minutes, which cannot be achieved through conventional soxhlet method even after 6 hours. The limestone based catalyst derived from cement clinker showed an efficient conversion (up to 96.9%) of high FFA rubber seed oil to biodiesel. The results suggest that the catalyst employed in this work is not negatively affected by moisture and free fatty acids and can be recycled very easily without a significant loss in its activity. The biodiesel produced in this work is within the limits of specification described by ASTM D6751.
5. Acknowledgment ShahidAli thanks Universiti Malaysia Pahangfor the
GRS100348 funding. We thank Ministry of Higher Education Malaysia for the MTUN COE grant RDU121216.
REFERENCES[1] Malaysia rubber board, “Natural rubber statistic 2011”,
http://www.lgm.gov.my, (10 June 2012) [2] A. S. Ramadhas, S. Jayaraj, and C. Muraleedharan, “Biodiesel
production from high FFA rubber seed oil”, Fuel, vol. 84, pp.335-340, March 2005.
[3] M. Kouzu, T. Kasuno, M. Tajika, S. Yamanaka, and J. Hidaka, “Active phase of calcium oxide used as solid base catalyst for transesterification of soybean oil with refluxing methanol”, Appl. Catal. A: Gen., vol.334, pp. 357–365, 2008.
[4] A. Kawashima, K. Matsubara, K. Honda, “Development of heterogeneous base catalysts for biodiesel production”, Bioresource Technology, vol. 99, pp. 3439-3443, June 2008.
[5] A. Kawashima, K. Matsubara, K. Honda, “Acceleration of catalytic activity of calcium oxide for biodiesel production”, Bioresource Technology, vol. 100, pp. 696-700, January 2009.
[6] X. Liu, H. He, Y. Wang, S. Zhu, X. Piao, “Transesterification of soybean oil to biodiesel using CaO as a solid base catalyst”, Fuel, vol. 87, pp. 216-221, February 2008.
[7] M.-C. Hsiao, C.-C. Lin,and Y.-H. Chang, “Microwave irradiation-assisted transesterification of soybean oil to biodiesel catalyzed by nanopowder calcium oxide”, Fuel, vol. 90, pp. 1963-1967, May 2011.
[8] C. S. Eskilsson and E. Björklund, “Analytical-scale microwave-assisted extraction”, Journal of Chromatography A, vol. 902, pp. 227-250, November 2000.
[9] D. Darnoko, “Continuous production of methyl esthers from oil palm and recovery of beta-carotene by membrane technology”, PhD thesis, University of Illinois, Urbana, 1999.
[10] X Deng, Z Fang, Y-H Liu, C-L Yu, “Production of biodiesel from Jatropha oil catalyzed by nanosized solid basic catalyst”, Energy, Vol. 36, pp.777-784,February 2011.
Copyright © 2012 SciRes. 141

Facile and green synthesis of �,�-unsaturated ketone catalyzed by air-stable organobismuth complex
Renhua Qiu, Yimiao Qiu, Zhengong Meng, Xingxing Song, Zhenyong Jia, Kun Yu, Shuangfeng Yin*
Collenge of Chemistry and Chemical Engineering, Hunan University, Changsha, 410082, P.R. China
E-mail: [email protected]
Chak-Tong Au*, Wai-Yeung Wong* Department of Chemistry,
Hong Kong Baptist Universtiy Hong Kong, China
E-mail: [email protected], [email protected]
Abstract—Air-stable cationic organobismuth complexes (2-5) possessing both acidic and basic characters were synthesized. The catalyst system that comprises an air-stable bifunctional Lewis acidic/basic organobismuth complex and [Bmim]BF4 showed high catalytic activity, diastereoselec-tivity, stability, and reusability in the one-pot synthesis of (E)-�,�-unsaturat-ed ketones through highly selective crossed-condensation of ketones and aldehydes. Through switching the reaction from homogeneous to heterogeneous, the system shows facile separation ability and facile reusability.
Keywords-�,�-unsaturated ketone; catalysis; facile seperation catalytic system;organobismuth;synthesis
1. Introduction �,�-Unsaturated carbonyl compounds are widely used as
substrates for a number of reactions such as hydrogenation, epoxidation, peroxidation, cycloaddition, and conjugate addition. Aldol condensation reaction of carbonyl compounds is the most common processfor the synthesis of �,�-unsaturated carbonyl compounds. Claisen-Schmidt condensation, a crossed aldol condensation of an aromatic aldehyde and an aliphatic ketone or aldehyde under basic conditions, is traditionally used process. In the reaction, a relatively strong base (such as metal hydroxide or metal alkoxide) is employed, and selective mono-condensation is often difficult due to side reactions such as bis-condensation and aliphatic aldehyde dimerization. Application
Scheme 1. A comparison between a common process and an ideal process for the selective synthesis of �,�-unsaturated ketones.
of the method is further limited because substrates with base-sensitive functional groups are not suitable. A better approach is by means of the Mukaiyama-aldol reaction followed by subsequent dehydration catalyzed by a Lewis acid. Recently, Yanagisawa et al. reported the one-pot selective synthesis of �,�-unsaturated ketones from alkenyl trichloroacetates and
aldehydes; in this approach, ketones have to be converted to alkenyl trichloroacetates before the condensation reaction.
Catalytic direct crossed-condensation of ketones and aldehydes would be an ideal process for the synthesis of �,�-unsaturated carbonyl compounds, because there is no need to prepare reactive intermediates (e.g. silyl enol ether) and only H2O is generated as a side-product (Scheme 1). Such a process is significantly “energy-efficient” and “atom economic” since multistep transformations and separation of product (from by-products) is not necessary. Recently, use of organocatalysts for direct crossed-condensation reaction was reported, while high catalyst loading is necessary (20 mol%).
We are interested in the study of organobismuth complexes because bismuth is a stable (green) heavy element. The utilization of bismuth compounds in the field of catalysis and organic synthesis has been studied intensively in recent years. Simple bismuth Lewis acids such as bismuth halides and triflates are catalysts highly efficient in a number of reactions. The use of designed cationic organobismuth compounds in catalysis, however, is rarely reported partly due to the instability of the Bi-C bond. In this paper, air-stable cationic organobismuth complexes [S(CH2C6H4)2Bi(OH2)]+[X]– (2-5) possessing both acidic and basic characters are synthesized [1-5] Furthermore, we herein report a catalytic process that is based on the facile separation approach. The catalyst system is composed of an air-stable Lewis acidic/basic bifunctional complex [S(CH2C6H4)2Bi(OH2)]+[BF4]– (1) and [Bmim]BF4 (1-buty-3-methylimidazolium tetrafluoroborate); it shows high catalytic efficiency for the green synthesis of (E)-�,�-unsaturated ketones through cross-condensation of aldehydes and ketones.
2. Results and Discussion
Advances in Materials Physics and Chemistry Supplement: 2012 world Congress on Engineering and Technology
142 Copyright © 2012 SciRes.

Scheme 2. Synthetic routes of butterfly-shaped sulfur-bridged organobismuth complexes 1-5.
Shown in Scheme 2 is the synthetic route of the organobismuth complexes 1-5. Treatment of S(CH2C6H4)2BiCl 1 with AgX in THF afforded organobismuth complexes 2-5 quantitatively.The results of 1H NMR spectroscopy and elemental analysis show that samples 2-5 freshly obtained from recrystallization contain one water molecule. They are air-stable and show good water tolerance. They remained as dry colorless crystals or white powder in ambient environment in a test period of one year.
The thermal behavior of complexes 2-5 was investigated by TG-DSC in N2 (Fig. 1). The materials show high thermal stability, especially complexes 4 and 5 with perfluoroalkylsulfonate counter anions (stable up to 230 oC). We also employed the Hammett indicator method11a-b to determine acidity and basicity, and found moderate acidity with acid strength of 3.3 < Ho � 4.8 for 3-5 and 4.8 < Ho � 6.8 for 2. In terms of basicity, the four complexes exhibit strength of 7.2 � H- < 8.9. It is worth pointing out that complex 1 shows no acidity but basicity (7.2 � H- < 8.9.). Despite Lewis acid/base pair exists in complexes 2-5, there is no sign of self-quenching. With the steric effect of the butterfly-shaped ligand structure and the presence of bismuth-sulfur bifunctional centers, it is envisaged that complexes 2-5 are efficient and stereoselective catalysts.
Fig. 1 TG-DSC analysis of organobismuth complexes 2-5.
We first investigated the catalytic performance of 3 towards the direct three-component Mannich reaction of benzaldehyde, cyclohexanone and propylamine in ionic liquid [Bmim]BF4. However, a completely different product, (E)-�,�-unsaturated ketone, was obtained. Since this process was efficient under
mild conditions, we further evaluated the catalytic performance of 3 towards the synthesis of �,�-unsaturated ketones. Furthermore, during the course of reaction, the nature of catalysis switches from homogeneous to heterogeneous (Fig. 2). At the beginning, benzaldehyde 6a, cyclohexanone 7a, propylamine, complex 3 and [Bmim]BF4 merge together and the reaction system is homogeneous (Fig. 2a). By the end of the reaction, the system becomes turbid, and after 5 min of settling, the mixture separates into two phases. The upper consists of the product and unconsumed reactants while the lower consists of [Bmim]BF4, complex 3, and water (the only side product) (Fig. 2b). The findings were congruent to Leng groups work, which it has a catalytic procedure that is monophasic at the beginning and biphasic at the end. The overall reaction occurs at room temperature and there is no need to change any reaction condition. Previously, Leng’s group deduced the system with such behavior and features as reaction-induced self-separation catalyst system, which is a facile separation catalyst system. The prominent feature of the system is its excellent solubility in water or polar solvents but immiscibility in apolar �,�-unsaturated ketones. In other words, as a catalyst complex 3 dissolves completely in [Bmim]BF4 as well as in the reactants, but is insoluble in the product (�,�-unsaturated ketones). Thus at the early stage, the mixture for the cross-condensation reaction is homogeneous. With the consumption of reactants, the system becomes heterogeneous, and there is the spontaneous separation of the catalyst system (complex 3 and [Bmim]BF4) and product. Eventually, the catalyst system can be easily recovered by simple decantation (Fig. 2c). It is apparent that the advantages of both homogeneous and heterogeneous catalysis are captured in this method.
Fig. 2 Photographs of the cross-condensation reaction of benzaldehyde 6a with cyclohexanone 7a over organobismuth complex 3 in the presence of propylamine in [Bmim]BF4. (a) Homogeneous mixture during reaction; (b) the reaction system becomes heterogeneous at completion of reaction: the upper layer is composed of the product (�,�-unsaturated ketones) and unconsumed reactants while the lower layer [Bmim]BF4, complex 3, and water generated in the reaction; (c) at the end of reaction, the layer of [Bmim]BF4, catalyst 1, and water was removed by decantation.
In a scale-up (x5) experiment, we found that catalyst loading can be lowered to 0.1 mol% with the facile separation of catalyst system almost unaffected. Furthermore, the resulting ILs containing catalyst and water can be conveniently reused along with the unconsumed reactants and newly added substrates. Subject to desiccation treatment and owing to the air-stable, water-tolerant features and special interaction effect of the organobismuth complex and ILs [Bmim]BF4, the catalyst system can be recycled for at least ten times without significant decline in product yield (96–100%) and
Copyright © 2012 SciRes. 143

stereoselectivity (E/Z = 100/0). Furthermore, we examined the structure integrity of the recycled catalyst (with [Bmim]BF4) by the NMR technique and found that the structure of the recycled catalyst is consistent with that of the freshly prepared one. In other words, the catalyst is stable and suitable for reuse. It should be noted that the total substrate molar ratio (6a : n-PrNH2 : 7a) for ten cycles is 1.0 : 0.19 : 1.2, and the TON is up to 9893.
Usually, a catalyst system is only conveniently suitable for certain substrates. However, the one depicted by us here can be applied to enolizable aliphatic aldehydes as well as to aromatic aldehydes with electron-donating and electron-withdrawing groups (Table 1. In all cases, the phenomenon of facile separation was observed with high product yields. Although the reaction of furfural occurs at 0 oC (Table 1, entry 5), the E-selectivity for furfural is consistent with those of the other aldehydes. It is worth pointing out that the reaction of enolizable aliphatic aldehydes selectively produces (E)-�,�-unsaturated ketones in almost quantitative yields without aldehyde facile condensation product or any-other side-product formation (Table 1, entries 6–7). On the other hand, the active methylene compounds appear to be efficient substrates in the present scheme (Table 1, entries 9–11). In all cases, no dibenzylidene byproduct is detected in NMR analysis. We ascribe such phenomenon to the special steric effect of monobenzylidene. In the catalyst system, it is hard for large group such as monobenzylidene to approach the active sites, and cross-condensation of monobenzylidene with cyclohexanone to form dibenzylidene byproduct is unlikely.
TABLE I. SYNTHESIS OF DIFFERENT À,Á-UNSATURATED KETONES CATALYZED BY CATIONIC ORGANOBISMUTH COMPLEX 3 IN [BMIM]BF4.A
Entry R1CHO Ketone Product Yield (%)b E/Zc 1 6a 7a 8a 98 100/0 2 6b 7a 8b 93 100/0 3 6c 7a 8c 99 100/0 4 6d 7a 8d 100 100/0 5d 6e 7a 8e 98 100/0 6 6f 7a 8f 100 100/0 7 6g 7a 8g 98 100/0 8 6a 7b 8h 97 -- 9 6a 7c 8i 99 -- 10 6a 7d 8j 98 -- 11 6a 7e 8k 95 -- a6, 20 mmol; n-PrNH2, 20 mmol; 7, 60 mmol; 3, 0.2 mmol; [Bmim]BF4, 1.0 mL; RT. bIsolated yield. cDetermined by 1H NMR. d0 oC.
Due to the fact that complex 3 plays a major role in this facile separation catalyst system, we studied the crystal structure of 3 by X-ray analysis. An ORTEP representation of
3, and the selected bond lengths and angles are shown in Fig. 3. It is clear that the organobismuth component in 3 is cationic. The oxygen atom of the coordinating water occupies a vacant site of the cationic bismuth centre, making the coordination geometry distorted and equatorially vacant. One can see a trigonal bipyramidal with the sulfur and the oxygen atoms in the apical positions and the two carbon atoms in the equatorial positions. The Bi–S(1) distance (2.699(19)) is shorter than that (2.845 Å) of precursor 1, clearly suggesting stronger sulfur-to-bismuth coordination in 3. The Bi–O(1) distance (2.499(6) for 3) is longer than that of covalent Bi–O bonds (e.g., Bi–O bond distances of monomeric diorganobismuth alkoxides within 2.15–2.20 Å), indicating that the weakly coordinated water molecule can be replaced by a substrate. The dihedral angle of the two phenyl planes (ca. 107 degrees) is equal to the C(1)-Bi-C(14) angle (97.2 degrees) and the C(7)-S(1)-C(8) angle (101 degrees). This butterfly-shaped cationic organobismuth ion is similar to that of 1,1’-binaphthol template used as asymmetric catalyst in organic synthesis.
Fig. 3 An ORTEP view (30% probability level) of 3. Selected bond lengths (Å) and angles (deg): Bi(1)–C(1), 2.256(7); Bi(1)–C(14), 2.262(7); Bi(1)–O(1), 2.499(6); Bi(1)–S(1), 2.6992(19); S(1)–C(7), 1.815(8); S(1)–C(8), 1.816(9); O(1)–H(1A), 0.8180; O(1)–H(1B), 0.7499; C(1)–Bi(1)–C(14), 97.2(2); C(1)–Bi(1)–O(1), 86.3(2); C(14)–Bi(1)–O(1), 90.7(2); C(1)–Bi(1)–S(1), 78.01(19); C(14)–Bi(1)–S(1), 78.01(19); O(1)–Bi(1)–S(1), 159.20(14); C(7)–S(1)–C(8), 101.0(4); C(7)–S(1)–Bi(1), 95.7(3); C(8)–S(1)–Bi(1), 94.7(3); Bi(1)–O(1)–H(1A), 109.5; Bi(1)–O(1)–H(1B), 119.8.
Although further study is necessary to clarify the reaction mechanism, the results mentioned so far suggest that the reaction probably takes place through a Mannich-type mechanism as shown in Scheme 3. In the reaction, the complex with the above framework displays Lewis acidic/basic bifunctional properties with the accessible bismuth centers acting as a Lewis acid sites and the uncoordinated lone-pair electrons of sulfur as Lewis base sites. However, it should be noted that when organobismuth complex 3 is used as catalyst in the presence of propylamine in ILs, high catalytic activity was observed in cross-condensation of benzaldehyde and cyclohexanone, displaying high synthetic yield and diastereoselectivity (yield 98%, E/Z = 100/0). Very different result is obtained when water is used as solvent (yield 94%, E/Z = 90/10), suggesting that the ILs play an important role in the control of diastereoselectivity. We utilized NMR technique
144 Copyright © 2012 SciRes.

to investigate the interaction of complex 1 with [Bmim]BF4 (Scheme 4).
Scheme 3. A plausible catalytic cycle for the crossed-condensation reaction of ketones and aldehydes catalyzed by 3 in the presence of n-PrNH2.
Scheme 4 Proposed interaction of complex 3 and imidazolium cationic ion
[Bmim]+ in ionic liquids.
Because of interaction such as hydrogen bonding and the special phenyl planar geometry, we postulate that the 1H NMR singlet of water molecules or ILs coordinated with the Bi catalyst should shift to high field. The change of 1H NMR chemical shift that is related to methyl and methylene group linked to the nitrogen atom of [Bmim]BF4 is consistent with our hypothesis, implying that hydrogen bonding is apparent. With hydrogen bond formation, there should be enhancement of electron-withdrawing ability, consequently enhancing the diastereoselectivity of the reaction (Fig. 3). Furthermore, the adduct formed from the Bi complex and ILs leads to miscibility of the catalyst in the ILs. The water generated is absorbed by the hydrophilic ILs, inducing stronger polarity of ILs that is beneficial for the facile separation process. With the consumption of reactants and the generation of apolar �,�-unsaturated ketones, facile separation of products from the polar solution occurs. In other words, the product can be transferred to the apolar organic phase directly and efficiently, breaking the equilibrium of cross-condensation reaction in a controlled manner.
Fig. 3 Interaction of catalyst 3 with [Bmim]BF4 in the catalyst system. (a) The upper layer contains reactants benzaldehyde, cyclohexanone, and propylamine while the lower layer ILs and catalyst 3. (b) Homogeneous mixture during reaction. (c) Heterogeneous mixture at completion of reaction; the upper layer is �,�-unsaturated ketones and unconsumed reactants while the lower layer ILs, catalyst 1, and water generated during reaction.
3. Conclusion We have developed a facile separation catalyst system
(composed of [Bmim]BF4 and air-stable organobismuth tetrafluoroborate 1) that is highly efficient (showing high catalytic activity, stereoselectivity, stability, and reusability) for the synthesis of (E)-�,�-unsaturated ketones from aldehydes and ketones through direct crossed-condensation.
4. Acknowledgement This work was financially supported by the NSFC (Grant
Nos. 20973056, 21003040, 20873038 and E50725825), and the 863 project (2009AA05Z319). Prof. C.-T. Au (adjunct professor of Hunan University) and Prof. W.-Y. Wong thank the Hong Kong Baptist University for a Faculty Research Grant (FRG/08-09/II-09). Prof. Yin thanks Dr. S. Shimada of AIST in Japan for helpful advice.
REFERRENCE
[1] S. Yin, J. Maruyama, T. Yamashita, S. Shimada, “Efficient fixation of
carbon dioxide by hypervalent organobismuth oxide, hydroxide, and alkoxide,” Angew. Chem. –Int. Ed., vol. 47, pp. 6590-6593, 2008
[2] S.-F. Yin, S. Shimada, “Synthesis and structure of bismuth compounds bearing a sulfur-bridged bis(phenolato) ligand and their catalytic application to the solvent-free synthesis of propylene carbonate from CO2 and propylene oxide,” Chem. Commun., pp. 1136-1138, 2009
[3] R. Qiu, Y. Qiu, S. Yin, X. Song, Z. Meng, X. Xu, X. Zhang, S. Luo, C.-T. Au, W.-Y. Wong, “Facile separation catalyst system: direct diastereoselective synthesis of (E)-�, �-unsaturated ketones catalyzed by an air-stable Lewis acidic/basic bifunctional organobismuth complex in ionic liquids,” Green Chem., vol. 12, pp.1767-1771, 2010.
[4] R. Qiu, Y. Qiu, S. Yin, S. Luo, C.-T. Au, W.-Y. Wong, S. Shimada, “Highly Efficient and Selective Synthesis of (E)-�, �-Unsaturated Ketones by Crossed Condensation of Ketones and Aldehydes Catalyzed by an Air-Stable Cationic Organobismuth Perfluorooctanesulfonate,” Adv. Synth. Catal., vol. 352, pp. 153-162, 2010
[5] R. Qiu, S. Yin, X. Song, Z. Meng, Y. Qiu, N. Tan, X. Xu, X. Zhang, S. Luo, F.-R. Dai, C.-T. Au, W.-Y. Wong, “Effect of butterfly-shaped sulfur-bridged ligand and counter anions on the catalytic activity and diastereoselectivity of organobismuth complexes,” Dalton Trans., vol. 40, pp. 9482-9489, 2011
[6] R. Qiu, S. Yin, X. Zhang, J. Xia, X. Xu, S. Luo, “Synthesis and structure of an air-stable cationic organobismuth complex and its use as a highly efficient catalyst for the direct diastereoselective Mannich reaction in water,” Chem. Commun., pp. 4759-4761, 2009
Copyright © 2012 SciRes. 145

Jet Plasma-Chemical Reactor For The Conversion Of Methane: The Use Of Clustering
A. E. Zarvin, N. G. Korobeishchikov, M. D. Khodakov, V. V. Kalyada Department of Applied Physics Novosibirsk State University
Novosibirsk, Russia [email protected]
Abstract— The research results of processes proceeding in supersonic jets of light hydrocarbons, activated by an electron beam are presented. It is shown, that condensation suppressed at activation by electrons in the initial stage of condensation. The developed condensation conditions mode leads to increasing of a part of heavy corpuscles in activated stream and not only owing to stimulation of condensation but because of formation of heavy hydrocarbonic molecules.
Keywords-Conversion of methane, GTL-production engineering, clusters, a supersonic jet, plasmachemical reactions, gas phase reactions, an electron beam, a gas discharge
1. IntroductionAssociated petroleum gas (a mixture of methane - more
than 70%, ethane, propane and butane) is traditionally burned during the oil production. Its processing is not provided in the existing technology of oil refining. As a result, approximately 10% of the hydrocarbons contained in the field, does not used in the economy only, but also contributes to further pollution of the earth's atmosphere.
Processing technology of volatile hydrocarbons exists for a long time. It’s primarily based on the use of catalysts in Fischer-Tropsch process, focused on the steady-state production, and remote oil fields is almost irrelevant. It should also be borne in mind that any large-tonnage commercial product should be exported, and the only available high-performance transport of liquid products from the field - an oil pipeline.
In this situation it is extremely attractive the development of the direct technology conversion method, bypassing the stage of synthesis gas, of natural and petroleum gas to heavy hydrocarbons, which is implemented on a compact high-performance device. The resulting liquid should be suitable for pipeline transport, ie its vapor pressure must not exceed 0.5 excess air. Such a formulation of the problem points directly to the usefulness of its solution methods and approaches based on plasma-chemical processes in the gas phase: the large interaction cross section of ionized and activated particles provide an extremely high rate of any collisional processes.
2. Plasma Chemical Technologies First of all, it was started investigation of the possibilities
for application of discharge plasma to initiate gas-phase reactions [1-4]. In the discharge can be easily obtained active particles that provide high-speed reactions. As a result, engineers have created several versions of devices to produce hydrogen from hydrocarbons using microwave discharge plasma torch, a combination of discharge with distributed finely dispersed catalyst [5], etc. In the 2000 method of conversion of hydrocarbons in a barrier discharge, where gas diffuses through the porous dielectric layer containing catalyst particles, was proposed [6]. A limitation of this method is the low rate of diffusion of gas as well as the need for high pressure. There are a large number of patents on the use of a glow, corona, streamer and other types of discharge, electric arc, plasma torch and so on [7-9]. However, no one has to initiate a one-step synthesis of heavy hydrocarbons on an industrial scale yet/
Using the discharge faces a number of difficulties associated with the influence of the electrodes, the background gas and the flow in a quiescent gas, or the reverse reactions in a subsonic flow, limiting the equilibrium concentration of the reaction products. These negative factors can be excluded if use the supersonic reagent jet to provide gas into reaction zone. Shock waves which are formed at the boundaries of the jet, are isolated the jet core from the influence of background gas. Freezing of the reverse reactions is provided by a sharp drop in density in a supersonic jet. It is much harder to get rid of the bad handling of the discharge, because its characteristics depend on the parameters of the gas in the area of activation, and to cope with the fact that a significant portion of the discharge of electrons is not involved in the activation process since energy of such elecnrons lie below the threshold for dissociation.
Thus, a technology conversion of light hydrocarbons in the gasoline fraction, based on plasma-chemical approach has not succeeded. The main reason, apparently, is the apparent "equilibrium" of processes in the flow of weakly ionized methane plasma. Activation of any kind of discharge leads to an increase of gas temperature in the flow, and heavy
Advances in Materials Physics and Chemistry Supplement: 2012 world Congress on Engineering and Technology
146 Copyright © 2012 SciRes.

hydrocarbons which are produced with the participation of radicals formed in the discharge, will inevitably disintegrate soon after birth. This pessimistic conclusion was confirmed with both numerous experiments and calculations.
3. Gas-Jet Plasma Chemictry The Institute of Thermophysics SB RAS has been patented
[10] the idea to activate the supersonic gas jet reagents with high-energy electron beam. Using electron beam led to the fact that the distribution function of electron energies significantly shifted towards higher energies compared with the discharge, i.e. at the same injected power significantly increased the proportion of electrons with energies above the dissociation threshold of the flow particles. Experiments [11-13] have shown that the proposed method provides an efficient generation of radicals that have been used to produce hydrogen from methane, and for the deposition of silicon from silane coatings. Thus the high efficiency of the method was proved where it’s enough to initiate rapid process of fragmentation reactions. However, attempts to use well-tried methods to the synthesis of heavy hydrocarbons did not give the expected result. Model calculations have also shown a low efficiency of this process: formed radicals are dying rapidly in binary reactions and increase the number of activating electrons leads not only to increase the number of radicals, but also stimulates the breakdown of already formed heavy molecules. Thus, to achieve this task it should be to found additional catalytic mechanisms that trigger the process of synthesis..
4. Experiments in Conditions of Condensation
It is well known that in a supersonic jet, due to a sharp drop of gas temperature downstream until the cryogenic temperature, the formation of clusters is possible. The forces that hold the molecules in the cluster can lead to changes tof activation and ionization hreshold energy of molecules in the cluster, and broaden the energy levels. A large retention time of particles in the cluster increases the probability of energy transfer. For example, in [14-15] have shown that when activated by an electron beam of supersonic jets of argon mixtures with methane, monosilane and other molecular additives highly efficient energy transfer effect occurs. This effect is detected at a certain stage and is due to the presence of condensation in the flow of mixed clusters. We seemed logical to evaluate the possibility of using clustered methane jets to increase the efficiency and controllability the plasma chemical jet synthesis of heavy hydrocarbons. Previously [16], we investigated the process of clustering in the absence of electronic activation. In this case was demonstrated the possibility of controlled formation of clusters, including mixed, with average sizes ranging from a few to thousands of atoms or molecules.
The activation of flow with clusters can cause the following processes:a) flow heating, consequently, decrease condensate fraction,
by reducing the concentration of clusters, and by decreasing their average size;
b) electron - stimulated condensation, in which the ionized particles becomes nuclei of clusters, so that the number of clusters and the fraction of condensate are increase;
c) electron stitching of molecules in the cluster, in which hydrogen atoms emitters due to the interaction with the electron beam with a cluster, and the remaining radicals are linked to the stable molecules of heavy hydrocarbons.
The research was performed using the LEMPUS experimental setup of Novosibirsk State University [16-17]. We used molecular beam mass spectrometry apparatus and activating electron gun. The working gas used natural gas composition: methane CH4 - 94.5%, ethane C2H6 - 4.2%, propane C3H8 – 1.1%, butane C4H10 - 0.2%, pentane C5H12 - 0.03%. The stagnation pressure P0 varying from 1 kPa to 103
kPa. For activating of gas jet the focused electron beam with diameter 1-3 mm and electron energy 3-5 keV was used. Electron beam crossed the supersonic jet perpendicular to its axis at distance 5-20 mm from nozzle.
It is know that in the mixture flows condensation began from admixture of easy-to-condensing components [14]. Ethane and heavier hydrocarbons condense much better than methane. Therefore the number of ethane molecules in the cluster, at least at the initial stage of condensation, can significantly exceed the number of methane molecules. Activation of the jet by electrons leads primarily to an earlier beginning of condensation, as well as a greater drop in gas density due to expansion of the flow due to thermal heating
Figure 1 shows the overview pulsed mass spectra recorded at a fixed pressure of 1000 kPa braking under normal conditions and with the activation. We see that the amplitude of the signal at mass peaks CHn when you turn on the electron beam is significantly reduced. However, the masses of the dimers (C2Hn) drop is not as great as in the case of monomers, and the amplitude on the mass m / e = 41 and m / e = 43 even grow.
Figure 1. Mass spectra of natute gas with and without elrctron beam activation.
Copyright © 2012 SciRes. 147

Condensation leads to release a stream of additional energy, resulting in the jet expands and the density at the axis decreases. In addition, the displacement of molecules from the jet axis by clusters also leads to a drop in the density of monomers, and the intensity of mass peaks of the monomers with increasing P0 even slightly reduced.
Thus, while the electron beam heats the gas, the formation of clusters in a supersonic flow occurs quite efficiently. Than larger the particle, than less effect on their quantity of activating electrons. We can assume that the electron energy is spent not on the collapse of large clusters, as, for example, for yhe formation of chemical bonds in the van der Waals particles.
The normalization of the intensities of mass peaks in the intensity of the peak m / e = 16 (Fig. 2) can reverse the effects associated with the fall of the density due to expansion of the flow, and more accurately determine the effect of activating the beam of electrons on the composition of the stream.
Found that the ratio of peak m / e = 15 and m / e = 16 when activated by electrons remains practically unchanged. Consequently, we can assume that the mass peak m / e = 15, i.e. CH3
+, is formed directly in the ionizer of the mass spectrometer for dissociative ionization of methane. The CH3radical is formed by electron gun activation of methane jet, dying in the course of the reactions directly in the gas stream and to the sensor of the mass spectrometer does not reach. Ionized components of the plasma flow, including the ion CH3
+, pass through a grounded conductive molecular beam skimmer system in small quantities, so the ability to contribute to the mass spectrometer signal from the ionized component of the flow is not considered.
Finally, the normalized relative intensities of mass peaks with ionization and without ionization Inorm = (I/I16)aeb / (I/I16)0,we obtain the "enrichment" - an amount reflecting the impact of activation on the intensity of the mass peak.
Figure 2. Dependence of the intensities of ion peaks from the stagnation pressure with electron activation (aeb) and without activation.
Figure 3. Dependence of the intensities of ion peaks from the stagnation pressure with electron activation (aeb) and without activation.
In Fig. 3 shows that the effect of activating the flow by electrons does not affect the relative intensity of the peaks CHn, however, leads to a significant change in the other masses. The increase in the proportion of free hydrogen (H, H2), as well as the relative share of the complexes C2Hn, C3Hn,possibly a consequence of the restructuring of weakly bound van der Waals bonds in the hydrocarbon chemistry in large complexes.
Analysis of the experimental data shows the following. At the initial stage of condensation the activation of the jet gas by electron beam stimulates the clustering at lower stagnation pressures. At the same time, apparently, the heating of the gas flow proceed, which leads to a drop in gas density in the axial region. At higher stagnation pressures, i.e. on advanced stage of condensation, the number of heavy particles increases. One can suggest that the observed effect at high stagnation pressures due to the synthesis of heavy particles from the flow of methane is activated by an electron beam.
Thus, the efficiency of ion-cluster interactions in supersonic flows of hydrocarbons opens up the possibility of their use in GTL technology.
5. ACKNOWLEDGMENTThe work is performed with the financial support of the
grant from the Russian government No. 11.G34.31.0046 for public support of scientific research under the guidance of leading scholars in Russian universities (leading scientist - K.Hanyalich, NSU) and by the Ministry of Education and Science of the Russia, project No. 1.22.05.
REFERENCES[1] Huang Jian, Suib S. L. Dimerization of Methane through
Microwave Plasmas // J. Phys. Chem., 1993. Vol. 97. P. 9403-9407. [2] Eliasson B., Kogelschatz U., Killer E. Hydrogenation of Carbon
Dioxide and Oxidation of Methane in an Electrical Discharge // Proc. 11th World Hydrogen Energy Conference, Stuttgart, Germany, 1996. P. 2449-2459.
[3] Fincke J.R., Anderson R.P., Hyde T.A.. Plasma Pyrolysis of Methane to Hydrogen and Carbon Black // Ind. Eng. Chem. Res., 2002. Vol. 41. P. 1425-1435.
148 Copyright © 2012 SciRes.

[4] Kozlov K.V., Michel P., Wagner H.-E. Synthesis of organic compounds from CH4-CO2 - mixtures in barrier discharges with different dielectric materials // 14th Internat. Symp. on Plasma Chemistry, 1999. Vol. IV. P. 1849-1854.
[5] Kazuhisa Murata, Yoji Ushijima. A method of hydrogen producing // Patent JP No. 2767390 on 06/18/1998.
[6] Eliasson Baldur, Zhang Kui, Kogelschatz Ulrich. Synthesis of hydrocarbon fuel using electric discharge // Patent EP No. 1038855 on 27/09/2000..
[7] Medvedev Yu.V., Remnev G.E., Smetanin V.I. The method of conversion of light hydrocarbons in the heavier // RF patent No. 2149884 on 01/06/1999.
[8] Sirotkina E.E., Kudryashev S.V., Ryabov A.Yu. A method of producing isomeric structure hydrocarbons // RF patent No. 2123992 on 27/12/1998.
[9] Czernichowski Piotr, Czernichowski Albin. Conversion of hydrocarbons using the moving electric arcs in the presence of water vapor and / or carbon dioxide // Patent FR No. 2758317 on 17/07/1998.
[10] Sharafutdinov R.G., Karsten V.M., Polisan A.A. The method of homogeneous and heterogeneous reactions with the use of plasma // RF Patent No. 2200058 on 10/03/2003.
[11] Sharafutdinov R.G., Karsten V.M., Khmel S.Ya. et al. Epitaxial silicon films deposited at high rates by gas-jet electron beam plasma CVD // Surface and Coatings Technology, 2003. Vol. 174 –175. P. 1178–1181.
[12] R. G. Sharafutdinov, A. E. Zarvin, V. Zh. Madirbaev, V. V. Gagachev, and G. G. Gartvich. Hydrogen production from methane in electron-beam-generated plasma // Technical Physics Letters. 2005. Vol. 31. No. 8. P. 641-643.
[13] V. A. Vinokurov, R. G. Sharafutdinov, Yu. I. Tychkov Plasma-chemical processing of natural gas // Chemistry and Technology of Fuels and Oils. 2005. Vol. 41. No. 2. P. 112-115.
[14] A. E. Zarvin, V. Zh. Madirbaev, N. G. Korobeishchikov, G. G. Gartvich, and R. G. Sharafutdinov. Effect of small methane and monosilane additives on clustering in pulse supersonic argon jets // Tech. Phys. 2005. Vol. 50. P. 1444-1450.
[15] V. Zh. Madirbaev, A. E. Zarvin. Ion-cluster excitation of atomic argon levels in molecular gas mixtures // Vestnik Novosibirsk State University. Series: Physics. 2007. Vol. 2. Issue 1. P. 36-43.
[16] N. G. Korobeishchikov, A. E. Zarvin, V. Zh. Madirbaev and R. G. Sharafutdinov. Condensation of argon, monosilane and their mixture in a pulse free jet // Plasma Chem. Plasma Proc. 2005. Vol. 25. P. 319-349.
[17] A. E. Zarvin, N. G. Korobeishchikov, V. V. Kalyada, V. Zh. Madirbaev. Formation of mixed clusters in a pulsed helium - oxygen - isoprene supersonic jet // Eur. Phys. J. D. 2008. Vol. 49. P. 101-110.
Copyright © 2012 SciRes. 149

Micromixing of a Two Phase System in a Stirred Tank with Multiple Impellers
Lei Yang, Jingcai Cheng*, Ping Fan, Chao Yang*
Key Laboratory of Green Process and Engineering, Institute of Process Engineering Chinese Academy of Sciences, Beijing 100190, China
* Corresponding authors. Tel.: +86 10 82544928; Fax: +86 10 82544928.
E-mail address: [email protected] (J.C. Cheng), [email protected] (C. Yang).
Abstract—The competitive iodide/iodate reaction scheme was used to ascertain the micromixing in the stirred solid-liquid systems. Two different glass beads from 450 to 1250�m were tested. The effect of solid particles on reaction selectivity with multiple impellers at different feed points has been investigated. It was confirmed that glass beads as a second phase were suitable for the study. The segregation index has changed significantly only for the medium-sized particles at relatively high solid holdups. The cloud formation was clearly observed for the medium-sized particles at a concentration of 12.12 wt. %. When feeding into the clear liquid above the cloud, the value of the segregation index increased significantly. However, in the presence of particles of 1-1.25 mm, the influence on the selectivity was negligible when the agitation speed was increased.
Keywords-micromixing; parallel reactions; two phases; multiple impellers
1. IntroductionMicromixing could have an effect on the selectivity, yield
and quality of the desired products in many industrial processes including precipitation, mineral processing, crystallization and biochemical processes. Poor micromixing may reduce the productivity of the desired products and also leads to higher purification costs. Therefore, many physical and chemical methods easy to be implemented have been developed to characterize micromixing. A large amount of work has been done to improve the micromixing in single-phase systems, while relatively little work has been conducted in the two-phase systems especially with multiple impellers [1, 2]. The dissipation rate of local energy determines the local micromixing. Techniques such as laser Doppler velocimetry (LDV) and particle image velocimetry (PIV) can be used to give reliable values of local energy dissipation in single-phase systems. However, it is much difficult for them to be applied to dense slurries which are commonly opaque. So more experiments need to be undertaken to provide data for multiphase systems. Furthermore, the models used by
computational fluid dynamics (CFD) like turbulence model are not so mature. The data are crucial for successful turbulence modelling of multi-phase systems especially for high solids concentration systems.
The influence of suspended solids on the selectivity of fast reactions has been investigated for a few years, but the results are a little contradictory. Villermaux et al. (1994) [1] used the iodide/iodate method to study the effect of suspended solids (0< dp < 40 �m) on the micromixing in stirred reactors. They found that the micromixing efficiency was enhanced by the presence of solids without significantly change in the power consumption. However, after Guichardon et al. (1995) [2] calculated the loss of iodine during filtration, the glass beads (20 �m < dp < 1300 �m) had a negligible effect on micromixing up to 5 wt. %. According to Barresi (1997) [3], significant changes in selectivity were observed only at relatively high particle loadings (>10 vol. % for the glass spheres (dp = 100-177 �m and 425-500 �m) and the selectivity was not affected with larger cylindrical PET beads (equivalent diameter = 3 mm). In 1999, Brilman et al. [4] investigated the effect of particles (70-700 �m) on product distribution using the diazo-coupling reaction. They found that the segregation index increased while the holdup was enhanced except the particles of 290�m. Barresi (2000) [5] reported the effect of particles on reaction selectivity and related it to the changes in the power input and hydrodynamics of the suspension. With the Rushton turbine, a lower selectivity was observed in the slurry. On the contrary, selectivities were higher in the slurry than those in the single phase when the pitched blade was used. Recently, micromixing was unaffected near the impeller and near the surface with glass beads of 500 �m at concentrations up to 2.5wt. % by Hofinger et al. [6]. Cloud formation was observed, and when feeding into the clear liquid above the cloud, the segregation index increased significantly.
From the literature review above, it can be concluded that there still exists disagreement between researchers on the effect of solid particles. The aim of this paper is to investigate the effect of solid particles on micromixing and give data on mean
Advances in Materials Physics and Chemistry Supplement: 2012 world Congress on Engineering and Technology
150 Copyright © 2012 SciRes.

energy dissipation with multiple stirrers in the solid-liquid systems.
2. Experimental Set-Up and Methods A. Experimental setup and agitation condition
Experiments have been carried out at room temperature in a cylindrical Perspex vessel (diameter, T = 0.384 m) with a dished bottom. A schematic of the experimental setup is given in Fig. 1. The tank is equipped with four baffles of width T/10 perpendicularly. In this work, a Rushton turbine (blade: height 21 mm, width 32 mm, thickness 1 mm) and a 45o down pumping 6-blade pitched blade turbine (blade: height 25 mm, width 47mm, thickness 1 mm), all of which have a diameter D= T/3, were used. In order to avoid surface aeration, H/T is 1.6. The impeller off-bottom clearance is T/3. The power drawn by the impeller was determined via the torque from a strain gauge attached to the shaft. A steel pipe with an inner diameter of 2 mm was used at each position. The geometrical details of the feed pipe tip are given in Table 1. Different sizes of glass beads were tested:
(1) medium size: dp = 600-425 �m (�s = 2.431 g/L);
(2) large size dp =1.25 mm > d >1 mm (�s = 2. 431 g/L).
Figure 1. Schematic of the tank and feed points.
TABLE I. GEOMETRICAL DETAILS OF THE FEED PIPE TIP
Geometrical details Feedposition Position <1> Position <2> Position <3>2r/D z/H
2.2
0.21 2.2 0.31
2.2 0.84
B. Chemical test reaction Micromixing experiments were carried out in the semi-
batch mode using the reaction developed by Fournier et al. [7]. According to the following steps:
33+-
32 BOH H + BOH
I 3 H 6 + IO +I 5 2+-
3-
-3
-2 I I + I
(i)
(ii)
(iii)
OH 3 + 2
The equilibrium constant KB of iii is well known as a function of the temperature. [8]
TTKB 1010 2.575log - 7.355 +555/ =log , KB in M-1 (1)
The experiment procedure consists of injecting 0.03 L of sulphuric acid ([H+] = 1.0 M) to the solution containing iodide, iodate and borate ions, whose concentrations follow that of Guichardon and Falk [9]. It has been confirmed that XQ, the selectivity of iodine formation, whose value lies between 0 and 1, is a measurement of micromixing efficiency. XQ is defined as: XQ = Y/YST, where,
2 3
0
I I tank 2 3
injection 0H
2( + ) 2 ([I ]+[I ]) =[H ]
n n VYn V
-
+
-
+= (2)
and
3 0ST
3 0 2 3 0
6[IO ]6[IO ] [H BO ]
Y-
- -=+
(3)
Based on mass balances on iodine atoms, the following expression is produced:
][I - ) ][I + ][I 5/3( -][I =][I -3
-32 0
-- (4)
The value of XQ is calculated by combining (1) and (4).
3. Results and Discussion C. Determination of molar extinction coefficient
The molar extinction coefficient, �, of triiodide ion was determined by measuring the optical density of the solutions containing potassium iodide and iodine with a ratio of 2:1. The results are depicted in Fig. 2. In this paper, the analysis was conducted at 353 nm with a single beam where the interference with iodide ion and solvent absorption could be reduced. At 353 nm, we found that � was 2624 mol-1m2, which is in good agreement with the literature [7, 10].
0.00 0.01 0.02 0.03 0.040.0
0.4
0.8
1.2
D
Figure 2. The molar extinction coefficient
Identify applicable sponsor/s here. (sponsors)
Copyright © 2012 SciRes. 151
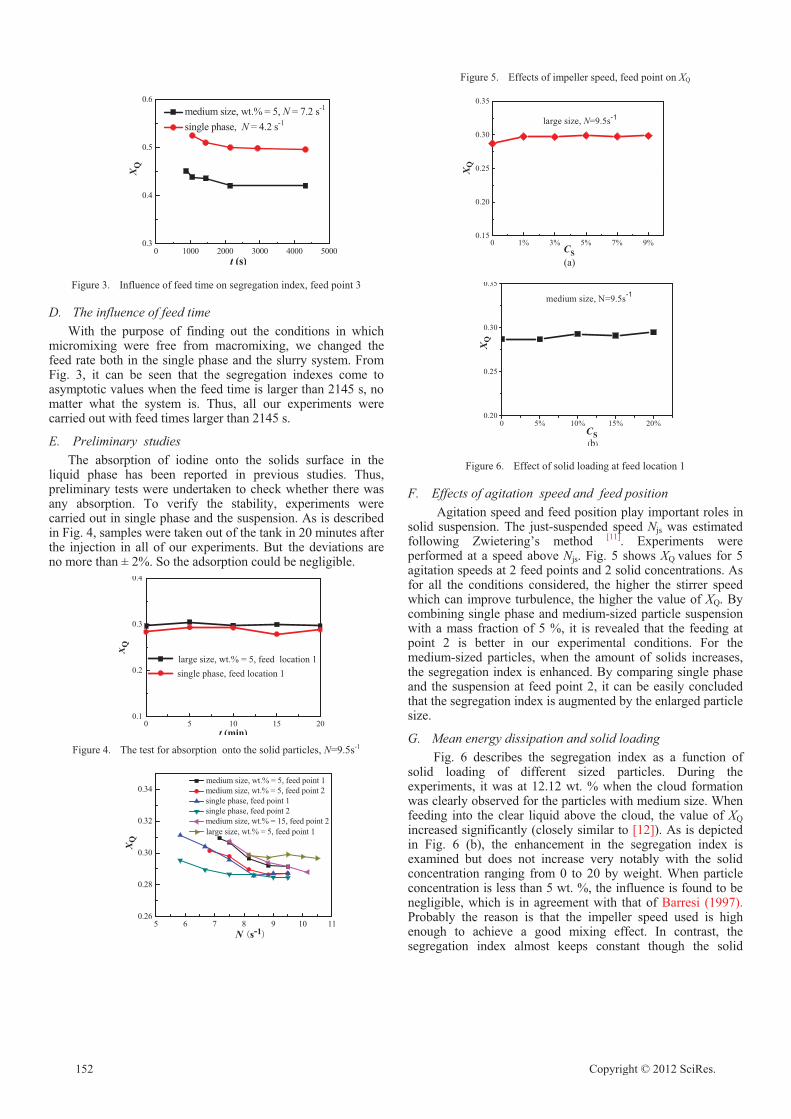
0 1000 2000 3000 4000 50000.3
0.4
0.5
0.6
XQ
t (s)
medium size, wt.% = 5, N = 7.2 s-1
single phase, N = 4.2 s-1
Figure 3. Influence of feed time on segregation index, feed point 3
D. The influence of feed time With the purpose of finding out the conditions in which
micromixing were free from macromixing, we changed the feed rate both in the single phase and the slurry system. From Fig. 3, it can be seen that the segregation indexes come to asymptotic values when the feed time is larger than 2145 s, no matter what the system is. Thus, all our experiments were carried out with feed times larger than 2145 s.
E. Preliminary studies The absorption of iodine onto the solids surface in the
liquid phase has been reported in previous studies. Thus, preliminary tests were undertaken to check whether there was any absorption. To verify the stability, experiments were carried out in single phase and the suspension. As is described in Fig. 4, samples were taken out of the tank in 20 minutes after the injection in all of our experiments. But the deviations are no more than ± 2%. So the adsorption could be negligible.
0 5 10 15 200.1
0.2
0.3
0.4
XQ
t (min)
large size, wt.% = 5, feed location 1 single phase, feed location 1
Figure 4. The test for absorption onto the solid particles, N=9.5s-1
5 6 7 8 9 100.26
0.28
0.30
0.32
0.34
Figure 5. Effects of impeller speed, feed point on XQ
0 1% 3% 5% 7% 9%0.15
0.20
0.25
0.30
0.35
XQ
CS(a)
large size, N=9.5s-1
0 5% 10% 15% 20%0.20
0.25
0.30
0.35
XQ
CS(b)
medium size, N=9.5s-1
Figure 6. Effect of solid loading at feed location 1
F. Effects of agitation speed and feed position Agitation speed and feed position play important roles in
solid suspension. The just-suspended speed Njs was estimated following Zwietering’s method [11]. Experiments were performed at a speed above Njs. Fig. 5 shows XQ values for 5 agitation speeds at 2 feed points and 2 solid concentrations. As for all the conditions considered, the higher the stirrer speed which can improve turbulence, the higher the value of XQ. By combining single phase and medium-sized particle suspension with a mass fraction of 5 %, it is revealed that the feeding at point 2 is better in our experimental conditions. For the medium-sized particles, when the amount of solids increases, the segregation index is enhanced. By comparing single phase and the suspension at feed point 2, it can be easily concluded that the segregation index is augmented by the enlarged particle size.
G. Mean energy dissipation and solid loading Fig. 6 describes the segregation index as a function of
solid loading of different sized particles. During the experiments, it was at 12.12 wt. % when the cloud formation was clearly observed for the particles with medium size. When feeding into the clear liquid above the cloud, the value of XQ increased significantly (closely similar to [12]). As is depicted in Fig. 6 (b), the enhancement in the segregation index is examined but does not increase very notably with the solid concentration ranging from 0 to 20 by weight. When particle concentration is less than 5 wt. %, the influence is found to be negligible, which is in agreement with that of Barresi (1997). Probably the reason is that the impeller speed used is high enough to achieve a good mixing effect. In contrast, the segregation index almost keeps constant though the solid
11
XQ
N s-1
medium size, wt.% = 5, feed point 1 medium size, wt.% = 5, feed point 2 single phase, feed point 1 single phase, feed point 2 medium size, wt.% = 15, feed point 2large size, wt.% = 5, feed point 1
152 Copyright © 2012 SciRes.

loading is improved for the large-sized system (Fig. 6 (a)). The results of this study are in accordance with those presented by Guichardon et al. (1995), who found a negligible influence of solid particles (�s = 2500kg/m3, dp =1250 �m) on the segregation index.
As is well-recognised, the power input in a stirred tank is mostly consumed in the impeller region and especially in the discharge stream. Considering our experimental results, mean energy dissipation was decreased while the particle size increased at the same holdup. This phenomenon has been explained by many researchers [13-15]. As suggested by Brilman et al. (1999), the increase of segregation index may be caused by: (1) more energy was dissipated in particle-particle collisions and particle-wall collisions; (2) the amount of stagnant liquid moving with the particles was increased. Fig. 7 describes the correlation between the mean energy dissipation and the segregation index. At higher particle sizes, there is an increase in segregation index due to more energy distributed to the particles. The results accord with those of Barresi (2000) and Brilman et al. (1999).
0.5 1.0 1.5 2.0 2.5 3.0 3.50.26
0.28
0.30
0.32
XQ
average energy dissipation (W/kg)
single qhase, feed point 2medium size, wt.% = 5, feed point 1
large size, wt.% = 5 feed point 1
Figure 7. Comparison of mean specific energy dissipations
4. ConclusionsThe effect of solid particles on reaction selectivity in a
dished-bottom stirred tank with multiple impellers at different feed points has been investigated. It has been confirmed that glass beads as a second phase were suitable for the study. Large changes in the segregation index were obtained only for the medium-sized particles at relatively high solid holdups. During the experiments, the cloud formation was clearly observed for the medium-sized particles at the hold of 12.12 wt. %. When feeding into the clear liquid above the cloud, the value of XQ increased significantly and was up to 0.56. In the presence of the glass particles of 1-1.25 mm, the influence on the selectivity was negligible though the solid concentration was enhanced when feeding at the tip of the pitched blade turbine.
From our experimental results, it can be concluded that the segregation index improved but not apparently in the feed points studied when the agitation speeds increased. In order to reduce the selectivity towards undesired product, it is indispensable to improve the mixing, such as by increasing the circulation. However, it may consume more power. As suggested by Bourne and Hilber [16], an alternative could be the use of multiple feeds. Further work has been intended to find
out the maximum energy dissipation rate of the pitched blade turbine and then carry out multiple feeds.
5. Acknowledgment The authors acknowledge the financial support from
the 973 Program (2012CB224806), the National Natural Science Fund for Distinguished Young Scholars (21025627), the National Natural Science Foundation of China (21106154, 20990224), 863 Project (2012AA061503), Beijing Natural Science Foundation (2112038) and Jiangsu Province Project (BY2009133).
REFERENCES[1] J. Villermaux, L. Falk, and M. C. Founier “Potential use of a new
parallel reaction system to characterize micromixing in stirred reactors,” AIChE Symp. Ser., vol. 90, pp. 50-54, 1994.
[2] P. Guichardon, L. Falk, M. C. Founier, and J. Villermaux, “Study of micromixing in a liquid-solid suspension in a stirred tank,” AIChE Symp. Ser., vol. 91, pp. 123-130, 1995.
[3] A. A. Barresi, “Experimental investigation of interation between turbulent liquid flow and solid particles and its effects on fast reactions,” Chem.Eng. Sci., vol. 52, pp. 807-814, 1997.
[4] D. W. F. Brilman, R. Antink, W. P. M. van Swaaij, and G. F. Versteeg “Experimental study of the effect of bubbles, drops and particles on the product distribution for a mixing sensitive, parallel-consecutive reaction system,” Chem. Eng. Sci., vol. 54, pp. 2325 2337, 1999.
[5] A. A. Barresi, “Selectivity of mixing-sensitive reactions in slurry systems,” Chem.Eng. Sci., vol. 55, pp. 1929-1933, 2000.
[6] J. Hofinger, R. W. Shape, W. Bujalski, S. Bakalis, M. Assirelli, A. Eaglesham, and A. W. Nienow, “Micromixing in two-phase G-L and S-L systems in a stirred vessel,” Can. J. Chem. Eng., vol. 89, pp. 1 11, 2011.
[7] M. C. Fournier, L. Falk, and J. Villermaux, “A new parallel competing reaction system for assessing micromixing efficiency Experimental approach,” Chem.Eng. Sci., vol. 51, pp. 5053-5064, 1996.
[8] D. A. Palmer, R. W. Ramette, and R. E. Mesmer, “Triiodide ion formation equilibrium and activity coefficients in aqueous solution,” J. Solution Chem., vol. 13, pp. 673-683, 1984.
[9] P. Guichardon and L. Falk, “Characterisation of micromixing efficiency by the iodide-iodate reaction system. Part I: experimental procedure,” Chem. Eng. Sci.,vol. 55, pp. 4233 4243, 2000.
[10] Awtrey and Connick, “The absorption spectra of 2I , -3I , -
3IO , , -2
32OS . Heat of the Reaction -3I = 2I + -I ,” J. Am. Chem. Soc, vol.
73, pp. 1844-1843, 1951.
-262OS
[11] Zwietering, Th. N, “Suspension of Solid Particles in Liquid by Agitators,” Chem. Eng. Sci., vol. 8, pp. 244-253, 1958.
[12] M. Assirelli, W. Bujalski, A. Eaglesham, and A. W. Nienow, “Study of micromixing in a stirred tank using a Rushton Turbine: Comparison of feed positions and other mixing devices,” Chem. Eng. Res. Des., vol. 80, pp. 855 863, 2002.
[13] Yu. A. Buyevich, “Fluid dynamics of coarse dispersions,” Chem. Eng. Sci. vol. 49, pp. 1217-1228, 1994.
[14] J. O. Hinze, “Turbulent fluid and particle interaction,” In Proceedings of the International Symposium Two-Phase Systems, eds G. Hetsroni, S. Sideman and J. P. Hartnett Prog, Heat Mass Transfer, vol. 6, pp. 433-452. Pergamon Press, Oxford, 1972.
[15] S. Elgobashi, “On predicting particle-laden turbulent flows,” Appl. Sci. Res., vol. 52, pp. 309-329, 1994.
[16] J. R. Bourne and C. P. Hilber, “The productivity of micromixing controlled reactions: effect of feed distribution in stirred tanks,” Chem. Eng. Res. Des. vol. 68A, pp. 51-56, 1990.
Copyright © 2012 SciRes. 153

Aqueous Two Phase Extraction for the Recovery of 1,3-Propanediol from its Aqueous Solutions
Min Hee Chung1, Yeon Ki Hong1*1Department of Chemical and Biological Engineering
Korea National University of Transportation Chungju, Chungbuk 380-702 Korea
Hyoung Wook Lee2*, Sung-Jun Park3*2Department of Energy System Engineering
3Department of Mechanical Engineering Korea National University of Transportation
Chungju, Chungbuk 380-702 Korea [email protected]@ut.ac.kr
Abstract—As the biodiesel production is rapidly enhanced, the crude glycerol, which is by-product of biodiesel processes, is state of surplus. 1,3-PDO (1,3-propanediol), a valuable monomer of poly(trimethylene terephthalate) (PTT), can be produced from the fermentation process using crude glycerin as a carbon source. For the economic biological production of 1,3-PDO, the low cost and high efficient separation processes is essential. In this study, aqueous two-phase system composed of various hydrophilic alcohols and salt was used as a primary separation step for 1,3-PDO. It was found that the aqueous two-phase systems are easily formed with decreasing of the polarity of alcohols. The extraction efficiency is proportional to the polarity of alcohols. In case of methanol or ethanol/K2HPO4, the extraction efficiency was more than 90%. It was concluded that the aqueous two-phase extraction using methanol or ethanol/K2HPO4 can be applied for the primary separation of 1,3-PDO as an alternative to a conventional primary separation processes.
Keywords-1,3-propanediol; alcohols; phase separation; extraction efficiency
1. IntroductionOver the last decade, biodiesel has emerged as an
alternative fuel of fossil diesel. However, the production of biodiesel is not profitable without government subsidies due to its high production cost. For the economic production of biodiesel, finding new applications of glycerol which is a by-product from biodiesel production is important. Generally, for every 9 kg of biodiesel produced, 1 kg of a crude glycerol by-product is produced. There is a large amount of crude glycerol on the market available for very low price due to the rapid increase of biodiesel production [1. 2].
Glycerol can be used as a carbon source for the fermentative production of 1,3-PDO (1,3-propanediol) which is a monomer of PTT(Poly(trimethyleneterephthalate). PTT is a polyester with superior stretching and stretch recovery characteristics and has various usage for textile, carpets and upholstery manufacturing [3].
Figure 1. PTT synthesis from 1,3-PDO.
Before two decades, 1,3-PDO had been produced by hydration of acrolein or hydroformylation of ethylene oxide. In early 2003, DuPont developed a commercial biological process for 1,3-PDO based on the fermentation of glucose. Such a bio-based PDO made a petroleum-based PTT to be bioplastic. In spite of energy saving of glucose based fermentation by DuPont, the cost of 1,3-PDO has been still high and its price can depend on the price of glucose [4]. The low price of glycerol due to the rapid increasing of biodiesel production makes its usage of a promising alternative carbon source be possible.
A biological production of 1,3-PDO has several advantages compared with the conventional chemical production because of low cost and more eco-friendly process. 1,3-PDO had been synthesized by various microbes such as Klebsiella pneumonia, Clostridium butyricum and Citrobactor freundii [5-7]. It was reported that the final concentration of 1,3-PDO in fermentation broth was low, ranging from 30 to 130 g/L. In addition, the fermentation broth contains a mixture of 1,3-PDO, 2,3-butanediol, glycerol, lactate, acetate, succinate and other impurities which make the downstream processing of 1,3-PDO fermentation broth be difficult [8].
*Authors to whom correspondence should be addressed
Advances in Materials Physics and Chemistry Supplement: 2012 world Congress on Engineering and Technology
154 Copyright © 2012 SciRes.

The downstream processes of biologically produced 1,3-PDO includes three main steps. In the first step, microbial cells are removed by using flocculation, filtration, and centrifugation. The second step contains the primary recovery processes for the removal of impurities such as acid salts and ethanol and the evaporation of water. In this step, evaporation, solvent extraction, precipitation, electrodialysis and chromatography processes can be used. In the last step, the final purification of 1,3-PDO is carried out by vacuum distillation process [9]. Among these steps, the most important step is primary separation step which requires a large amount of energy for the removal of water from fermentation broth. Furthermore, the removal of acid salts from broth is not easy. For the cost effective biological production of 1,3-PDO, a low energy required separation processes with a high efficiency is essential.
For the economic removal of impurities, several processes as the primary separation step have been suggested. Broekhuis et al proposed reactive extraction by formaldehyde or acetaldehyde where 1,3-PDO was converted into a compound without hydroxyl groups and then recovered it by solvent extraction [10]. Hao et al used propionaldehyde, butylaldehyde and isobutylaldehyde as extractants for the recovery of 1,3-PDO [11]. However, the organic salts that are formed during fermentation would decline the recovery efficiency. In some cases, electrodialysis was used for the removal of organic acids salts but low product yield, membrane pollution, and high maintenance cost make this process undesirable. Recently, Hong reports that the amine-based extraction process is effective for the removal of acid salts from 1,3-PDO aqueous solutions [8].
Aqueous liquid-liquid two-phase systems are formed when two polymers or polymer/salt are dissolved together above certain concentration. The general characteristic feature of these systems is that both phases are aqueous, allowing partition of target molecules. In case of polymer/polymer or polymer/salt systems, it is difficult to use in a commercial scale due to their high cost. Therefore, for the bulk chemical such as 1,3-PDO, the cheap aqueous two-phase systems are essential.
In this study, aqueous two-phase systems composed of alcohol solvents and inorganic salts was used for the extraction of 1,3-PDO from its artificial aqueous solutions. The phase separation of two-phases containing alcohols/salt and the effect of concentration of 1,3-PDO and solvent on separation yield was investigated.
2. Materials and Methods A. Materials and reagents
1,3-PDO (Aldrich, 99.9%) were used as received to prepare its aqueous solutions. The concentrations of 1,3-PDO ranged from 50 g/L to 100 g/L. These concentrations were based on the concentration of practical fermentation broth produced by K. Pneumoniae. Hydrophilic alcohols such as methanol (Aldrich 99.9%), ethanol (Aldrich 99.9%) and isopropanol
(Aldrich 99.9%) were also used as received without any further purification. The salt used in this study was K2HPO4.
B. Experimental Procedure For the investigation of effect of 1,3-PDO concentration, 2
g of K2HPO4 and 10 ml of alcohol were added to the 10 ml of 1,3-PDO aqueous solution. After stirred for 2 min, the mixtures were held for 10h at room temperature.
For the study of effect of solvent amounts, the specific concentration of 1,3-PDO aqueous solution and 2g of K2HPO4were added to alcohols with various volumes.
The concentration of 1,3-PDO in the top and bottom phases were measured by gas chromatography.
3. Results and Discussion C. Phase Diagram
Phase diagram data are essential for the selection of optimized two-phase systems. The phase diagram was prepared by a turbidimetric titration method [12]. The concentrations of alcohols and K2HPO4 were calculated by the following equations.
321
111 mmm
mmmw
t �� (1)
321
222 mmm
mmmw
t �� (2)
where , and are the amount of alcohols,
K2HPO4, and water, respectively. and are the mass fraction of alcohol and K2HPO4.
1m 2m 3m
1w 2w
w2(salt)
0.00 0.05 0.10 0.15 0.20 0.25 0.30 0.35 0.40
w1(
solve
nt)
0.0
0.1
0.2
0.3
0.4
0.5
0.6
w2(salt) vs w1(MeOH) w2(salt) vs w1(EtOH) w2(salt) vs w1(BuOH) w2(salt) vs w1(IPA)
Figure 2. Phase diagram of alcohols/salt aqueous two-phase systems.
Copyright © 2012 SciRes. 155

The bimodal curves determined at room temperature for the alcohols/K2HPO4 systems were shown in Fig. 2. These bimodal curves provide information about the concentrations of phase which are able to form a aqueous two-phase. Fig. 2 shows that aqueous two-phase systems can be formed by adding appropriate amount of K2HPO4 to aqueous alcohol solutions. It is found that the ability of the alcohols for phase separation follows the order: isopropanol>ethanol>methanol, which is in accordance with the order of polarity of the alcohols. From Fig. 2, isopropanol has the best phase-forming abilities among hydrophilic alcohols used in this study. And Fig.2 shows that the ability of the alcohols for phase separation increased with the weight fraction of K2HPO4. The anion HPO4
2- that strongly interacts with water molecules enable to form aqueous two-phase.
Initial concentration of 1,3-PDO (g/L)
0 20 40 60 80 100
Y(%
)
0
20
40
60
80
100
IPA
BuOH
EtOH
MeOH
Figure 3. Effect of 1,3-PDO concentration on extraction efficiency in an aqueous two-phase systems composed of Alcohols/K2HPO4.
In this study, partition coefficients of 1,3-PDO between two phases are as follows:
b
t
CC
K (3)
where and are equilibrium concentrations of 1,3-PDO in top phase and bottom phase, respectively. Extraction efficiency of 1,3-PDO can be calculated as follows:
tC bC
bbtt
tt
VCVCVC
Y�
(4)
where and are volume of each phase. tV bV
Fig. 3 shows the effect of 1,3-PDO concentration on extraction efficiency in aqueous two-phase systems composed of various alcohols and K2HPO4. The extraction efficiency does not depend on the 1,3-PDO concentration. However, the extraction efficiency increased with the polarity of alcohols. It can be presumed that the solubility of alcohols for 1,3-PDO and the hydrogen bonding between alcohols and 1,3-PDO are
proportional to their polarities. Because 1-butanol is hydrophobic, its extraction efficiency is low compared to other hydrophilic alcohols. Considering the economics of 1,3-PDO separation processes, it is found that the only single extraction step is applicable to the primary separation of 1,3-PDO by using more than 50 %(w/w) of methanol or ethanol. In case of isopropanol, multiple or continuous extraction is required.
Weight fraction of alcohols (w/w)
0.0 0.2 0.4 0.6
Y (%
)
0
20
40
60
80
100
IPABuOH
EtOHMeOH
Figure 4. Effect of weight fraction of various alcohols on extraction efficiency in an aqueous two-phase systems composed alcohols/K2HPO4.
4. ConclusionsIn this study, the extraction of 1,3-PDO in hydrophilic
alcohols/K2HPO4 was demonstrated to be effective. It is found that the aqueous two phases are easily formed with decreasing of the polarity of alcohols. However, the extraction efficiency is proportional to the polarity of alcohols. It can be concluded that methanol or ethanol is suitable for the extraction of 1,3-PDO by using aqueous two-phase. Considering the toxicity of solvents, ethanol is more suitable than methanol. Compared with other primary separation processes such as evaporation, electrodialysis and conventional solvent extraction, aqueous two-phase extraction has the advantages of low energy cost, quick phase separation and high extraction efficiency for 1,3-PDO.
5. Acknowledgment This research was supported by a grant from the Academic
Research Program of Korea National University of Transportation in 2012. (Hyoung Wook Lee)
REFERENCES
156 Copyright © 2012 SciRes.

[1] M. A. Dasari, P. P. Kiatsimkul, W. R. Sutterlin and G. J. Suppes, “Low-pressure hydrogenolysis of glycerol to propylene glycol,” Applied Catalysis A: General, vol. 281, pp. 225-231, 2005.
[2] M. Pagliaro, R. Ciriminna, H. Kimura, M. Rossi and C D. Pina, “From glycerol to value-added products,” Angew. Chem. Int. Ed., vol. 46, pp. 4434-4440, 2007.
[3] R. K. Saxena, P. Anand, S. Saran and J. Isar, “Microbial production of 1,3-propanediol: Recent developments and emerging opportunities,” Biotech. Adv., vol. 27, pp. 895-913, 2009.
[4] Y. K. Hong, “Separation processes of biologically produced 1,3-propanediol,” Korean Chem. Eng. Res., in press.
[5] A. P. Zeng and H. Biebl, “Bulk chemicals from biotechnology: The case of 1,3-propanediol production and the new trends,” Adv. Biochem. Eng. Biotechnol., vol. 74, 00. 239-259, 2002.
[6] C. Raynaud, P. Sarcabal, I. Meynial-Sallas and C. Croux, “Molecular characterzation of the 1,3-propanediol operon of Clostridium butyricum,” Proc. Natl. Acad. Sci. USA, vol. 100, pp. 5010-5015, 2003.
[7] T. Homann, C. Tag, H. Biebl and W. Deckwer, “Fermentation of glycerol to 1,3-propanediol by Klebsiella and Citrobacter strains,” Appl. Microbiol. Biotechnol., vol. 33, pp. 121-126, 1990.
[8] Y. K. Hong, “Purification of 1,3-propanediol for production of polytrimethylene terephthalate(PTT) from biomass,” Adv. Mater. Res., vol. 320, pp. 191-195, 2011.
[9] Z.-L. Xiu and A.-P. Zeng, “Present state and perspective of downstream processing of biologically produced 1,3-propanediol and 2,3-butanediol,” Appl. Microbiol. Biotechnol., vol. 78, pp. 917-926, 2008.
[10] R. R. Broekhuis, S. Lynn and C. J. King, “Recovery of propylene glycol from dilute aqueous solutions via reversible reaction with aldehydes,” Ind. Eng. Chem. Res., vol. 33, pp. 3230-3237, 1994.
[11] J. Hao, H. J. Liu and D. H. Liu, “Novel route of reactive extraction to recover 1,3-propanediol from a dilute aqueous solution,” Ind. Eng. Chem. Res., vol. 44, pp. 4380-4385, 2005.
Copyright © 2012 SciRes. 157

Research on Supercritical Methanol Treatment of LigniteLuan Haiyan
1.Dept. of Chemical Engineering Tsinghua University
Beijing, China 2. Research Institute of Tsinghua University in
Shenzhen Shenzhen, China
Wang Aiguo, Zhang Qian, Chen Fuming 1.Shenzhen Key Lab of Separation Technology 2.Research Institute of Tsinghua University in
Shenzhen Shenzhen, China
Abstract—China has rich lignite reserves which are the proper resources to be liquefied. As its low coalification degree, much hydrogen is wasted. Solvent extraction can save hydrogen and improve its liquefaction performance. The paper studies supercritical methanol treatment of lignite with a device at high temperature and pressure. Experiments mainly focus on the effects of temperature, pressure, catalysts and pretreatment ways on the extraction rate. Results indicate that the extraction rate increases with raising of temperature and pressure below 330 ,10 MPa. When temperature exceeds 330 , extraction rate decreases slightly. After swelling pretreatment in methanol for 8 h, the lignite is treated for 60 min at 330 8.2 MPa with NaOH as catalyst(1%wt). The weight ratio of methanol/ Xilinhaote lignite is 5/1. Under these conditions, the extraction rate can reach 22.88%.
Keywords-lignite, supercritical methanol treatment, extraction rate
1. IntroductionLignite reserves cover 13% of all the coal reserves in
China. As its rich reserves and fine liquefaction behavior, lignite becomes high-quality resource to be liquefied. But expensive hydrogen is wasted because water is formed during liquefaction process[1,2]. To treat lignite before liquefaction can help save hydrogen, improve the reactivity of lignite and increase oil yield during liquefaction[3]. Therefore, the pretreatment is of an important significance for its comprehensive utilization.
Solvent extraction of coal is a hot topic because it can study coal structure and get small molecule compounds. Li et al[4] did researches on the relationship of the extraction rate of ash-free coal and extraction temperature in NMP. Hu et al[5]
extracted coal with water under its supercritical and subcritical state. They found that temperature and pressure were important factors which influence the extraction results. High temperature and pressure improve solvent diffusion speed and dissolving power as well exacerbate the resolvability of lignite. Yunus et al[6] studied the extraction performance of about 20 kinds of solvents with Soxhlet extraction. The extraction rate
has a close relation with solvent polarity. It shows a higher extraction rate in polar solvents than in nonpolar solvents.
Coal structure and operation conditions are the key to extraction results. Coal is made up of condensation aromatic rings as basic framework and side chains. Basic units are connected with ether bonds and methylene bonds. Side chains include alkyls and other functional groups. There is strong acting force between coal molecules such as interionic force, hydrogen bonds and Van der Waals force[7]. Pretreatment should weaken the acting force between coal molecules and dissolve the extracts[8]. Besides coal structure and solvent properties, factors which influence the speed during mass transfer process include permeation and diffusion [9].Treatment include two parts. Solvent molecules permeate into coal micro pore structure and then soluble substance spreads outside.
Fluids under supercritical conditions are easier to enter coal molecules and can solve soluble substance better. So the paper adopts supercritical methanol to pretreat lignite. Carbon emission reduces because less CO and CO2 is produced. Experiments aim at the extraction rate and study the effects of temperature, pressure, catalyst and pretreatment ways on the extraction rate. Optimized technologies lay the foundation for coal liquefaction.
2. Experiments A. Instruments and Reagents
Main instruments: Sartorius BS2109 electronic scale; RE2000E Rotary Evaporator; FYXD2-20/400 autoclave (Tmax=450,Pmax=20MPa,V=2L); ZDXS3-5-1200 muffle.
Reagents: methanol, tetrahydrofuran, NaOH, H2SO4. All the reagents are analytically pure.
B. Lignite Sample The coal sample is Xilinhaote lignite from Inner Mongolia.
The sample has been grinded and sifted(200 mesh). Proximate and ultimate analysis of the sample is shown in table .
TABLE I . PROXIMATE AND ULTIMATE ANALYSIS OF XILINHAOTE LIGNITE SAMPLE(WT%)
Proximate analysis Ultimate analysis, daf
High-tech Zones Development Guidance Special of Guangdong Province——Key Problems Tackling and Industrialization Type g(2010A011300038)
Advances in Materials Physics and Chemistry Supplement: 2012 world Congress on Engineering and Technology
158 Copyright © 2012 SciRes.

Mad Aad Vdaf C H O* N S9.95 10.21 47.49 65.87 5.13 27.37 1.07 0.56
* by difference
C. Experiment Methods Mix 200 g coal sample, certain methanol and 2 g catalyst
into slurry. After swelling for 8 hours, put it into the autoclave. Heat the mixture at rate of 5 /min and stir it at rate of 200 r/min. Pressure is controlled by the intrant volume of methanol. Treat at a constant temperature for a certain time. Turn on the tap to cold down the system. When the temperature is below 70 ,take out all the material in the autoclave. Separate the solid and liquid after treatment using vacuum suction filtration. Filter residue is washed three times by methanol and tetrahydrofuran. When it is dried, test its ash content and calculate the extraction rate.
D. Analysis Methods Define the mass of dry solid before and after treatment as
M1, M2, ash content as A1,A2, extraction rate as E. Suppose the weight of ash will not change during the treatment process, so:
(1) 2211 AMAM ( (� � �
� ��
11
2211
111
AMAMAME
����
(2)
According to (1)(2):
� � %1001 12
12 B��
AAAAE (3)
The ash content of the extracts is below 0.1% by the test. That is all the ash is still in the solid. It is feasible to calculate the extraction rate using the above ash balance method.
3. Results and Analysis E. Effects of different treatment conditions on extraction
performance 1) Effect of temperature on extraction performance
Take H2SO4 and NaOH as catalyst separately. Treat the lignite for 60 min at9.0 0.5 MPa. The weight ratio of methanol Xilinhaote lignite is 5:1.Research the effect of temperature on extraction performance(T=260-320 ). The variation of E with T is shown in fig1.
250 260 270 280 290 300 310 320 3305
10
15
20
25
Extra
ctio
n R
ate
/ %
Temperature /
Fig.1 The effect of temperature on E�, H2SO4 as catalyst; �, NaOH as catalyst
As is shown in fig1,with the increase of temperature(260-320 ) at certain pressure, E increases obviously no matter the catalyst is sour or basic. At lower temperature, that is near or above the critical temperature of methanol, H2SO4 is better than NaOH. When temperature surpasses 270 , NaOH is better than H2SO4.
With the rise of temperature, solvent viscosity decreases. Solvent molecules are easier to enter macro molecule structure, leading dissociation of ether bonds. The dissociation speed increase with the increasing temperature. Alcohols provide active hydrogen, therefore free radicals and micro molecules can be stable[13,14]. The solubility of compounds in methanol increases. Hence the extraction rate increases with temperature.
2) Effect of pressure on extraction performance Take H2SO4 and NaOH as catalyst separately. Treat the
lignite for 60 min at 260 . The weight ratio of methanol/Xilinhaote lignite is 5/1. Research the effect of pressure on extraction performance(T=260-320 ). The variation of E with T is shown in fig2.
2 4 6 8 100
5
10
15
20
Extra
ctio
n R
ate
/ %
Pressure / MPa
EFig.2 The effect of pressure on
Identify applicable sponsor/s here. (sponsors)
Copyright © 2012 SciRes. 159

�, H2SO4 as catalyst; �, NaOH as catalyst As is shown in fig2, with the increase of pressure at certain
temperature, E increases obviously no matter the catalyst is sour or basic. When the pressure surpasses 8.1 MPa, NaOH is better than H2SO4.
For supercritical fluids, the increase of pressure means increase of solubility. During supercritical treatment, fluids of high solubility makes free radicals move away from coal subjects. Secondary reactions are avoided. At the same time, high pressure can make fresh solvent permeate into coal molecules. The mass transfer speed is raised because of higher turbulivity. Hence the extraction rate increases with pressure.
3) Effect of catalysts on extraction performance Acid and base can help damage some strong chemical
bonds. Through 2.1.1and 2.1.2, we can make the conclusion that NaOH is better than H2SO4 when pressure surpasses methanol critical pressure and temperature above 270 .Oxygen exists in coal in the form of carboxyl, hydroxyl and other functional groups. Carboxyl and hydroxyl are acid groups[16-18]. Base can also enforce hydrolyzation of oxygen bonds and increase the content of hydroxyl[19]. Hence to choose base as catalyst is better for raising extraction rate.
4) Effect of pretreatment ways on extraction performance All the experiment samples above have been swelled in
methanol for 8 h. Pretreatment will influence coal molecule structure. The table below shows the effect of different pretreatment ways on the extraction rate at similar temperature and pressure.
TABLE II THE EFFECT OF DIFFERENT PRETREATMENT WAYS ON THEEXTRACTION RATE
Pretreatment ways T/ P/MPa Catalyst E/%
Original sample(1#) 310 10.5 1%NaOH 17.87
Only drying(2#) 310 9.5 1%NaOH 16.21
Swelling (3#) 310 9.5 1%NaOH 22.47
a) Swelling Compared 1# and 3# in table II, after swelling, the
extraction rate increases 4.60% at similar treatment conditions. It is proper to make the conclusion that swelling can help increase the extraction rate.
Swelling can weaken the association between coal macro molecules[20]. New structure makes it easier for solvent molecules to touch coal. What’s more, micro molecules enter supercritical fluids. Secondary reactions and reverse reactions can be avoided[21].
b) Effect of moisture in coal Compared 1# and 2# in table 2 the extraction rate of 1# is
1.66% higher than 2#, in which the lignite sample is dried. Treatment temperature and catalyst are the same, but treatment pressure of the former is 1MPa higher than the latter. According to the analysis about the effect of pressure on the extraction rate, suppose treatment pressure was the same
extraction rate should be similar to each other. It is difficult for H2O as an inorganic solvent to solve long-chain compounds, benzene rings and condensed rings in coal. The supercritical condition of H2O is Tr=374.3 , Pr=22.12MPa. Under the conditions in this paper, H2O cannot damage the coal molecules. Compared with large scale of methanol solvent, the effect of moisture in coal can be ignored.
Through the analysis about effects of different experiment conditions on the extraction rate, some conclusions can be drew. To get high extraction rate, we should swell the coal sample, use base as catalyst and make the temperature and pressure above methanol critical point.
F. Further discussion on treatment temperature Effects of temperature and pressure on the extraction rate
are preliminary investigated through above extraction experiments under different conditions. In fact, pressure of the autoclave is controlled by adjusting the volume of material. Considering that the increase of pressure will bring higher requirement of the equipments and subsequent liquefaction technologies, further studies focus on the extraction rate at higher temperature and pressure of 8.2 MPa. If temperature continues to increase, the weight ratio of solvent/coal will reduce on the basis of the 6:1. Treatment cost can be lower.
The experiment scheme is determined after comprehensive analysis above. Firstly, swell the sample in methanol. With NaOH as catalyst and pressure controlled at 8.2 MPa, increase the temperature gradually from 240 ,which is methanol critical temperature. When the temperature reaches the test temperature, stabilize for 60 min.
260 280 300 320 340 360 380
15
20
25
Extra
ctio
n R
ate
/%
Temperature/
Fig.3 Variation of E with T
The result can be seen in Figure 3. During the procedure of temperature varies from 260 to 320 , the extraction rate increases obviously, which is consistent with the results of the foregoing. When the temperature rises to 330 , the extraction rate reaches the maximum. Continuing to rise the temperature to 370 , the extraction rate decrease slightly.
The rise of temperature makes the coal pyrolysis accelerating and free radicals generate in a very short period. H-donor ability of methanol f is limited and free radicals cannot be stable right away. As a part of free radicals poly-
160 Copyright © 2012 SciRes.

condense together, the extraction rate is decreased[13,14].Therefore, to obtain a higher extraction rate, the reaction temperature should be maintained at about 330 .
4. Conclusions and Prospect G.
The extraction rate increases with the raising of temperature and pressure below 330 ,10 MPa regardless of NaOH or H2SO4 as catalyst and reaches its maximum at 330 .However, there is a downward trend when continuing to raise temperature. Experiment results show that taking NaOH as catalyst is more conducive to improve the extraction rate than H2SO4.
H.After swelling pretreatment in methanol for 8 h, the lignite
is treated for 60 min at 330 8.2 MPa with NaOH as catalyst(1%wt). The weight ratio of methanol/Xilinhaote lignite is 5/1. Under these conditions, the extraction rate can reach 22.88%.
I.In this paper, the influence factors such as temperature,
pressure, catalyst and pretreatment on supercritical methanol processing lignite have been studied. But the analysis and separation for the extracts need further exploration.
REFERRENCE[1] H. Dai, K. Xie, Technology and Use of Lignite, Peking: Coal
Industry,1999, pp. 1-9 [2] M. Satoru H. Masahiro, K. Koh, Analysis of oxygen-functional groups
in brown coals.Fuel Processing Technology, vol. 67, pp. 231-243, 2000. [3] Z. Shi, Study on Thermal Extraction of Coal and Hydrogenation
Liqucfaetion Behavior of Extract, April 2009. [4] C. Li T. Takanohashi T. Yoshida, Effect of acid treatment on thermal
extraction yield in ashless coal production, Fuel vol. 83(3), pp. 727—732, 2004.
[5] O. Yunus, C. Kadim, Low temperature extractability and solvent swelling of Turkish liginites, Fuel Processing Technology, vol. 53(1-2), pp. 81-97, 1997.
[6] H Hu, S. Guo, K. Hedden. Extraction of lignite with water in sub- and supercritical states, Fuel Processing Technology, vol. 53(3), pp. 269-277, 1997.
[7] K. Xie, Coal Structure And Its Reactivity, Peking: 2002, pp.68-90 [8] C. Chen, J. Gao, X. Wei, Solvent Extraction And Coal Cleaning, Coal
Conversion, vol. 18(2), pp. 14-20, 1995. [9] Y. Tian, S. Shen, Y. Tian, Coal Unfreezing Extraction and Coal
Chemical Group Composition, Journal of Taiyuan University of Technology, vol. 32(6), pp. 555-558, 2001.
[10] F Czechowski, M Stolarski, R. Bernd, Supercritical fluid extracts from brown coal litho types and their group components-molecular composition of non-polar compounds, Fuel vol. 81, pp. 1933-1944, 2002.
[11] T. Yoshida T. Takanohashi K. Sakanishi, The effect of extraction condition on hypercoal production( ) Under room-temperature filtration, Fuel vol. 81(10), pp. 1463-1469, 2002.
[12] J. Shen, X. Li, G. Zou, Extraction yield of different rank coals in CS2-NMP and their relation w ith coals property, Coal Conversion vol.28(3), pp. 1-4, 2005.
[13] W. Liu , T. Xia, S. Zhang , X. Wei, Z. Zong , C. Li, Factors influencing supercritical methanolysis of lignite, Journal of Wuhan University of Science and Technology, vol. 33(1), pp. 95-98, 2010.
[14] Z. B. Zhao, S. S. Chen, Z. F. Zhang, Study on Suprcritical Gas Extraction of Coal, Coal Conversion vol. 19(1), pp. 88-95, 1996.
[15] C. H. Chen, Supercritical Extraction Features Of Some Coals, Coal Conversion vol. 18(4), pp. 68-74, 1995.
[16] X. Zhu, Z. B. Zhu, C. J. Han, C. F. Zhang, Quantitative Determination Of Oxygen- Containing Functional Groups In Coal By Ftir Spectroscopy, Journal of Fuel Chemistry and Technology, vol. 27(4), pp.335-339, 1999.
[17] M. Li, Research On Oxygen-Containing Functional Groups On Coal Surface, May, 2004.
[18] P. Zhao, S. D. Shi, Research on Forms of Organic Oxygen in Shengli Lignite with XPS, Coal Science and Technology, vol. 32(7), pp. 51-52, 2004.
[19] Y. Chen, J. S. Gao, J. Yan, Extraction of Coal with Cyclohexanone, Journal of Fuel Chemistry and Technology, vol. 25(1), pp. 60-64, 1997.
[20] H. M. Li, Study on the Effect of Pretreatments on coal liquefaction reactivity, May 2010.
[21] H. Q. Hu, H. Qian, S. C. Guo, Solvent Swelling of Coal for Improved Supercritical Extraction, Journal of Fuel Chemistry and Technology, vol. 25(3), pp. 223-226, 1997.
Copyright © 2012 SciRes. 161

Use of Compressive Reactor for Associated Petroleum GasProcessing
B. S. Ezdin, A. A. Nikiforov, V. E. Fedorov, A. E. Zarvin, S.A. Konovalov, V. V. Kalyada, I. V. MishchenkoDepartment of Applied PhysicsNovosibirsk State University
Novosibirsk, [email protected]
Abstract—The possibility of using of a pair of compressionpiston - cylinder with the unique performance features for theconversion of hydrocarbons are discusses. The experimentalfacility enables working in the pressure range that would beunattainable in diesel engines. The necessary degree ofcompression is managed and maintained by the computersystem with a feedback.
Keywords-oxidation; natural gas; assotiatied gas; chemicalcompression reactor
1. IntroductionFor the past two decades, researchers in many countries try
to invent a direct method of natural and petroleum gasconversion into heavy hydrocarbons bypassing a gas synthesisstage. The idea is to create a compact high-performancemobile processing unit to use it directly in the oil processingindustry.
2. ExperimentMethods were developed to produce the synthesis gas and
other products of associated gas from the natural gas in thechemical compression reactor - diesel engine for example[1,2].
Research team headed by A. Nikiforov, has worked out amethod of a surface TECH-oxidation [3]. The coveringresistant to the thermal cycling, is highly resistant to abrasionand heat. The coefficient of friction between the two coveringsdoes not exceed 5 * 10-2. Surfaces in the reaction zone canwithstand operating temperatures of more than 2000 K. One ofthe perspective applications of this innovation is to use a pairof compression "piston - cylinder" with the uniqueperformance features for the conversion of hydrocarbons.
We have developed an original compression reactor toproduce synthesis gas and for the controlled oxidation ofassociated gas to ethers and peroxy compounds. The reactorconsists of piston and cylinder that are cooled. They are drivenby a crank mechanism with tension rod. This mechanismprovides a translational-rotational motion of the cylinderwithout lateral forces on the piston. The reactor has a systemof measuring pressure in the reaction volume in real time. The
construction provides the controlled regulation mechanisms ofthe cylinder upper dead point. These mechanisms have aresponse time of 0.1 seconds and an accuracy of 10 microns.Other mechanisms feed the reacting mixture in the reactionvolume with a minimum response time of 0.5 ms. There is asystem cooling the piston and the cylinder of the reactor inorder to maintain an optimum gap between them. The workingvolume of the reactor is 0.1 to 0.6 liters. The optimalfrequency of reactor operation is up to 10 Hz. The reactor isequipped with systems collecting reaction products, systemsseparating raw materials that didn’t react to bring them back tothe reactor entrance. Hardware-software system supporting thereactor provides on-line data and enables to manage thereactor mechanisms in order to optimize and to increase thereaction outcome percentage.
The set includes the electromechanical reactor startupsystem and the system collecting the excess energy releasedduring the chemical reactions. Without lubrication as thesurface to surface friction coefficient is low, there is noinfluence of lubricating materials during the process ofchemical reactions inside of the reactor. The reactorconstruction enables to have a pressure above 100 atm in thechamber. This pressure in its turn enables a wide range ofchemical reactions. The pressure control mechanism inside ofthe reaction volume provides information about the processestaking place during the reaction. The appearance of the reactor,as well as remote control systems is shown in the photographs(Figs. 1 - 3).
Figure 1. The appearance of the reactor. In the foreground is the engine witha crank mechanism and tension rods
Advances in Materials Physics and Chemistry Supplement: 2012 world Congress on Engineering and Technology
162 Copyright © 2012 SciRes.

Figure 2. The process remote control system.
We have carried out a series of primary research of theprocess of the controlled chemical reaction in the chamber upto the stage of the gas mixture oxidation and generation ofether and peroxide compounds.
Figure 3. All the information about the process is transferred to theoperator's monitor.
Pentane was used as a raw material. Main interest is thestart up of a chemical reaction in methane and methanemixture to higher hydrocarbons. The calculated curve ofmethane and methane mixture oxidation indicates thenecessity to maintain the reacting mixture pressure at the levelof 90 atm. According to evaluations the pressure increasetransfers the reacting system from the mode of chain ignitionto the quasistationary mode of branched-chain oxidation,providing a high reaction rate at relatively low temperatures. Italso minimizes the influence of heterogeneous processesresulting in the formation of deep oxidation products.
The experimental facility enables working in the pressurerange that would be unattainable in diesel engines. Thenecessary degree of compression is managed and maintainedby the computer system with a feedback. That would beunavailable in the alternative systems.
Sampling from the reaction volume was made through aspecial channel drainage products from the compressionchamber. The analyzed sample was collected in an evacuatedcontainer and transported to the analyzer. The analysis wasperformed using the branching and the identification byGCMS-QP2010 Plus the company Shimadzu (Japan).Chromatographic column used Supel Q-PLOT 30 m long and0.32 mm inner diameter. Search for sample components wasperformed by treating the chromatograms of the total ioncurrent. Identification of the observed peaks in thechromatogram was performed by matching the observed massspectra and mass spectra of NIST electronic library.
The result of analysis of such samples at a compressionpressure of 60 atm shown in Table 1, and a fragment of thechromatogram - in Fig. 4. As expected, in mixtures with highoxygen concentration was achieved complete combustion ofthe reagents with the formation of the final products: carbondioxide and water..
Table 1. Analysis of the composition of a sample number 12/05.
Numberof thepeak
Retentiontime,
minutes.мин
Peakarea,%
The substance (chemicalformula)
1 1.266 58,48 N2 and СО in the sum
2 1.266 10,04 О2
3 1,266 1,92 Ar
4 1.266 4,81 СН4
5 1.349 3,10 СО2
6 1.466 1,91 С2Н4
7 1.571 1,72 С2Н6
8 1.930 1,1 H2O
9 3.253 0,96 Propene C3H6
10 3.453 12,57 Propane С3Н8
11 6.573 0,11 Ethylene oxide C2H4O
12 7.984 0,22 Isobutane C4H10
13 8.449 1,04 2-Butene,(Z) C4H8
14 8.753 1,65 n-Butane, C4H10
15 8.965 0,25 2-Butene C4H8
16 9.117 0,07 2-Butene, (E) C4H8
17 13.757 0,04 С6Н6
Figure 4. Detail of chromatograms of sample number 12/05.
Copyright © 2012 SciRes. 163

We expect that the regime of mixtures with low oxygencontent (up to 7%) would work in a chemical reactor modeconversion of hydrocarbon and / or partial oxidation. Theresult of the first tests setting in this mode are shown in Table2, a fragment of the chromatogram - in Fig. 5. The analysisrevealed the presence of complex hydrocarbons.
Table 2. Analysis of the composition of a sample number 17/06.
Numberof thepeak
Retentiontime,minutes.мин
Peakarea,%
The substance (chemicalformula)
1 1.266 37,26 N2 and СО in the sum
2 1.458 0,06 С2Н4
3 1.567 2,74 С2Н6
4 1.933 0,72 H2O
5 3.216 45,16 Propene C3H6
6 5.210 0,16 Dimethyl ether C2H4O
7 7.865 0,68 Isobutane C4H10
8 8.264 4,22 2-Butene C4H8
9 8.567 7,23 Butane, C4H10
10 8.764 1,21 2-Butene,(Z) C4H8
11 9.117 0,07 2-Butene, (E) C4H8
Thus, this technological installation can be used as a freepiston engines with a low coefficient of friction, as well as toachieve the parameters corresponding to the nonequilibriumprocesses of synthesis of hydrocarbons. At present, successiveiterations are working to raise the pressure in the reaction
volume in order to expand the experimentally accessibleregion to study the effect of pressure on the processes ofsynthesis and partial oxidation.
Figure 5. Detail of chromatograms of sample number 17/06.
3. AcknowledgmentThe work is performed with the financial support of the
grant from the Russian government No. 11.G34.31.0046 forpublic support of scientific research under the guidance ofleading scholars in Russian universities (leading scientist -K.Hanyalich, NSU).and by the Ministry of Education andScience of the Russia, project No. 1.22.12.
REFERENCES[1] Processing of synthesis gas: compact facility / / Analytical
chemical industry portal. http://www.newchemistry.ru/.
[2] V. M. Batenin, L. S. Tolchinsky, J. L. Dolinsky, V. L. Tolchinsky.Modular units for processing of volatile hydrocarbon gases in methanol,high-octane gasoline, dimethyl ether and hydrogen // Energosintop LLChttp://energosintop.boxmail.biz/.
[3] A. A. Nikiforov. The method of microarc oxidation // RF PatentNo. 2389830 from 20.05.2010.
164 Copyright © 2012 SciRes.

Hydrogen as Carbon Gasifying Agent During Glycerol Steam Reforming over Bimetallic Co-Ni Catalyst
Chin Kui Cheng, Rwi Hau Lim, Anabil Ubil, Sim Yee Chin, Jolius Gimbun Faculty of Chemical & Natural Resources Engineering,
Universiti Malaysia Pahang Kuantan, Malaysia
Abstract—Alumina-supported bimetallic cobalt-nickel catalyst has been prepared and employed in a fixed-bed reactor for the direct production of synthesis gas from glycerol steam reforming. Physicochemical properties of the 5Co-10Ni/85Al2O3 catalyst were determined from N2-physisorption, H2-chemisorption, CO2 and NH3-temperature-programmed desorption measurements as well as X-ray diffraction analysis. Both weak and strong acid sites are present on the catalyst surface. The acidic:basic ratio is about 7. Carbon deposition was evident at 923 K; addition of H2 however has managed to reduce the carbon deposition. Significantly, this has resulted in the increment of CH4 formation rate, consistent with the increased carbon gasification and methanation. Carbon deposition was almost non-existent, particularly at 1023 K. In addition, the inclusion of hydrogen also has contributed to the decrease of CO2 and increase of CO formation rates. This was attributed to the reverse water-gas-shift reaction. Overall, both the CO2:CO and CO2:CH4 ratios decrease with the hydrogen partial pressure.
Keywords-carbon deposition; catalyst; gasification; glycerol; steam reforming
1. Introduction The use of renewable feedstock is fast gaining attention in
lieu of the context of securing sustainable use of energy and preserving the environment for the future generations. Considerable effort has been devoted into applying green catalytic route to convert renewable feedstock such as biomass into commodity chemicals and clean bio-fuels. In particular, glycerol, also known as 1,2,3-propanetriol, is produced in excess quantity in the form of by-product during biodiesel synthesis. It constitutes an approximately 10wt% of the total product. In an effort to add value to glycerol as precursor for renewable and clean energy production, it was steam-reformed at temperatures greater than 773 K to produce H2, CO and CO2 which are important ingredients for the manufacture of a variety of industrial chemicals [1, 2]. The relevant reactions are:
C3H8O3 + 3H2O � 3CO2 + 7H2 (1)
C3H8O3 � 3CO + 4H2 (2)
Carbon deposition is a perennial issue during glycerol steam reforming. Cheng et al. [3] have reported a kinetic study of carbon deposition during glycerol steam reforming over alumina supported bimetallic Co-Ni catalyst. At least two types of carbonaceous species were deposited on the catalyst surface [3]. Sanchez and Comelli [4] published a paper on deactivation process and regeneration technique during glycerol steam reforming over a Ni-alumina catalyst. A TPO characterized by a main peak centered at 963 K was obtained [4].
As a continuation to the previous works, this paper reports on the adoption of H2 as co-reactant during glycerol steam reforming to encourage simultaneous carbon gasification. Results on the effects of H2 addition towards carbon deposition and product variation will be presented and elucidated in detailed.
2. Methodology
A. Catalyst�synthesis�and�physicochemical�characterization�Bimetallic 5Co-10Ni/85Al2O3 catalyst was prepared via
co-impregnation of cobalt and nickel nitrate solutions on -alumina which has been preheated at 873 K for 6 h. Subsequently, the slurry catalyst was oven-dried at 403 K for overnight and then calcined at 873 K for 6 h to obtain oxide metals. For the physicochemical characterization, BET surface area and pore volume were obtained from liquid N2 physisorption on the Quantachrome Autosorb-1 unit. The metal catalyst dispersion and surface area were determined from Micromeritics ASAP 2000 via H2-chemisorption technique. The crystallography of catalyst was examined via XRD technique via scan rate of 4o min-1 from 10o to 80o. Carbon content of collected samples post-reforming reaction, was determined using a Shimadzu Solid Sample Module (SSM-5000A) based on combustion at 1173 K.
B. Reaction�studies�Fig. 1 shows the experimental set-up for the current
experimental work. Reaction runs were conducted in a
Advances in Materials Physics and Chemistry Supplement: 2012 world Congress on Engineering and Technology
Copyright © 2012 SciRes. 165

stainless-steel fixed bed reactor under minimal influence from physical transport limitations. 60 wt% aqueous glycerol solution was prepared and directly injected into a 10-mm diameter fixed-bed reactor system using 50 mL syringe pump reacting at temperatures between 923 and 1023 K. Prior to reaction, catalyst was reduced in-situ using 50 ml min-1 of H2 for 2 h. Subsequently, H2 was co-added to the reactor as gasifying reactant. Total GHSV for the experiment was controlled at 5×10⁴ mL g-1 h-1.
Figure 1. Experimental set up for glycerol steam reforming.
For fixed-bed reactor operation with no recycle stream, Levenspiel [5] shows that the reaction rate is governed by:
-rA = (yA,feed × Ffeed × X)/ m (3)
where �rA = reaction rate of reactant A (mol s-1 gcat-1)
yA, feed = mole fraction of component A in the reactant stream
Ffeed = total molar flowrate (mol s-1) X = conversion of species A m = mass of catalyst (gcat)
For the purpose of comparison with other catalysts, specific activity, defined as the rate of reaction per unit active area offers a better index. Thus, for metal-catalysed reactions such as steam reforming, the weight-based rate was divided by the active metal area (obtained from H2-chemisorption) to give the specific reaction rate of the catalyst. Hence,
calc
ii
SAr
r C
(4)
where C
ir = specific reaction rate of species i (mol m-2 s-1) ri = reaction rate of species i (mol s-1 gcat
-1) SAcalc = metal surface area (m2 gcat
-1)
3. Results and Discussion
A. Physicochemical�properties�of�fresh�catalysts��
As shown in Table I, fresh calcined catalyst exhibits BET surface area and pore volume of 166 m2 gcat
-1 and 0.57 cm3 gcat
-1 respectively. The dispersion of metal was rather low, probably due to the high metal loading (15 wt%) employed in the current study. H2-chemisorption analysis revealed that the average particle diameter was 136.0 nm with metal surface area of 0.74 m2 gcat
-1. NH3- and CO2-TPD measurements revealed the existence of two peaks, representing both strong and weak acid/ basic sites (cf. Table II). Overall, the concentration of acid site was higher than the basic site in ratio ranging from 7.0 to 7.3.
TABLE I. PHYSICOCHEMICAL ATTRIBUTE OF CALCINED BIMETALLIC CO-NI/AL2O3 CATALYST.
Properties 5Co-10Ni/85Al2O3
BET surface area (m2 gcat-1) 166
Pore volume (cm3 gcat-1) 0.57
Dispersion (%) 0.74
Metal surface area (m2 gcat-1) 0.74
Active particle diameter (nm) 136.0
TABLE II. ACID/ BASE PROPERTIES OF FRESH CO-NI/AL2O3 CATALYST.
Properties 5Co-10Ni/85Al2O3
NH3 heat of desorption,
(kJ mol-1)
35.5
87.3
CO2 heat of desorption,
(kJ mol-1)
62.4
56.0
Acid concentration
(�mol m-2)
1.50
2.90
Basic concentration
(�mol m-2)
0.21
0.42
The diffractogram shown in Fig. 2 for calcined catalyst indicates the presence of Co3O4 and NiCo2O4 at 2- = 33.0o, and an overlapped peak consisting of CoAl2O4 and NiAl2O4 at 38.0o. In addition, the two peaks at 2- of 44.0o and 46.5o for the bimetallic catalyst may be attributed to the existence of NiO, NiAl2O4 and CoAl2O4. The small peak at 2- = 59.0o represents NiAl2O4 and CoAl2O4 phase. Furthermore, another small diffraction peak at 2- of 62.0o is attributed to NiO. The peak at 2- = 65.0o corresponds to the presence of composites of Co3O4 and CoAl2O4 while the diffraction peak at 68.0o is assigned to NiAl2O4.
166 Copyright © 2012 SciRes.

Figure 2. XRD pattern of calcined Co-Ni/Al2O3 catalyst.
B. Reaction�studies�
Reaction results in Fig. 3 show that with the addition of H2, the CO2 and CO formation rates varied in reverse trend suggesting that the presence of H2 in the feed encouraged the reverse water-gas-shift, viz. H2 + CO2 Æ CO + H2O. In addition, it seems that the CH4 formation rates increased with Phydrogen indicating an increase in methane production activity.
Figure 3. Effect of Phydrogen on product formation rates at 973 K.
Subsequently, the product ratios (CO2:CO, CO2:CH4 and CO:CH4) as a function of Phydrogen showed that the CO2:CO ratio is practically constant with Phydrogen as a result of reverse-water-gas-shift reaction (cf. Fig. 4). The ratio was lower than unity indicating that CO formation rate was higher than CO2 as the latter was being consumed to produce the former. CO2:CH4 decreased with Phydrogen due to the increased CH4 formation rate, whilst the ratio CO:CH4 decreased because the increase in CH4 formation rate was higher than the increase recorded for CO formation rate.
Figure 4. Effect of Phydrogen on product ratios at 973 K.
C. Carbon�deposition�Fig. 5 suggests a decrease in carbon deposition rate with
H2 partial pressure, in particular at 923 K. This observation is consistent with the increase in CH4 formation rate indicating that both methanation and carbon gasification contributed to the increase in CH4 formation. However, temperature seems to play an increasingly dominant role in reducing carbon laydown than adding H2 gasifying reactant at temperatures | 973 K. At 1023 K, deposition of carbon was essentially zero.
Figure 5. Effect of Phydrogen on carbon laydown as function of temperature.
4. Conclusions The effects of adding H2 gasifying reactant during the
glycerol steam reforming have been examined. Reaction data revealed that H2 addition led to the increased CH4 formation which can be attributed to the gasification of carbon and methanation. In addition, the product formation rate of CO2 decreased due to reverse water-gas-shift.
Copyright © 2012 SciRes. 167

5. Acknowledgment Authors would like to thank Universiti Malaysia Pahang
for the provision of short-term grant to fund this project.
REFERENCES [1] S. Adhikari, S. Fernando, and A. Haryanto, “A comparative
thermodynamic and experimental analysis on hydrogen production by steam reforming of glycerin,” Energy Fuels, vol. 21, pp. 2306 – 2310.
[2] C. K. Cheng, S. Y. Foo, and A. A. Adesina, “Glycerol steam reofmring over bimetallic Co-Ni/Al2O3,” Ind. Eng. Chem. Res., vol. 49, pp. 10804–10817.
[3] C. K. Cheng, S. Y. Foo, and A. A. Adesina, “Carbon deposition on bimetallic Co-Ni/Al2O3 catalyst during steam reforning of glycerol,” Catal. Today, vol. 164, pp. 268–274.
[4] E. A. Sanchez, and R. A. Comelli, “Hydrogen by glycerol steam reforming on a nickel-alumina catalyst: Deactivation processes and regeneration,” Int. J. Hydrogen Energy, in press.
[5] O. Levenspiel, Chemical Reaction Engineering. New York: John Wily & Sons, 1999.
168 Copyright © 2012 SciRes.

Progress of Modern Pyrolysis Furnace Technology Guotai Zhang and Bruce Evans
Technip USA Inc., Claremont, California, USA
Abstract - This paper presents the fundamentals of thermal pyrolysis and discusses the modern ethylene furnace technology and its design trends. Technip’s proprietary SPYRO® program is discussed for prediction of hydrocarbon cracking. Keywords - Ethylene furnace; cracking kinetics; adiabatic cracking; non-adiabatic cracking; radiant coil; convection section; burner and selective catalytic reduction.
1. Introduction Ethylene, the simplest of olefins, is used as a base product for many syntheses in the petrochemical industry: plastics, solvents, cosmetics, pneumatics, paints, packing, etc. Today, the demand for ethylene is over 140 million tons per year with a growth rate of 3.5% per year. The production of ethylene has been dominated by the steam cracking process since the end of World War II. The feed stocks for steam cracking are hydrocarbons such as shale gas, ethane, liquefied petroleum (LPG), naphtha, heavy gas condensate, and gas oil. The cracking furnace is the heart of ethylene plant which consists of the radiant section, the convection section and transferline exchangers (TLE’s) for waste heat recovery. (See Figure 1)
The objectives of this paper are to present the fundamentals of thermal pyrolysis, to introduce different cracking types in the furnace and to discuss the Technip modern furnace technology and design trends. The various feedstock cracking kinetics have been simulated using Technip’s proprietary SPYRO® program which is widely used by the industry for prediction of hydrocarbon cracking.
Figure 1 Ethylene Cracking Furnace
Feed
Dilution Steam
ECO
FPH
MFPH-1
SaturatedSteam
BFW
CrossoverPiping
TransferLinesConvection
Section
Primary TLE’s
Coils
A
Cracked Gas
E
B
A ----- Non-Adiabatic Cracking - MFPH-2A ----> B Crossover Piping Volume (Adiabatic Cracking) - CPVB ----> C Firebox (Thermal Cracking) - FB
D ----> E Transferline Exchan
C
C ----> D Transferline Volume (Adiabatic Cracking) - TVger (Non-Adiabatic Cracking) - TLE
Steam Drum
RadiantSection
MFPH-2
D
2. Fundamentals of Thermal Pyrolysis
Two scientific terminologies are used in the analysis below. [1]
Bond Energy Bond energy is a measure of bond strength in a chemical bond. The larger the bond energy, the stronger the bond and hence the higher temperature required to break it.
Bond Length Distance between centers of bounded atoms is called bond length. There is a general trend in that the shorter the bond length, the higher the bond energy.
Table 1 Bond Length and Bond Energy Bond Type H-H H-C C-C C=C CÇC
Bond Length Picometers* 74 109 154 134 120
Bond Energy kcal/mol 104 99 83 147 200
* 1 Picometer = 10-12 m
The general thermal cracking trend is listed below:
a. The H-H bond energy is higher than the C-H bond
energy and C-H bond energy is higher than the C-C bond energy. Thus, the C-C bond is easier to break than H-H and H-C bonds, and the H-C bond is easier to break than the H-H bond.
b. The dehydrogenation ability of a hydrocarbon depends
upon its structure. Tertiary H is easily dehydrogenated and Primary H is more difficult to dehydrogenate. The dehydrogenation ability is in the order of
Tertiary H > Secondary H > Primary H
Advances in Materials Physics and Chemistry Supplement: 2012 world Congress on Engineering and Technology
Copyright © 2012 SciRes. 169

c. Order of bond energy for Carbon-Carbon bonds is:
CC > C=C > C-C
d. Paraffin stability is lower with the molecular weight increase or the longer carbon chain length. There is a general trend in that the longer the carbon chain length the lower the bond energy and hence the easier cracking (breaking the C-C or C-H bond) will occur. Therefore, the cracking temperature for hydrocarbon molecules with long carbon chain length will be lower.
e. Heat stability will be different for hydrocarbons with
various structures. For hydrocarbons with the same numbers of carbon atoms, the heat stability order is
Aromatics > Naphthene > Di-olefins > Olefin > Paraffin
3. Different Cracking Types in Pyrolysis Furnace
Undesired cracking reactions can take place in the convection coil MFPH-2, crossover piping, transfer line or Transfer Line Exchanger (TLE) as shown in Figure 1. The cracking reactions which take place in the convection section and TLE are non-adiabatic cracking. The cracking reactions in the crossover piping and transfer line are adiabatic cracking reactions and those that occur in the radiant box are thermal cracking. [2] The extent of both the non-adiabatic cracking reactions and the adiabatic cracking reactions depends on the hydrocarbon feed type, steam/carbon mole ratio, mixed feed temperature and pressure as well as mixed feed Residence Time (RT) in the crossover piping or furnace effluent RT in the transfer line volume.
4. Modern Furnace Technology and Design Trends
In this section we describe the state-of-art steam cracking
technology and its design trends. A. Build Larger Ethylene Furnaces, Plants and
Complexes Today, the largest single cell gas cracking furnace produces 210 KTA ethylene, and the largest single cell liquid cracking furnace produces 170 KTA ethylene. Limits of these technologies have not yet been reached. The largest ethylene plant has 1500 KTA ethylene capacity. New mega plants with 2000 KTA ethylene capacity are under consideration. Currently, the world’s largest ethylene complex is Formosa Petrochemical Corporation which produces about 3000 KTA ethylene. B. Develop Novel Radiant Coil New radiant coils have been developed to enhance heat transfer and increase furnace run length, selectivity or operating capacity. a. SFT (It has been granted a patent)
Technip has developed a new coil, Swirl Flow Tube (SFT) by bending tube process which can vary the amplitudes and pitches of the tube swirl to reduce tube skin temperature or increase run length and/or capacity. For the same feed and feed rate with on-stream time of 50 days, the maximum Tube Metal Temperature (TMT) of SFT is about 50 oC lower than that of bare tube. In other words, feed rate can be increased 23% to reach maximum TMT of 1070 oC at 50 days. Similar comparisons can be made on run length impact at constant capacity or on selectivity improvement with shorter coil length and short residence time.
Swirl Flow Tube (SFT)
� New coils geometry to improve selectivity and/or
longer run length and/or higher capacity
Recent Innovations:
– Swirl Flow Tubes (SFT) with varying amplitudes
and pitches
b. GK-7 Coil (It has been granted a patent) A new coil called GK-7 has been developed by Technip, which has an improved layout of the Technip GK-6. It has following features [3]:
3 Inlet tubes have an extra wide tube spacing 3 Outlet tubes have an IN-LINE layout 3 Small difference in TMT’s between inlet/outlet passes 3 Symmetrical tube layout 3 Easier access for coil maintenance
A furnace with GK-7 coils is currently being constructed. c. Cracking tube surface treatments
Cracking furnace tubes can use a surface treatment to reduce coking. For example, Kubota’s ANK 400 achieves unprecedented furnace run length by dramatically lowering coke formation. The key to coke reduction is an inert, nanocrystalline spinel surface which has been proven to reduce both catalytic and pyrolytic coking.
d. Improved cracking tube alloys Improved alloys can contain higher levels of chrome and nickel, but can also contain other additives. For example, the Schmidt + Clemens HT-E alloy, with a certain level of aluminium (Al) addition, is claimed to significantly reduce the effect of catalytic coking, while also offering protection against oxidation and carburization. The positive impact on run length has been verified for HT-E compared to conventional 25/35 or 35/45 (Cr/Ni) alloys. C. Use DP Transfer Line Exchanger (TLE)
170 Copyright © 2012 SciRes.

Direct coupled primary TLE (Double Pipe Type) is often used for mega ethylene cracking furnace to cool down the furnace effluent. DP primary TLE has following benefits:
3 Mechanical cleaning is not required 3 No tube sheet erosion or tube plugging 3 Lower transfer line (adiabatic) volume 3 Increase furnace availability 3 Fewer fittings at the radiant coil outlets
D. Optimize burners and furnace firing pattern Firebox program is used with the input of fuel gas/air data and heat release pattern to simulate the furnace firing behavior. The burner input information may update after the Vendor’s burner test results. Finally, CFD is used to model the burner fluid dynamics in the firebox. E. Reduce Flue Gas NOx Emission There are two methods to reduce the amount of Oxides of Nitrogen (NOx) in the flue gas in order to meet US Environmental Protection Agency (EPA) requirements. First is to use low NOx staged fuel or ultra low NOx staged fuel burners to reduce the NOx in the range of 0.045-0.06 lb/MMBtu (HHV, High Heating Value) in the flue gas. Secondly, Selective Catalytic Reduction (SCR) system can be used to reduce the NOx down to 0.01 lb/MMBtu (HHV). The SCR consists of SCR catalyst, an ammonia injection grid, and an ammonia vaporization skid. SCR technology is designed to react ammonia and NOx over a catalyst to produce nitrogen and water vapor. Catalyst is titanium vanadium on either a ceramic honeycomb type or corrugated type carrier. The catalyst is located in the convection section at a region where the temperature is suitable for catalyst operation.
V. SPYRO® Yield Prediction Model
The first SPYRO® program was released in 1977, which has been continuously developed over 30 years. SPYRO® is a unique program for prediction of cracking furnace effluent yields as well as overall performance of the furnace. SPYRO® is the only program which is based on rigorous fundamental mathematical equations representing reaction kinetics of almost all chemical, thermo-chemical reactions in the pyrolysis furnace. SPYRO® is now used by more than 85% of the ethylene producing industry worldwide. The latest program version and kinetic model SPYRO®-7 covers all hydrocarbon species from C2 to C42 and more than 7000 reactions. This version also allows better flexibility in establishing the furnace and heat recovery flowsheet.
EFPSE F P S( THYLENE URNACE ROGRAM ET)
CONVEC
FIREBOX
SPYRO
TES
CROSS-OVERTEMPERATURE
BRIDGE WALLCONDITIONS
HEAT FLUXPROFILE
TUBE SKINTEMP. PROFILE
STEAMGENERATEDBFW HEATED
COKEBUILD-UP
� SPYRO® Kinetic model for radiant coil Coking / runlength prediction Feedstock selection / cocracking evalution
� TES Tra Ex Sim
C l Flu Dy
nsferline changer ulation Coking / kinetics / runlength prediction
� FIREBOX Combustion model coupled with SPYROAnalysis of heat release patterns
� CONVEC Convection section simulation, complete process and steam/BFW system calculation
� EFPS Complete furnace simulation with steam balance and feed / fuel flexibility analysis
� CFD omputationa id namics to analyze combustion air / flue gas system, decokeeffluent to firebox and furnace effluent to Primary TLE
5. Conclusions 1. There are different cracking modes at five various regions
in the ethylene furnace. Major thermal cracking is in the radiant firebox.
2. Today, mega furnace sizes are 210 KTA ethylene and 170
KTA ethylene for single cell gas and liquid feedstocks, respectively.
3. Novel radiant coils, enhanced tube layout and new types of
tube metallurgy have been developed which enhance heat transfer and increase run length and/or capacity.
4. Double Pipe (DP) heat exchanger has been widely used as
the primary TLE to quench the furnace effluent and generate high pressure steam.
5. Ultra low NOx staged fuel burners incorporating primary
and secondary tips are used to reduce the NOx in the flue gas to 0.045 lb/MMBtu (HHV). Furthermore, Selective Catalytic Reduction (SCR) system can be used for the reduction of NOx to 0.01 lb/MMBtu (HHV).
REFERENCES 1. “Optimization of Reformer Inlet Temperature based on
Thermal Cracking of Feedstocks” at 2011 World Congress on Engineering and Technology (CET 2011)”, Guotai Zhang and Sanjeev Sekhri, Paper ID #23177, Oct. 28 – Nov. 2, 2011, Shanghai, China.
2. “Impact of Cracking at the Inlet and Outlet Transitions of Ethylene Furnace Radiant Sections”, Guotai Zhang and Bruce Evans, Presented at “Technip Ethylene Technology and SPYRO® International Conference”, Jan. 30, 2008 in Abu Dhabi.
Copyright © 2012 SciRes. 171

3. “New Type of Cracking Furnace Radiant Coil”, Johan
van der Eijk, Paper ID #173546 at the AIChE 2010 Spring National Meeting, March, 21-25, 2010 in San Antonio, Texas, USA.
172 Copyright © 2012 SciRes.

Study on Rational Well Spacing Optimization of LowPermeability Gas Reservoir
ZHANG Jian-guoNationl Engineering Laboratory for Low-permeability
Oil/Gas Exploration and DevelopmentResearch Institute of Petroleum Exploration and
Development of Petrochina Changqing Oilfield CompanyShanxi Xian, China
WU YongNationl Engineering Laboratory for Low-permeability
Oil/Gas Exploration and Development
Research Institute of Petroleum Exploration andDevelopment of Petrochina Changqing Oilfield Company
Shanxi Xian, [email protected]
AI FangNationl Engineering Laboratory for Low-permeability
Oil/Gas Exploration and DevelopmentResearch Institute of Petroleum Exploration and
Development of Petrochina Changqing Oilfield CompanyShanxi Xian, China
Abstract-The Shanggu gas field is the low porosity and low permeability. Single well controlled reserves, economic limit wellspacing and economic rational spacing through different methods are calculated. With the development experience of Su Lige gasfield as guidance, the rational spacing of Shanggu gas reservoir is 700m×900m by calculating daily gas production rate andcumulative gas production with different well spacing using numerical simulation method.
Keywords-low permeability; rational well spacing; well pattern density; reservoir numerical simulation
1. IntroductionWith the enhancement of development technique of oil and
gas field, many low permeability fields, which couldn’t yieldoil or gas economically in the past, are becoming more andmore valuable[1]. We must demonstrate well spacing before orafter the development of field[2-4]. Well spacing is of vitalimportance for ultimate recovery and economic benefit of oiland gas field, especially for low permeability gas reservoir,which is widely reported both at home and abroad[5-15].Currently, there are two basic methods in papers, whichresearch the rational well spacing of gas field, they are singlewell controlled reserves and numerical simulation. The wellpattern density of low permeability area in Jingbian gas fieldis low and the control degree of production wells is also low,which are the main reasons why the degree of reserverecovery is low. In order to enhance the producing degree andrecovery ratio, well spacing is needed to be changed. Based onthe basic principal of well pattern density optimization,rational spacing is economic, should avoid well interferenceand meet the standard of maximum recovery ratio andproducing degree. How can we calculate the rational spacing,which means maximum economic benefit and recovery rationcan be achieved with minimum wells? This paper calculatesthe rational spacing, which is suitable to Shanggu lowpermeability gas field, and recommends a rational spacingarrangement.
I. Relationship between Well Spacing And Sand ScaleThe main factors affecting the rational spacing are single
sand body scale, superposed features of sand body, pattern ofcomposite sand body and sand body’s control action ofporosity and permeability.
From the results of geologic research, we know thatchannel width is 60-250m and channel belt width is 600-2000m. According to channel belt width, horizontal spacing is600-1500m. For the same sand body, well spacing is less thanchannel width (Table I).
2. Methods of Determining Well Spacing
A. Single well controlled reserves
Assuming that gas well controlled reserves is known, thesands are uniform throughout the controlled extent of thereservoir, and drainage area is cylinder radial flow area,according to parameters and evaluation result of developedShanggu gas field, the single well controlled area can bewritten as
gor
gkk hsp
BNA
100 (1)
Where
�����������������������������������������!�������"� �� �#�����������������$���������������%��������
���������� �� �������� �'�

Ak-single well controlled area, Km2; Nk-geologic reservecontrolled by single well, 108m3; Bg-gas volume factor,dimensionless; h-Thickness controlled by single well, m; sg-skin factor, dimensionless.
Single well controlled area is about 0.45Km2 by using thismethod to evaluate 43 gas wells. The well spacing is 0.67Kmcalculated by square area.
B. Economic limit spacingEconomic limit spacing is the minimum spacing in terms
of economic benefit. Economic limit spacing is in directcorrelation with economic limit reserve. Under the conditionof without considering the risk of drilling and considering thecost of drilling engineering and surface construction, theoperation cost of gas production, the selling price of gas andthe loan interest rate, etc, the equation of production wellspacing using economic limit spacing method can be writtenas
Gross input of certain pattern density2/)( 321)1)(( TTT
BFDin RIIISAC �����( (2)
Gross output of this pattern density
)(10 axgRout TOPCENC ��((( (3)
Gross profit
outin CCG � (4)When gross profit equals to zero, the pattern density is
limit pattern density:0 � outin CCG (5)
Then, economic limit pattern density S is
2/)( 21)1)(()(10
TTBFD
axgR
RIIIATOPCEN
S ������(((
(6)
SL 1
min (7)
According to the development experience of Jingbian gasfield, we know that when average reserves abundance is largerthan 1.1×10⁸m3d/km2, the economic limit spacing is smallerthan 0.700km.
WhereS-economic limit pattern density, wells/Km2; ID-drilling
cost of single well(includes perforation, test, logging and soon), 104 yuan/well; IF-fracturing cost of single well, 104
yuan/well; IB-surface construction cost of single well(includessystem engineering, field construction, etc), 104 yuan/well; Pg-selling price of gas, yuan/103m3; C-commodity rate of gas,ratio; O-operation cost of gas, yuan/103m3; Tax-toll of gas,yuan/103m3; A-gas bearing area, km2; R-yearly loan interestrate, ratio; N-gas in place, 108m3; ER-recovery ratio withpattern density being S, ratio; Cm-gross input,104 yuan; Cout-gross output,104 yuan; G-gross profit, 104 yuan; T1-years of
stable production, year; T2-decreasing years with declinefraction being 20%, year; Lmin-economic limit spacing, km.
C. Rational spacingEconomic limit spacing is rational pattern density with
certain profit. If considering the profit is 0.2 times of sellingprice, then equation 2 can be written as
����
���((( (8)
Superimposed with Shanggu reserves, we know thataverage reserves abundance is larger than 1.1×10⁸m3d/km2.The economic limit spacing is smaller than 0.834km.
Figure 1. Relationship Graph between Economic Rational Spacing andReserves Abundance of Ancient Gas Field
3. Rational Spacing Determined byNumerical Simulation
On the basis of geologic model, we found mechanismmodel of Shan 135 well and G61-11 well. Basic parameters ofmechanism model are length and width: 5000×6000m, gridspacing: 100×100m, reserves abundance: 1×10⁸m3/km2, fivezones in vertical, which corresponds to subzone, namely, H8,S1, S2, Benxi, without considering Xiagu reservoir.
We consider 8 combinations of well spacing/horizontalrange, as shown in table II. Results are listed in figure 2, figure3 and table III. When individual well producing rate is1×104m3/d and comparing calculation results of different wellspacing and horizontal range, we conclude that the shorter thewell spacing is, the more the well number is and the higher thegas production rate is, the shorter the years of stableproduction is. When well spacing/horizontal range is700×900m, years of stable production is 3 years and both thegas production rate and recovery ratio is relatively high.
�����������������������������������������!�������"� �� �#�����������������$���������������%��������
�'( ���������� �� ��������

Figure 2. Cumulative Production Comparison Graph with Different Spacingand Horizontal Range
Figure 3. Daily Gas Production Comparison Graph with Different Spacingand Horizontal Range
4. Determination of Rational Spacing InShang Gu Gas Reservoir
Reserves abundance of Su Lige gas field is 1.2×10⁸m3/km2
and rational spacing and horizontal range is 600m×800m.Reserves abundances of project area which is larger than0.5×108m3/km2 are 2612.07km2, which accounts for 60% oftotal area. Average reserves abundance is 1.16×10⁸m3/km2
and geologic reserve is 3030×108m3, which accounts for79.77% of Shanggu gas reserve, whose reserves is3798.62×108m3. So rational spacing and horizontal range ofproject area is larger than 600m×800m.
Shanggu Gas reserves abundance of project area which islarger than 0.5×10⁸m3/km2 accounts for 79.77% of gas reserve.So the rational spacing and horizontal range is 700m×900m.
5. Conclusions(1) Rational pattern density not only meets the requirement
of development of gas field but should ensure maximumeconomic benefit. Rational pattern density is determined bygeologic characteristic of gas field.
(2) This paper determines the rational spacing of lowpermeability area in ancient gas field is 700m×900m by usingeconomic limit spacing, economic rational spacing andnumerical simulation. And this paper demonstrates aneffective way of determining rational spacing and spacingarrangement of low permeability gas reservoir.
REFERENCES[1] Wang Minghua, Gas Engineering [M] Beijing: Petroleum Industry Press,
1997.[2] Chen Yuanqian, Reservoir engineering calculations [M] Beijing:
Petroleum Industry Press, 1997[3] Li Shilun, Natural Gas Engineering [M],” Beijing: Petroleum Industry
Press, 2000.[4] Huang Bingguang, Practical And Dynamic Analysis Of Reservoir
Engineering [M],” Beijing: Petroleum Industry Press, 1998[5] Wang Zhouhua, Guo Ping, Huang Quanhua,et al, “Studying The Pilot
Production Pattern Well Spacing In The Da Niudi Lower PermeabilityGas Field [J],” Journal of Southwest Petroleum Institute,2004, 26(4): 18-20.
[6] E. Quint, M. Singh, P. Huckabee, D. Brown, C.B. Brake, J. Bickley, B.Johnston, “4D Pressure Pilot To Steer Well Spacing in Tight Gas,” 2006,SPE 102745-MS
[7] Tang Yulin, Tang Guangping, “A Discussing On The Reasonable Well-Pattern Spacing Of Carboniferous Reservoirs In East Sichuan [J] NaturalGas Industry, 2000, 2(5): 57-60.
[8] Wang Guoyong, Liu Tianyu, Shi Juntai, Pattern well spacingoptimization and analysis of factors affecting development effect inSulige Gas Field [J] ,” Special Oil & Gas Reservoirs, 2008, 15(5): 76-79.
[9] R. Recham, D. Bencherif, “Investigation of Optimum Well SpacingBased on a Combined Simulation and Economic Models,” PetroleumSociety of Canada, 2003, Paper 2003-014
[10] V. Dehdari, B.Aminshahidy, A.Tabatabaei-nejad, “Well Spacing andRecovery Optimization of One of Iranian Oil Fields by Using Streamlineand Reservoir Simulation,” 2008 SPE 112985-MS.
[11] Zhu Bin, Xiong Yanli, Wang Hao, “A Method To Determine AReasonable Well Spacing In Low-Permeability Areas Of CarboniferousGas Reservoirs,Eastern Sichuan Basin [J],” Natural Gas Explorationand Development, 2009 32(4) 27-28.
[12] Zhang Bo, Li Jun, Lai Haitao, “su lige infiltrates the gas field patternwell spacing computational method discussion [J],” PetrochemicalIndustry Application, 2010, 29(6): 42-44 .
[13] Li Shuang, Zhu Xinjia, Jin Hui, Jing Yuanshuai, “Study on rational wellpattern and well spacing in low permeability gas field [J],” Special Oil &Gas Reservoirs, 2010, 17(5): 73-76.
[14] [14] Dongbo He, Ailin Jia, Chengye Jia, et al,. “Well SpacingOptimization for Tight Sandstone Gas Reservoir,” 2010, SPE 131862-MS.
�����������������������������������������!�������"� �� �#�����������������$���������������%��������
���������� �� �������� �')

TABLE I. TABLE 1 DEVELOPMENTAL SCALE OF NEOPALEOZOIC CHANNEL IN GAOQIAO
ZoneThickness of sand body m Channel width m Channel belt width m
Min Max Variationchange Min Max Variation
change Min Max Variationchange
H8u 0.78 9 4-6 8.66 374.3 80-200 38.3 3126.54 750-1600
H8l 1 12.2 5-7 12.7 597.98 150-250 59.9 5405.98 1000-2000
S1 0.58 8.06 3-5 5.49 315.82 60-150 22.47 2563.48 600-1200
S2 0.54 8.7 4-5 4.92 355.26 70-180 19.76 2941.45 700-1500
TABLE II. DESIGN TABLE WITH WELL SPACING/HORIZONTAL RANGE
Well Spacing m 1100 1000 900 800 700 600 600
Horizontal Range m) 1300 1200 1100 1000 900 800 750
TABLE III. STATISTICAL LIST OF OPTIMUM SPACING AND HORIZONTAL RANGE OF ANCIENT GAS FIELD
Project No. 1 2 3 4 5 6 7
Well Spacing m 1100 1000 900 800 700 600 600
Horizontal Range m 1300 1200 1100 1000 900 800 750
Number of wells well 20 25 30 36 50 56 64
Years of Stable Production year 9.4 6.2 4.8 4.2 3.2 2.4 2.2
Daily Gas Production 104m3/d 20 25 30 36 50 56 64
Gas Production Rate % 2 2.6 3.1 3.7 5.1 5.7 6.5Cumulative Production at the end of
Stable Production 108m3 5.41 5.53 5.64 5.82 5.94 6.10 6.34
Degree of Reserve Recovery at theend of Stable Production % 16.72 17.08 17.44 17.99 18.36 18.85 19.58
Cumulative Production after 20Years 108m3 10.86 11.35 12.09 13.04 14.18 14.56 14.97
Degree of Reserve Recovery after20 Years % 33.55 35.08 37.37 40.30 43.83 44.98 46.25
�����������������������������������������!�������"� �� �#�����������������$���������������%��������
�'& ���������� �� ��������

Investigation of the Surface Properties of Vinyl Ethers – Sodium 2-Acrylamido-2-Methylpropanesulfonate
CopolymersS. Kh. Khussain, E. M. Shaikhutdinov, N. Zh. Seitkaliyeva, and A. Zh. Zhenisova
Department of applied chemistry Kazakh National Technical University named after Kanysh Satpaev,
Almaty, Kazakhstan e-mail: [email protected]
Abstract-The surface properties of water soluble copolymers vinyl ethers of monoethanolamine and ethylene glycol with sodium 2-acrylamido-2-methyl-propanesulfonate were investigated by studying adsorption at the aqueous solution – air interface. It is found that copolymers have considerably higher surface activity in comparison with poly- sodium 2-acrylamido-2-methyl-propanesulfonate.
Keywords- surface active copolymers, adsorption, interface, standard free energy of adsorption.
1. Introduction Investigation of the behavior of macromolecules at the
interface is one of the biggest challenges because surface phenomena in polymers and polymeric materials play an important role in the whole complex of their properties, especially in their structural and mechanical properties.
The combination of the polar hydrophilic groups and non-polar hydrophobic parts of chain in macromolecules gives to the functional areas of polymers the surface-active properties and the possibility to use them as flocculants, flotation reagents, antistatic agents, stabilizers of disperse systems, etc., used in the oil, pharmaceutical and textile industry, metallurgy, agriculture and for other purposes.
We have synthesized new multifunctional copolymers of vinyl ethers of monoethanolamine and ethylene glycol with sodium 2-acrylamido-2-methyl-propanesulfonate by free- radical copolymerization in aqueous medium [1,2].
This report is devoted to the determination of surface-active properties of these copolymers by studying the adsorption at the aqueous solution-air interface.
2. Experimental
The Na-AMPS monomer was prepared from 2-acrylamido-2-methylpropanesulfonic acid (H-AMPS) (the content of the main product was no less than 99 wt %) purchased from Avocado Research Chemicals Ltd. (Switzerland).
Ethylene glycol vinyl ether (EGVE) and monoethanolamine vinyl ether (MEAVE) were purified by
vacuum distillation (Tb=72�C/30 kPa, nD20= 1.4356 and
Tb=45–46�C/1.333 kPa, nD20= 1.4357 respectively).
The free-radical copolymerization of Na-AMS and MEAVE was performed in an inert medium at 60°C at various molar ratios of the starting monomers in aqueous solution. The reaction was carried out in the presence of an equimolar mixture of sodium bisulfite and potassium persulfate as a redox initiator. The weight of the initiator was 0.1% with respect to the total weight of comonomers.
The composition of the copolymer was determined by IR-spectroscopy and potentiometric titration on an EV-74 ionometer with the use of glass and silver chloride electrodes.
Adsorption of copolymers at the air-water solution interface was studied by measuring surface tension. Surface tension (�) of polymer sodium 2-acrylamido-2-methyl-propanesulfonate (Na-AMPS) aqueous solution, copolymer of ethylene glycol vinyl ether- sodium 2-acrylamido-2-methyl- propanesulfonate (EGVE-Na-AMPS), and copolymer of monoethanolamine vinyl ether - sodium 2-acrylamido-2-methyl- propanesulfonate (MEAVE-Na-AMPS) was measured at 298 K by the Wilhelmy [3]. The � value of solutions was calculated according to the equation [4]:
)(2
)(
dlgamm
�
� � (1)
where mp and ma - the mass of the plate in the solution
and air, respectively; g – gravitational acceleration; l and d - the width and thickness of the submerged part of the plate, respectively.
Retraction force of the plate to the solution was measured using a torsion balance to an accuracy of ±10-6 kg.
To determine the equilibrium value of surface tension, the measurement for each solution thermostatically-controlled to an accuracy of ± 0.50C was performed after 24 hours. The average value � was found then from several measurements. The accuracy of surface tension measurement did not exceed ±0,3 mN / m.
3. Results and Discussion
Figures 1 and 2 show kinetics of surface tension reduction of the copolymer aqueous solution depending on
Advances in Materials Physics and Chemistry Supplement: 2012 world Congress on Engineering and Technology
Copyright © 2012 SciRes. 177

adsorption time. It is evident that, for aqueous solutions of the copolymer, the equilibrium value of surface tension (�) is reached during several hours, which is typical for high molecular surface active compounds.
The adsorption of macromolecules at interface has its own peculiarities, among which the most important - the slowness of the process [5]. It manifests itself, particularly, in reducing the surface tension of aqueous solutions of macromolecular substances in the range of long time. The process can be divided in two stages:
1) the diffusion of macromolecules at the interface 2) the restructuring of certain segments of the
macromolecules on polarity at the interface under the action of the surface force field.
In order to obtain information on the duration of the copolymer adsorption the relaxation times of adsorbed layers were calculated on kinetic date according to equation [6]: lg (�� - �D) = lg (�0 - �D) – � / 2,3 E, (2)
where � - surface tension value of solution at time �,
mN/m; �0 – the initial of surface tension at � = 0, mN/m; �D – the equilibrium value of surface tension (after 24 h.),mN/m; E - relaxation time of the adsorption layer, min.
The relaxation times of polymer adsorption layers
VEMEA - Na-AMPS and VEEG-Na-AMPS at the interface solution - air are shown in Table 1.
Table 1 - The relaxation time of adsorption layers of
copolymers MEAVE - Na-AMPS and VEEG - Na-AMPS at different concentrations of solution
Copolymer
Concentration of copolymer,
wt. %
Relaxation time E , min.
0,02 145 0,04 147 0,09 150 0,12 152
MEAVE - Na-AMPS
0,50 172 0,02 190 0,04 423 0,06 500 0,08 126
VEEG-Na-AMPS
0,12 87 Analysis of the data (Table 1) shows that in the case of
the copolymer VEMEA-Na-AMPS relaxation time is directly proportional to the concentration of the copolymer, whereas for the copolymer VEEG-Na-AMPS, this dependence passes through a maximum. Obviously, this is due to the conformation of the molecules of copolymers. At low concentrations of the solution of the copolymer macromolecules are in a more expanded conformation and reorientation of the branched structure of the copolymer
VEEG-Na-AMPS takes more time. Subsequent increase of copolymer solution concentration raises quantity of simultaneously adsorbing macromolecules which leads to decrease of vacant place on surface. As a result the reorientation of macromolecular segments on polarity at the air- solution interface becomes difficult and, hence, relaxation time of adsorption layer decrease [6].
m1 = 24.7 mol. MEAVE % in the polymer composition Figure 1 - Kinetics of the surface tension reduction of polymer MEAVE - Na-AMPS at different concentrations of aqueous solutions (wt %) in solution: 0.02 (1), 0.04 (2), 0.09 (3), 0.12 (4), 0.5 (5)
0 50 100 150 1500
44
48
52
56
60
64
68
5
4
3
2
1
��Â�/Â
��Â�Ã
�, mN/m
,min �
m1 = 30 mol.% VEEG in the polymer composition Figure 2 - Kinetics of the surface tension reduction of polymer VEEG - Na-AMPS at different concentrations of aqueous solutions (wt %): 0.02 (1), 0.04 (2), 0.06 (3), 0.08 (4), 0.12 (5)
The isotherm of surface tension of copolymer solution
VEEG - Na-AMPS and MEAVE - Na-AMPS based on equilibrium value of � was constructed (Figure 3, curve 2,3),
178 Copyright © 2012 SciRes.

together with the isotherm of surface tension water solution poly- Na-AMPS (Figure 3, curve 1).
0,00 0,02 0,04 0,06 0,08 0,10 0,12
48
52
56
60
64
68
72
3
2
1
����
�/�
C, %
Figure 3 - Isotherms of surface tension of aqueous solutions poly- NaAMPC (1) and copolymer MEAVE - Na-AMPS (3), copolymer VEEG - Na-AMPS (2)
As can be seen from the figure 3, the curve � = f (c) of
copolymer MEAVE - Na-AMPS is below the curve VEEG - Na-AMPS, which indicates that surface activity of monoethanolamine vinyl ether copolymer is higher compared to VEEG - Na-AMPS. The higher surface activity polymer VEMEA-Na-AMPS explained by the formation of intramolecular salt bond between amino- and sulfonic acid groups, resulting in increased hydrophobicity of the copolymer and is its compactness:
C
CH
O
SO3NH C
CH2
CH3
CH3
n
CH2
CHCH2 m
O
R Na-
where R — ( CH2)2 — OH, and — ( CH2)2 — NH2 Based on isotherms the surface activity on Rebinder (GRe)
for poly- Na-AMPS and copolymers was determined according to equation [7] (Table 2):
0Re )(lim �� cdcdG �
. (3)
Table 2 - Physical - chemical properties of surface layers of polymers.
The system GRe(10-3, (mN m-1) /
(kmole m-3)
� ads G0298 ,
kJ / mole
Poly-Na-AMPS 1,5 18,0
Copolymer MEAVE - Na-AMPS
9,1 22,6
Copolymer VEEG - Na-AMPS
5,2 21,2
�, m
N/m
Table 2 demonstrates that surface activity of copolymer
exceeds ones of homopolymer approximately more than 3 times.
The values of polymer’s standard free energy of adsorption (�adsG0
298) were calculated in order to identify the causes and mechanism of change in surface activity and adsorption. In addition, it is important characteristic of a spontaneous accumulation of substance at the interface and is a measure of the surface active macromolecule’s desire to adsorb.
Standard free energy of adsorption was calculated according to the equation [8]:
�adsG0
298 = -RT ln GRe, (4) where T- the absolute temperature, R- the universal gas
constant. As seen from the values shown in Table 2, the gain in
standard free energy adsorption in transition from homopolymer to copolymer VEEG- Na-AMPS is about 3 kJ/base-mole, and to copolymer MEAVE - Na-AMPS is 4,6 kJ/base-mole.
Thus, the results of this study lead us to conclude that in
aqueous solutions the MEAVE - Na-AMPS and VEEG-Na-AMPS copolymer have higher surface activity and adsorption at the interface solution-air proceeds easier than poly- Na-AMPS, i.e. vinyl ether units in the polymer chain increases the surface activity of macromolecules.
REFERENCESF1G K. Zh. Abdiyev, S. Kh. Khussain, N. Zh. Seitkaliyeva, “New
macromolecular surface active substant based on monoethanolamine vinyl ether,” Vestn. Kazakh. Nats. Univ., No.2, vol. 31, pp. 321-323, 2003.
F2G E. M. Shaikhutdinov, S. Kh. Khussain, K. Zh. Abdiyev, A. Zh. Zhenisova, N. Zh. Seitkaliyeva, “New copolymers of 2-acrylamido-2-methyl-propanesulfonic acid, and vinyl ethers,” Proc. XVIII Mendeleev Congress on General and Applied Chemistry. -Moscow, vol. 2, p. 608, 2007.
F3G V. A. Kabanov, I. M. Papisov, “Complex formation between complementary synthetic polymers and oligomers in dilute solutions,” Visokomolec. soiyed., No. 2, vol. 21A, pp. 243 – 261, 1979.
F4G A. Adamson, “Physical Chemistry of Surfaces,” Moscow, 1979, pp. 109 - 118.
F5G D. J. Adams, M. T. A. Evans, J. R. Mitchell, M. C. Phillips, P. M. Rees, “Adsorption of Lysozime and some Acetyl derivatives at the
Copyright © 2012 SciRes. 179

Air-Water Interface,” J. Polym. Sci., Part C, No 34, pp. 167 – 169, 1971.
F6G A. A. Trapeznikov, V. G. Vince, T. Yu. Shirokova, “The kinetics of the reduction of surface tension in solutions of proteins,” Colloid. Zh., No 2, vol. 43, pp. 322 – 329, 1981.
F7G K. F. Zhigach, P. A. Rebinder, “Surface activity of hydrophilic colloid“, Zh. Phyz. Khim., vol. 13, pp. 94 – 105, 1939.
F8G V. G. Babak, M. A. Anchipolovsky, G. A. Vikhoreva, I. G. Lukina, “The mechanism of the synergistic action of bromide and tetradetciltrimetilammonium and karboximetilhitin forming surface active substance-polyelectrolyte complexes on the surface tension of mixed aqueous solutions,” Colloid. Zh., No 2, vol. 58, pp. 155-162, 1996.
180 Copyright © 2012 SciRes.
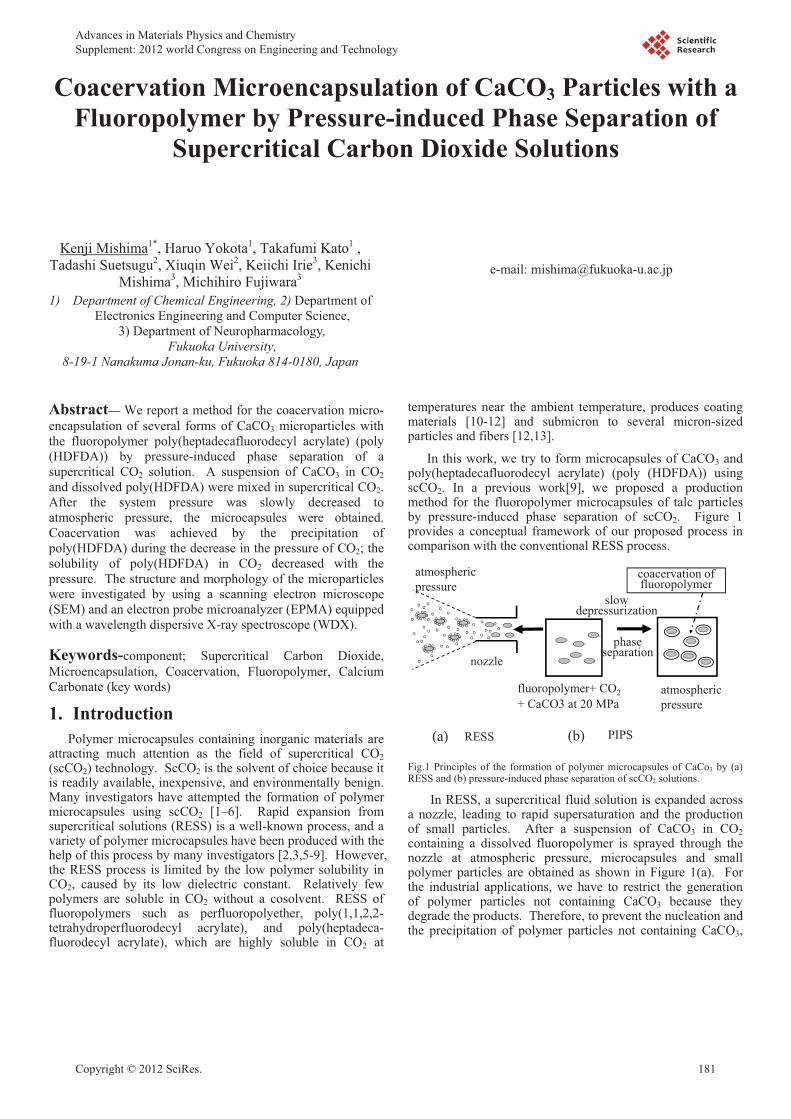
Coacervation Microencapsulation of CaCO3 Particles with a Fluoropolymer by Pressure-induced Phase Separation of
Supercritical Carbon Dioxide Solutions
Kenji Mishima1*, Haruo Yokota1, Takafumi Kato1 , Tadashi Suetsugu2, Xiuqin Wei2, Keiichi Irie3, Kenichi
Mishima3, Michihiro Fujiwara3 1) Department of Chemical Engineering, 2) Department of
Electronics Engineering and Computer Science, 3) Department of Neuropharmacology,
Fukuoka University, 8-19-1 Nanakuma Jonan-ku, Fukuoka 814-0180, Japan
e-mail: [email protected]
Abstract— We report a method for the coacervation micro-encapsulation of several forms of CaCO3 microparticles with the fluoropolymer poly(heptadecafluorodecyl acrylate) (poly (HDFDA)) by pressure-induced phase separation of a supercritical CO2 solution. A suspension of CaCO3 in CO2 and dissolved poly(HDFDA) were mixed in supercritical CO2. After the system pressure was slowly decreased to atmospheric pressure, the microcapsules were obtained. Coacervation was achieved by the precipitation of poly(HDFDA) during the decrease in the pressure of CO2; the solubility of poly(HDFDA) in CO2 decreased with the pressure. The structure and morphology of the microparticles were investigated by using a scanning electron microscope (SEM) and an electron probe microanalyzer (EPMA) equipped with a wavelength dispersive X-ray spectroscope (WDX).
Keywords-component; Supercritical Carbon Dioxide, Microencapsulation, Coacervation, Fluoropolymer, Calcium Carbonate (key words)
1. IntroductionPolymer microcapsules containing inorganic materials are
attracting much attention as the field of supercritical CO2 (scCO2) technology. ScCO2 is the solvent of choice because it is readily available, inexpensive, and environmentally benign. Many investigators have attempted the formation of polymer microcapsules using scCO2 [1–6]. Rapid expansion from supercritical solutions (RESS) is a well-known process, and a variety of polymer microcapsules have been produced with the help of this process by many investigators [2,3,5-9]. However, the RESS process is limited by the low polymer solubility in CO2, caused by its low dielectric constant. Relatively few polymers are soluble in CO2 without a cosolvent. RESS of fluoropolymers such as perfluoropolyether, poly(1,1,2,2-tetrahydroperfluorodecyl acrylate), and poly(heptadeca-fluorodecyl acrylate), which are highly soluble in CO2 at
temperatures near the ambient temperature, produces coating materials [10-12] and submicron to several micron-sized particles and fibers [12,13].
In this work, we try to form microcapsules of CaCO3 and poly(heptadecafluorodecyl acrylate) (poly (HDFDA)) using scCO2. In a previous work[9], we proposed a production method for the fluoropolymer microcapsules of talc particles by pressure-induced phase separation of scCO2. Figure 1 provides a conceptual framework of our proposed process in comparison with the conventional RESS process.
nozzle
RESS(a)
atmospheric pressure
fluoropolymer+ CO2 + CaCO3 at 20 MPa
slow depressurization
atmospheric pressure
coacervation of fluoropolymer
phase separation
(b) PIPS
Fig.1 Principles of the formation of polymer microcapsules of CaCo3 by (a) RESS and (b) pressure-induced phase separation of scCO2 solutions.
In RESS, a supercritical fluid solution is expanded across a nozzle, leading to rapid supersaturation and the production of small particles. After a suspension of CaCO3 in CO2 containing a dissolved fluoropolymer is sprayed through the nozzle at atmospheric pressure, microcapsules and small polymer particles are obtained as shown in Figure 1(a). For the industrial applications, we have to restrict the generation of polymer particles not containing CaCO3 because they degrade the products. Therefore, to prevent the nucleation and the precipitation of polymer particles not containing CaCO3,
Advances in Materials Physics and Chemistry Supplement: 2012 world Congress on Engineering and Technology
Copyright © 2012 SciRes. 181

the pressure is decreased slowly, and microparticles are collected in the high-pressure cell as shown in Figure 1(b).
The objective of this work is to check the feasibility of the pressure-induced phase separation of the scCO2 solution to the formation of fluoropolymer microcapsules of several shapes of particles of CaCO3 and to study the effect of several experimental conditions on particle morphology.
2. Experimental Section
A. Materials CaCO3 was obtained from Shiraish Calcium.Co., Ltd., and
carbon dioxide (CO2) (99.9% minimum purity) was purchased from Fukuoka Sanso Co., Ltd. The fundamental idea and synthesis of poly(HDFDA) was reported by DeSimone et al. [27], and a similar approach based on their method is employed in the present study. The fluoropolymer poly(HDFDA) was synthesized in a high-pressure cell by the free-radical polymerization of a homogeneous solution of the 3,3,4,4,5,5,6,6,7,7,8,8,9,9,10,10,10-heptadecafluorodecyl acrylate (HDFDA) monomer with an azobis(isobutyronitnile) (AIBN) initiator in CO2 for 48 h at 333 K and 20 MPa. AIBN and HDFDA were purchased from Aldrich Co. Upon completion of polymerization, the polymer was precipitated from CO2 directly into a methanol bath. Subsequently, the poly(HDFDA) was washed several times and allowed to dry overnight.
B. Experimental Procedure Known amounts of the fluoropolymer and CaCO3 were
placed in the high-pressure cell (25 cm3) equipped with sapphire windows. The cell was placed in a water bath and the system temperature was maintained at the desired value within +0.1 K. CO2 was pumped through a preheater to the high-pressure cell. The mixture was stirred by a magnetic agitator for 30 min. The system was slowly depressurized for approximately 30 min at the experimental temperature. Following the decrease in pressure, polymer microcapsules were obtained in the high-pressure cell.
The structure and morphology of the products were analyzed using a scanning electron microscope (SEM, JEOL JSM6060) and an electron probe microanalyzer (EPMA; Shimadzu, EPMA 1610) equipped with a wavelength dispersive X-ray spectrometer (WDX). An EPMA equipped with WDX can identify elements through the use of a crystal monochromator to select X-rays of a particular wavelength. For the SEM sample preparation, polymeric microparticles were mounted on a small glass plate covered with a small piece of double-sided carbon conductive tape. The samples were then sputter-coated with silver palladium and imaged using the SEM and EPMA.
3. Results and Discussion
C. Evolution of Microencapsulation. Prior to the experiment for microcapsule formation, the
phase behavior of the CO2 + poly(HDFDA) system at 20 MPa and 313 K was confirmed visually by using a high-pressure
vessel equipped with sapphire windows. Without the CaCO3, the mixtures of CO2 and poly(HDFDA) form a single phase. Details of the phase behavior of the CO2 + poly(HDFDA) system were reported by Blasig et al. [12] Similar phase behaviors for CO2 + poly(1,1-dihydroperfluorooctylacrylate) [14] and CO2 + poly(1,1,2,2-tetrahydroperfluorodecyl acrylate) [13] systems were reported.
SEM photographs of the CaCO3 and the fluoropolymer microcapsule containing CaCO3 that was produced by the pressure-induced phase separation of scCO2 are shown in Figures 2(a) and (b).
(a)
(b) Fig.2 SEM photographs of poly(HDFDA) microcapsules of (a) spheres and (b) whiskers of CaCO3 particles formed by the pressure-induced phase separation of scCO2 solutions. Pre-expansion conditions: temperature, 313 K; pressure, 20 MPa; CO2, 97.9 wt%; poly(HDFDA), 0.20 wt%; CaCO3, 2.1 wt%.
The system was slowly depressurized from 20 MPa to atmospheric pressure for approximately 30 min at 313 K. The spherical particles of CaCO3 and CaCO3 whiskers had a smooth surface. Compared with the SEM photographs of the CaCO3, the microcapsules of the fluoropolymer containing CaCO3 have a similar configuration. The surface morphology
182 Copyright © 2012 SciRes.

of the microcapsules reflects the configuration of CaCO3 in the microcapsules because the coating thickness of CaCO3 is very small. The primary particle diameter (PPD) and particles size distribution (PSD) of CaCO3 and microcapsules were determined by a laser diffraction particle size analyzer (SALD-2000, Shimadzu Co. Ltd.).
The PPD and PSD of spherical particles of CaCO3 are 7.6�m and 0.40, respectively. And the PPD and PSD of microcapsules are 7.7�m and 0.403, respectively. The value of PPD and PSD of the spherical particles of CaCO3 and microcapsules is almost same. We can not observe the change of particle size.
The CaCO3 whiskers were also coated by the fluoropolymer. The surface morphology of the microcapsules reflects the configuration of CaCO3 whiskers in the microcapsules because the coating thickness of CaCO3 is very small. But structure of CaCO3 whiskers coated by the fluoropolymer were more bulky than CaCO3 whiskers.
Further evidence for the formation of fluoropolymer microcapsules of CaCO3 can be obtained using EPMA. The peak corresponding to F caused by the fluoropolymer can be observed for the microcapsules, it cannot be detected for CaCO3 because CaCO3 does not possess F.
The surface distributions of F, O, and Ca were mapped in an EPMA image. Although the distribution of F in the microcapsules was fairly sharp, it was not detected on the CaCO3 surface. On the other hand, the distribution of Ca and O on the CaCO3 surface was sharper and broader. However, the distribution of Ca and O on the microcapsule surface was poorer than that on the CaCO3 surface. It can be considered that CaCO3 was completely encapsulated by a thin fluoropolymer film.
It was difficult to check the coating performance for all the collected microcapsules by using EPMA because in the proposed process, an extremely large number of microcapsules were produced. To evaluate the performance of the polymer coating, we examined the stability of the microcapsules in pure water. The CaCO3 particles or microcapsules were added to pure water (particle concentration: 1 wt%), and the suspended solution was shaken by a mechanical shaker. The stable conditions of the spherical particles of CaCO3 and microcapsules in water were checked. Although the CaCO3 was dispersed in pure water for more than 5 min, all the microcapsules floated on water because of the high water repellency of the fluoropolymer. The density of CaCO3 and microcapsules is almost same (about 2.8 g cm-3), because microcapsules contain more than 90 % CaCO3. Although the density of microcapsules is higher than that of water, the microcapsules floated on the water. It is inferred that bulk density of microcapsules is lower than that of water. It is difficult to penetrate the water to the void between the microcapsules, because of the repellency of fluoropolymer.
The CaCO3 was dispersed in water, because the CaCO3 has hydrophilic surfaces. To check the stability of the microcapsules in pure water, a turbidity measurement was performed using an ultraviolet/visible (UV/VIS) spectrometer at 600 nm wavelength. The turbidity measurement was used
to observe the stability of small particle dispersions [29]. We could not observe the dispersed particles through the stability analysis of microcapsules in water because as in the case of pure water, no turbidity was observed. The stability analysis revealed that most of the CaCO3 particles were coated with the fluoropolymer and were present inside the produced microcapsules.
Fig.3 Stability of microcapsules in pure water. (a) CaCO3 and (b) poly(HDFDA) microcapsules formed by the pressure-induced phase separation of scCO2 solutions. See Fig. 2 for the pre-expansion conditions.
D. Formation Mechanism of Microcapsules. To identify the advantage of the formation mechanism of
microcapsules by the pressure-induced phase separation of scCO2 as compared with RESS, the microcapsules were prepared by RESS. Because RESS is one of the promising methods for the formation of polymer microcapsules and/or composites by using scCO2, several investigators have reported the formation of polymer microcapsules and/or composites by RESS [1,2]. The particle formation mechanism by RESS was analyzed thermodynamically [4]. In this work, we attempted the formation of microcapsules by RESS under the following experimental conditions. The pre-expansion pressure was 20 MPa, and the temperature was 313 K. The feed concentrations of the CaCO3 and the fluoropolymer were 2.1 wt% and 0.20 wt%, respectively. The feed composition in the RESS experiment was the same as that in the experiment on the formation of microcapsules by the pressure-induced phase separation of scCO2. The mixtures of scCO2, the fluoropolymer, and the CaCO3 were expanded across the capillary nozzle (L = 500 mm, D = 1.2 mm) to atmospheric pressure. After the expansion, the microparticles were precipitated. SEM photographs of the fluoropolymer microcapsules produced by RESS and containing CaCO3 were obtained. Compared with the morphology of microcapsules prepared by the pressure-induced phase separation of CO2 as shown in Fig. 2, the polymer particles prepared by RESS were observed on the surfaces of the CaCO3 particles. The polymer
Copyright © 2012 SciRes. 183

does not form a smooth surface at the CaCO3 particles but is adhered as small particles at the surface of the CaCO3.
To examine the coating performance of RESS, the obtained particles were analyzed by EPMA and by performing a stability test in water. F, Ca, and O were detected in the WDX spectrum of the microcapsules. Furthermore, we examined the stability of the microcapsules in pure water to evaluate the performance of the polymer coating. The WDX spectrum and the stability test revealed that most of the CaCO3 was microencapsulated with the fluoropolymer. However, small polymer particles were precipitated on the surface through the RESS process. The formation mechanism of microcapsules and small polymer particles in the RESS process may be considered as follows. During rapid depressurization both the CaCO3 and the polymer precipitate from the solutions. And the CaCO3 particles are formed in the expanding jet. Some polymer coated on the CaCO3 particles, and some fine polymer particles are generated during the deposition. The evidence for the formation of fine polymer particles by RESS can be obtained by performing the RESS experiment without CaCO3. The mean particle diameter was less than 1 �m. With regard to the RESS experiment for the formation of fluoropolymer particles, similar particle morphology was reported by Blasig et al.[12] and Mawson et al. [13] These fine polymer particles precipitated on and adhered to the CaCO3 surface by the supersaturation and homogeneous nucleation of the fluoropolymer that was caused by rapid depressurization. To prevent the formation of polymer particles, we have to inhibit the supersaturation of the solute and the homogeneous nucleation caused by the rapid expansion of CO2. However, it is impossible to prevent the supersaturation in RESS. We can prevent the formation of polymer particles by the pressure-induced phase separation of CO2. Because the depressurizing rate is very slow compared with the conventional RESS process, it is possible to inhibit the large supersaturation of the solute and the homogeneous nucleation of particles. During the slow depressurization, the coacervation was achieved. On the other hands, after the pressure in the high-pressure cell containing no CaCO3 decreased, polymer foams were obtained. With experimental setup, no pure fluoropolymer were formed. It is inferred that the CaCO3 suspended in scCO2 acts as an accelerator for the precipitation of polymer particles and the occurrence of coacervation on the CaCO3 surface. Furthermore, it is very difficult for the microcapsules to produce forms, because the microcapsules contain about 90 % CaCO3. In the conventional coacervation microencapsulation technique, coacervation is induced by a phase separation caused due to a pH change and the addition of a nonsolvent or electrolyte [16]. In contrast, in the present experiment, coacervation was induced by a phase separation caused by a decrease in pressure. 4. Conclusions
The pressure-induced phase separation of scCO2 has been utilized to produce fluoropolymer microcapsules of several shape particles of CaCO3. Prior to depressurization, the polymer and CaCO3 were mixed in scCO2. Fluoropolymer coacervation was achieved during the slow decrease in the
pressure. Following the coacervation, we obtained the fluoropolymer microcapsules of CaCO3. The products were analyzed by SEM and EPMA equipped with WDX. The CaCO3 was completely coated with a thin fluoropolymer film. Compared with the microcapsules formed by RESS, the obtained microcapsules had a smooth surface; fine polymer particles on the CaCO3 surface were not observed.
REFERENCES[1] J. Jung and M. Perrut, “Particle design using supercritical fluids:
Literature and patent survey,” The Journal of Supercritical Fluids, vol. 20, no. 3, pp.179-219, 2001. J. Clerk Maxwell, A Treatise on Electricity and Magnetism, 3rd ed., vol. 2. Oxford: Clarendon, 1892, pp.68–73.
[2] S. D. Yeo and E. Kiran, “Formation of polymerparticles with supercriticalfluids: A review,” The Journal of Supercritical Fluids, vol. 34, no. 3, pp. 287-308, 2005.
[3] E. Reverchon and R. Adami, “Nanomaterials and supercriticalfluids,” The Journal of Supercritical Fluids, vol. 37, no. 1, pp. 1-22, 2006.
[4] J.W.Tom, P.G. Debenedetti, R. Jerome, “ Precipitation of Poly(L-lactic acid) and Composite Poly(L-lactic acid)-Pyrene Particles by Rapid Expansion of Supercritical Solutions.” J. Supercritical Fluids vol.7, 9,1994.
[5] K. Mishima, K. Matsuyama, D. Tanabe, S. Yamauchi, T. J. Young, and K. P. Johnston, “Microencapsulation of proteins by rapid expansion of supercritical solution with a nonsolvent,” AIChE Journal, vol. 46, no. 4, pp. 857-865, 2000.
[6] K. Mishima,”Biodegradable particle formation for drug and gene delivery using supercritical fluid and dense gas, “Advanced Drug Delivery Reviews, vol. 60, no. 3, pp. 411-432, 2008.
[7] K. Matsuyama, K. Mishima, K. Hayashi, and H. Matsuyama, “Microencapsulation of TiO2 Nanoparticles with Polymer by Rapid Expansion of Supercritical Solution,” Journal of Nanoparticle Research, vol. 5, no. 1-2, pp. 87-95, 2003.
[8] K. Matsuyama, K. Mishima, K. I. Hayashi, H. Ishikawa, H. Matsuyama, and T. Harada, “Formation of microcapsules of medicines by the rapid expansion of a supercritical solution with a nonsolvent,” Journal of Applied Polymer Science, vol. 89, no. 3, pp. 742-752, 2003.
[9] K. Matsuyama and K. Mishima, “Coacervation microencapsulation of talc particles with a fluoropolymer by pressure-induced phase separation of supercritical carbon dioxide solutions,” Industrial and Engineering Chemistry Research, vol, 45, no. 18, pp. 6462-6168, 2006.
[10] DeSimone, J. M.; Guan, Z.; Elsbernd, C. S. Synthesis of Fluoropolymers in Supercritical Carbon Dioxide. Science 257, 945-946,1992.
[11] 22 Chernyak, Y.; Henon, F.; Harris, R. B.; Gould, R. D.; Franklin, R. K.; Edwards, J. R.; DeSimone, J. M.; Carbonell, R. G. Formation of Perfluoropolyether Coatings by the Rapid Expansion of Supercritical Solutions (RESS) Process. Part 1: Experimental Results. Ind. Eng. Chem. Res. 2001, 40, 6118..
[12] 23 Blasig, A.; Shi, C. M.; Enick, R. M.; Thies, M. C. Effect of Concentration and Degree of Saturation on RESS of a CO2-soluble Fluoropolymer. Ind. Eng. Chem. Res. 2002, 41, 4976.
[13] 24 Mawson, S.; Johnston, K. P.; Combes, J. R.; DeSimone, J. M. Formation of Poly(1,1,2,2-tetrahydroperfluorodecyl acrylate) Submicron Fibers and Particles from Supercritical Carbon Dioxide Solutions. Macromolecules 1995, 28, 3182.
[14] 28 Luna-Barcenas, G.; Mawson, S.; Takishima, S.; DeSimone, J. M.; Sanchez, I. C.; Johnston, K. P. Phase Behavior of Poly(1,1-dihydroperfluorooctylacrylate) in Supercritical Carbon Dioxide. Fluid Phase Equilibria 1998, 146, 325.
[15] 29 Calvo, L.; Holmes, J. D.; Yates, M. Z.; Johnston, K. P. Steric Stabilization of Inorganic Suspensions in Carbon Dioxide. J.Supercritical Fluids 2000, 16, 247.
[16] J. Lazko, Y. Popineau, J. Legrand, Soy Glycinin Microcapsules by Simple Coacervation Method. Colloids and Surfaces B: Biointerfaces 2004, 37, 1.
184 Copyright © 2012 SciRes.

Synthesis and Electrochemical Characterization ofLi2MnSiO4 with Different Crystal Structure as Cathode
Material in Lithium Rechargeable BatteriesJoongpyo Shim1, Sora Won1, Gyungse Park3, Ho-Jung Sun2
1Department of Nano & Chemical Engineering, Kunsan National University, Gunsan, Jeonbuk, 573-701 Korea2Department of Material Science & Engineering, Kunsan National University, Gunsan, Jeonbuk, 573-701 Korea
3Department of Chemistry, Kunsan National University, Gunsan, Jeonbuk, 573-701 [email protected], [email protected], [email protected]
Abstract—Li2MnSiO4 with different crystal structure wassynthesized by solid state reaction method. Their crystalstructure and electrochemical properties have beencharacterized by X-ray diffraction and charge-discharge test.The material prepared at 900oC in N2 atmosphere had -phaseand its crystal structure changed to �-phase by post-heating at400oC in air after 900oC sintering. In electrochemicalmeasurement, two materials (- and �-phase) showed ~3 and~45mAh/g, respectively. The different capacities of these twomaterials might be due to the change of crystal structure.
Keywords- Li2MnSiO4, crystal structure, cathode, lithiumrechargeable battery
1. IntroductionRecently, the lithium extraction/insertion in polyanion
frame works, for example, (XO4)n- (X = P, S and Si) materials,has been shown by many researchers [1-3]. In particular,LiFePO4 has been intensively studied as possible substitutionfor commercially available LiCoO2. But, its redox voltage andtheoretical capacity have been limited to ~3.5V and 170mAh/g,respectively [4]. One of them, Li2MnSiO4, as cathode materialin lithium rechargeable batteries provides very promisingcandidates to explore in place of LiCoO2 because its hightheoretical capacity of 333mAh/g. The Mn redox couple(Mn2+/Mn4+) is of particular interest due to a high potential (vs.Li/Li+), plentiful resource and environmentally friendlymaterial. Dominko at al. firstly found that only 0.6 Li+ ionscould be extracted at the first cycle, and 0.3 Li+ could bereversibly extracted and inserted at 5th cycle at C/30 rate [5].
Politaev et al. reported the monoclinic Li2MnSiO4 wassynthesized by high temperature sintering instead oforthorhombic structure by low temperature synthesis [6]. Asexplained by them and others [7], monoclinic Li2MnSiO4 is asuperlattice of the high temperature orthorhombicLi2(4b)Li(2a)PO4, where Mn2+ ions are located in the 2atetrahedral sites within the [SiO4]4- anionic silicate frameworkthat replaces the [PO4]3- anionic phosphate framework. Manystudies showed that it was difficult to form pure orthorhombicLi2MnSiO4 from low temperature synthesis below 800oC [8,9].
There are few studies on two forms of Li2MnSiO4 onelectrochemical characteristics. The aim of this work is toreport the crystal structure change and the electrochemicalproperties of Li2MnSiO4 powders synthesized by differentprocesses.
2. ExperimentalLi2MnSiO4 was prepared using solid state reaction as
following process. Starting materials were lithium hydroxide(LiOH, Aldrich), manganese carbonate (MnCO3, Aldrich) andfumed silica (SiO2, Aldrich). Stoichiometric amounts of allprecursors were weighed, grinded and mixed in mortarhomogeneously. Thereafter, the product was dried at 100oCand then slowly heated to 900oC for 12h under nitrogenatmosphere to avoid the oxidation of Mn ion from Mn2+ toMn3+ or Mn4+ by the reaction with oxygen [5]. Additionalprocess, post heating at 400oC for 5h in air, was conducted tochange crystal structure of Li2MnSiO4. Weight loss duringheat-treatment was determined by thermal gravimetricanalysis (TGA, TA Instrument).
The crystal structures of samples were identified by X-raydiffraction (XRD, PANalytical, EMPYREAN) in Cu K �radiation. The sample morphology and the chemicalcomposition were analyzed by using a field emission scanningelectron microscope (FE-SEM, FESEM, Hitachi, S-4800) withenergy dispersive X-ray spectroscope (EDS, Horiba, EX-250).
The electrode for electrochemical testing was preparedfrom 70 wt% Li2MnSiO4, 20 wt% carbon (Super-P) asconductive agent, and 10 wt% PVdF as binder. Firstly, allmaterials were mixed in NMP (1-methyl-2-pyrrolidone,Aldrich) for 10h by ball-mill and then cast on an Al foilcurrent collector (20 m). The electrodes were dried at 120oCunder vacuum to remove solvent and stored in an Ar-filledglovebox. Electrochemical measurements were carried out onCR 2032 coin cell (Hoshen) which was assembled in glovebox.The electrolyte was 1.0M LiPF6 in a mixture (1:1:1) ofethylene carbonate (EC), ethyl methyl carbonate (EMC) anddimethyl carbonate (DMC) (Technosemichem). The coin cellswere assembled with lithium foil (Aldrich) as negativeelectrode and polyprolylene separator (Celgard). The charge &discharge tests were performed using a battery cycler
�����������������������������������������!�������"� �� �#�����������������$���������������%��������
���������� �� �������� �+)

(WBCS3000, WonAtech) in the voltage range of 2.0 – 4.7V(vs. Li/Li+) at room temperature.
3. Results and DiscussionTGA was carried out to observe the weight loss of
precursors and the starting synthesis temperature, as shown inFig. 1. The mixture of precursors lost about 20% weightaround 300oC, which was assigned to the evaporation of CO2and H2O. And then, the weight of precursor decreased slowlyuntil 700oC. Therefore, it assumes that the formation ofLi2MnSiO4 starts above 700oC.
Figure 1. Thermogravimetric analysis of the mixture of precursors under N2
atmosphere.
Fig. 2 shows XRD patterns of Li2MnSiO4 sintered at900oC in N2 for 12h, and post-heated at 400oC in air for 5hafter sintering. The XRD pattern of Li2MnSiO4 obtained after900oC sintering indicates the formation of monoclinic (spacegroup P21/n) structure ( -phase). To get pure orthorhombicLi2MnSiO4 from monoclinic phase, post-heating process wasconducted at 400oC in air for 5h. As shown in Fig. 1 (b),disappearing the diffraction peaks for (110) and (101) afterpost-heating in air, orthorhombic Li2MnSiO4 (� -phase, spacegroup Pmn21) was clearly formed.
Figure 2. XRD patterns of Li2MnSiO4 sintered (a) at 900oC in N2 for 12hand post-heated (b) at 400oC in air for 5h after sintering.
The lattice parameter [a = 6.3113Å, b = 5.3805Å, and c =4.9924Å] of �-Li2MnSiO4 material was calculated by Rietveldrefinement analysis and are consistent with values publishedby others [10,11].
The change of morphology for the Li2MnSiO4 before andafter post-heating was examined by FE-SEM and shown in Fig.3. Li2MnSiO4 does not have uniform size distribution with aparticle diameter of approximately ~1 � m containingnanosized particles (~100nm). A dramatic change ofmorphology after post-heating was not observed in Fig. 3 (b).Bigger size particles (>1�m) are insufficiently conductive toallow for lithium ion diffusion and electric connection becausevery low conductivity of Li2MnSiO4. Therefore, carboncoating or incorporation should be considered the increase theelectric conductivity and ion diffusivity [12]. EDS analysiswas used to investigate a qualitative atomic composition andthe results are shown in Fig. 4. The content of Mn and Si isalmost same and is not changed after post-heating.
(a)
(b)
Figure 3. SEM images of Li2MnSiO4 (a) before and (b) after post-heating at400oC.
�����������������������������������������!�������"� �� �#�����������������$���������������%��������
�+& ���������� �� ��������

(a) (b)
Figure 4. EDS analysis of Li2MnSiO4 (a) before and (b) after post-heating at400oC.
Fig. 5 shows the charge-discharge behaviors of synthesizedtwo Li2MnSiO4 materials at room temperature. -Li2MnSiO4had ~3mAh/g of discharge capacity, even though itstheoretical capacity is 333mAh/g as 2 moles of Li+ areextracted from formula unit. The discharge capacity wasincreased dramatically changing crystal structure from -phaseto � -phase. � - Li2MnSiO4 shows ~45mAh/g of dischargecapacity which is 15 times higher than -Li2MnSiO4. Very lowcapacities of two materials are attributed to extremely lowelectric conductivity of Li2MnSiO4 (3 x 10-14 Scm-1) [13]. Toincrease the electric conductivity of active material, carbonwas coated on the surface conventionally. However, severalstudies reported that uncoated Li2MnSiO4 usually had verylow capacity [14,15].
Figure 5. Charge-discharge curves of -Li2MnSiO4 synthesized at 900oC,and �-Li2MnSiO4 post-heated at 400oC after 900oC sintering.
In the charge-discharge profiles of two materials, � -Li2MnSiO4 has two plateaus during cycling, but -Li2MnSiO4
does not. dQ/dV plots of �-Li2MnSiO4 was shown in Fig. 6 toidentify the potentials of plateaus. The peaks may correspondto the voltages plateaus of the Mn2+/3+ and Mn3+/4+ redoxcouples. � -Li2MnSiO4 shows one sharp cathodic peak at~2.9V, and two small peaks at ~4.0 and ~4.1V during firstcharge. In contrast, -Li2MnSiO4 does not show any peakduring both charging and discharging (not shown). At secondcycle, the cathodic sharp peak moved from ~2.9V to 3.0V, butthe anodic peak did not. Arroyo-de Dompablo et al. calculated
average lithium extraction voltage from Li2MSiO4 (M = Mn,Fe, Co and Ni) [16]. They observed that in all cases extractionof the second lithium ion may occur at very high voltage(>4.5V) except for Li2MnSiO4, existing the possibility of thedecomposition of LiPF6 based electrolyte. But, by theircalculation, the first and second lithium ion extraction fromLi2MnSiO4 occurred at 4.1 and 4.5V, respectively.Muraliganth et al. reported Li2MnSiO4 showed a singlecathodic peak at ~4V and broad anodic peak at ~3V at firstcycle [17]. However, it did not exhibit a sharp peak at secondcycle, assuming structural rearrangement and conversion ofthe crystal structure into an amorphous phase during the firstcharge. Similar behavior was observed in the results of Yang’sgroup [11]. They reported that no strong peaks from XRDresults could be observed when the electrodes were dischargedbelow 3.2V. Unlike their results, our �-Li2MnSiO4 had clearlysharp peaks at second cycle because its structure still hadcrystallinity. However, we did not find any evidence orexplanation for first peaks around 2.8~3.0V in our � -Li2MnSiO4, which was reported in many literatures. We arestill trying to define for that. Conclusively, the lithiumextraction from �-Li2MnSiO4 is more effective than that from -Li2MnSiO4. Politaev et al. reported that the two structuretypes differed in their mode of connecting tetrahedral and inconnectivity of their rigid part, (MnSiO4)2- [6]. The � -Li2MnSiO4 structure is layered (2D) whereas -Li2MnSiO4structure is a framework (3D). They also described that theformer had more freedom for Li+ ion motion and, possibly, forMn displacement into octahedral voids. In our work, thedifference between two structures on electrochemical propertymay be attributed to same reason why they suggested.
Figure 6. dQ/dV plots for charge-discharge curves of �- Li2MnSiO4.
4. ConclusionsA solid state reaction method has been used to synthesize
Li2MnSiO4 with different crystal structure and with a minimallevel of impurities. -Li2MnSiO4 has been produced by hightemperature sintering at 900oC and then post-heating at 400oCchanged its crystal structure from -phase to � -phase. Inelectrochemical measurement, two materials (- and �-phase)
�����������������������������������������!�������"� �� �#�����������������$���������������%��������
���������� �� �������� �+'

showed ~3 and ~45mAh/g, respectively. In the charge-discharge profiles of two materials, � -Li2MnSiO4 had twoplateaus during cycling, but -Li2MnSiO4 did not. Thedifference between two materials on electrochemical propertymay be attributed to the crystal structure because �-phase hadmore freedom for Li+ ion motion than -phase.
5. AcknowledgmentThis work was supported by R&D Program through the
National Fusion Research Institute of Korea (NFRI) funded bythe government funds.
REFERENCES[1] W.-J. Zhang, J. Power Sources 196 (2011) 2962–2970.[2] M. S. Whittingham, Chem. Rev. 104 (2004) 4271-4301.[3] Z. Gong, Y. Yang, Energy Environ. Sci. 4 (2011) 3223-3242[4] T. Ohzuku, A. Ueda, J. Electrochem. Soc., 141 (1994) 2972-2977.
[5] R. Dominko, M. Bele, A. Kokalj, M. Gaberscek, J. Jamnik, J. PowerSources, 174 (2007) 457-461.
[6] V.V. Politaev, A.A. Petrenko, V.B. Nalbandyan, B.S. Medvedev, E.S.Shvetsova, J. Solid State Chem. 180 (2007) 1045–1050
[7] P. Tarte, R. Cahay, C. R. Acad. Sci. Paris C 271 (1970) 777.[8] M.E. Arroyo y de Dompablo, U. Amador, J.M. Gallardo-Amores, E.
Moran, H. Ehrenberg, L. Dupont, R. Dominko, J. Power Sources 189(2009) 638–642.
[9] J. Kim, J. Shim, G. Park, H.-J. Sun, J. Kor. Int. Electrical & EelectronicMater. Eng, 25 (2012) 398-402
[10] N. Kuganathan and M. S. Islam, Chem. Mater. 21 (2009) 5196–5202.[11] Y. X. Li, Z. L. Gong, Y. Yang, J. Power Sources 174 (2007) 528-532.[12] Z. Chen, J. R. Dahn, J. Electrochem. Soc. 149 (2002) A1184-A1189[13] A. Kokalj, R. Dominko, G. Mali, A. Meden, M. Gaberscek, and J.
Jamnik, Chem. Mater., 19 (2007) 3633.[14] I. Belharouak, A. Abouimrane, K. Amine, J. Phys. Chem. C 113 (2009)
20733–20737.[15] V. Aravindan, K. Karthikeyan, S. Amaresh, Y.S. Lee, Electrochem.
Solid-State Lett. 14 (2011) A33-A35.[16] M.E. Arroyo-de Dompablo, M. Armand, J.M. Tarascon, U. Amador,
Electrochem. Comm. 8 (2006) 1292–1298[17] T. Muraliganth, K. R. Stroukoff, and A. Manthiram, Chem. Mater. 22
(2010) 5754–5761
�����������������������������������������!�������"� �� �#�����������������$���������������%��������
�++ ���������� �� ��������

Kinetic Study of Sulfur Dioxide Elimination by Limestone through the Lab Scale Circulating Fluidized Bed Combustor
Dowon Shun*, Dal-Hee Bae *, In-Kyu Jang**, Keon-Hee Park** and Seung Kyu Park**,†
*Greenhouse Gas Research Center, Korea Institute of Energy Research, 71-2 Daejon 305-343, Korea
**Department of Chemical Engineering, Hoseo University, Asan 336-795, Korea
Email : [email protected]
Abstract—Characteristics of sulfur dioxide emission from coal and petroleum coke combustion were examined in a lab scale circulating fluidized bed (CFB) combustor. The rate constant of the first order rate expression for the absorption SO2 on the CaO surface was similar regardless of the origin of the limestone, the particle size and the initial SO2 concentration. However, the total SO2 absorption capacity was different depending on the origin of the limestone. The breakability of the particle which provides new surface for the reaction seems to play a major role in the absorption characteristics.
Keywords-Sulfur Dioxide (SOx); Limestone; Circulating Fluidized Bed Combustor; Emission; Kinetics; First order reaction
1. IntroductionSulfur oxides (SOx) gases form when the coal and heavy
oil are burned. The SO2 readily dissolves in water vapor and leads to the formation of acid and interacts with other gases and particles in the air to form sulfates and other products that can be harmful to people and environment [1,2]. SO2 pollution is thought to promote wheezing, bronchial constriction, shortness of breath, and exacerbation of asthma [2]. Nitrogen oxides (NOx) are highly reactive gases that contain nitrogen and oxygen in varying molecular combinations. The major source of NOx is the combustion of fossil fuels such as coke in electric power plants or petroleum in vehicle engines [3]. Many of the nitrogen oxides are colorless, but nitrogen dioxide (NO2) combined with particles in the air can cause a reddish-brown haze. The presence of NOx leads to a variety of environmental problems such as ground level ozone, acid rain and the deforestation by acid rain. They are poisonous for the respiratory system, provoking both lung infection and respiratory allergies. Both sulfur dioxide and nitrogen oxides contribute to acid rain [4]. Just a few decades ago, SOx and NOx pollution had gotten so bad that acid rain had damaged countless buildings, monuments, car finishes [5]. One member of the NOx family, nitrous oxide (N2O), is a potent greenhouse gas [6]. Air pollution caused by SOx and NOx, which are largely the result of industrial processes, may also produce
environmental impacts. For these reasons, SOx and NOx emissions should be eliminated.
In the field of fluidized bed combustion with high thermal capacities, circulating fluidized bed (CFB) reactors are considered to be the most efficient commercial utility which burns various solid fuels, including coals, with a minimum operation and maintenance cost [7-9]. The reactors are usually lack of sulfur capture facilities, such as flue gas treatment, since the in-situ SO2 capture by the limestone injection into the combustor itself is sufficient to comply with the regulation. Although the best operation parameters for the boilers could be collected from the actual experience of the commercial scale boilers [10], the information is not always intuitive since the parameters of the commercial boilers in operation are normally interrelated. It is quite difficult to understand the actual effects of specific variables on the performance of the commercial boiler in operation. On the other hand, many experimental results from previous researches were carried out with packed bed units in small scale and turned out to be impractical to be applied to the commercial CFB boilers [3]. To investigate the emission characteristics of CFB systematically, a CFB combustor was built in-house grade. Many researchers have been performed in conventional air-combustion fluidized bed boilers to eliminate the SOx by limestone flux, and much information has been accumulated through the kinetic and spectroscopic studies, many basic questions still remain to be answered clearly. The emission of SOx and NOx gases during the combustion of coal or petroleum pitch in the CFB has been studied. The aim of this study is to elucidate the absorption of SO2 by three kinds of limestone produced from Tanyang, Samchuk and Jinsan in Korea. Emission of SOx and NOx in the CFB and reaction of them with limestone have been investigated.
2. Experimental
A. Circulated fluidized bedThe circulated fluidized bed (CFB) combustor was
prepared with quarts tubes [8-10]. The CFB combustor consists of a riser (combustion chamber) and a cyclone, a loop seal and an ash classifier. The silica sand in the riser was heated to more than 900 ºC and was blown upward by the combustion air from
Advances in Materials Physics and Chemistry Supplement: 2012 world Congress on Engineering and Technology
Copyright © 2012 SciRes. 189

the bottom of the riser to the top. Since the heat generated from the combustion of coals was not sufficient to sustain the desired combustor temperature, multi sets of electric heaters were installed around the outer side of the test unit.
B. Sulfur dioxide capture by limestone and analysisTest coal samples were screened with the particle size
between 0.1-0.7 mm. In the combustion experiments were tested five different coal samples;
1) Blair Athol coal: a bituminous coal from Australia
2) Herbei coal : a high sulfur bituminous coal widely used in the power industries of China
3) Shenhwa coal : a low sulfur, high heating value coal from China
4) Tokye coal : a Korean anthracite
5) Petroleum coke : a byproduct from a Korean refinery
The combustor installed with bed materials was heated with air only to the pre specified temperature by electric heaters. As the temperature of the combustor reached the pre-set value, the coal was fed into the bottom of the riser. While the coal was burned inside of the riser, the ashes were entrained to the top of the combustor and led to the cyclone. The particles except very fine ashes were collected by the cyclone and recycled to the riser through the return leg. The particles were circulated between the riser and the return leg until the combustion is completed and the particle size is reduced enough to flow out of the cyclone to the bag filter. The effluent from the cyclone to the bag filter was analyzed by the URAS Model 14-1, 14-2 of ABB Hartman and Braun to measure the levels of SO2, NOx, N2O, CO, CO2, and O2. The limestone was feeding by 50g to CFB reactor. The limestone was calcined in a muffle furnace at 900 ºC for 2 hours.
3. Results and Discussion The design specifications of the CFB are listed in Table 1.
In the combustion test of coal samples, only the air/fuel ratio was varied while the operation temperature is fixed. However both the operation temperature and the air/fuel ratio were fixed for the investigation of the sulfur capture kinetics. Furthermore the variation of the reactor temperature and the air/fuel ration were restricted to be varied within the precision limit of the facility while the coal feed rate was varied between 0.1 and 0.2 kg/min.
Table 1. Design specification of the quartz CFB.
Parameter Minimum Maximum Coal, kg/h 0.16 0.24
Air flow LPM @ stp 22 28 O2 in flue gas, % 2 7
Velocity of gas, m/s 5 6 Average bed temp, K 1123 1173
Table 2 presents the compositions of each Korean limestone utilized in the experiment. All three samples are typical commercial products and currently used for the commercial CFB boilers in Korea. The CaO contents were between 51-55%, and the purities were similar. Limestones were activated after the calcinations in the CFB combustor. Figure 1 shows the SEM images of the Jinsan limestone before and after the calcination. The limestone was calcined in a muffle furnace at 900 ºC for 2 hours. After the calcination, CO2 on the CaCO3 was detached and the CaO surface was exposed with the generation of many small pores. The wrinkled CaO surface was known to provide SO2 absorption sites on which reactions occur [3, 4].
Table 2. The main composition of three limestones.
Limestone Component
Tanyang Samchuk Jinsan
CaO 53.13 54.25 51.6
MgO 0.94 0.36 0.39
CO2 42.72 42.97 40.92
(a)
(b)
Figure 1. SEM image of T limestone (a) before and (b) after calcination.
Table 3 presents the BET surface analysis by a Quantachrome Autosorb 1 with the absorption of nitrogen gas at its boiling temperature.
Table 3. BET surface analysis of limestone.
Sam- CaCO3 CaO after calcination
190 Copyright © 2012 SciRes.

ple Area (m2/g)
Vol. (cm3/
g)
Pore dia.
(�m)
Area (m2/g)
Vol. (cm3/
g)
Pore dia.
(�m)
Tan-yang 0.53 0.15 1.13 6.77 2.21 1.30
Sam-chuk 0.28 0.09 1.30 11.24 3.66 1.30
Jin-san 0.41 0.12 1.17 1.85 0.59 1.28
(a)
0
100
200
300
400
500
0 1 2 3 4 5 6 7
O2[%]
Emisison[[email protected]%O2]
NOx
N2OSO2
(b)
0
100
200
300
400
500
600
0 1 2 3 4 5 6
O2[%]
Emisison[[email protected]%O2]
7
N2ONOx
SO2
Figure 2. The effects of the aeration on the emissions of SO2, NOx and N2O from the combustions of (a) the Blair Athol coal and (b) the Tokye coal.
In the Blair coal combustion, about 280 ppm of SO2 emission was slightly decreased to 200 ppm as the oxygen content increases. Meanwhile, the N2O emission was slightly increased from 110 ppm to 310 ppm as the oxygen feeding was increased. In the Tokye coal combustion, the SO2 emission gradually was decreased from 500 ppm to 400 ppm as the oxygen feeding increases. Figure 3 shows the variation of CaO conversion rate of Tanyang limestone as the reaction goes by. The comparison was made among different average particle sizes. The maximum conversion rates were observed when CaO conversion, XCaO, was 0 - 0.1. After that it decayed rapidly.
0
0 .5 x1 0 -5
1 .0 x1 0 -5
1 .5 x1 0 -5
2 .0 x1 0 -5
2 .5 x1 0 -5
0 0 .0 5 0 .1 0 .1 5 0 .2 0 .2 5X C aO
1 .4 -0 .2
0 .2 -0 .0 8
0 .0 8 -0
dFSO[mol/s]
2
Figure 3. Variation of CaO conversion rate with respect to the particle size of Tanyang limestone.
CaSO4 layer is formed after SO2 gas is absorbed on the CaO
surface, the surface larger of CaSO4 molecules will block further absorption of SO2 to inner CaO site. So the ash diffusion model is excluded. The reaction must be either controlled by the gas film diffusion or chemical kinetics. In this experiment the large mass of CaCO3 is introduced to provide infinite reaction surface. The external transport rate will be same for all the experiment and will not affect the reaction rate. The gas film diffusion control mechanism and the chemical reaction control mechanism were compared and the chemical reaction control showed better fit to the data.
A second order absorption kinetics was proposed to analyze the experimental data.
CaOSO CkCr2
Where, r ; SO2 absorption rate [gmol SO2/gmol limestone-s]
; 2nd order rate constant [liter/gmol CaO-s] k
; Concentration of CaO CaOC
[gmol CaO/ gmol limestone]
; Concentration of SO2 at the combustor exit
[gmol SO2/liter]
2SOC
The kinetic equations can be restated as;
CaOSOSO FkCdF22
Where CaOSO dFdF 2
[gmol SO2/s]
Since the excess amount of CaO was injected in the reactor. The concentration of CaO in the circulating fluidized bed combustor is considered to be constant and the reactor is considered as a mixed reactor regarding CaO. The reactor equation is the first order only to the concentration of SO2.
2' SOCkr Where, ; 1st order rate constant [1/s]. 'kWhen the SO2 absorption rate of limestone with different
origin is compared, the Jinsan limestone showed the highest rate constant and that of Samchuk showed the lowest constant.
Copyright © 2012 SciRes. 191

Sulfur elimination by limestone under CFB combustion conditions is the net effect of a competition between sulfur capture and sulfur release during which the composition of the Ca surface changes continuously between CaO, CaS and CaSO4. Therefore, we conclude that the limestone feeding is enough to capture all SO2 gases, so the reactions become depend on the concentration of SO2. And the reaction can be disrupted by the formation of CaSO4 after reaction goes by.
For understanding of SO2 gas adsorption onto limestone, the chemical reaction model should be studied [5, 12]. For the comparison of the rate controlling step, we postulate that the particle is a globular shape at the shrinking core model during the adsorption of gas onto the particle.
At the reaction : A (gas) + B (soild) -> Solid Products
4. ConclusionThe CaO contents of three kinds of limestone were between
51-55%. The BET surface area of Samchuk limestone was increased about 40 times after calcinations. The surface area of Samchuk CaCO3 was increased from 0.28 m2/g to 11.24 m2/g after the calcinations to CaO at 900 oC for 2 hours at the CFB combustor. Based on the kinetic study of SO2 gas adsorption to CaO solid, the CaO conversion curve fits with respect to the reaction time. Since the slope of time versus is linear and close to 1, it follows gas film diffusion control. We suggest that the reaction is the first order. Since the limestone feeding is enough to capture all SO2 gases, the reaction become depend on the concentration of SO2. And the reaction can be disrupted by the formation of CaSO4 after reaction goes by.
In the case of kinetic control, REFERENCES
[1] F. Garcia-Labiano, A. Rufas, L. F. de Diego, M. de las Obras-Loscertales, P. Gayan, and J. Adanez, Fuel, 90, 3100 (2011).
Therefore, [2] G. Ozkan, and G. Dogu, Chem Engineering and Processing, 41, 11 (2002)
[3] S. K. Park, V. Kurshev, Z. Luan, C. W. Lee, and L. Kevan, Micropor. Mesopor. Mater., 38, 255 (2000).
[4] D. R. M. Wright, F. Pinto, L. Armesto, M. A. Caballero, M. P. Aznar, A. Cabanillas, Y. Huang, C. Franco, I. Gulyurtle, and J. T. McMullan, Fuel Processing Technol. 87, 793 (2006).
Figure 4 shows the CaO conversion curve fitting with
respect to the reaction time. It is clearly seen that the slope of time versus is linear and close to 1, the reaction follows gas film diffusion control.
[5] M. Higashi, S. Uchida, N. Suzuki, and K. I. Fujii, IEEE Trans. on Plasma Sci., 20, 1 (1992)
[6] D. Shun, D. H. Bae, J. Y. Paek, and Y. S. Park, Korean J. Chem. Eng., 21, 890 (2004).
[7] D. Shun, D. H. Bae, K. H. Han, S. H. Cho, and S. Y. Lee, HwahakKonghak 40, 345 (2002).
[8] D. R. M. Wright, F. Pinto, L. Armesto, M. A. Caballero, M. P. Aznar, A. Cabanillas, Y. Huang, C. Franco, I. Gulyurtle, and J. T. McMullan, Fuel Processing Technol. 87, 793 (2006).
[9] K. Redemann, E. U. Hartge, and J. Werther, Fuel, 87, 3669 (2008). [10] D. Shun, H. S. Chang, T. S. Park, D. H. Bae, and G. T. Jin, Korean J.
Chem. Eng., 18, 630 (2001). [11] P. Gayan, J. Adanez, L. F. de Diego, F. Garcia-Labiano, A. Cabanillas,
A. Bahillo, M. Aho, and K. Veijonen, Fuel, 83, 277 (2004). [12] L. Jia, J. Wang, and E. J. Anthony, Chem. Eng. J., 94, 147 (2003).
Figure 4. CaO conversion curve fitting to the shrinking core model.
192 Copyright © 2012 SciRes.

Research of Extent of Well Control of Explored Reserves ofLithologic Deposit in Delta Front Area
Ma DongNO. 9 Oil Production CompanyDaqing Oilfield Company Ltd.
Daqing, [email protected]
Abstract—Recently the explored reserves submitted in the oil field mainly situate at the end of deposit in delta front area.During the exploitation and production, problems mainly show on lithologic deposit, for example, reserves are low and difficultyof producing is huge. Based on results of sand body dissection of dense well network of developed oil deposit, and combined withexplored reserves, this article researches a relation between extent of well control and reserves precision of explored reserves oflithologic deposit in delta front area by well diluted method. This article has significant influence on objectively understandingour unexploited reserves
Keywords-Delta Front; Lithologic Deposit; Extent of Well Control; Well Diluted Method
1. IntroductionTill the end of 2008, the amount of our explored but
unexploited geologic reserves are 2.5122×10⁸ tons, including70.22% unexploited reserves in Putaohua layer of main layer.This part of reserves are mainly distributed in delta front areawhere is far away from source, sand body is scattered, and themain type of reservoirs is small-sized lithologic deposit.
Submission of explored reserves should satisfy therequirement that completed wells satisfy development planand can control productive limit or l-aqueous interface. Thereshould be a reasonable extent of well control: relatively highextent causes invention waste and delay of exploration oflithologic deposit; relatively low extent cannot control changeof lithologic deposit. Currently, the submitted exploredreserves are generally with low extent of well control and hardto effectively control highly hidden lithologic deposit withscattered sand body. Besides, affected by seismic resolution,reservoir forecasting techniques cannot efficiently recognizethin interbeded reservoir, causing low developing degree ofreserves.
This article bases on results of sand body dissection ofdense well network of Longhupao oil field, Longnan oil field,Putaohua oil field and Gaoxi oil field, applies well dilutedmethod, and researches a relation between extent of wellcontrol and reserves precision of explored reserves oflithologic deposit in delta front area.
2.Research of Extent of Well Control ofLithologic Deposit
A. Characteristics and types of lithologic depositPutaohua layer is mainly located in delta front area; the
proportion of its sand ground is moderate; it is oily in widearea, and the type of oil reservoir is mainly lithologic deposit.According to the planform of sand body of reservoir storage,lithologic deposit can be separate into three types: lenticularsand reservoir, banded sand reservoir, and sheet sand reservoir.
Lenticular sand reservoir is mainly located in abandonedchannel, mouth bar, and distal bar developing. Sand body issurrounded by non-permeable mudstone; it has independentoil-water systems; oil area is small; the plane distributesseparately; sand drilling rate is low, about 30%. Statistics ofthe accurate dissection of dense well of oil field indicates thatthe width of lenticular sand body ranges from 100 to 300meters, and evaluation well is uneasy to be controlled.
Banded sand body reservoir is mainly distributed inchannel sand developing area. Space among channels is filledwith thin-bed sand sheet or mudstone; aeolotropism of plane ishigh; strike direction of sand body extends far, and sideway isnarrow. Sand drilling rate of sandstone generally ranges from30% to 40%. Statistics of the accurate dissection of dense wellof oil field indicates that the width of banded sand body isbetween 100 and 350 meters.
Sheet sand reservoir is mainly distributed in sand sheetdeveloping area. The area is large, thickness keeps steady, andSand drilling rate of sandstone is usually over 60%. Statisticsof the accurate dissection of dense well of oil field indicates
�����������������������������������������!�������"� �� �#�����������������$���������������%��������
���������� �� �������� �*�

that the width of sheet sand body is between 300 and 600meters, which means evaluation well is easy to be controlled.
B. Analysis of current situation of extent of well control ofdeveloped lithologic depositThe oil field was producing explored reserves of lithologic
deposit of Putaohua layer in delta front area, due to low extentof well control, we suffered some problems, for example,producing degree of reserves is low and adjustment ofdeliverability construction is frequent.
Gaoxi oil field finished drilling 22 evaluation wells in1983, and submitted 1100.00×104t of triple IOIP, in which theoil area is 53.0km2, and the extent of well control is 0.42 wellper km2. In 1994, we designed 104 drilling wells, in which 8were finished drilling. After drilling first well and researchagain, we revised plan: planned well sites were 73 and 31were canceled. During the exploitation of drilling wells,according to understanding of rolling drilling geology, wecanceled 23 planned wells. In 2002, we recalculated reserves:oil area is 26.8km2, finished drilling wells are 25, and theextent of well control is 1.12 well per km2. From the historyof adjustment, reserves changes with the change the extent ofwell control.
22 wells in Gulong oil field Gu 571 block were finisheddrilling in 2007. In explored reserves, the amount of oil area is46.7km2, and the extent of well control is 0.47 well per km2.After finishing drilling 97 wells, according to principle ofcontouring of productive limit of explored reserves,preliminary oil area was cut into 29.8km2, and the extent ofwell control was raised to 2.5 wells per km2. One well in Gao20 district was finished drilling in 2007, in which the oil areais 4.5km2, and the extent of well control is 0.22 well per km2.8 wells were rolling drilling in 2009, footage is 14855 meters,and the extent of well control was raised to 2 wells per km2.Preliminary the amount of oil area was 1.38km2, exploredreserves 41.85×10⁴t, and average reserves is 0.0028×10⁴t permeter of footage. Because of the low extent of producingreserves, the risk of exploitation is huge.
C. Relation between extent of well control and reserves precision ofexplored reservesReasonable extent of well control is a key to explore
reservoirs and to effectively exploit. Especially, using thelocation of evaluation wells to evaluate lithologic deposit inreservoir bed with multivariant lithologic characters can hardto understand rules of geology, thus bringing big exploitationrisks. On the contrary, to small-sized lithologic deposit,unreasonable extent of well control often causes excess ofdrilling wells.
Calculation formula of IOIP by volumetric method:
N=100^oAoh 1-SWi /Boi
Parameters description: N,IOIP, 104t; Ao,Oil Area, km2; h,Effective Thickness, m; , Active Porosity, <0; SWi, Initialwater saturation; ^o, the density of STO, t/m3; Boi, Oil VolumeFactor, m3/m3;
According to parameters in formula, the extent of wellcontrol has different influence extent on different sandstonestypes of lithologic deposit.
To lensing reservoir, because the area is small, influenceon reserves by extent of well control is mainly variation of oilarea (Ao); to banded sand body reservoir, due to its bandeddistribution, influence on reserves by extent of well control ismainly variation of oil area (Ao) either; And to sill-likereservoir, since its reservoirs are well continued and area is big,influence on reserves by extent of well control is mainlyvariation of Effective Thickness (h).
In order to study the relation between extent of wellcontrol and reserves precision of explored reserves oflithologic deposit, we start at results of the accurate dissectionof dense well of sand body of Longhupao oil field, Gaoxi oilfield, Longnan oil field, and Puxi oil field, and expand ourresearch by using well diluted method. This article, starting atextent of well control 16 wells per km2, made statistics ofproportions of omission of sandstone under different extent ofwell control. (Figure 1).
According to figure 1, when extent of well control reaches6.25 wells per km2, the proportion of omission of sandstone isabout 50%. Therefore, to control sand body above 50%, theextent of well control cannot be below 6.25 wells per km2.
In order to explain that different extent of well control hasdifferent influence on reserves precision, we selected 4 oilfields with 49 typical lithologic deposits in different types, andfinally made statistics and regression of errors in exploredreserves under different extent of well control. (Shown inchart 1).
Errors in reserves of three types of lithologic depositsbecome larger with decreases in extent of well control.Besides, extent of well control affects reserves precision ofsill-like reservoir less than affects that of lensing reservoir andbanded reservoir.
In light of the different requirements to errors in exploredreserves with various levels, we can summarize extent of wellcontrol of explored reserves with different kinds of reservoirs.
Worthy to mention that the winding of rivers causesdiversification and irregularity of lithologic deposits,especially banded reservoir. This evaluation of reservoirs isnot fully applicable to conventional standard well network.Thus, people should flexibly design pattern configuration indifferent types of reservoirs by utilizing research findings ofextent of well control. It has been found that it is better to usewell network with regular dimensions in sill-like reservoir butto use “S” pattern in banded reservoir----well spacing canexpands along with strike direction of sand body whilehorizontal distance is better to be limited within the width ofwave of sand body, not only accelerating evaluation but alsowell controlling oil area and improving evaluation precision.
Author:(1977-),male, Nongan Jilin province, engineers,engaged in development of oilfield. E-mail:[email protected]. TEL:18945972977
�����������������������������������������!�������"� �� �#�����������������$���������������%��������
�*( ���������� �� ��������

3.Conclusions & SuggestionsD. Conclusions
First, in delta front area, the width of lenticular sand bodyreservoir ranges from 100 meters to 300 meters, banded sandbody reservoir from 150m to 350m, and sheet sand bodyreservoir from 300m to 600m.
Second, producing degree of explored reserves oflithologic deposits in delta front area mainly depends on extentof well control. In order to control sand body above 50%, theextent of well control cannot be below 6.25 wells per km2.
Third, according to different requirements to reservesprecision with different level, lower limit of extent of wellcontrol of explored reserves of lensing reservoir, banded
reservoir and sill-like reservoir is 8.2 well per km2, 6.25 wellsper km2, and 1.8 wells per km2 respectively.
E. suggestionsIn exploitation and production of explored reserves in delta
front area, we should firstly develop well enhance extent ofwell control and strengthen geology knowledge, and thendevelop exploitation wells and decrease drilling risks.
REFERENCES
[1] Shen Showwen, Peng dajun, et al Classification And ExplorationMethods Of Subtle Trap Reservoirs, ACTA 2000, 21 (1): 16 22.
[2] Huang Wenying. Research on the relation between well control degreeand proven reserves of Shengli Oilfield. PGRE, 2010,17(1)
Figure 1. Statistics of omission of sandstone under different extent of well control in delta front area
Oil Field
Number
of
Sandstone
Extent of Well Control
16 wells/km2 11.1 wells/km2 6.25 wells/km2 4 wells/km2 1.56 wells/km2 1 well/km2
Number Proportion Number Proportion Number Proportion Number Proportion Number Proportion Number Proportion
Gaoxi 92 26 28.3 33 35.9 44 47.8 73 79.3 84 91.3 85 92.4
Puxi 260 52 20.0 83 31.9 104 40 175 67.3 185 71.2 227 87.3
Longnan 419 116 27.7 136 32.5 249 59.4 261 62.3 370 88.3 373 89.0
Longhupao 271 26 9.6 52 19.2 82 32.9 172 63.5 219 80.8 236 87.1
Chart 1 relation between reserves precision and different extent of well control
�����������������������������������������!�������"� �� �#�����������������$���������������%��������
���������� �� �������� �*)

Figure 2 Evaluation of Reasonable Well Spacing of Lithologic Deposits in Delta Front Area in West of Daqing
Explored Reserves ProducedType I
Explored Reserves UnproducedType II
Basic Explored ReservesType III
Lenticular sand body reservoirs 16 11.1 16 8.2 11.1
Banded sand body reservoirs 11.1 8.2 11.1 6.25 8.2
Sheet sand body reservoirs 6.25 2.8 6.25 1.8 2.8
Relative Error (%) 10 20 30
�����������������������������������������!�������"� �� �#�����������������$���������������%��������
�*& ���������� �� ��������

Industrialization Process of Pesticide Residue Grade n-Hexane
Can QUAN1,*, Xiongwei YAN2, Ting Huang1, Hong Mei LI1 Junsu JIN2
1National institute of metrology, 10013,Beijing, P.R.China 2Beijing university of chemical technology ,10029,Beijing,
P.R.China [email protected]
Abstract- This project is funded by the China government to develop the industrialization process of pesticide residue grade n-hexane, in which the industrial n-Hexane is used as crude purified by decoloration, distillation and filtration process. The products are validated by National Research Center for Environmental Analysis and Measurement (CNEAC), National Research Center for Geoanalysis, Chinese Academy of Inspection and Quarantine (CAIQ), Chinese Academy of Agricultural Sciences (CAAS) and other government originations for polychlorinated biphenyls, organochlorine pesticide or chiral pesticides analysis and further confirmed that it’s competitive to all others imported n-Hexane currently occupied in China. This patented technique will meet pesticide residue grade n-Hexane market in China and seek for cooperation globally.
Keyword pesticide residue analysis grade; n-hexane; purification; distillation
1. IntroductionHigh purity organic solvents such as pesticide residue grade
solvents play very crucial roles in scientific research field including chromatographic analysis, spectrum analysis, pesticide residue detection, mass spectrometry analysis, organic synthesis, combinatorial chemistry, DNA and RNA synthesis etc. In recent years, food safety problems have caused many concerns; pesticide residue content is one of the most important factors for food safety. The objective of this study funded by Chinese government is
to develop a commercial industrial process which can produce pesticide residue grade n-Hexane directly from industrial grade crude with capacity of 30 T annually.
2. ExperimentalA.Chemicals and raw materials
Industrial grade n-Hexane crude was purchased from Beijing local market. High performance silicon dioxide decoloring agent with average particlon size of 100�m and specific surface area of 500 m2/g was purchased from Qingdao Fine Chemical Corporation (Shandong, China).All chemicals were used directly without further purification. The pesticide residue standards solutions were friendly contributed by the National Institute of Metrology (Beijing, China). Pesticide residue n-hexane control sample were kindly supported by Kingchemtune Co.Ltd.
B.The impurities of industrial n-Hexane The industrial n-Hexane is mainly separated from 6#
solvent naphtha and raffinate oil which come from crude oil
(Liang,T.X and M.Zhu,2004), however crude oil contains some aromatic and alkane compound, so industrial n-hexane may contain the said impurities. In order to verify the impurities of industrial n-Hexane which help to discuss the more availably purification process of pesticide residue grade n-Hexane, it is necessary to ascertain these specific impurities, in this situation, GC/MS analysis method is used to determine these impurities in qualitative model.
C.Purification process 3 Distillation
The feedstock after decoloration was pumped for distillation, the 2-tower distillation apparatus were established with patented design. The industrial grade n-Hexane crude decolorated was firstly pumped into the 1st distillation tower, in which those light impurities were separated, and the remains at the bottom were pumped again into the 2nd distillation tower, in which those heavy impurities were switched at the bottom, the product can be collected on the top of the 2nd tower, the product can be online monitored by a online GC/ECD.
Advances in Materials Physics and Chemistry Supplement: 2012 world Congress on Engineering and Technology
Copyright © 2012 SciRes. 197

industrial n-hexane silicon dioxide
DicorloringTower
RinsingTower
Thefirst
DistillationTower
Thesecond
DistillationTower
Distilled Water pesticide residuegrade n-hexane
Heavycomponents
Lightcomponents
filter unit
Fig.1. Purification process of pesticide residue grade n-Hexane
D. Analytical method
3 UV Value analysis For the analysis for the product of this process, UV value
was measured via UNICO 2102-PCS ultraviolet spectrophotometer (USA) at the wavelengths from 195nm to 250nm, with ultrapure water as blank in 1cm cuvette.
3 Gas chromatography-electron capture detector (GC/ECD) analysis
For the analysis for the product by this process, GC/ECD analysis was carried out by Agilent 6890(USA) gas chromatography equipped with Ni63 electron-capture detector. Samples were introduced into the GC-column via electronic pressure control, with cold-column injector mode.
3 Gas chromatography-mass spectrometry (GC/MS) analysis
For the analysis for industrial grade n-hexane and the product by this process, GCMS analysis was carried out by SHIMADZU GCMS-QP2010 Plus. Samples were introduced into the GCMS via electronic pressure control, with cold-column injector mode.
3. Results and discussion A.Impurities determination of industrial n-Hexane
3 Solvent peak In GC/MS analysis, solvent peak should be found and cut.
Industrial n-hexane contain many impurities, however, whose purity is still up to 96%, after it is injected to GC/MS, the n-Hexane cannot be detected by MS, or the MS will be damaged by n-Hexane solvent, meanwhile it is hard to analysis those impurities peak because of ultra high main solvent peak.
In order to determine the retention time of solvent peak, the less injection volume and higher split ratio is chosen that is 0.1�L and 100:1 respectively, the result is showed in Figure 2.
0.5 1.0 1.5 2.0 2.5 3.0 3.5 4.0 4.5 5.0 5.5 6.0 6.5 7.0 7.5 8.0 8.5 9.0
1.0
2.0
3.0
4.0
5.0
6.0
7.0
8.0(x10,000,000)
TIC
Fig.2 The main solvent peak
B.Parameters of purification process 3 Two towers distillation
After the processes of the front two steps, the feedstock was transferred to two distillation units, the use of the first tower was to remove the low point constituents, then the remaining liquid was transferred to the second tower, the use of which was to remove the high point constituents, lastly the product was got from the second tower top.
Distillation is a highly efficient separation method whose advantages are simple process, high effect and flexible operation etc. The controlled indexes of this process included heating temperature, reflux ratio and heavy constituents discharge rate etc. After a lot of experiments the optimized process parameters are got: the heating temperature of two towers distillation is 88 with reflux ratio of 15:1 and 4:1 for both respectively, the discharge rate of heavy components is 20mL/min, the yield is approximately 70%. If heating temperature was too high and too low, they would cause flood and effect mass transfer, meanwhile if reflux ratio was too high, it would cost too much energy, else if the reflux ratio was too low, products were hard to meet the requirement, so it is necessary to find the best reflux ratio which is the essential elements of distillation operation.
Quality assessment of the product 3 UV value measurement
Take n-Hexane crude and three bottles of different batches of products as the test sample with ultrapure water as blank, from Table 1, it can be seen that crude n-hexane cannot pass the UV value indexes, while UV value of all the products meet the UV value indexes at all the tested wavelengths.
The results show that the numbers of crude impurities are too many and the height is too high, three products show three time points which are most easy to appear exceeding peak respectively.
The results showed that the purity of crude is less than 97% and the purity of these products reach 98% which meet the requirement of pesticide residue standard that is higher than 97%.
The comparation of the quality of our product and other products both at domestic and aboard
From the test results, we can make the conclusion that the products got by this process meet the requirement of pesticide residue indexes. In order to analyze the market situation, we bought 5 kinds of brands of pesticide residue grade n-hexane both at domestic and abroad, all the products were tested in the said test method, the results were showed in Table 1.
The results show that the overall quality of the product got by this process ranks middle, which is better than domestic product and part of foreign products and have not big gap with other better foreign products.
In addition, the products were tested by National Research Center for Environmental Analysis and Measurement (CNEAC), National Research Center for Geoanalysis, Chinese
198 Copyright © 2012 SciRes.

Academy of Inspection and Quarantine (CAIQ), Chinese Academy of Agricultural Sciences (CAAS) and other government originations for polychlorinated biphenyls,
organochlorine pesticide or chiral pesticides analysis and further confirmed that it’s competitive to all others imported brand occupied China.
TABLE 1 QUALITY COMPARISON OF PESTICIDES RESIDUE N-HEXANE
title Foreign
product 1 Foreign
product 2 Foreign
product 3 Foreign
product 4 Domestic product 1
The product
195nm absorbance 0.702 0.713 0.662 0.732 0.908 0.943 210nm absorbance 0.176 0.201 0.182 0.234 0.246 0.231 220nm absorbance 0.061 0.079 0.072 0.058 0.098 0.071 230nm absorbance 0.029 0.042 0.038 0.028 0.049 0.028 240nm absorbance 0.015 0.026 0.023 0.015 0.025 0.012 250nm absorbance 0.010 0.018 0.016 0.011 0.016 0.005
Maximum peak height(GC-ECD) (ng·ml-1)
2.83
0.26
0.18
6.31
1.38
0.590
purity % (GC-FID)
97.31 99.61 98.53 98.59 97.33 98.48
4. ConclusionFor the solvents of pesticide residue analysis, they not only
require high purity, but more importantly, which do not produce interference peak in pesticide chromatographic detection when solution are concentrated dozens to hundreds times, so the traditional purification methods are not suitable for the preparation of this kind of solvents. This study build a new process,which can remove the trace impurities that influence the pesticide residue analysis and overcome some technology bottleneck problems such as complex process, too much impurities peak and heavy environment pollution, thus achieve the process of transforming industrial n-Hexane to pesticide residue grade n-hexane directly.
Put industrial n-hexane as crude, after this process containing decolour-two towers distillation-filter, pesticide residue grade n-Hexane which can be apply to pesticide residue analysis were prepared.
This product can meet the clients in the need of pesticide residue analysis, which would reduce the independent of domestic laboratory to imported pesticide residue grade solvents and could support the product of good quality and cheap price
5. Acknowledgements Can QUAN acknowledges the Ministry of science and
technology of People’s Republic of China for Key Projects in the National Science & Technology Pillar Program during the Eleventh Five-Year Plan Period (2009BAK61B02); the Ministry of science and technology of People’s Republic of China (2011FY130100); the General Administration of Quality Supervision, Inspection and Quarantine of the People’s Republic of China (ASPAQ1101-1); the National Institute of Metrology (21-JB1127) for financing.
REFERENCES[1] Yang P, Ye X N, Lau C W. Design of efficient zeolite sensor materials
for n-hexane [J]. Anal. Chem., 2007, 79(4): 1425-1432
[2] Sivasankar N, Vasudevan S. Adsorption of n-hexane in zeolite-5A: a temperature-programmed desorption and IR-spectroscopic study [J]. J. Phys. Chem. B, 2005,109(32): 15417-15421
[3] Bárcia P S, Silva J A C, Rodrigues A E. Adsorption equilibrium and kinetics of branched hexane isomers in pellets of BETA zeolite[J].Microporous and Mesoporous Materials, 2005, 79(1-3): 145–163
[4] Krishna R, Van baten J M. Screening of zeolite adsorbents for separation of hexane isomers: a molecular simulation study [J]. Separation and Purification Technology, 2007, 55(2): 246-255
[5] Yonli A H, Bouillault N, Mignard S. Separation of monobranched and dibranched isomers of n-hexane on zeolitic molecular sieves: a thermodynamic study [J]. J. Phys. Chem. B, 2010, 114(13): 4465–4470
[6] Bárcia P S, Zapata F, Silva J A C. Kinetic separation of hexane isomers by fixed-bed adsorption with a microporous metal-organic framework [J]. J. Phys. Chem. B, 2007, 111(22): 6101-6103
[7] Shanbhag P V, Guha A K, Sikar K K. Membrane-based ozonation organic compounds [J]. Ind. Eng. Chem. Res, 1998, 37(11): 4388-4398
[8] Bessarabov D G, Theron J P, Sanderson R D. Separation of 1-hexene/n-hexane mixtures using a hybrid membrane/extraction system[J]. Separation and Purification Technology, 1999, 16(2): 167–174
[9] Funke H H, Argo A M, Baertsch C D. Separation of close-boiling hydrocarbons with silicalite zeolite membranes[J]. J. Chem. SOC., Faraday Trans., 1996, 92(13): 2499-2502
[10] Gump C J, Noble R D, Falconer J L. Separation of hexane isomers through nonzeolite pores in ZSM-5 zeolite membranes [J]. Ind. Eng. Chem. Res.1999, 38(7): 2775-2781
Copyright © 2012 SciRes. 199

Simulation of Multi-stage Flash MSFDesalination Process
Wu Lian-ying Xiao Sheng-nan Gao Cong-jie (College of Chemistry and Chemical Engineering, Ocean University of China, Shandong,
Qingdao 266100 ,China) Abstract-MSF seawater desalination has become an important technology to solve the scarce of fresh water resources in the world. But the high energy cost is the bottle-neck of extendibility and application. In this paper, the principle of MSF is analyzed and the single flash stage is divided into several elementary unit operations. The Aspen Plus is adopted to simulate MSF desalination process. The effect factor of MSF system, such as the feed seawater temperature, the top brine temperature TBTand the stage number, is investigated and the optimum operation condition is obtained.
Keyword- Seawater Desalination; MSF; Process Simulation
1. Introduction
The fresh water resource is one of the most important factors which constrain the economic development, social progress and human survival. Currently, there are more than 100 countries and regions, in where the fresh water is shortage, about 1.5 billion people can not get the clean drinking water, 2.0 billion people are living without safe water, and the consumption of water is increasing at a rate of 4% per year [1, 2]. China is one of the countries that the United Nations recognized as the 13 most water-poor countries, per capita fresh water resources is only 1/4 of the world average level, and the temporal and spatial distribution of freshwater resources is uneven. And the lacking is characteristic with both at resources and water quality [3-5]. Water scarcity� has become a major bottleneck that constraints the world's sustainable economic development [6].
Desalination has become recognized as an effective measure to solve the water shortage [1]. However, high energy consumption is one of the major bottlenecks to limit its promotion and application. Therefore, it is important significance to seek methods to reduce the desalination energy consumption. This paper is trying to use Aspen Plus software to simulate the MSF desalination process and analyze the effects of the operating parameters to the MSF desalination system. At the same time, the method of reducing energy consumption is provided as reference to the design of MSF system.
2. The Principle of MSF
Desalination
The MSF system (shows in Fig.1) consists of three sections: heat-rejection, heat-recovery and brine heater. The heat-rejection and heat-recovery consist of a number of flash chambers (stages) connected to one another. Raw seawater first come into the heat-recovery section to condense the steam produced in the flash chamber, at the same time it is heated. Most of the water coming from the heat-rejection section return to the sea, and the remaining part will be mixed with part of the brine rejected from the last stage of the heat-rejection section; and then transported by brine circulating pump into the condenser of the last stage flash chamber of the heat recovery section. The recycling brine, which flowing along with the opposite direction of the flash brine flow direction, is heated by the flash steam producing in every flash room, and the flash steam is condensed. The heated circulating
Advances in Materials Physics and Chemistry Supplement: 2012 world Congress on Engineering and Technology
200 Copyright © 2012 SciRes.

brine coming out from the condenser tube of the first flash chamber is transported into the brine heater and is further heated to a specified temperature, which is the top brine temperature (TBT). And then it flows into the lower level of
the first flash chamber, and the circulating brine begins to progressively flash along per flash stage. The flashed steam will be condensed in the condenser tube, and then it flows into the fresh water tank as product water.
Fig.1 A circulating-brine multistage flash (MSF) desalination plant.
3. The Simulation and Analysis
of MSF Desalination Process
Performance Ratio (PR) and the rate of brine flow (RBF) are two important parameters that have a major impact on the investment costs and the operating costs of the desalination systems [10]. This paper mainly studies the influence of the feed seawater temperature, TBT and the number of flash stage on PR and RBF. Then, the expecting optimal operating conditions of the multi-stage flash desalination system is provided.
The realization of the MSF process in the Aspen Plus
MSF desalination system is composed of N-level flash units. Fig.2 (a) represents the actual structure of a flash unit; Fig.2 (b) shows the structural decomposition of a flash unit. The flash unit is split up into four compartments: the pre-heater, the flash chamber, the fresh water room and the steam room. Then it is very easy to be described with the Aspen Plus. The pre-heater in top of the flash chamber could be simulated by the HETRAN module of the Aspen Plus, the flash chamber could be used FLASH module to be simulated and the fresh water room and the steam room could be used MIXER module to be
simulated. After the MSF is be transformed, the single flash unit will be constructed based on the actual logistics connection of the stream. Subsequently, connecting the multiple flash units sequential, the simulation of the process of MSF system is achieved in the Aspen Plus.
Fig. 2 The structure of a single flash stage
4. Analysis of simulation results
1. The influence of feed seawater temperature
Here, the heat recovery section and the heat rejection section are specified as 18 stages and 3 stages in the MSF system. The TBT is set to 110
and the freshwater production is set to 100t/h.
Copyright © 2012 SciRes. 201

The difference between feed seawater temperature and the rejected brine temperature is 10 . The feed seawater temperature is varied from 10 to 35 with interval of 5 .The vary trend of PR and RBF long the feed seawater temperature is obtained. The results are shown in Fig.3, Fig.4.
10 15 20 25 30 35
6
7
8
9
10
11
Fig.3 Effect of feed seawater temperature on the PR
10 15 20 25 30 35720000
740000
760000
780000
800000
820000
840000
Fig. 4 Effect of feed seawater temperature on the RBF
Fig.3 gives the chart of feed seawater temperature vs. PR. From the chart, the PR of the MSF system showed a gradually rising trend when the feed seawater temperature is increased. The PR of MSF system did not change significantly and over the range of 10 ~ 20 , but it was approximately straight up between 20 ~30 . When the feed seawater temperature goes beyond to 30 , the changed trend of PR becomes to be gently. The chart of RBF vs. feed seawater temperature is shown as Fig.4. The value of RBF almost changed and the line is level when the feed seawater temperature is varied from 10 to 20 . But it was rapidly increasing when the feed water temperature passed 20 .
While the freshwater production, the TBT and the number of flash stage are specified as a constant, the lower of the feed seawater temperature, the more of the steam required to heat the brine to TBT. But when the feed seawater temperature beyond to 25 , the temperature of circulating brine, which coming out from the first stage flash pre-heater and being heated by the multi-stage pre-heater, slowly changed. And the required amount of heating steam tends to change slowly, so the PR became relatively gentle. At the same number of flash stages, the temperature of rejected brine increased when the feed seawater temperature is increased. Because the temperature difference of between the feed seawater and the rejected brine is set to 10 . However, the TBT is keep as an unvaried value, therefore the total difference in temperature and the stage temperature difference will be reduced simultaneously. Consequently, the producing fresh water of per unit flash stage will be decreased. In order to produce the same quantity of fresh water, the amount of circulating brine must be increased. Increasing the amount of circulating brine flowrate will make huge operating costs. Summarizing, the appropriate feed seawater temperature is about 25 .
2. The influence of TBT
Here, the heat recovery section and the heat rejection section are specified as 18 stages and 3 stages respectively in the MSF system. The freshwater production is set to 100t/h. The feed water temperature is set to 25 and the temperature of rejected brine temperature is set to 35 . The TBT is varied from 80 to 120 with interval of 10 . The simulation results are shown in Fig.5 and Fig.6.
202 Copyright © 2012 SciRes.

80 90 100 110 120
9.0
9.5
10.0
10.5
11.0
11.5
12.0
Fig.5 Effect of top brine temperature on the PR
80 90 100 110 120600000
700000
800000
900000
1000000
1100000
1200000
Fig.6 Effect of top brine temperature on the RBF
Fig. 5 and Fig. 6 give a PR chart of MSF and the RBF chart of MSF respectively when the TBT is changed. From Fig. 5 and 6, the PR increased firstly and where-after decreased step by step with the TBT is increased. And the maximum value of PR is obtained at 90 . But the RBF chart of MSF showed decreasing trend, and the reduced trend is weakened gradually while the TBT is increased. As the temperature of rejected brine is constant, the total flash temperature difference of system and the flash temperature difference of per stage were increased after the TBT is increased. With the same number of flash stage, the total amount of fresh water would be increased due to the producing fresh water quantity of single stage increased. So the RBF of MSF would be decreased to guarantee the total production of fresh water to constant. On the other hand, though the required amount of steam heating will be large on account of hoisting the TBT. But the RBF was reduced more obviously at the range of 80 ~ 90 , so the result is that the PR increased
rapidly and the required amount of steam heating reduced markedly. While the TBT is higher than 90, the amount of increasing heat steam took the more important role in influence of PR than the amount of reducing RBF. Accordingly, the PR diminished when the TBT is higher than 90. Therefore, considering the performance ratio and operating costs, the TBT of MSF system should be between 90 ~ 110 appropriate.
3 The influence of flash stage number
In this section, the PR and the RBF influenced by the flash stage number will be discussed. The given as fellow: the TBT is 110
, feed water temperature is 25 , the temperature of discharged brine is 35 and the fresh water production is 100t/h in the MSF system. The results are depicted in Fig. 7 and Fig. 8.
18 20 22 24 26 28 308
9
10
11
12
13
14
15
16
Fig. 7 Effect of flash stage number on the PR
When the flash stage number is increased, the PR increased gradually, and the more the stage number is, the greater the PR is achieved. By contraries, the amount of the circulating brine showed a decreasing trend.
Copyright © 2012 SciRes. 203

18 20 22 24 26 28 30745000
750000
755000
760000
765000
770000
Fig. 8 Effect of flash stage number on RBF
As the same total difference in temperature is fixed, the difference in temperature of single stage was decreasing when the number of flash stage was increased. Therefore the flashing of brine would be more close to the reversible process, and the energy loss would be reduced. At the same time, the brine pre-heater could recovery more heat and the required quantity of heating steam could be cut down. Consequently, the PR should be increased. On the other hand, the closer the brine evaporation process to the reversible process, the more the fresh water produced in an single-stage evaporation unit. To holding the same fresh water production, the number of flash stage is bigger and the required amount of the circulating brine is little. But the more stage number, the equipment will become more complexity and the investment costs will be higher. Considering the investment costs and operating costs, the number of flash stage should be more reasonable for the 20-25 level.
5. Conclusions
In this paper, multi-stage flash desalination technology is analyzed. The single flash unit is divided into several basic operations, and the Aspen Plus software is used to simulate the multi-stage flash desalination process. Several influenced factor of the MSF system are discussed, such as the feed sea water temperature, the TBT and the number of flash stage. The results shown: when the fresh water production, the TBT and the number of flash stage are fixed,
the lower the feed water temperature, the greater the amount of required external heating steam, the smaller the PR and the greater the amount of circulating brine. Similarly, fasting the fresh water production, the feed sea water temperature and the number of flash stage, when the top brine temperature was increased, the PR increased at first and then decreased, but the RBF was gradually reduced; With the fresh water production, the TBT and the feed sea water temperature constantly, the PR was increased gradually and the RBF was reduced gradually when the flash stage number was increasing. Synthetically, the best operating conditions of the MSF system should be selected as follows: feed water temperature is 25 , the TBT is 90 ~ 110
, and the number of flash stage is 20~ 25.
6. Acknowledgements
This work was financially supported by National Natural Science Foundation of China (20976173&21076202).
REFERENCES[1] Wang Junhong, Gao Naiyun. Development and application of seawater desalination[J]. Industrial Water Treatment, 2009, 28(5) [2] Bai Yuhui, Yan Zhengyuan. Summary of desalination technology. Shandong Water Conservancy College. 1995. [3] Cai Xiaojun, Zhou Shaoxiang. Low-temperature multi-effect desalination plant system analysis. North China Electric Power University, 2009. [4] Jie Lixin, Ruan Guoling. Status and Prospect of reverse osmosis desalination technology. China Water & Wastewater. 2000, 16(3):24-27. [5] Lin Siqing. Seawater reverse osmosis desalination technology abroad, and Future. Water Treatment. 1998, 24(1): 1-6 [6] Zhou Shaoxiang, Song Zhiping. Multi-stage flash desalination cogeneration technology, theory and practice. North China Electric Power University.2001. [7] Osman A. Hamed, Holayil A. Al-Otaibi. Prospects of operation of MSF desalination plants at high TBT and low antiscalant dosing rate. ScienceDirect, Desalination 256 (2010) 181~189 [8] Hittman Assciates,Inc.,OSW Res.Devel.Prog.Rep.,No.490,1969 [9] Wang Shichang, Seawater desalination project. Beijing: Chemical Industry Press. 2003: 8-29 [10] Gao Congjie, Cheng Guohua. Desalination Technology and Engineering Handbook. Beijing: Chemical Industry Press, 2004: 5-90 [11] Khawla AbdulMohsen Al-Shayji.Modeling,simulation,and optimization of
204 Copyright © 2012 SciRes.

large-scale commercial desalination plants, the Virginia Polytechnic Institute and State University, April, 17, 1998
Copyright © 2012 SciRes. 205

Simulation of Countercurrent Multi-effectDrying System1
First author Li Hong (1984—), female, Ph.D
Corresponding author: Prof. HU Yangdong, [email protected] Foundation item: supported by the National Natural Science Foundation of China (21076202)
LI Hong, WU Lianying, WU Xianli, HU Yangdong
(Department of Chemical Engineering,
Ocean University of China, Qingdao 266000, China)
AbstractThe paper bulids a countercurrent multi-effect drying process model which can be expressed as a linear programming(LP) problem with the minimum total energy consumption as target function. Based on the model it can be conventient to solve the heat load , degree of drying and other drying parameters of each effect. And it realizes the mathematical simulation an analysis of multi-effect drying process. Such process not only reuses the secondary steam but also utilizes the high energy grade. Drying silica sand using 1-effect drying to 5-effect drying is presented as an example. The energy consumption and energy saving rate are compared by using co-current multi-effect drying and countercurrent multi-effect drying. As a summary, the countercurrent multi-effect drying is better than co-current drying. Considered the equipment investment and energy conservation, the study also concluded that the countercurrent 4-effect drying is the optimum selection, and it can save 57.6% energy compared to countercurrent 1-effect drying.
Keywords-countercurrent drying; multi-effect drying; secondary steam; LP
1. Introduction
Among many process operations in industry, drying is probably one of the most important, as
it is common to all sectors of solids processing. Many investigations have shown that drying is an energy intensive operation, which involves complex processes of heat and mass transfer between the product and the drying medium[1-4]. Nowadays, with the situation of energy shortage becoming more and more serious, how to improve the energy utilization efficiency has become a research hot spot. Although a large number of works have been devoted to exploring different features and applications of the thermal drying system, most of those changed the high grade energy to lower grade energy when utilized the waste gas, so a large number of high quality stream latent heat is wasted. A promising alternative to improve the problem is the use of multi-effect dying system based on the process integration as formulated by Linnhoff[5] and is directed on the efficient use of energy for drying [6-7]. Such a system consists of a number of dryers. By directly utilizing the secondary steam resulting from energy degradation in the drying system, the drying process imports the secondary steam produced by the former effect as the heat source of the following effect thereby reducing energy consumption.
Advances in Materials Physics and Chemistry Supplement: 2012 world Congress on Engineering and Technology
206 Copyright © 2012 SciRes.

2. Description the Process of the
Countercurrent Multi-Effect
Drying
The countercurrent multi-effect drying process is designed by follow postulated:
(1) Multi-effect drying is a typical batch process.
(2) The dryer is vacuum tray drier. The material is heated by conduction heating(3) The secondary steam is water vapor. In actual operation, it can be recycled by draught fan. Thedraught fan has the function of also dust removal.
(4) Apply secondary steam to heat the wet material indirectly.
(5) The drying materials are not flowing, but by controlling the flowing of secondary steam, the drying materials can be regarded as flowing. It can be operated by simulated moving bed in actual operation.
(6) Dried material is distributed very thinly in the dryers, which increases the heating surface area, giving the drying system better heat
transfer effect and efficiency. (7) Best fit for the drying process that water
evaporation process occurs in small particle materials surface.
A. Technological Process.
The countercurrent multi-effect steam drying flowchart is shown in Figure 1. Set the number of total effect as n. Hot fresh vapor enters the last drying room to heat the solid materials in it, while secondary steam discharged from the last drying room n enters the front drying room n-1 to heat the solid materials there. Taking the i-1, i, i+1 effect drying for example, the secondary steam produced by the i+1 effect drying enters the i effect drying room, while the secondary steam produced by the i effect drying enters the i-1 effect drying room, as so on until the 1 effect drying, the secondary steam produced by the 1 effect drying enters the condenser. The drying materials are not flowing, after the drying material of the i effect drying dried by the secondary steam of the i+1 effect drying room produced, this drying room and drying material is regarded as i+1 effect drying in the next batch process production cycle.
Figure 1. Countercurrent n-effort steam drying process
B. Mathematic model
The objective is recycling the second stream energy as a means to minimize the energy consumption of n-effect drying needing.
Copyright © 2012 SciRes. 207

Min A
nnnnnnnnsn
rXXGXttGCttGcQ ][][][ 1111 � ���� ���� (1)
s.t. A
'][][][][ 111111 iiiiiiiiiiisii
rXXttCGXttCGXttGCrD �������H ������ (2)
(3))( 1�� iii XXGD
' (4)ii rr
(5)00 XX i I+
ni II0 (6)
The constraint conditions are the moisture material balances and energy balances of each effect drying and the total drying system. The decision variable is Xi.
C. Solving the LP problem
The pressure of the countercurrent multi-effect drying system is designed by method of same pressure drop.
nPPP n '1�
� (7)
Pn and P1’ are selected according to the actual conditions. Then the temperature and steam enthalpy can be checked from the literature. This
paper is in the Matlab environment to solve the linear programming(LP) problem.
3. Case Study
This article simulates silica sand n-effect (1 n5) drying as example. The parameters of silica
sand of n-effect drying is shown in Table 1. The physical parameters of steam are taken from literature [8].
TABLE 1. THE PARAMETERS OF SILICA SAND OF COUNTERCURRENT N-EFFECT DRYING
parameters G
/kg
X0 / kg moisture/kg absolutely dry
material
Xn / kg moisture/kg absolutely dry
material
t0
/Pn
/kPaP1
/kPa Tn
/ T1 /
A
date 1000 0.5 �0.01 25 140 30 110 66.5 1
D. Discussion on the relationship of drying
effect and drying minimum energy consumption of n-effect drying.
This study simulates the minimum energy consumption from countercurrent 1-effect to 5-effect drying under the same initial and terminal operation conditions. The minimum energy consumption and energy saving rate of n-effect drying compared to 1-effect drying are
analyzed. Afterwards the results are compared with the co-current multi-effect drying in the same initial and terminal operation conditions which was calculated in our previous study[9]. All the results are shown in Figure 2 and Figure 3.
208 Copyright © 2012 SciRes.

1 2 3 4 50
100
200
300
400
500
600
n-effect
ener
gy c
onsu
mpt
ion
(kW
) co-current multi-effect drying countercurrent multi-effect drying
Figure 2. The energy consumption of n-effect drying
As is shown in Figure 2, it can be concluded that the energy consumption of both countercurrent and co-current multi-effect drying decreases with the number of effects. Except 1-effect drying, all the energy consumption of countercurrent n-effect drying is less than that of co-current n-effect drying.
1 2 3 4 50
10
20
30
40
50
60
70
n-effect
ener
gy sa
ving
rate
(%) co-current multi-effect drying
countercurrent multi-effect drying
Figure 3. The energy saving rate of n-effect drying
Also, as shown in Figure 3, the overall energy saving rate for co-current n-effect drying does not increase as dramatically as it does for
countercurrent multi-effect drying. Many scholars have concluded that countercurrent drying had the advantage that while the material humidity decreases, the steam’s temperature used as heat source increase, the driving force is equilibrium distribution. As a summary, if allowed, the countercurrent multi-effect drying is the best choice. Got through the countercurrent drying curve of Figure 2 and Figure 3, the minimum energy consumption of countercurrent 1-effect drying is 533.5 kW, 2-effect is 320 kW, and compared to 1-effect the 2-effect energy saving rate is of 40%. However when the number of effect is more than 4, the energy consumption and energy saving rate curves tend to smooth. Generally, the multi-effect systems are most effective for 3-4 effects, above this number the energy consumption reduction is marginal and probably not sufficient to justify the increase of system complexity. The energy consumption of countercurrent 4-effect drying is 257 kW and co-current 4-effect drying is 289 kW. The energy saving rate of countercurrent 4-effect drying is 57.6 % and co-current 4-effect drying is 49% compared to 1-effect drying.
E. Drying effect of countercurrent n- effect drying.
This article calculates the removal water of each effect of countercurrent n-effect drying. The energy of countercurrent n-effect drying is provided according to the calculation from Figure 2. Countercurrent 1-effect drying to 5-effect drying are simulated. The results are shown in Table 2
TABLE 2. THE REMOVAL WATER OF EACH EFFECT OF COUNTERCURRENT N-EFFECT DRYING
The removal water (kg) Number of drying effect
G X1 G X2 G X3 G X4 G X5
1-effect 493 161 55 7 02-effect 333 173 97 38 3-effect 263 155 96 4-effect 233 147
Copyright © 2012 SciRes. 209

5-effect 217
4. Conclusions
The process of countercurrent multi-effect drying is designed by using linear programming method. Both co-current and countercurrent 1-effect to 5-effect drying are simulated by the method. The minimum energy consumption of such multi-effect drying system is less than that of conventional 1-effect drying system. The energy consumption decreases with the number of effects. Generally, the multi-effect systems are most effective for 3-4 effects; above this number the energy consumption reduction is marginal and probably not sufficient to justify the increase of system complexity. Compared with co-current multi-effect drying, the countercurrent multi-effect drying consuming less energy. The energy saving rate of countercurrent 4-effect drying is 57.6 % and co-current 4-effect drying is 49% compared to 1-effect drying. In other words, the energy consumption is halved, which is regarded as a significant step ahead in saving energy.
5. Nomenclature
C —— specific heat capacity of water,
kJ/(kg· )
Cs —— specific heat capacity of solid,
kJ/(kg· )
Di —— the amount of secondary steam
which is put into the i-effect drying, kg
G —— the absolutely dry material feed, kg
Pn —— the pressure of the fresh vapor, kPa
Pi’ —— the pressure of the countercurrent
i-effect drying, kPa
ti —— the solid temperature of the
countercurrent i-effect drying,
Tn —— the temperature of fresh vapor,
Ti —— the steam temperature of the
countercurrent i-effect drying import,
Ti’ —— the secondary steam temperature of
the countercurrent i-effect drying produces,
Qn —— the external energy, kW
r —— evaporation heat of heating steam,
kJ/kg
r’ —— evaporation heat of secondary steam,
kJ/kg
Wi —— the amount of secondary steam that
the i-effect drying produces, kg
Xi —— dry basis water content of i-effect
drying, kg moisture /kg absolute dry materials
A —— the heat transfer efficiency of each
effect drier
i —— the i effect
n —— total number of drying effect
REFERENCES
[1] S.K. Chou, K.j. Chua, S.M. Lee, 2003, On the Use
of Contact Factor Parameter to Optimize Drying
Operations. Energy Conversion and Management. Vol.
44, 1451-1464
[2] I. Dincer, M.A. Rosen, 1999, Environmental and
Sustainable Development. Applied Energy. Vol. 46,
427-440
[3] I. Dincer, A.Z. Sahin, 2004, Incorporation of the
Dincer Number into the Moisture Diffusion Equation.
International Communications in Heat and Mass
Transfer. Vol. 31, 109-119
[4] C.Strumillo,1998, Developments in Drying.
Report in Jinan Conference on Drying Technology
[5] Linnhoff, B, 1994, User Guide on Process
Integration for the Efficient Use of Energy. The
Institution of Chemical Engineering. Rugby, UK
[6] Djaeni, M. Bartels, P. Sanders, J. Straten, G. van.
Van Boxtel, A.J.B, 2007, Process Integration for Food
Drying with Air Dehumidified by Zeolites. Drying
Technology. 25, 1, 225-239
[7] Krokida, M.K. Bisharat, G. I, 2004, Heat Recovery
from Dryer Exhaust Air. Drying Technology, 22, 7,
1661-1674
[8] Yuying Yao, 1999, Principles of Chemical
Engineering. Volume one. Tianjing University Press.
In Chinese
[9] Li Hong, Hu Yangdong, Zhang Pei, Wu Lianying,
210 Copyright © 2012 SciRes.

Li Yonggang, 2011, Simulation of Co-current
Multi-effect Drying System. Advanced Materials
Research. 236-238, 808-831
Copyright © 2012 SciRes. 211

Yttria Promoted Nickel Nanowire Catalyst for The Partial Oxidation of Methane to Synthesis Gas
Xuebin Hong, Bingbing Li, Cong Zhang Renai College of Tianjin University
Tianjin 301636, P. R. of China [email protected]
Abstract-A yttria promoted nickel nanowire catalyst was prepared by a hard templating method, and characterized by transmission electron microscopy (TEM) and N2 physical adsorption. The catalytic properties of the yttria promoted nanowire catalyst in the partial oxidation of methane to syngas were compared with a metallic Ni catalyst which was prepared with nickel sponge. The characterization results showed that the yttria promoted nickel nanowire catalyst had high specific surface area and there was more NiO phase in the nickel nanowire catalyst than in the metallic Ni catalyst. The reaction results showed that the yttria promoted nickel nanowire catalyst had high CH4 conversion and selectivities to H2 and CO.
Keywords- yttria; nanowire; methane; partial oxidation; syngas
1. IntroductionThe conversion of natural gas into liquid fuels is commonly
performed via an indirect route through synthesis gas, a mixture of H2 and CO [1-3]. Industrially, synthesis gas is mainly produced from methane steam reforming process [4-6]. Such a process produces a high H2/CO ratio [7]. Furthermore, methane steam reforming is highly endothermic and heat-transfer limited [8]. Catalytic partial oxidation of methane (CPOM) is an attractive alternative for the syngas production [9-12] as the reaction is mildly exothermic and a H2/CO ratio of 2 can be achieved, which is desirable for Fischer-Tropsch synthesis [13-15], methanol synthesis, etc.
The first row of transition metals (Ni, Co) and precious metals (Ru, Rh, Pd, Pt, and Ir) have been reported as active catalysts for CPOM [16, 17]. Among these, Ni has been intensively studied. Recently, the synthesis of nickel oxide with controlled nanostructures, such as mesoporous solids, nanotubes or nanowires, has attracted considerable attention because such material may exhibit better catalytic properties and be more readily available [18-23]. Kim et al [24] synthesized a mesoporous Ni-Alumina catalyst and compared the performance with a nickel catalyst impregnated on a commercially available alumina support (Ni-IMP) in CPOM. They found that the Ni-Alumina catalyst showed a relatively high surface area with a narrow pore size distribution. And the Ni-Alumina catalyst having smaller nickel particles and lower levels of carbon deposition had a more stable catalytic activity than the Ni-IMP catalyst.
The reaction of CPOM over a metallic Ni catalyst prepared with nickel sponge has been studied [25]. The results showed that the metallic Ni catalyst has some advantages over the supported nickel or nickel coated catalysts. For example, in the supported nickel or nickel coated catalysts, the fine nickel particles tend to aggregate at high temperatures and lose the activity [26, 27]. However, in the metallic Ni catalyst, the nickel acts as both active component and the support, so it would not aggregate further [25].
In this work, we prepared a yttria promoted nickel nanowire catalyst by a hard templating method. The catalyst consists of nickel nanowires, which has higher specific surface area than the one prepared with nickel sponge. It is expected that the yttria promoted nickel nanowire catalyst should have higher activity for CPOM, while keeping the advantages of the metallic nickel catalyst.
2. Experimental A. Catalyst preparation
Three-dimensional mesoporous silica (KIT-6) was synthesized according to references [28-31], and used as the hard template for the preparation of yttria promoted nickel nanowires. For the preparation of the yttria promoted nickel nanowires, 1.5 g of Ni(NO3)2(6H2O (98.0 %) and 1.0 g Y(NO3)3 were dissolved in 1.0 cm3 distilled water forming a saturated solution, followed by addition of 2.0 g of KIT-6, which resulted an incipient impregnation. After drying at 373 K until all the water had been vaporized and a dry powder obtained, the sample was heated slowly to 823 K in air and calcined in a muffle furnace at that temperature for 5 h. Then, in the presence of hydrogen, the sample was heated at 1 K/min from ambient temperature to 1123 K, kept at the final temperature for 2 h, and then cooled down to ambient temperature. The above process was repeated for four times. Then, the resulting sample was twice treated with a hot 4.0 mol/L NaOH solution to remove the silica template, followed by washing with distilled water and ethanol several times, and then drying at room temperature. The sample was triturated into 40-60 mesh.
The preparation of the metallic Ni catalyst has been described before [25]. Briefly, a piece of metallic Ni sponge (80 % porosity, Changsha Liyuan Material Co., Ltd.) was cut into 40-60 mesh, treated with a mixture of 500 cm3 containing 0.01 wt. % HCl and 0.2 wt. % H2SO4 for 24 h, and then thoroughly washed with distilled water and dried. This pretreatment results in the formation of 0.18~0.92 �m wide channels across the surface [25].
Advances in Materials Physics and Chemistry Supplement: 2012 world Congress on Engineering and Technology
212 Copyright © 2012 SciRes.

B. Catalyst characterization Transmission electron microscopy (TEM) investigations
were carried out using a FEI Tecnai G2 F20 apparatus, operated at an accelerating voltage of 200 kV. The sample powders were dispersed in ethanol by ultrasonic radiation and the solution was dropped on the sample holder, which is a copper grid coated with a carbon film.
The specific surface areas of the samples were determined by nitrogen physical adsorption at liquid nitrogen temperature using a Mike TriStar 3000 instrument. All samples were degassed at 573 K for 5 h prior to analysis. The specific surface areas were calculated according to the method of Brunauer, Emmett and Teller (BET).
C. Experimental procedures
CPOM was studied with a quartz reactor with 10 mm internal diameter, which was heated by an electric furnace. The catalyst temperature was measured by a chromel-alumel thermocouple which was inserted into a quartz thermocouple well, with the thermocouple tip being placed in the middle of the catalyst bed. In a typical run, the catalyst (diluted with double portions of quartz silica of the same size as the catalyst), with the total volume of 0.39 cm3, was packed in the reactor with a layer of silica wool below. The reactant gases of CH4 (99.8 %) and O2 (99.9 %), controlled by mass flow controllers, were passed through the reactor and the temperature was increased to the required value with the electric furnace.
Reaction products were analyzed by a 3420 Gas Chromatograph equipped with a TCD detector and two columns, a 5A molecular sieve column for the separation of O2, CH4 and CO, and a carbon molecular sieve column for the separation of H2 and CO2. Quantification was performed by injecting a gas mixture with known compositions for the calibration.
The equations for the calculation of the conversion of CH4, CONCH4, and the selectivities to H2 and CO, SH2 and SCO, are given as follows:
CONCH4 = (FCO,outlet + FCO2,outlet) / (FCO,outlet + FCO2,outlet + FCH4,outlet) × 100 % (1)
SH2 = FH2,outlet / (2 × (FCO,outlet + FCO2,outlet)) × 100 % (2)
SCO = FCO,outlet / (FCO,outlet + FCO2,outlet) × 100 % (3)
Where Fx is the mole number of substance x. No oxygen breakthrough was found in the CPOM reaction.
3. Results and Discussion C. Characterization of catalysts
Morphology of the yttria promoted nickel nanowire catalyst was determined by TEM and is shown in Figure 1. It is seen that the catalyst consists of nanowires. The nanowires are stacked together, probably because that they are paramagnetic and cannot be dispersed by ultrasonic radiation. But the nanowires are not structurally connected. By measuring at high magnification, the diameter of the nickel nanowires was measured to be approximately 8 nm.
The specific surface area of the yttria promoted nickel nanowire catalyst (9.77 m2/g) is much higher than that of the metallic Ni catalyst (0.25 m2/g).
Figure 1. TEM images of the yttria promoted nickel nanowire
catalyst at different magnifications, 5 nm; 50 nm
D. Results of the reaction of CPOM Changes of methane conversions and H2 and CO
selectivities on the yttria promoted nickel nanowire catalyst and the metallic Ni catalyst with CH4/O2 ratios, reaction temperature, and GHSV are shown in Figures 2 to 4, respectively. It can be seen that with the increase of CH4/O2 ratios, the methane conversions on both catalysts decrease and the selectivities to synthesis gas increase (Figure 2). With the increase of the reaction temperature, the methane conversions and the selectivities to H2 and CO on both catalysts also increase (Figure 3). With the increase of GHSV, the CH4 conversion and H2 and CO selectivities on the metallic Ni catalyst increase, but those on the yttria promoted nickel nanowire catalyst decrease (Figure 4). These tendencies were agreed with the perspectives of what are already known in literatures [32-38], except the changes of the CH4 conversion and the selectivities to syngas on the yttria promoted nickel nanowire catalyst with the increase of GHSV. This will be explained below.
However, it is noted that on the yttria promoted nickel nanowire catalyst, the methane conversion and the selectivities to H2 and CO are much higher than those on the metallic Ni catalyst under the same reaction conditions. For example, as shown in Figure 2, on the yttria promoted nickel nanowire catalyst, at reaction temperature 1123 K, GHSV 2.0 B 104 h-1, and CH4/O2 ratio 2.0, the conversion of methane and the selectivities to hydrogen and carbon monoxide are 90 %, 99 %, and 97 %, respectively, much higher than those on the metallic Ni catalyst, which are 58 %, 62 %, and 82 %, respectively. The value of the conversion on the yttria promoted nickel nanowire catalyst is a little lower than the thermodynamic equilibrium
Identify applicable sponsor/s here. (sponsors)
Copyright © 2012 SciRes. 213

value, which is 95 %, but the values of the selectivities to syngas are near to the thermodynamic equilibrium values, which are 98 % and 98 %, respectively.
Figure 2. Comparison of CH4 conversions and 2 and CO s
Helectivities between metallic Ni catalyst (solid lines) and theyttria promoted nickel nanowire catalyst (dashed lines) at different CH4/O2 ratios, (J) methane conversion; (�) H2
selectivity; ( ) CO selectivity. Reaction conditions: Temperature = 1123 K, GHSV = 2.0 B 104 h-1
Figure 3. Comparison of CH4 versions and H2 and CO s
dif 2
In general, it such as oxygen vac
catalyst had higher activity and selectivity. We infer that the
rea
romoted nickel nan
conelectivities between metallic Ni catalyst (solid lines) and theyttria promoted nickel nanowire catalyst (dashed lines) at ferent reaction temperatures, (J) methane conversion; (�) H
selectivity; ( ) CO selectivity. Reaction conditions: CH4/O2 = 2.0, GHSV = 2.0 B 104 h-1
is known that defects, ancies, are important in the surface chemistry and catalysis
of metal oxides [39]. And the improved catalytic performance in oxidation catalysis has been attributed to a high concentration of oxygen vacancies [40-43]. Lattice oxygen ions often involve in reactions over oxide catalysts. Most of the partial oxidation reactions proceed via the Mars-van Krevelen mechanism, which is a redox model [44-47]. In this model, hydrocarbons react with surface lattice oxygen ions to form oxidized products, leaving a series of oxygen vacancies which are pending to be recruited by new formed lattice oxygen ions. The cycle for catalytic partial oxidation is closed via replenishment of the extracted lattice oxygen ions through the dissociative adsorption of molecular oxygen on the surface [48].
In the present work, the yttria promoted nickel nanowire
ction might proceed through the Mars-van Krevelen mechanism. The yttria promoted nickel nanowire catalyst had higher specific surface area, which shows promotion effect on the activity of catalyst, because the activity of catalyst was directly related to its surface area [49]. Higher surface area results in higher activity. Therefore, methane conversion and the selectivities to syngas on the yttria promoted nickel nanowire catalyst were much higher than those on the metallic Ni catalyst under the same reaction conditions.
From the reaction results (Figure 4), it is seen that the conversion and the selectivities on the yttria p
owire catalyst decreased with the increase of GHSV, while those on the metallic Ni catalyst increased. The difference in convective heat transfer coefficients for the two catalysts might be the most important reason to explain the differences in catalytic results. When heat was removed from the surface faster than it was generated by reaction, the temperature would fall. When the temperature fell below the ignition temperature of methane oxidation, reaction no longer occurred on that portion of the catalyst. This behavior was known as blowout. Blowout would occur easier on a catalyst geometry that had a high convective heat transfer coefficient [50]. Convective heat transfer occurs axially in the direction of flow, acting to transfer heat from the surface to the cooler gases. The convective heat transfer was much more efficient at removing heat from the yttria promoted nickel nanowire catalyst because of the much higher surface area and the tortuous flow passages in the catalyst [51]. With the increase of GHSV, the reactants increased in the feed which could result in the reaction blowout on the yttria promoted nickel nanowire catalyst. This led to the decrease in methane conversion and the selectivities to syngas on the yttria promoted nickel nanowire catalyst with the increase of GHSV.
Figure 4. Comparison of CH versions and H2 and CO selectivities between metallic i catalyst (solid lines) and the
(
4. ConclusionsThe yttria promoted nickel nanowire catalyst has higher
BET surface area than the metallic Ni catalyst. There is more NiO phase in the yttria promoted nickel nanowire catalyst than
4 conN
yttria promoted nickel nanowire catalyst (dashed lines) at different GHSV, (J) methane conversion; (�) H2 selectivity;
) CO selectivity. Reaction conditions: Temperature = 1123K, CH4/O2 = 2.0
214 Copyright © 2012 SciRes.

ich brings on more active ce
syngas increase. With the increase orea
nd.Chem. Res. 46, 8638 (2007).
[2] C.J. Bell, C.A. Lec 07). [3] M. Fleys, W.J. Sh Ind. Eng. Chem
46, 1063 (2007).
ary, Angew. Chem. Int. Ed. 47, 2 (2008)2007)
2008).
, Q.X. Li, Energy Fuels 21, 2421 (2007).
2007).
ne 2007.
ebdelfar, P. Bai, X.M. Liu, Z.F. Yan, Ap
uth: Micropor. Mesopor. Mater., 77, 1 (2005).
, 272,
: AIChE J., 52, 4276 (2006).
Ryoo: Chem. Commun., 17, 2136 (2003). , 7601
ngare, K. Malshe, C.S. Gopinath, I.K. Murwani, E. Kemnitz: J.
valas, Z.L. Zhang, X.E. Verykios: Catal. Lett., 40, 189 (1996).
kman, L.D. Schmidt: AIChE J., 39, 1164 (1993). :
9, 355 (2008).
u: J. Catal., 113, 45 (1988). em. Eng. J.
Schmidt: Appl. Catal., A, 211, 53 (2001).
in the metallic Ni catalyst, whin the CPOM.
nters [20] Y.Q. Song, D.H. He, B.Q. Xu, Appl. Catal., A: Gen. Available online 29 November 2007.
The yttria promoted nickel nanowire catalyst had higher CH4 conversion and H2 and CO selectivities than the metallic Ni during CPOM. With the increase of CH4/O2 ratios, the methane conversions on both catalysts decrease and the selectivities to f the [25] Y.H. Li, Y.Q. Wang, X.B. Hong, Z.G. Zhang, Z.P. Fang, Y. Pan, Y.B.
Lu, Z.Q. Hanction temperature, the methane conversions and the selectivities to H2 and CO on both catalysts increase. With the increase of GHSV, the methane conversion and H2 and CO selectivities on the metallic Ni catalyst increase, but those on the yttria promoted nickel nanowire catalyst decrease.
REFERENCES
[1] R.C. Ramaswamy, P.A. Ramachandran, M.P. Dudukovic, I Eng. Catal., 222, 80 (2004).
lerc, Energy Fuels 21, 3548 (20an, Y. Simon, P.M. Marquaire, . Res. [33] S. Eriksson, S. Rojas, M. Boutonnet, J.L.G. Fierro: Appl. Catal., A, 326,
8 (2007).
[4] C.W. Hu, J.J. Wu, H.L. Zhang, S. Qin, AIChE J. 53, 2925 (2007). [5] T.V. Choudhary, V.R. Choudh .
. [[6] K.A. Williams, R. Horn, L.D. Schmidt, AIChE J. 53, 2097 ([7] J.H. Ryu, K.Y. Lee, H.J. Kim, J.I. Yang, H. Jung, Appl. Catal., B:
Environ. 80, 306 ([8] U. Balachandran, J.T. Dusek, P.S. Maiya, B. Ma, R.L. Mieville, M.S. [38] A.S. Bodke, S.S. Bharadwaj, L.D. Schmidt: J. Catal., 179, 138 (1998).
[39] D.A. HicKleefisch, C.A. Udovich, Catal. Today 36, 265 (1997). [9] V.R. Choudhary, A.M. Rajput, B. Prabhakar, J. Catal. 139, 326 (1993). [[10] S.J. Feng, S. Ran, D.C. Zhu, W. Liu, C.S. Chen, Energy Fuels 18, 385
(2004). [11] V.R. Choudhary, K.C. Mondal, T.V. Choudhary, Catal. Commun. 8, 561
(2007). [12] T.F. Liu, C. Snyder, G. Veser, Ind. Eng. Chem. Res. 46, 9045 (2007). [13] Z.X. Wang, T. Dong, L.X. Yuan, T. Kan, X.F. Zhu, Y. Torimoto, M.
Sadakata[14] P. Mukoma, D. Hildebrandt, D. Glasser, N. Coville, Ind. Eng. Chem.
Res. 46, 156 ([15] A.B. Mhadeshwar, D.G. Vlachos, Ind. Eng. Chem. Res. 46, 5310 (2007). [4[16] S.F. Rice, A.H. McDaniel, E.S. Hecht, A.J.J. Hardy, Ind. Eng. Chem.
Res. 46, 1114 (2007). [17] J.H. Ryu, K.Y. Lee, H. La, H.J. Kim, J. Yang, H. Jung: J. Power Sources,
Available online 23 Ju[18] H.J. Wan, X.J. Li, S.F. Ji, B.Y. Huang, K. Wang, C.Y. Li, J. Nat. Gas
Chem. 16, 139 (2007). [19] M. Rezaei, S.M. Alavi, S. Sah pl.
Catal., B: Environ. 77, 346 (2008).
[21] J.T. Hu, T.W. Odom, C.M. Lieber: Acc. Chem. Res., 32, 435 (1999). [22] A. Taguchi, F. Sch[23] C.C. Wang, J.Y. Ying: Chem. Mater., 11, 3113 (1999). [24] P. Kim, Y.H. Kim, H.S. Kim, I.K. Song, J.H. Yi: Appl. Catal., A
157 (2004).
[26] D.J. Mei, Y.Q. Chen, J.B. Zhong, Z.L. Wei, D. Ma, M.C. Gong: J. Rare Earth, 25, 311 (2007).
[27] P.M. Torniainen, X. Chu, L.D. Schmidt: J. Catal., 146, 1 (1994). [28] F. Kleitz, S.H. Choi, R.[29] T.W. Kim, F. Kleitz, B. Paul, R. Ryoo: J. Am. Chem. Soc., 127
(2005). [30] T.W. Kang, Y.G. Park, J.H. Yi: J. Mol. Catal. A, 244, 151 (2006). [31] M.K. Do
[32] H. Mori, C.J. Wen, J. Otomo, K. Eguchi, H. Takahashi: Appl. Catal. A, 245, 79 (2003).
[34] C.T. Au, M.S. Liao, C.F. Ng: J. Phys. Chem. A, 102, 3959 (1998). [35] Y. Boucou36] S. Rabe, T.B. Truong, F. Vogel: Appl. Catal. A, 318, 54 (2007).
[37] L. Chen, Q. Hong, J. Lin, F.M. Dautzenberg: J. Power Sources, 164, 803 (2007).
40] M. Labaki, S. Siffert, J.F. Lamonier, E.A. Zhilinskaya, A. AboukaisAppl. Catal., B, 43, 261 (2003).
[41] J.J. Zhu, S. Albertsma, J.G. van Ommen, L. Lefferts: J. Phys. Chem. B, 109, 9550 (2005).
[42] Li, C. Y.; Shen, Y. N.; Jia, M. L.; Sheng, S. S.; Adebajo, M. O.; Zhu, H. Y. Catal. Commun.
[43] Durme, J. V.; Dewulf, J.; Leys, C.; Langenhove, H. V. Appl. Catal., B: Environ. 74, 324 (2008).
[44] W.X. Kuang, Y. Fan, Y. Chen: Langmuir, 16, 1440 (2000). [45] Z.X. Liu, Q.X. Bao, N.J. W
6] Galvez, M. E.; Boyano, A.; Lazaro, M. J.; Moliner, R. ChAvailable online 12 January 2008.
[47] Baylet, A.; Royer, S.; Marecot, P.; Tatibouet, J. M.; Duprez, D. Appl. Catal., B: Environ. 77, 237 (2008).
[48] J.J. Zhu, J.G. van Ommen, H.J.M. Bouwmeester, L. Lefferts: J. Catal., 233, 434 (2005).
[49] S. Ozkar, M. Zahmakiran: J. Alloys. Compd., 404, 728 (2005). [50] K.L. Hohna, L.D. [51] S. Whitaker: AIChE J., 18, 361 (1972).
Copyright © 2012 SciRes. 215

The Study of Method for Complex Processing Turgay Sub-Standard Aluminum-Containing Raw Materials
Sarsenbay G. Myltykbaeva L.A., Abdulwalyev R.A., Satylganova S.B. Center of Earth Sciences, Metallurgy and Ore Beneficiation, JSC, Science and Education Ministry of the Republic of
Kazakhstan ÈÉ[email protected]
Abstract – objects of the research are Kazakhstan’s Turgay clay, studied of method for alumina and potassium metasilicate obtaining from Turgay sub-standard aluminum raw materials. Concluded that optimal conditions for the process of Turgay clay: reaction temperature 100°C, original solution K2O concentration to 300 g/dm3, reaction time 120 min, liquid-solid ratio of 3:1; optimized the conditions of digestion alumina concentrate: original Na2O solution concentration of 400 g/dm3, temperature 280°C, molar ratio CaO : SiO2 = 1. Recovery is 99.6 % of alumina digestion under this condition; crystallized solid phase components as Na2O·Al2O3·6H2O sodium hydroaluminate crystals. Extracted of alumina from solution of sodium hydroaluminate Keywords – Potassium hydroxide solution; leaching; clay; alumina concentrate; sodium aluminate solution; digestion; desilication; alumina.
1. Introduction
With the reduction of bauxite resources, the application of low-grade aluminum-containing raw materials in aluminum production will be the key question. Kazakhstan is rich of low grade bauxite mine (burnt ash, clay), which were the storage of Turgay clay long enough to provide raw materials for alumina production [1]. For low grade aluminum ore, chemical beneficiation processing – alkali leaching to removal some silicon-containing to extraction silicate mineral, and alumina production by using concentrate can be comprehensive utilization of raw materials, solve problems of production effectively. Study on alkaline leaching of high-silicon aluminum ore, treated by sodium hydroxide solution and extraction silicate widely visible [2, 3], not seen on the potassium hydroxide reports. Potassium silicate as main ingredient for high-quality potassium fertilizer of chloride-free is widely used in agricultural production. For the purpose of this study to complex processing Turgay clay, potassium hydroxide solution used for the first time of low grade aluminum-containing raw materials dressing process, by planning central composite second order rotatable experiment and hydrochemical test, to find the best reaction condition of extraction from Turgay clay industrial alumina and chlorine-free potash fertilizer processing methods. 2. Experimental
1. Optimization process of clay ore dressing Potassium silicate solution and alumina concentrate can be obtained by baking clay leaching by potassium hydroxide solution, using central composite second order rotatable test [4] to find the optimal leaching conditions. Chemical composition of Turgay’s baking clay samples for experiments is: SiO2 37%; Al2O3 42.6%; Fe2O3 13.8 %; CaO 1.3 %; Na2O 0.8 %; other 1.5%; A/S=1.15. The experiments and results: using of the central composite of second order rotatable to develop test, factors influencing the leaching effect of three is made for the variable: X1 as the concentration for K2O in original solution, g/dm3; X2 for leaching time, min; X3 for liquid-solid ratio, percentage of SiO2 into solution (y) selected optimization parameter. Experiment conditions and results of Second order rotatable as shown in table 1.
Table 1 Conditions and results of experiments
�Conditions, g/dm3, min Solution components, g/dm3, %
X1 X2 X3 K2O Al2O3 SiO2 SiO21 100 60 2:1 61.1 1.38 98.0 48.212 300 60 2:1 211.5 2.46 243.5 79.003 100 180 2:1 56.4 1.63 99.5 48.944 300 180 2:1 253.8 2.89 228.5 78.405 100 60 4:1 61.1 1.13 70.5 69.326 300 60 4:1 282.0 2.64 105.0 79.447 100 180 4:1 61.1 1.63 72.5 71.298 300 180 4:1 282.0 3.13 97.5 82.849 31.8 120 3:1 30.25 2.64 26.5 20.9310 336.4 120 3:1 235.0 1.13 162.5 80.8611 200 19 3:1 188.0 1.13 95.0 65.0212 200 221 3:1 188.0 2.64 112.0 76.6613 200 120 1,31:1 188.0 2.64 208.0 62.2614 200 120 4,68:1 188.0 0.12 74.0 79.0615 200 120 3:1 164.5 1.63 114.3 78.2316 200 120 3:1 188.0 1.13 114.5 78.3717 200 120 3:1 164.5 1.13 114.0 78.0318 200 120 3:1 164.5 1.13 115.0 78.7119 200 120 3:1 164.5 1.63 113.5 77.6920 200 120 3:1 88.0 1.63 115.3 78.88
�����������������������������������������!�������"� �� �#�����������������$���������������%��������
�& ���������� �� ��������
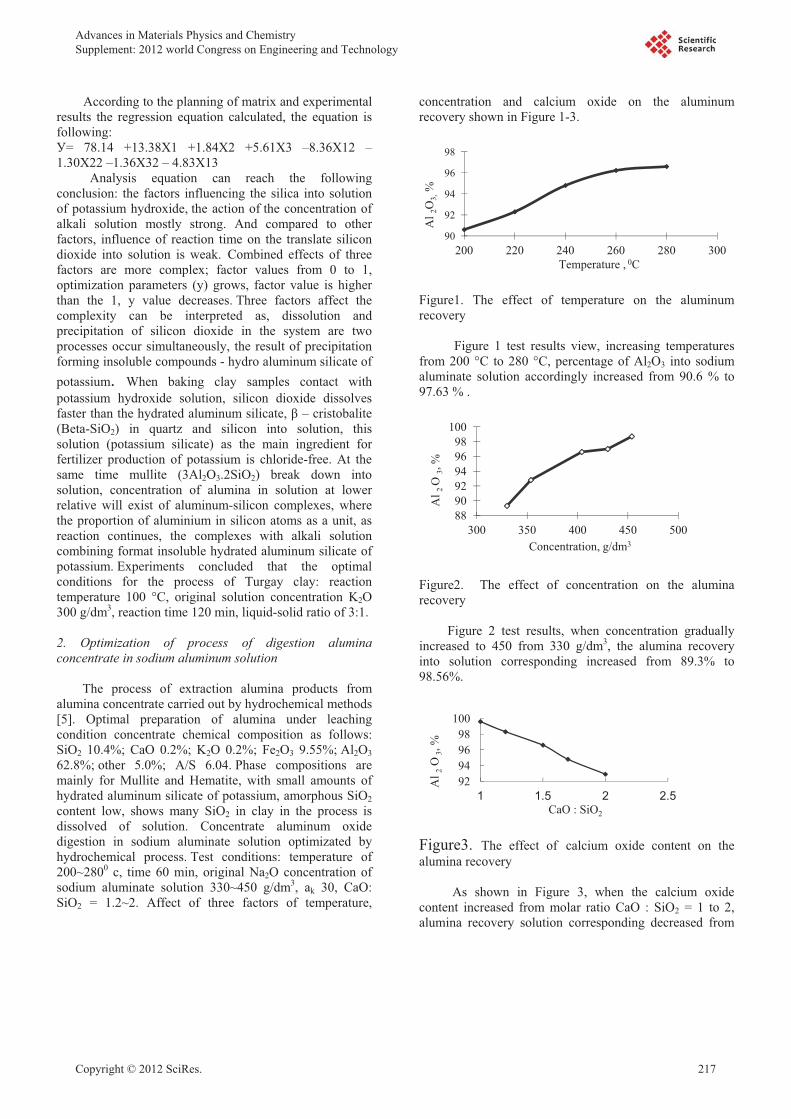
According to the planning of matrix and experimental results the regression equation calculated, the equation is following: Ê= 78.14 +13.38Ë1 +1.84Ë2 +5.61Ë3 –8.36Ë12 –1.30Ë22 –1.36Ë32 – 4.83Ë13 Analysis equation can reach the following conclusion: the factors influencing the silica into solution of potassium hydroxide, the action of the concentration of alkali solution mostly strong. And compared to other factors, influence of reaction time on the translate silicon dioxide into solution is weak. Combined effects of three factors are more complex; factor values from 0 to 1, optimization parameters (Ì) grows, factor value is higher than the 1, Ì value decreases. Three factors affect the complexity can be interpreted as, dissolution and precipitation of silicon dioxide in the system are two processes occur simultaneously, the result of precipitation forming insoluble compounds - hydro aluminum silicate of potassium. When baking clay samples contact with potassium hydroxide solution, silicon dioxide dissolves faster than the hydrated aluminum silicate, � – cristobalite (Beta-SiO2) in quartz and silicon into solution, this solution (potassium silicate) as the main ingredient for fertilizer production of potassium is chloride-free. At the same time mullite (3Al2O3.2SiO2) break down into solution, concentration of alumina in solution at lower relative will exist of aluminum-silicon complexes, where the proportion of aluminium in silicon atoms as a unit, as reaction continues, the complexes with alkali solution combining format insoluble hydrated aluminum silicate of potassium. Experiments concluded that the optimal conditions for the process of Turgay clay: reaction temperature 100 °C, original solution concentration K2O 300 g/dm3, reaction time 120 min, liquid-solid ratio of 3:1. 2. Optimization of process of digestion alumina concentrate in sodium aluminum solution
The process of extraction alumina products from alumina concentrate carried out by hydrochemical methods [5]. Optimal preparation of alumina under leaching condition concentrate chemical composition as follows: SiO2 10.4%; CaO 0.2%; K2O 0.2%; Fe2O3 9.55%; Al2O3 62.8%; other 5.0%; A/S 6.04. Phase compositions are mainly for Mullite and Hematite, with small amounts of hydrated aluminum silicate of potassium, amorphous SiO2 content low, shows many SiO2 in clay in the process is dissolved of solution. Concentrate aluminum oxide digestion in sodium aluminate solution optimizated by hydrochemical process. Test conditions: temperature of 200~2800 Í, time 60 min, original Na2O concentration of sodium aluminate solution 330~450 g/dm3, Èk 30, CaO: SiO2 = 1.2~2. Affect of three factors of temperature,
concentration and calcium oxide on the aluminum recovery shown in Figure 1-3.
Figure1. The effect of temperature on the aluminum recovery
Figure 1 test results view, increasing temperatures from 200 °C to 280 °C, percentage of Al2O3 into sodium aluminate solution accordingly increased from 90.6 % to 97.63 % .
Figure2. The effect of concentration on the alumina recovery
Figure 2 test results, when concentration gradually increased to 450 from 330 g/dm3, the alumina recovery into solution corresponding increased from 89.3% to 98.56%.
Figure3. The effect of calcium oxide content on the alumina recovery As shown in Figure 3, when the calcium oxide content increased from molar ratio CaO : SiO2 = 1 to 2, alumina recovery solution corresponding decreased from
90
92
94
96
98
200 220 240 260 280 300
Al 2
O3,
%
�emperature , 0Ä
889092949698
100
300 350 400 450 500
Al 2
O 3,
%
Äoncentration, g/dm3
92949698
100
1 1.5 2 2.5
Al 2
O3,
%
CaO : SiO2
�����������������������������������������!�������"� �� �#�����������������$���������������%��������
���������� �� �������� �'

99.6% to 94 %. Studied the best conditions of digestion: original solution Na2O concentration of 400 g/dm3, temperature 280°C, molar ratio CaO : SiO2 = 1. Recovery is 99.6 % of alumina digestion under this condition. 3. Optimization of process for desilication of sodium aluminate solution The chemical composition of sodium aluminate solution from processing alumina concentrate by hydro chemistry method as follows: Na2O 376.7 g/dm3; Al2O3 65.93 g/dm3; SiO2 4.22 g/dm3, �k 9.4 , �k high value of this solution, is not conducive to decomposition out Al(OH)3 from aluminate solution, therefore, needed to be decrease values �k before processing of crystallization. This test uses the crystallization from solution of hydrated sodium aluminate, water soluble crystals method gets the �k ~1,6 of sodium aluminate solution. When crystallization, small amounts of SiO2 will affect the crystallization in solution, so before the sodium aluminate hydrate, pre-desilication process of sodium aluminate solution. Take into account the effects of concentration on silicon removal efficiency, Na2O dilute solution concentration from 376.6 g/dm3 to 200 g/dm3, other components as Al2O3 35 g/dm3 accordingly, SiO2 2.2 g/dm3 Calcium oxide for desilication agent, add amount CaO : SiO2 to 1.5, 2 and 3 calculated, reaction time is 30 – 180 min, test conducted in the temperature range of 150-250 °C, as shown in table 2. Table2. Experimental conditions and results of desilication of sodium aluminate solution
N Conditions Components, g/dm3 Des.
rate, % t,°C CaO:Si
O2 min Na2O
Al2O3
SiO2
1 100 3 120 182,4 33,7 1,93 13,4 2 150 3 120 188 33,3 0,6 76,83 200 3 120 190,5 34 0,594 79,54 250 3 120 196 20,1 0,65 75 5 200 1 120 196 30 0,747 66,76 200 1,5 120 190 32 1,00 55,67 200 2 120 192 33,5 0,56 75 8 200 3 120 191 34 0,47 79,59 200 3 30 196 34 0,725 67,6
10 200 3 60 189 33,3 0,6 77 11 200 3 120 191 34 0,594 79 12 200 3 180 188 34 0,67 69,2
Test results showed highest conditions of sodium aluminate solution desilication rate: reaction temperature 200 °C, CaO added molar ratio CaO : SiO2 is 3, time for 120 min. Under this condition, sodium aluminate solution
desilication rate of 79.5%, solution composition for Na2O 191 g/dm3, Al2O3 34 g/dm3, SiO2 0.594 g/dm3, �k 9,2. 4. Study on formation of alumina from desilicated sodium aluminate solution 4.1 Separating out sodium hydroaluminate crystals from desilicated sodium aluminate solution Consists of sodium aluminate solution crystallization of sodium hydroaluminate - Na2O·Al2O3·nH2O test: to evaporation solution concentration of Na2O for 500-550 g/dm3, from which separation crystals. Test results are shown in table 3. After enrichment to concentrations of Na2O 548 g/dm3, removal of sodium aluminate solution concentration to concentrations of Na2O after 548 g/dm3, crystallization temperature of 45 °c, under the conditions to quality ratio of 0.05 to join seed crystal, constant stirring. Conditions and results of crystallization shown in table 3. Table3. Experimental conditions and results of crystallization of sodium hydroaluminate
Crystallization rate test results in mixing continuously when 50 h reached the highest value. Chemical composition of separated sodium hydroaluminate crystals: AI2O3 25.5%; Na2O 24.1 %; other 34.2,%, �Î 1,58, solid phase components as Na2O·Al2O3·6H2O, sodium hydroaluminate crystal x-ray diffraction curve as shown in Figure 4.
Figure 4. Sodium hydroaluminate crystal x-ray diffraction curve
Test conditions, Test results T�Ä
th
composition, g/dm3
composition, g/dm3
45
10
Al2O3
91,89Na2O561,1
�k 10
Al2O3 76,67
Na2O550,6
�� 11,8
45 20 91,89 561,1 10 71,44 538,5 12,445 30 91,89 561,1 10 31,2 527,3 27,845 40 91,89 561,1 10 29,5 502,1 29,045 50 91,89 561,1 10 27,33 501,8 30,2
�����������������������������������������!�������"� �� �#�����������������$���������������%��������
�+ ���������� �� ��������

4.2 Extraction of aluminum hydroxide from solution of sodium hydroaluminate Separate sodium hydroaluminate crystal �k is 1.58, this water-soluble crystals available �k value breaks and crystal decomposition conditions of sodium aluminate solution, from which precipitation Al (OH) 3 crystal [6]. Test procedures are as follows: dissolving sodium hydroaluminate crystal Na2O·Al2O3·6H2O, get aqueous chemical composition for, AI2O3 100.9 g/dm3; Na2O 98.1 g/dm3; �k is 1.58, according to the quality of the ratio of 0.3, to join seed – aluminum hydroxide in water solution, temperature of 62ºC - 44ºC conditions, to 70 p/min speed mixing hydrolysis of sodium aluminate solution to 48 h. According to table4 test findings, when 24 h reaction, hydrolysis rate of 41%, when 48 h reaction, hydrolysis rate Increased to 59%. Table 4 hydrolysis of sodium aluminate solution test results
Seed content
Time, h
Composition,g/dm3
�ΠHydrolysis
rate % Na2O AI2O3
0.3 24 100.3 61.5 2.75 41
0.3 48 105.7 42.7 4.1 59
After the complete hydrolysis of sodium aluminate solution, the liquid-solid separation are obtained solid aluminum hydroxide, chemical components for AI2O3 61.30%, Na2O 0.23%, other 35.75%, X ray diffraction curve shows the solid formation is divided into size 20-50 μm of gibbsite, as shown in Figure 5.
Figure5. Aluminium hydroxide crystals by x-ray diffraction curve 4.3 preparation of alumina from aluminum hydroxide From solid aluminum hydroxide under the condition of temperature of 1050º Í, calcined 1h we are meeting the criteria of production alumina solid products. Analysis and
identification of aluminum oxide crystals derived from chemical composition as: AI2O3 98.5%, Na2O 0.78%, SiO2 0.02%, Ti+V+Gr+Mn 0.01%, ZnO 0.01%, P2O5 0.002%, Fe2O3 0.026%, weight reduction is 1.2%. X-ray diffraction analysis and its solid groups are divided into: � Al2O3, Ï · Al2O3,Al2O3, Al2O3, � Al2O3, beta-Al2O3, as shown in figure 6.
Figure 6 aluminum oxide crystal by x-ray diffraction curve 3. Summary
By research: summary out KOH solution processing Turgay clay process and sodium aluminate solution digested out alumina concentrate process best reaction conditions; Optimization conditions of dissolving sodium aluminate solution desilication; crystalline solid phase components as Na2O·Al2O3·6H2O sodium hydroaluminate crystals; preparation meeting the criteria of production alumina solid products; study for the first time out complex alkaline processing method of clay application of KOH solution.
REFERENCE
1. Kirpal, G.R., (1970) Kaolin clay and allophone from Northern Kazakhstan / / Clay and mineralogy of their properties and practical value. Moscow, pp.226-228. 2. Suleyeva N.G., Sherban S.A., Tazhibayeva S.H., Romanov L.G., (1982) Study of solubility of ash components of Ekibastuz coal in alkaline comprehensive utilization of mineral raw materials. Ð 3, pp. 62-66. 3. Bukebayev E.T., Nurmagambetov H.N. Investigation of the process of kaolin clay desilication comprehensive utilization of mineral raw materials, 1982, Ð 8, pp.28-31. 4. Nalimov V.V., Chernova N.A. (1965) Statistical methods of planning extreme experiments, Moscow, p. 330. 5. Ni L.P., Raizman V.L., (1988) Combined methods of processing sub-standard aluminum raw material, Alma-Ata, p. 254.
�����������������������������������������!�������"� �� �#�����������������$���������������%��������
���������� �� �������� �*

6. Lainer A.I., Yeremin N.I. and others (1978) Production of alumina. 2-nd edition, Moscow, p.344
�����������������������������������������!�������"� �� �#�����������������$���������������%��������
� ���������� �� ��������

Sustainable Polymers Derived FromNaturally Occurring Materials
Bimlesh LochabDepartment of Chemistry
Shiv Nadar UniversityGreater Noida, India
I K. Varma; J. Bijwea
CPSE; ITMMECa
IIT, DelhiNew Delhi, India
Abstract-Nearly 95% of monomers or chemical intermediatesused today are based on fossilized carbon such as coal andpetroleum. This has resulted in a high rate of depletion offossilized reserves, continuous escalation in petroleum prices,environmental impact with the increase in emission ofgreenhouse gases, and accumulation of non-biodegradablewaste on earth. Current global main challenges are movingtowards green sources - need for vast new and sustainablematerial resources; supplement, reuse and replace petroleumbased polymeric materials; biodegradability of materials toprevent build up of waste; toxicity associated with thepreparation, usage and environmental safety. Recentinvestigations are therefore, focused on procuring materialsfrom the plant resources, agricultural waste and their utility insynthesis of polymeric materials. Amongst the polymersderived from natural resources poly(lactic acid) is a leadingcandidate. Commercial quantities of natural oil-based polyolssuch as castor, soya bean oil have been available over the pastseveral years and currently used for synthesis of polyesters,polyurethanes etc, but today many other natural materials arealso being investigated. It should be possible to producesustainable polymers commercially and economically.
Keywords- natural phenols, cardanol, lignophenol, sustainablepolymers, phenolic resin, benzoxazine
1. IntroductionNext decade challenges and opportunities are vast and alarming withthe current use of non-renewable based chemical sources forsynthesis of polymers and other architectures. There is a need toexplore agricultural waste materials for synthesis of polymers such asphenolic resins, polyesters, polyurethanes, etc. Phenolic sources arevast and widely distributed in wood, seeds, shell, cashew nut shellliquid (CNSL), lignin, palm oil and other plant-based resourceswhich are usually thrown as agricultural and agro-based industrialwaste, while lactic acid and long chain alcohols are derived from cornstarch, soya bean and castor oil respectively. The extraction andutilization of renewable monomers for a variety of bio-basedpolymers have been investigated in the past.However, there are several problems associated with naturallyoccurring renewable resources. These are (1) limited knowledgeabout the organic contents in the natural source, (2) varyingpercentage of chemical content and composition with species,geographical area, and climatic conditions (3) usually, a complex
Department of Science & Technology, Delhi, Indiachemical composition of the extracted material comprising of severalcompounds such as phenols, carboxylic acids, aldehydes, esters etc.needs higher costs of desired chemical recovery, (4) low percentageof the desired chemical species requires further processing and addsto additional costs.
The shifting of the resource base for organic chemicals fromfossil fuels to renewable resources creates a unique opportunity forshifting plastics from their current unsustainable course to a moresustainable life cycle. The research in this area is still at a nascentstage and scientists have to unfold the chemistry in this upcomingarea.
2.Sources of Renewable Materials
A. Naturally occuring phenoliccompoundsCurrently the agricultural wastes such as empty fruit bunches [1],
seed [2-3], fibre, shell [4], wood, bagasse [5] are being investigatedas a potential source of phenolic derivatives. Their main utilization atthe moment is to generate energy to run the mill by incinerating thewaste for power and fertilizer purposes. However, these wastes arerich in potential chemicals and pyrolysis is considered to be anemerging and potential technology to produce value added products,fuel, oil and chemicals from such waste. Moreover, an appropriateseparation and extraction method is required to maximize the desiredchemical from the agricultural waste. Some of these materials containa very high concentration of phenol and its derivatives, viz., cresol,catechol, guaiacols, syringol, eugenol etc. These products are veryhigh-value chemicals from the point of view of price, lower toxicityand environmental impact as compared to petroleum based products.Such waste could be utilized as an alternative source of phenols andits derivatives for the variety of applications ranging from theproduction of polymers and resins. The main naturally occurringphenolic sources that will be considered are cashewnut shell liquid(CNSL, Fig. 1), lignins (Fig. 2), palm oil and coconut shell tar.
Advances in Materials Physics and Chemistry Supplement: 2012 world Congress on Engineering and Technology
Copyright © 2012 SciRes. 221

OH
COOH
R
OH
R
OH
RHO
OH
RHO
H3C
R =
(a) (b)
(c) (d)
Fig. 1: Components in CNSL: (a) anacardic acid, (b) cardanol, (c) cardol, (d)2-methylcardol [4]
HO OCH3
HO
O
HO
H3CO
O
OCH3
OH
Fig. 2: Representative structure of (a) Lignin [6]
B. Naturally occuring acidsLactic acid is major by product of carbohydrate hydrolysis. It is oneof the most studied renewable monomer. The monomer L-lactide(LLA) can be prepared with relatively high enantiopurity from cornstarch fermentation.
C. Naturally occuring alcohols
(1) Vegetable oilsVegetable oils are triglycerides of long chain fatty acidmoieties (Fig. 3), with unsaturated bonds and free hydroxylgroups. The ester moieties are hydrolyzed to give carboxylicacid functionality (Fig. 4).
Fig. 3: Triglycerides R1=R2=R3 (aliphatic unsaturated or saturated)
Soyabean oil triglycerides are -linolenic acid (18C, 3 doublebonds, 7–10%); linoleic acid (18C, 2 double bonds, 51%);and oleic acid (18C, 1double bond, 23%). Mustard oil containserucic acid (22C, 1double bond, 42%), linolenic and linoleicacid (21%), oleic acid (12%). Castor oil consists of ricinoleicacid (85-95%) which is monounsaturated, 18-carbon fatty acid,is unusual in that it has a hydroxyl functional group on the12th carbon.
Fig. 4: Modifications and occurrence of fatty acid in oils: source formonomers and polymers from renewable resources [7]
(2) GlycerolGlycerol (propan-1,2,3-triol) is a byproduct of soap industryas result of transesterification reaction of fat in alkalinemedium to form soap (Fig. 5).
Fig. 5: Transesterification of fatty acid
Products such as glycerol carbonate and esters are goodintermediates for several polymers (Fig. 6) [8].
Fig.6: Utilization of greener sources namely glycerol and carbon dioxide toprepare carbonate
Mono-di-or tri ester could be produced by esterification withcarboxylic acid or transesterification with carboxylic acidmethylesters (Fig. 7) [9].
Fig.7: Monoesters of diglycerol
3.PolymersIncorporation of monomers obtained from green sources provides
new significant synthetic aspects and helps to produce partly greengoods with a finite content of renewable or recyclable materialextracted without odor problems and less use of fossil fuel reserves.
D. Polymers obatined from phenolicmaterialsThe presence of phenolic –OH group, aromatic ring and side
chains such as long alkylene chain in cardanol, could be utilized forvarious chemical transformations. Lignins have phenolic hydroxylgroups and aliphatic groups at C- and C- positions on the sidechain. The presence of such groups has enabled its utilization as apartial substitute for phenol in the synthesis with a lot of applications.The reactivity of lignin is determined both by its particular structurewith specific functional groups and its structural modificationsinduced by separation methods derived from different raw materials.
(1) Reactions due to –OH group
A variety of functional groups can be attached to the reactive freehydroxyl group for derivatization. The reactions may be divided intotwo categories a) nucleophilic aromatic/aliphatic substitution (b)condensation reaction. A generalized scheme for the possiblemodifications of –OH groups in naturally occurring phenoliccompounds (Fig. 8). Benzoxazines (Bzs) monomers are bicyclic
222 Copyright © 2012 SciRes.

heterocycles generated by the Mannich-like condensation of a phenol,formaldehyde and an amine [10] (Fig. 9). Our group reportedreplacement of petro-based phenolic compounds with agro-wastecardanol to synthesize mono- and bis-oxazine derivatives usingsolventless method and studied its ring-opening polymerization (ROP)to polybenzoxazine [11-13].
(1) Reactions due to aryl group
Aryl group present in lignophenol, cardanol, palm oil and CSTundergoes electrophilic aromatic substitution reactions. A generalizedreaction pathways possible for such structural modifications shown inFig. 10.
(3) Reaction due to side chain
Depending on the source of phenolic compound (i.e. cardanol,palm oil, lignophenols) the side group may be alkylene chain, methylor methoxy group etc. The modification of side chain allows furtherpossibilities to tailor the structure. The polymers obtained from thephenolic monomers can be either used as such crude or modified.
Fig.8: Modification of cardanol
N
R'
OHHO
OH
R
O
NR'
R
2 CH2O + R'NH2
Fig. 9: Synthesis of 3,4-dihydro-2H-1,3-benzoxazines
OH
N
N
OH
OH
N2+Cl-HO
Diazotised derivative
HOH2CO
OH
CH2OH
OH
CH2OH
OH
R
Base, CH2O
Methylol derivativeCH2O
Novolac resinA
A
A
A
A
A = side chain
Fig. 10: Modifications of aromatic ring
Naturally occurring phenolic compounds could act as a source forsynthesis of several polymers (Fig. 11).
PF resins
Polybenzoxazine
PU/ Polyesterresins
Methylol resins
Benzoxazine
Acrylate ormethacrylate
oxiranederivative
polyols
Epoxy resin
Poly(meth)acrylates
Novolac
PhenolicDerivatives
Fig. 11: Scheme depicting polymers obtained from naturally occurringphenolic monomers
E. Polymers from lactic acidHigh molecular mass poly(lactic acid) (PLA, Fig. 12) is obtainedeither by the polycondensation of lactic acid or ROP of the cyclicdimer 2,6-dimethyl-1,4-dioxane-2,5-dione commonly referred asdilactide or lactide. PLLA is a versatile, semi-crystalline, degradablepolymer having excellent mechanical properties, goodbiocompatibility and low toxicity. It has been used in a variety ofapplications in the pharmaceutical and biomedical fields, as well asused as a degradable plastic for disposable consumer products. Intissue engineering, PLLA has been used as biodegradable scaffoldwhere the transplanted cells can remold their intrinsic tissue super-structural organization and thereby lead to the desirable 3-dimensional structure and physiological functionality of aregenerated organ. The properties of PLLA can be tailor madeby copolymerization (random, block, and graft), change inmolecular architecture (hyperbranched polymers, star shaped,or dendrimers), functionalization (end group functionalizationor pendant groups such as carboxyl, amino, or thiol), orblending with other polymers [14].
Fig. 12: Poly(lactic acid)
F. Polymers from alcoholAliphatic fatty acids saturated and or unsaturated acids are
present in vegetable oils. They contain hydroxyl, carboxylicfunctionality and double bonds which are available for furtherfunctionalization to transform them to respective monomers [7]e.g. linseed oil, soyabean oil, sunflower oil, rape seed oil,castor oil, mustard oil, palm and coconut oil etc. These oilscan be used in synthesis of polyurethane, polyester, polyamide,polyacrylate, nylon and epoxy resin. For example, ozonolysisof oleic acid yields polyamide 6.9; ricinoleic acid which maybe used to give polyamide 10.10 and 6.10; 11-undecanoicacid obtained from castor oil has been used for the productionof nylon-11, polyamide 6.10 and polyols from sources such ascastor oil are undertaken by several industries such as EmeryOleochemicals, Evonik, Arkema, BASF [15]. The industryneeds to become more competitive and this includes breeding
Copyright © 2012 SciRes. 223

strains of plant with higher levels of useful fatty acids, likehigh oleic acid containing sunflower oil.
Glycerol dimethacrylate diester monomer can be used forthe synthesis of copolymers [16], glycerol carbonate forsynthesis of hyperbranched polymers [17].
G. Utility of carbon dioxideCarbon dioxide is green, environmentally benign, solvent andreactant that is cheap, non-toxic, non-flammable and naturallyabundant. It can be fixed and inserted in various compounds(Fig. 13) to from cyclic carbonates, caboxylates, carbamates,urea, salicylates etc.
The cyclic carbonates prepared by insertion of carbondioxide into an oxirane ring of ethylene/propylene oxide toform 5/6-membered cyclic carbonates which then undergoring-opening polymerization to form polycarbonates (Fig. 14).Unlike aromatic polycarbonates which either use toxicphosgene or diphenyl carbonate which accounts for hightoxicity, these showed good bio-compatibility,biodegradability, low toxicity, and find applications inbiomedical fields [18].
Fig. 13: Carbon dioxide as the reactant for various monomer synthesis
Fig. 14: Ring-opening polymerization of cyclic carbonates
H. ConclusionThe surge in living standards resulted in more dependence onpolymers articles for our daily needs. The usage of non-renewable based materials affects our environmenttremendously and measures are required to deal with it bothscientifically and globally. Polymers derived from renewablestarting materials are attractive because of safety and ecologyissues over petro-based materials such as (a) environmentaland economic concerns associated with waste disposal and (b)rising cost of petroleum production resulting from thedepletion of the most easily accessible reserves. These are theguiding principles for the next generation polymers whichhave zero or less ecology impact, sustainability, eco-efficiencyand green chemistry. Bio-polymers based on renewableresources include cellulosic-plastics, polylactides (PLA),starch-plastics, soy-plastics, phenol plastics.
The challenge for development of biodegradable polymerslies in the fact that such polymers should be able to beprocessed on the existing equipments, stable during storageand usage, and degrade when disposed off after their intendedlifetime [19]. There is a need for a research to develop newtechniques for utilization of renewable resources to synthesizenew intermediates/monomers for polymers for greenersustainable future.
REFERENCES[1] J. M. Kawser and A. F. Nash, “Oil palm shell as a source of phenol”, J.
Oil Palm Res., 12, pp. 86-94, 2000.[2] H. Kozlowska, D. A. Rotkiewicz, R. Zadernowski and F. W. Sosulski,
“Phenolic acids in rapeseed and mustard”, J. Am. Oil Chem. Soc., 60,pp.1119-23, 1983.
[3] L. Zahradníková, Š. Schmidt, Z. Sékelyová and S Sekretár,“Fractionation and identification of some phenolics extracted fromevening primrose seed meal”, Czech. J. Food Sci., 26, pp. 58–64, 2008.
[4] D. Wasserman and C. R. Dawson, “Cashew nut shell liquid: comparisonof the monophenol isolated from commercial raw cashew nut shellliquid and from commercial cardanol”, Ind. Eng. Chem., 37, pp.396-9,1945.
[5] E. R. Leal, R. R. Vaquez and T.Galindo, “Separation of phenoliccompounds from sugarcane bagasse pith and their determination byHPLC”, J. Wood Chem. Tech., 14, pp. 369-82, 1994.
[6] E. Dorrestijn, L. J. J. Laarhoven, I. W. C. E. Arends, and P. Mulder,“The occurrence and reactivity of phenoxyl linkages in lignin and lowrank coal”, J. Anal. Appl. Pyrolysis,54, pp.153–92, 2000.
[7] M. A. R. Meier, “Metathesis with oleochemicals: new approaches forthe utilization of plant oils as renewable resources in polymer Science”,Macromol. Chem. Phys., 210, pp. 1073–1079, 2009
[8] A. Behr, J. Eilting, K. Irawadi, J. Leschinski and F Lindner, “Improvedutilisation of renewable resources: New important derivatives ofglycerol”, Green Chem., 10, pp. 13–30, 2008.
[9] J. Barrault, J. M-. Clacens, Y. Pouilloux, “Selective oligomerization ofglycerol over mesoporous catalysts: catalytic conversion of renewables”,Topics in Catalysis, 27, pp. 137-142, 2004.
[10] N. N. Ghosh, B. Kiskan and Y. Yagci, “Polybenzoxazines-new highperformance thermosetting resins: Synthesis and properties”, Prog.Polym. Sci., 32, pp. 1344-1391, 2007.
[11] B. Lochab, I. K. Varma and J. Bijwe, “Thermal behaviour of cardanol-based benzoxazines: Monomers and polymers”, J. Therm. Anal.Calorim., 102, pp.769-774, 2010.
[12] B. Lochab, I. K. Varma and J. Bijwe, “Blends of benzoxazine monomers:Effect of structure and composition on polymer properties”, J. Therm.Anal. Calorim., DOI 10.1007/s10973-012-2469-1, pp.661-668, 2012.
[13] B. Lochab, I. K. Varma and J. Bijwe, “Cardanol based bisbenzoxazines:Effect of structure on thermal behaviour”, J. Therm. Anal. Calorim., 107,pp. 661-668, 2012.
[14] A. -C. Albertsson, I. K. Varma, B. Lochab, A. F. Wistrand and K.Kumar, “Design and synthesis of different types of poly(lactic acid)”, In“Poly(lactic acid): Synthesis, Properties, Processing and Applications”,2010, Eds. R. A. Auras, L. –T. Lim, S. E. M. Selke, and H. Tsuji, JohnWiley & Sons, Inc. 2010, Chapter 4, pp. 43-55.
[15] http://www.packagingeurope.com/Packaging-Europe-News/47370/Green-Chemistry-for-Polymers.html
[16] M. Roice, K. P. Subhashchandran, A. Gean, J. Franklin and V. N. R.Pillai, “Synthesis and characterization of glycerol dimethacrylate cross-linked polymethyl methacrylate: A resin for solid phase peptidesynthesis”, Polymer, 44, pp. 911–922, 2003.
[17] G. Rokicki, P. Rakoczy, P. Parzuchowski and M. Sobiecki,“Hyperbranched aliphatic polyethers obtained from environmentallybenign monomer: Glycerol carbonate, Green Chem., 7, pp. 529–539,2005.
[18] U. Edlund, A. -C. Albertsson, S. K. Singh, I. Fogelberg and B. O.Lundgren, “Sterilization, storage stability and in vivo biocompatibility
224 Copyright © 2012 SciRes.

of poly(trimethylene carbonate)/poly(adipic anhydride) blends,Biomaterials, 21, pp. 945-955, 2000.
[19] A. -C. Albertsson, “Renewable green polymers”, POLY-344, 234thACS National Meeting, Boston, MA, United States, August 19-23, 2007
Copyright © 2012 SciRes. 225

A Novel Method for the Protection and Activationof Histidine
Zhao Yinan, Zhang Shubiao*,Cui Shaohui, ChenHuiying, Wang Bing
Key Laboratory of Bio-chemistry Engineering - The StateEthnic Affairs Commission-Ministry of Education
Dalian Nationalities UniversityDalian, China
Zhao Yinan, Zhang Shufen*State Key Laboratory of Fine Chemicals
Dalian University of TechnologyDalian, China
Abstract—The yield and purity of synthetic peptides weregreatly related to the amino acid protection and activationduring the synthesis process. Therefore, the amino acidprotection and activation are the most important steps inpeptide synthesis. By using tetrahydrofuran as the solvent, 9-fluorenylmethoxycarbonyl as protection group, 2-(7-azobenzotri- azol-1-yl)-N,N,N′,N′-tetramethyluroniumhexafluorophosphate (HATU) as condensation reagent anamino protected histidine ester was given. In this article anovel synthesis method for N-(9- fluorenylmethoxycarbonyl)-histidine active ester was established. The reaction conditionsfor preparing this active ester were optimized. Theexperimental results indicated that solvents and active reagentshad remarkable effects on the yield of active ester. The bestconditions for preparing the active ester was a ratio of n(Fmoc-His-OH): n (HATU) = 1:1.2 with THF used as thesolvent at room temperature. The yield of the final productwas about 80% with a purity of over 85%. This simple methodwould provide fundamentals for the synthesis of otherprotected amino acid active esters.
Keywords-histidine; protection; activation; peptide
1. IntroductionProteins and peptides are important classes of bioactive
macromolecules that play key roles in controlling biologicalfunctions. Peptides often have a specific biological signal; andthey can significantly improve the adhesion of cells on thesurface (1). Indeed, there are numerous preclinical and clinicaltrials using proteins or peptides. These macromolecules arealso widely used as biochemical or pharmacological tools,especially peptides which are available at high purity grade bylarge-scale chemical synthesis. With the development ofpolypeptide drugs, various fields of scientist from chemistry,biology and medicine are paying more and more attention tothe research of this kind of new drugs. Recent years peptidesand their derivatives have been used for restraining cancer cellmigration, curing anti-thrombosis, treating acute renal failure,reducing anti-inflammation and promoting skin regeneration,etc (2,3). Especially people found that the introduction ofpeptide groups into cationic lipids can prolong their half-life invivo and enhance targeting thereof. The value of cationicliposomes with peptides for the delivery of genetic materials
has been realized gradually by researchers (4,5), as they havemany advantages, including numerous free active functionalgroups on their surface, avirulence, used either in vitro or invivo (6-8), no obvious limits for materials contained in size, noinflammation, and the control of the amount of the materialsinto the cells (8). Moreover, they maintain their physiologicalconcentration advantages, most amino groups have beenprotonated in the process of carrying genes, and thereby withpositive charge they could combine with negatively chargedplasmid DNA to form liposomes/DNA complexes byelectrostatic attraction (6). All the applications will depend onthe artificial peptide synthesis through the controlledconnection of different amino acids. The key difficulty is thatthe reagents used for the peptide connection can easily reactwith other groups such as the amino groups at the N-terminalof residues, carboxylic groups at the C-terminal of residues,reactive groups on the side chains and especially much moreactive SH groups. Therefore, in order to obtain the syntheticpeptide with specific order, people can only use the method ofstereospecific synthesis step by step. Before the connection ofdifferent amino acids was performed, these reactive groupsmust be blocked or protected to avoid the side reaction with theactivated reagents. In this paper, we elucidated a novel methodfor the simple synthesis and purification of protected histidineactive ester, which would lay a foundation of the large scalesynthesis of peptides. The results herein also showed muchimprovement over our previous study (9).
2. Materials and Methods
A. MaterialsAll the reagents employed in the synthesis of active ester
were of analytical purity. Methylene dichloride (CH2Cl2),tetrahydrofuran (THF), ethyl acetate and ethyl ether werepurchased from Shanghai Chemical Industry Co., Ltd.(Shanghai, China). Histidine,N-(9-Fluorenylmethoxycarbonyloxy) succinimide (Fmoc-OSu) , Boc-Gly-OH, O-(7-Azabenzotriazole-1-yl)- N,N,N′,N′-tetramethyl uranium(HATU) were purchased from Shanghai Medpep Co., Ltd.(Shanghai, China).
B. Instruments
Rotary evaporator, Shanghai Yarong BiochemistryInstrment Factory (Shanghai, China); Vacuum drying oven,
Advances in Materials Physics and Chemistry Supplement: 2012 world Congress on Engineering and Technology
226 Copyright © 2012 SciRes.

DHG-9070A, Shanghai Jing Hong Laboratory Instrument Co.,Ltd. (Shanghai, China); Infrared Spectrometer, NICOLET370,Thermo Electron Co., Ltd. (United States); HPLC-MS,SHIMADZU Co., Ltd. (Japan).
C. Synthesis of 9-Fluorenylmethoxycarbonyl-L-His-OH
N-(9-Fluorenylmethoxycarbonyloxy) succinimide wasused to protect the amino group of Histidine to obtain 9-Fluorenylmethoxycarbonyl-L-His-OH (Fmoc-His-OH) duringa one-step process which is depicted in Scheme 1. In this one-step process, histidine was dissolved in 25mL distilled water,Fmoc-OSu in 20mL THF. Then Histidine solution was addedto Fmoc-OSu solution slowly, following the adjustment of pHof 8-9 by using 10% sodium hydroxide and reaction at roomtemperature for 2h. After the reaction, the mixture fluid wasextracted with ethyl ether for three times, and then 20mLdistilled water was added following the adjustment of pH to 3with 10% hydrochloride. After extracted with ethyl acetate forthree times, the organic phase was washed with the 5% citricacid, saturated salt water and distilled water, respectively. Thesolution was dried with anhydrous magnesium sulfate and thesolvent was removed by rotary evaporation. Finally theresidual powder was subject to recrystallization through ethylether.
D. Synthesis of 9-Fluorenylmethoxycarbonyl-L-Histidineanhydrid
9-Fluorenylmethoxycarbonyl-L-histidine ester, whosesynthesis process is depicted in Scheme 2. In this synthesisprocess, 9-Fluorenylmethoxycarbonyl-L-His-OH (3mmol) wasdissolved in 20mL THF, HATU (3.6mmol) was dissolved in20mL acetonitrile, the two solutions were dropwise mixedslowly at room temperature and kept reaction for 16h. Afterthe reaction was completed, the solution was washed withCH2Cl2 and solvent was removed by rotary evaporation. Thefinal product with the yield of 80% or so and the purity of over85% was obtained through recrystallization from ethyl acetatefor three times.
O
O O N
O
O
+ HN
N
OH
NH2
O
NaOH
O
O
NHHC CH2
OOH
N
NH
Scheme1. Synthesis of 9-Fluorenylmethoxycarbonyl-L-His-OH
O
O
NHHC CH2
O OH N
NH
N
NN
ON
N
+
+O
O
NHHC CH2
O O N
NH
P
F
F
F
F
F
F
NN
N
Scheme2.Synthesis of 9-Fluorenylmethoxycarbonyl-L-Histidine ester
3. ResultsMany studies have shown that the amino acid protection
and activation have great influence on yield and purity of 9-Fluorenylmethoxycarbonyl-L-Histidine ester. Solvent and
other reagents used have influences on protection andactivation. Through the study of protection and activation ofhistidine, the optimum conditions of amino acid activationwere n (Fmoc-His-OH): n (HATU) = 1:1.2 by usingtetrahydrofuran as the solvent at the temperature of roomtemperature. The analytical results of chemical structure of theactive ester are listed below as shown in Fig1 and Fig2 of IR,and Fig3 and fig4 of MS.
408
29
507.83
548.02
744.16
1053.21
1252.06
1304.96
1412.28
1445.32
1618.16
1696.46
1767.94
2930.17
3275.13
5.0
5.2
5.4
5.6
5.8
6.0
6.2
6.4
6.6
6.8
7.0
7.2
%Transmittance
1000 2000 3000
Wavenumbers (cm-1)
Fig.1 The infrared spectrum of 9-Fluorenylmethoxycarbonyl-L-His-OH
747.46
1015.85
1250.11
1292.01
1405.59
1448.37
1488.86
1545.42
1616.54
1696.48
1767.03
2923.72
3059.24
3328.11
3415.573464.98
3543.78
13.0
13.5
14.0
14.5
15.0
15.5
16.0
16.5
17.0
17.5
18.0
18.5
19.0
19.5
20.0
20.5
21.0
21.5
22.0
22.5
%Transmittance
1000 2000 3000 4000
Wavenumbers (cm-1)
Fig.2 The infrared spectrum of 9-Fluorenylmethoxycarbonyl-L-Histidine ester
250 500 750 1000 1250 m/z0
500000
1000000
1500000
2000000
2500000
3000000
3500000
4000000Inten.
378.2
400.1
514.5277.0 693.7
Fig.3 The mass spectrum of 9-Fluorenylmethoxycarbonyl-L-His-OH
The study was supported by the National Natural Science Foundation of China(20876027 and 21176046) and the Fundamental Research Funds for the CentralUniversities(DC12010104).
Copyright © 2012 SciRes. 227

250 500 750 1000 1250 m/z0
50000
100000
150000
200000
250000Inten.
521.0
376.0
248.6 384.8657.2
693.5570.9 874.0 1155.0
1485.8112.5179.2 965.0 1287.1
Fig.4 The mass spectrum of 9-Fluorenylmethoxycarbonyl-L-Histidine ester
Fmoc-His-OH: ESI-MS m/z 377.53[M] , 378.53[M+H]+ , 400.53 [M+Na]+. IR ν/cm-1: 3300-3400 (νNH),3275.13(OH), 2950.27-2853.67(νCH), 1767.94(νC=O), 1252.06and 1053.21(Fmoc νC-O-C), 744(δCH).
9-Fluorenylmethoxycarbonyl-L-Histidine ester: ESI-MS m/z, 493.18[M], 248.6 [M+2H]+, 376, 384.8(segmentpeaks). IR ν/cm-1: 3328.11~3464.98(νNH), 2950.27-2923.72(νCH), 1767.03~1696.48(νC=O), 1292.01 and 1250.11(νOCOCO).
4. DiscussionThe results showed that the solvent system and dosage of
activation reagent HATU have great influence on yield andpurity of 9-Fluorenylmethoxycarbonyl-L-Histidine ester. Theyield of active ester could be greatly improved by using infirmpolarity of tetrahydrofuran as the solvent system. The lightexcess of HATU was also beneficial to the yield. During theprocess of 9-Fluorenylmethoxycarbonyl-L-His-OH synthesis,the pH of reaction system must be kept between 9~10,otherwise, activity of Fmoc-OSu could be greatly lowered. Onthe other hand, the rapid dropping speed could causeinadequate reaction. In the purification process, we have triedmany other solvents including ethanol, acetone, toluene, andso on. It was finally found that acetate ester was the bestsolvent for the recrystallization of both of 9-Fluorenylmethoxycarbonyl-L-His-OH, and 9-Fluorenyl-methoxycarbonyl-L-His ester. This study provided a novelmethod for the simple synthesis and purification of protectedhistidine active ester. This yield was highly improved
compared with the previous experiment (9), and the purity ofproduct was also well increased. Base on the study of theprotection and activation of histidine, we have built up amethod for the synthesis and purification of other amino acids,which could forward the synthesis of peptides for the drugsand drug delivery systems.
5. AcknowledgmentThe study was supported by the National Natural
Science Foundation of China (20876027 and 21176046) andthe Fundamental Research Funds for the Central Universities(DC12010104).
REFERENCES[1] S. B. Zhang, Y. N. Zhao, and B. D. Zhao. “Hybrids of nonviral vectors
for gene delivery,” Bioconjugate Chem. vol. 21, pp. 1003-1009, June2010.
[2] D. J. Coles, A. Esposito, and H. T. Chuah. “The synthesis andcharacterization of lipophilic peptide-based carriers for gene delivery,”Tetrahedron. vol. 66, pp.5435-5441, July 2010.
[3] Y. T. Ko, C. Falcao, and V. P. Torchilin. “Cationic liposomes loadedwith proapoptotic peptide D-(KLAKLAK)2 and Bcl-2 antisenseoligodeoxynucleotide G3139 for enhanced anticancertherapy,”Molecular Pharmaceutics, vol.6,pp.971-977, March 2009.
[4] D. L. McKenzie, K. Y. Kwok, and K. G. Rice. “A potent new class ofreductively activated peptide gene delivery agents,” J. Biol. Chem., vol.275, pp. 9970-9977, April 2000.
[5] M. A. Mintzer, E. E. Simanek. “Nonviral vectors for gene delivery,”Chem Rev., vol. 109, pp.259-302, April 2009.
[6] M. Nishikawa, M. Yamauchi, and K. Morimoto. “Heptocyte-targeted invivo gene expression by intraveneous injection of plasmid DNAcomplexed with synthetic multi-functional gene delivery system,” GeneTher.,vol. 7, pp.548-555, July 2000.
[7] M. J. Schuster, G. Y. Wu, and C. M.Walton. “Multicomponent DNAcarrier with a vesicular stomatitis virus G-peptide greatly enhaancesliver-targeted gene expression in mice,”Bioconjugate Chem.,vol.10,pp.1075-1083, October 1999.
[8] S. B. Zhang, Y. M. Xu, and B.Wang. “Cationic compounds used inlipoplexes and polyplexes for gene delivery,” J.Control Release, vol. 100,pp.165-180, November 2004.
[9] Y. N. Zhao,S. B. Zhang, and S. H. Cui. “Preparation of amino acidactive ester in peptide intermediate,” Chemical Word, vol.2, pp. 105-109,February 2012.
228 Copyright © 2012 SciRes.

In Vitro Study of Carbamate-Linked Cationic Lipid forGene Delivery Against Cervical Cancer Cells
Defu Zhi, Shuibao Zhang*, Yinan Zhao, Shaohui Cui,Bing Wang, Huiying Chen
SEAC-ME Key Laboratory of Biochemistry Engineering,Dalian Nationalities University,
Dalian, China
E-mail: [email protected]
Defu Zhi, Defeng Zhao*State Key Laboratory of Fine Chemicals, Dalian University
of Technology,Dalian, China
E-mail: [email protected]
Abstract—Design and synthesis of a carbamate-linkedcationic lipid DDCTMA (N-[1-(2,3-didodecylcarbamoyloxy)propyl]-N,N,N-trimethylammoniumiodide) as gene delivery carriers was described in this work.The transfection efficiency of cationic liposome increaseddramatically with the increase in the content of DOPE. Inaddition, the transfection efficiency of some of cationiclipoplexes was superior or parallel to that of two commercialtransfection agents, Lipofectamine2000 and DOTAP. Thecarbamate-linked cationic lipid DDCTMA/DOPE may be apromising gene carrier that has high transfection efficiency aswell as low cytotoxicity.
Keywords-cationic lipids; DNA condensation; genedelivery; transfection efficiency
1. IntroductionAs an important non-viral gene vector, cationic lipids have
attracted increasing attention because they have many potentialadvantages compared with other non-viral vectors, includingsignificant simplicity and ease of production, goodrepeatability, potential commercial value, and wide range ofclinical application and safety [1]. Felgner et al. [2] havedemonstrated that cationic lipid—DOTMA (N-[1-(2, 3-dioleoyloxy)propyl]-N,N,N-trimethylammonium chloride) wasan effective gene vector in the study of complex transfection,since then numerous cationic lipids with different structureshave been synthesized and used for the delivery of nucleicacids into cells during the last 25 years [3].
Cationic lipids have three basic chemical functionaldomains: a hydrophilic headgroup, a hydrophobic domain, anda linker bond that tethers the cationic headgroup andhydrophobic tail domain [4]. Linker bonds of cationic lipidshave large influence on the transfection efficiency,biodegradability and the stability of cationic lipids. Most of thelinker bonds in some synthesized lipids are ether, ester, oramide bonds, which are either too stable to be biodegraded andthus cause cytotoxicity (e.g., ether linkers) or prone todecompose during systemic circulation (e.g., ester linkers). Incontrast with these strategies, in a previous paper [5] wedeveloped two carbamate-linked lipids (DDCTMA andDDCEDMA) bearing quaternary ammonium headgroup andidentical length of hydrocarbon chains for the purpose of
taking advantage of the pH sensitivity of the carbamate bond(Scheme 1), which has high transfection efficiency in Hela andHep-2 cells as well as low cytotoxicity. To advance the studyof this lipid for gene delivery we investigated the influence ofthe N/P ratios on the characteristics of theDDCTMA/DOPE/DNA complex compared with twocommercial transfection agents, Lipofectamine2000 andDOTAP.
2. Materials and MethodsA. Instruments and Reagents
Most chemicals were obtained from Sinopharm Holding Co.Ltd. (Shanghai, China). 3-Chloro-1,2-propanediol waspurchased from Johnson Matthey (Hong Kong, China). N,N-carbonyldiimidazole (CDI) was purchased from Medpep Co.Ltd. (Shanghai, China). Cell culture media and fetal bovinesera (FBS) were purchased from Invitrogen Corporation(Carlsbad, CA, USA). Dulbecco’s modified Eagle’s medium(DMEM) was purchased from Sigma Co. Ltd. (USA).
Lipofectamine 2000 reagent was purchased from InvitrogenCorporation (Shanghai). DOTAP reagent was purchased fromRoche Diagnostics GmbH.
B. CharacterizationFTIR spectral studies were carried out with a Thermo
Nicolet 370 DTGS (USA) spectrometer in the range between4000 and 500 cm-1. All powder samples were compressed intoKBr pellets for the FTIR measurements. ESI-MS was detectedby SHIMADZU LCMS-2010EV (Japan) in methanol (MeOH)depending on sample solubility at room temperature.Electrospray ionization was achieved by application of apotential of 3.5 kV to a stainless needle. A Harvard apparatussyringe pump system was set at 3.0 mL/min. Nitrogen as anebulizer gas was delivered to the spectrometer by a nitrogenline. HPLC-ELSD was detected by SHIMADZU LCMS-2010EV (Japan) and SFD-ZAM3000 (Schambeck SFD GmbH,Germany). Nuclear magnetic resonance (NMR) spectrum wasrecorded on a Varian Mercury plus 400-MHz NMR (USA)spectrometer in chloroform (CDCl3) depending on samplesolubility at room temperature.
�����������������������������������������!�������"� �� �#�����������������$���������������%��������
���������� �� �������� *

C. Synthesis and Characterization of Cationic lipid(DDCTMA)Synthesis and characterization of cationic lipid DDCTMA
were as reported earlier [5]. The synthesis of cationic lipidDDCTMA is shown in Scheme 1.
Scheme 1. Synthetic routes of cationic lipid. Reagents and conditions: (a) 2.5equiv. 33% dimethylamine in aqueous solution, 1.0 equiv. sodium hydroxide,4 h at 50 ºC, (70%); (b) 2.1 equiv. CDI in toluene solution, 3 h at 40 ºC withN2; (c) 2.1 equiv. alkylamine in toluene solution, 3 h at 40 ºC with N2, (50-60%); (d) 40 equiv. halogenated hydrocarbons, 24 h, 80 ºC (95%).
D. Preparation of Liposomes and Plasmid DNAA solution of cationic lipid (1mg) in chloroform (1mL) was
evaporated under a stream of nitrogen, and the residual solventwas removed under vacuum overnight. Liposomes wereprepared by resuspending the lipid in distilled water (1mL) at55°C and sonicating them to clarity at this temperature for 2 hin a closed vial.
Plasmid pGL3 coding for luciferase gene was purchasedfrom Clontech (USA). Plasmid DNA was isolated using a BBIDNA purification kit. The DNA concentration was determinedby measuring UV absorbance at 260nm and 280nm, and thepurity was confirmed by agarose gel electrophoresis andOD260/280 measurement.
E. DNA Binding AssayDNA-lipid complexes were formed by mixing 2 �g of
plasmid DNA (0.1 �g/�L in 10mM Hepes buffer, pH 7.4) withvarying amounts of cationic lipid so that the final lipid/DNAcharge ratios were maintained at 0.5/1 to 8/1 in a total volumeof 50 �L. Complexes were incubated for 30 min at roomtemperature after which 20 �L of each lipoplex was loaded ona 1.2% agarose gel and subjected to electrophoresis. Thesamples were electrophoresed at 90 V for 1h, and the bandswere visualized with ethidium bromide staining.
F. Transfection AssayHuman cervical cancer cells (7721) were obtained from
ATCC (American Type Culture Collection ShanghaiRepresentative Office) and seeded in 100�l of growth medium(RPMI1640) without antibiotics. The cells were incubated at37 ºC in a fully humidified atmosphere containing 5% CO2, upto 80% confluence prior to use.
To measure transfection efficiency, liposomes and 0.5�gplasmid DNA were diluted in 25�l DMEM without serum,respectively, and mixed gently. Five minutes after dilution, thediluted liposomes were added to the diluted DNA and mixedtogether with vortex. The mixture was held for 20 min at roomtemperature to enable the lipoplex formation. The original cellculture media were replaced with the lipoplex solutioncontaining the transfection lipoplexes (prepared as describedabove) and phosphate buffered saline (PBS) for each well.They were incubated at 37ºC in a humidified incubator with5% CO2 for 4-6 h, then cells were washed by PBS or DMEMonce and the medium was exchanged with fresh and completeDMEM culture media and cells were further cultured for 48 h,prior to analysis. Finally, the transfection efficiency of some ofthe cationic liposomes, as % relative light units (RLU) wasmeasured by luciferase assay.
3. Results and DiscussionWe have described the synthesis of lipid DDCTMA and
reported some of its physicochemical characteristics andtransfection efficiencies in vitro and cytotoxicity using Helaand Hep-2 cell lines [5]. Herein, we not only investigated itsDNA-binding ability and transfection efficiencies using 7721cell lines but also researched on the influence of the N/P ratioson the characteristics of the DDCTMA/DOPE/DNA complexcompared with two commercial transfection agents,Lipofectamine2000 and DOTAP.
G. Properties of cationic liposomesIn order to determine the effect of DOPE and cationic
liposomes to pGFP-N2 plasmid charge ratios (N/P ratios),pGL3 plasmid complexes were prepared by adjusting thestoichiometry of cationic liposomes and plasmid (N/P, 0.5/1,1/1, 1.5/1, 2/1, 3/1, 4/1, 6/1and 8/1), using liposomes preparedfrom cationic lipid (DDCTMA) and a co-lipid (DOPE) atdifferent molar ratios (N/D, 2/1, 1/1 and 1/2).
N/D=2/1 N/D=1/1 N/D=1/2Figure 1. Gel electrophoresis of cationic liposomes (DDCTMA/DOPE=2/1,DDCTMA/DOPE=1/1, and DDCTMA/DOPE=1/2) /pGFP-N2 complexes atvarious weight ratios. Lane 1: marker ( DNA/EcoR I + Hind III Markersfrom SABC), lane 2: naked plasmid DNA (2 �g) and lanes 3�10: lipoplexesof plasmid DNA (2 �g) with progressively increasing proportions (N/P, 0.5/1,1/1, 1.5/1, 2/1, 3/1, 4/1, 6/1and 8/1) of cationic liposomes.
As shown in Fig. 1, the DNA-binding ability of cationicliposome increased with an increase in the N/P ratio, indicatingthat these liposomes have an ability to form a lipoplex withplasmid DNA. When the N/P ratio of DDCTMA/DOPE (2/1)liposome/DNA was greater than 2, liposome and DNA boundtightly and completely. When N/P was equal to 4, the band ofDDCTMA/DOPE (1/1) liposome/DNA was fainter than theN/P ratios of 6/1 and above. However, DDCTMA/DOPE (1/2)liposome was found to be the weakest in DNA binding, as the
Identify applicable sponsor/s here. (sponsors)
�����������������������������������������!�������"� �� �#�����������������$���������������%��������
�� ���������� �� ��������

band of plasmid DNA disappeared at the N/P ratio of 8/1.Obviously, the DNA-binding ability of cationic lipid decreasedwith an increase in the content of DOPE. It is postulated thatthe increase in the content of DOPE induces significantchanges in morphologies and structural parameters of thelipoplexes (such as, particle size and Ò-potential as showed intable I) and hence influences their DNA-binding ability [6].
TABLE I. PARTICLE SIZE AND ZETA POTENTIAL OF LIPOSOMES.
-potential(mV)
Particle size(nm) PDI a
Lipofectamine 2000 46.4 144 0.230
DOTAP 48.6 170 0.477
DDCTMA/DOPE=2/1 40.3 259 0.572
DDCTMA/DOPE=1/2 43 233 0.551
a. Polydispersity Index
H. In vitro transfectionIn constructing gene complex vectors, the molar ratio of
cationic lipid to co-lipid may play an important role ininfluencing the phase transition temperature of cationicliposomes and the structure of lipoplexes. To determine themost appropriate formulations, we prepared cationic liposomesof DDCTMA and DOPE with different molar ratios (N/Dratios, 2/1, 1/1 and 1/2), as these ratios are the most commonlyused proportions in cationic liposomes preparation [7], andtransfection efficiency was reported as % relative light unit(RLU) per mg of total protein content as shown in Fig. 2.Transfection efficiency of cationic liposome increaseddramatically with the increase in the content of DOPE. It maybe because the DNA-binding ability of cationic liposomes wastoo strong to release DNA from complex lower DOPE ratios,leading to relative lower transfection efficiency and the agarosegel electrophoresis experiments also supplement this fact.
0
10000
20000
30000
40000
50000
60000
0.5/1 1/1 2/1 3/1 4/1 6/1 8/1Liposomes
RLU
/mg
DDCTMA/DOPE=2/1 DDCTMA/DOPE=1/1DDCTMA/DOPE=1/2 Lipofectamine 2000DOTAP
Figure 2. Effect of DOPE composition in DDCTMA lipoplexes(DDCTMA/DOPE=2/1, DDCTMA/DOPE=1/1 and DDCTMA/DOPE=1/2)on transfection efficiencies in 7721 cells and compared with transfectionefficiencies of Lipofectamine2000 and DOTAP.
The N/P ratio is another important factor to affect thetransfection efficiency. With respect to the influence of weightratios, these cationic liposomes showed a maximumtransfection level at the N/P ratio of 2/1. As the N/P ratio
influences the property of lipoplexes in constructing genecomplex vectors, the N/P ratio has an impact on transfectionefficacy.
Under certain conditions, the transfection efficiency ofcarbamate-linked cationic lipid was superior or similar to thatof the two commercial transfection agents. For example,DDCTMA/DOPE=1/2-liposome demonstrated highertransfection efficiency at the N/P ratios of 2/1 compared withLipofectamine2000 and DOTAP. Therefore, thesynthetic carbamate-linked cationic lipid has a great potentialfor DNA complexation and may be useful as non-viral vectorsfor clinical therapy applications.
4. ConclusionsWe developed an efficient method of transfection by
combining cationic liposome and DOPE and showed that theN/P ratio of cationic liposome/DNA may markedly influencethe characteristics of the complex vector. The combination ofcationic liposome and DOPE resulted in the high genetransfection efficiency in vitro gene delivery. The resultsdemonstrate that the DNA-binding ability of cationicliposomes was too strong to release DNA from complex in thetransfection, leading to relative lower transfection efficiency.Additionally, the transfection efficiency of some cationicliposomes was superior or similar to that of the twocommercial transfection agents, which also suggested that thecomplex vector might be a promising gene carrier and can beconsidered for use in gene transfer in vivo.
5. AcknowledgmentThe study was supported by the National Natural Science
Foundation of China (20876027 and 21176046), Roche and theFundamental Research Funds for the Central Universities(DC12010104).
REFERENCES[1] L. Ciani, S. Ristori, A. Salvati, L. Calamai and G. Martini,
“DOTAP/DOPE and DC-Chol/DOPE lipoplexes for gene delivery: zetapotential measurements and electron spin resonance spectra,” Biochim.Biophys. Acta. vol. 1664, pp. 70-79, July 2004.
[2] P. L., Felgner and G. M. Ringold, “Cationic liposomemediatedtransfection,” Nature. vol. 337, pp. 387-388, January 1989.
[3] M. A., Mintzer and E. E., Simanek, “Nonviral vectors for genedelivery,” Chem. Rev. vol. 109, pp. 259-302, April 2009.
[4] D. F. Zhi, S. B. Zhang, B. Wang, Y. N. Zhao, B. L. Yang and S. J. Yu,“Transfection efficiency of cationic lipids with different hydrophobicdomains in gene delivery,” Bioconjugate Chem. vol. 21, pp. 563-577,January 2010.
[5] D. F. Zhi, F. Qureshi, S. B. Zhang, Y. N. Zhao, S. H. Cui, B. Wang, H.Y. Chen, Y. H. Wang and D. F. Zhao, “Synthesis and biological activityof carbamate-linked cationic lipids for gene delivery in vitro,” Bioorg.Med. Chem. Lett., vol. 22, pp. 3837-3841, February 2012.
[6] T. Yoshioka, S. Yoshida, T. Kurosaki, M. Teshima, K. Nishida, J.Nakamura, M. Nakashima, H. To, T. Kitahara and H. Sasaki, “Cationicliposomes-mediated plasmid DNA delivery in murine hepatitis inducedby carbon tetrachloride,” J. Liposome Res. vol. 19, pp. 141-147, June2009.
[7] S., Fletcher, A., Ahmad, E., Perouzel, M. R., Jorgensen and A. D.Miller, “A dialkanoyl analogue of DOPE improves gene transfer of
�����������������������������������������!�������"� �� �#�����������������$���������������%��������
���������� �� �������� ��

Optimization of Draft Tube Position in a Spouted Bed Reactor using Response Surface Methodology
Elaheh Baghban, Arjomand Mehrabani-Zeinabad
Chemical Engineering Department Isfahan University of Technology
Isfahan, Iran [email protected]
Abstract- Optimization of draft tube position in a spouted bed reactor used for treatment of wastewater containing low concentration of heavy metals is investigated in this paper. Response surface methodology is used to optimize the draft tube height, the draft tube width and the gap between the bottom of the draft tube and the inlet nozzle. It is observed that the draft tube with a height of 60 millimeter, width of 12 millimeter and the gap of 13 millimeter between its bottom and inlet nozzle, results in optimum value of minimum spouting velocity, measured 45 cubic centimeter per second (2.7 Liter per minute) .
Keywords- spouted bed; draft tube; minimum spouting velocity; Response surface methodology
1. Introduction Low concentration of heavy metals in contaminated
wastewater results in low reaction rates over electrode surface area and thus special considerations are necessary for reactor selection and design. Some of the most important requirements of these reactors are [1]:
3 Large active surface area per unit reactor volume 3 High mass transfer rate 3 High current efficiency 3 High current density 3 Low cell voltage 3 Uniform distribution of electrode potential 3 Low maintenance cost The spouted bed electrode studied at Berkeley in a
collaborative effort with PASMINCO, the Australian zinc company, may significantly improve the electrodeposition of heavy metals. The spouted bed consists of a vessel filled with relatively coarse particles. A jet of fluid is injected vertically through a small opening located centrally at the base of the vessel. If the jet velocity is high enough, it causes a stream of particles to rise rapidly in a central core within the bed. As the jet expands above the bed, the fluid velocity drops and the particles fall out onto the top of an annular region surrounding the central jet. The particles then move slowly down in the bed until they are again swept up in the central jet. A spouted bed may incorporate a ‘‘draft tube’’ to confine the spread of the central jet of fluid; in this way, spouted beds of large height-to-width ratio can also be operated. A spouting bed of conducting particles can then be made into an electrode by incorporating a current feeder and a diaphragm beyond which lies the counter electrode [2].
At low flow rates of electrolyte, there are no particles passing through the top of the draft tube and, therefore, no recirculation of particles. This is the ‘‘fixed bed zone’’; the
particles in the annular region are motionless. At higher flow rates, beyond a minimum spouting flow rate, particles issue from the top of the draft tube and recirculation occurs. This is the ‘‘stable spouted bed zone’’. The particles descend smoothly in the annular region. At a yet higher flow rate, the bed starts to behave irregularly, particularly in its upper regions, and the movement of particles in the annular region is no longer uniformly downward. It is conjectured that this ‘‘unstable spouted bed zone’’ is incipient fluidization of the particles in the annular region [3].
Hydrodynamics of the spouted bed was investigated by Verma et al. [3], Piskova and Mörl [4], Duarte et al. [5], Shirvanian et al. [6,7] and Kazdobin et al. [8]. The positive effect of draft tube existence on the performance of the spouted bed reactor used for waste water treatment is obvious. In this paper the draft tube position and height of the spouted bed of figure 1 is optimized via response surface methodology.
2. Methodology A. Experimental Set-up and Procedure
The dimensions of the spouted bed reactor of this study are shown in Fig.1. The draft tube (with rectangular cross section) was formed by vertical aluminum curved strips of different height in order to optimize the draft tube height (h), the draft tube width (d) and the gap dimension between the inlet nozzle and the bottom of the draft tube (g). The curvature of the bottom of the draft tube was designed due to gained results of the previous runs which confirm the positive effect of this curvature on decreasing the minimum spouting velocity. The inlet nozzle diameter was set to 4 mm based on previous runs in order to minimize the minimum spouting velocity as well as to create the stable spouting.
The reactor inlet flow enters from the inlet bottom nozzle after passing through a rotameter and exits from an opening inserted beside the reactor. The pressure drop was measured
Advances in Materials Physics and Chemistry Supplement: 2012 world Congress on Engineering and Technology
232 Copyright © 2012 SciRes.

using a manometer. The Plexiglas construction and ‘‘flat’’ geometry of the reactor provided the observation of the spouted bed, including the interior of the draft tube.
Figure 1. Spouted bed electrode of this experiment
(12<d<24, 60<h<100,13<g<23)
All of the dimensions are in millimeter.
The reactor inlet flow increased gradually till the Copper particles (92.8% mesh 16-20, 7.15% mesh 20-30) were begun to sweep out of the apparatus from the ‘‘fountain’’ at the top of the draft tube. However this flow represents the minimum spouting velocity, but the result is not exactly reproducible as discussed by Epstein and Mathur [9]. A more reproducible result is obtained by increasing the flow more than the minimum spouting velocity and then slowly decreasing the flow: The bed then remains in the spouted state until the flow represents the reproducible minimum spouting velocity of the reverse process. A slight reduction of flow at this point causes the spout to collapse [9].
The reproducible minimum spouting velocity of the reverse process was obtained for different height, width and vertical gap between the inlet nozzle and the bottom of the draft tube in runs designed by response surface methodology in order to optimize the height and the position of the draft tube.
B. Design of Experiment via Response Surface Methodology The response surface methodology (RSM) is a statistical
and mathematical technique used for modeling and
optimization of the processes in which a response of interest is influenced by several variables. It specifies the effect of the independent variables on the process, either individually or collectively. Furthermore, the experimental methodology generates a mathematical model describing the processes [10].
The design procedure of the response surface methodology is as follows [10,11]:
3 Determination of independent variables and their levels. 3 Development of the best fitting mathematical model of
the second order response surface. 3 Determination of the optimal sets of experimental
parameters that produce a maximum or minimum value of response.
3 Obtaining the response surface plot and the contour plot of the response as a function of the independent parameters. The total number of experiments required for this
methodology is determined by [12]:
� Kumber of experiments� 2k����2k����i�� ���� �
Where k is the number of independent variables and i is the number of random replications at the design center to evaluate the pure error.
The responses are related to variables by quadratic models, where Ó is the response, xi and xj are coded variables, �0 is the constant coefficient, �j , �jj and �ij are the interaction coefficients of linear, quadratic and the second-order terms, respectively and ei is the error [13]:
� exxxxk
j i
k
jjiijjjj
k
jjj $ $$$
I
���� 1 2
2
10 ����A � ���� �
In this experiment some of the effective hydrodynamic variables such as draft tube height, draft tube width and the gap between the draft tube bottom and the inlet nozzle were considered as independent variables and the minimum spouting velocity was the response. Each independent variable was coded at three levels between -1 and +1 where the variables of the draft tube width (x1), the draft tube height (x2) and the gap between the bottom of the draft tube and inlet nozzle (x3), were changed in the ranges 12-24 mm, 13-23 mm and 60-100 mm. The critical ranges of selected parameters were determined by preliminary experiments based on literature experiences, our previous experiments and physical limitations.
Eighteen experiments were augmented with four replications at the design center as represented in Tab. 1. First four columns show run number and experimental conditions of the runs.
The result was related to the independent variables according to (2) using Design-Expert 7. 1. 3. program including ANOVA. The coefficients of determination R-Squared (R2) and Adj R-Squared (R2
adj) expressed the quality of fit of the resultant polynomial model, and statistical significance was checked by F-test in the program. For
Copyright © 2012 SciRes. 233
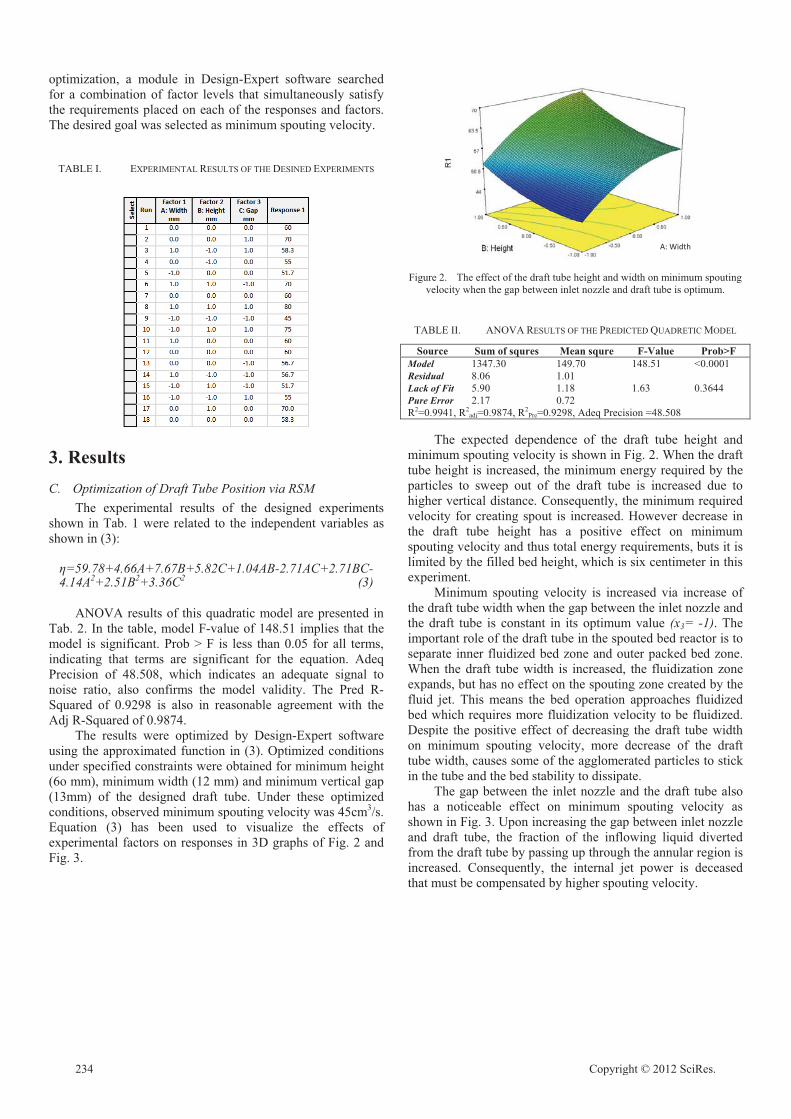
optimization, a module in Design-Expert software searched for a combination of factor levels that simultaneously satisfy the requirements placed on each of the responses and factors. The desired goal was selected as minimum spouting velocity.
TABLE I. EXPERIMENTAL RESULTS OF THE DESINED EXPERIMENTS
3. Results C. Optimization of Draft Tube Position via RSM
The experimental results of the designed experiments shown in Tab. 1 were related to the independent variables as shown in (3):
�=59.78+4.66A+7.67B+5.82C+1.04AB-2.71AC+2.71BC-4.14A2+2.51B2+3.36C2 (3)
ANOVA results of this quadratic model are presented in Tab. 2. In the table, model F-value of 148.51 implies that the model is significant. Prob > F is less than 0.05 for all terms, indicating that terms are significant for the equation. Adeq Precision of 48.508, which indicates an adequate signal to noise ratio, also confirms the model validity. The Pred R-Squared of 0.9298 is also in reasonable agreement with the Adj R-Squared of 0.9874.
The results were optimized by Design-Expert software using the approximated function in (3). Optimized conditions under specified constraints were obtained for minimum height (6o mm), minimum width (12 mm) and minimum vertical gap (13mm) of the designed draft tube. Under these optimized conditions, observed minimum spouting velocity was 45cm3/s. Equation (3) has been used to visualize the effects of experimental factors on responses in 3D graphs of Fig. 2 and Fig. 3.
Figure 2. The effect of the draft tube height and width on minimum spouting
velocity when the gap between inlet nozzle and draft tube is optimum.
TABLE II. ANOVA RESULTS OF THE PREDICTED QUADRETIC MODEL
Source Sum of squres Mean squre F-Value Prob>F Model 1347.30 149.70 148.51 <0.0001 Residual 8.06 1.01 Lack of Fit 5.90 1.18 1.63 0.3644 Pure Error 2.17 0.72 R2=0.9941, R2
adj=0.9874, R2Pre=0.9298, Adeq Precision =48.508
The expected dependence of the draft tube height and
minimum spouting velocity is shown in Fig. 2. When the draft tube height is increased, the minimum energy required by the particles to sweep out of the draft tube is increased due to higher vertical distance. Consequently, the minimum required velocity for creating spout is increased. However decrease in the draft tube height has a positive effect on minimum spouting velocity and thus total energy requirements, buts it is limited by the filled bed height, which is six centimeter in this experiment.
Minimum spouting velocity is increased via increase of the draft tube width when the gap between the inlet nozzle and the draft tube is constant in its optimum value (x3= -1). The important role of the draft tube in the spouted bed reactor is to separate inner fluidized bed zone and outer packed bed zone. When the draft tube width is increased, the fluidization zone expands, but has no effect on the spouting zone created by the fluid jet. This means the bed operation approaches fluidized bed which requires more fluidization velocity to be fluidized. Despite the positive effect of decreasing the draft tube width on minimum spouting velocity, more decrease of the draft tube width, causes some of the agglomerated particles to stick in the tube and the bed stability to dissipate.
The gap between the inlet nozzle and the draft tube also has a noticeable effect on minimum spouting velocity as shown in Fig. 3. Upon increasing the gap between inlet nozzle and draft tube, the fraction of the inflowing liquid diverted from the draft tube by passing up through the annular region is increased. Consequently, the internal jet power is deceased that must be compensated by higher spouting velocity.
A:�Width�
234 Copyright © 2012 SciRes.

4. Conclusion In this paper, the dependence of minimum spouting
velocity and the draft tube height, the draft tube width and the gap between the bottom of the draft tube and the inlet nozzle was investigated through experiments designed by response surface methodology. The mathematical model fitted by Design Expert software and validated by ANOVA, was used in order to optimize the mentioned variables.
Figure 3. The effect of the draft tube height and the gap between inlet nozzle and the draft tube on minimum spouting velocity when the draft tube width is
optimum
It was observed that the optimized draft tube height, draft tube width and the gap between the draft tube and the inlet nozzle are 60 mm, 12 mm and 13 mm, respectively which represents the minimum spouting velocity of 45 cubic centimeter per second (2.7 Liter per minute).
REFERENCES [1] K. Scott, “ Journal Review. Electrochemical Methods for the Treatment
of Industrial Process Streams and Effluents. Part 1: Cell Design and the
Recovery of Dissolved Metals by Electrodeposition”, Developments in Chemical Engineering and Mineral Processing, Vol. 1, pp. 185-197, October 1992.
[2] V. Jiricny, A. Roy, J. W. Evans, “Electrodeposition of Zink from Sodium Zincate/Hydroxide Electrolytes in a Spouted Bed Electrode”, Metallurgical and Materials Transactions, Vol. 31B, pp. 755-766, Aug, 2000
[3] A. Verma, J. C. Salas-Morales, J.W. Evans, “Spouted Bed Electrowinning of Zinc: Part II. Investigations of the Dynamics of Particles in Large Thin Spouted Beds”, Metallurgical and Materials Transactions, Vol. 28B, pp. 69-79, Feb 1997
[4] E. Piskova and L. Mörl, “Fluidization regimes in different spouted bed apparatus constructions”, Chemical Engineering and Processing, Vol. 46, pp.695-702, 2007.
[5] C. R. Duarte, V. V. Murata, A. S. Barrozo, “ Experimental and Numerical Study of Spouted Bed Fluid Dynamics”, Brazilian Journal of Chemical Engineering, Vol. 25, pp. 95-107,January-March 2008.
[6] P. A. Shirvanian, J. M. Calo, G. Hradil, “ Numerical Simulation of Fluid-Particle Hydrodynamics in a Rectangular Spouted Vessel”; Interrnational Journal of Multiphase Flow, Vol. 32, pp. 739-753, 2006.
[7] P.A. Shirvanian, J. M. Calo, “Hydrodynamic scaling of a rectangular spouted vessel with a draft duct”, Chemical Engineering Journal, Vol. 103, pp. 29-34, 2004
[8] K. Kazdobin, N. Shvab, S. Tsapakh, “ Scaling-up of Fluidized Bed Electrochemical Reactors”, Chemical Engineering Journal, Vol. 79 , pp. 203-209, October 2000
[9] K. B. Mathur., N. Epstein, “Spouted Beds”,Academic Press. Inc., 1974, pp. 15-25.
[10] R. Saravanathamizhan, N. Mohan, N. Balasubramanian, V. Ramamurthi , C. Ahmed Basha, “ Evaluation of Electro-Oxidation of Textile Effluent Using Response Surface Method”, Clean, Vol.35, pp. 355-361, July 2007
[11] D. Granato, G. F. Branco, V. M. de AraÔjo Calado, “ Experimental Design and Application of Response Surface Methodology for Process Modelling and Optimization: A Review”, Food Research International, 2001
[12] B. K. Körbahti, A. Tanyolaç. “Electrochemical Treatment of Simulated Textile Wastewater with Industrial Components and Levafix Blue CA Reactive Dye: Optimization through Response Surface Methodology”. Journal of Hazardous Materials, Vol. 151, pp. 422-431, 2008
[13] B. K. Körbahti, N. AktaÕ, A. Tanyolaç.,” Optimization of Electrochemical Treatment of Industrial Paint Wasteater with Response Surface Methodology’, Journal of Hazardous Materials, Vol. 148, pp. 83-90, 2008
Copyright © 2012 SciRes. 235

Comparison of Gas Permeability and Selectivity Between Alumina Membrane and Vycor Glass at High Temperatures
F.N.TÜZÜN Department of Chemical Engineering,
Hitit University, 19100, Çorum, TURKEY
e-mail: [email protected]
E.KOÇDEMØR Department of Chemical Engineering,
Hitit University, 19100, Çorum, TURKEY
G.UÙUZ Department of Chemical Engineering,
Hitit University, 19100, Çorum, TURKEY
Abstract— In this study, gas permeability and selectivity of Vycor glass and alumina membrane were compared by using H2, CO2, CO, CH4 and N2 gases at the temperatures of 323-823 K before and afterapplying the silica coating process. H2 permeability decreased with increasing the temperature before silica coating both in Vycor glass and alumina membrane. However, H2 permeability increased with increasing the temperature, that was an indication of activated transport after silica coating both in Vycor glass and alumina membrane. Lower permeability values and higher selectivities were obtained in Vycor glass membrane than alumina membrane having higher permeability and lower selectivities.
Keywords- membrane, hydrogen, permeability, selectivity
1. Introduction
Membrane separation of gaseous mixtures has come to attract much attention from the viewpoint of energy-conservative recovery of gases, especially at high temperature, where most of ordinary organic membranes can not be applied because of their thermal instability. In contrast, inorganic membranes, which seem quite stable at high temperature and against most chemicals, will preferably be applied to gas separation processes as in [1].
The preparation and application of ceramic membranes
has received much attention in the past few years as in [2]. Ceramic membranes are technically important in separation and filtration as well as in catalytic reactions, because of their high thermal and chemical stability, long life time and good
defouling properties in comparison with polymeric membranes as in [3, 4].
Hydrogen permeable and selective silica membranes have
attracted much interest in the membrane gas separation field due to the importance of hydrogen as an industrial feedstock for the production of fuels and many chemicals as in [5, 6]. Silica membranes are attractive since they are chemically and thermally stable while offering high permeability and selectivity for hydrogen as in [7].
Silica fabricated by the sol-gel process is known to have
high surface area and microporosity as in [8-10]. The sol-gel process, in this case, refers to the controlled hydrolysis and polymerization of tetraethylorthosilicate(TEOS) in a water-alcohol solution as in [11-12]. The solution goes through an irreversible sol-gel transition. The resulting gel can be dried to a rigid silica-like material.
2. Experimental
The alumina membrane changing the particle size distribution from 3 μm to 70 nm with the diameter of 21 mm and the thickness of 1 mm was purchased from Germany. The Vycor glass having the mean particle size of 40 Angstrom with the diameter of 21 mm and the thickness of 1 mm was purchased from USA. Gas permeability tests of Vycor glass and alumina membrane were performed by using H2, CO2, CO, N2 and CH4 gases at constant volume-variable pressure measurement system between 323 and 823 K and H2
THE SCIENTIFIC AND TECHNOLOGICAL RESEARCH COUNCIL OF TURKEY gave the financial support for the
preparation of this work.
Advances in Materials Physics and Chemistry Supplement: 2012 world Congress on Engineering and Technology
236 Copyright © 2012 SciRes.
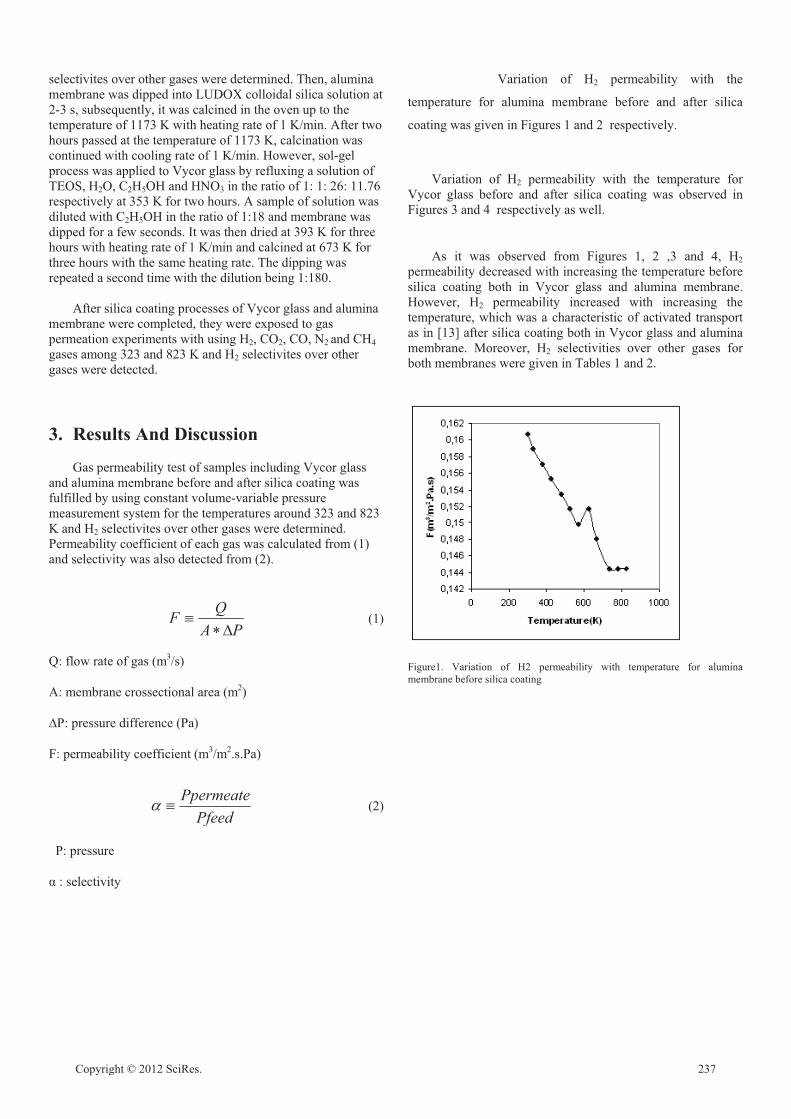
selectivites over other gases were determined. Then, alumina membrane was dipped into LUDOX colloidal silica solution at 2-3 s, subsequently, it was calcined in the oven up to the temperature of 1173 K with heating rate of 1 K/min. After two hours passed at the temperature of 1173 K, calcination was continued with cooling rate of 1 K/min. However, sol-gel process was applied to Vycor glass by refluxing a solution of TEOS, H2O, C2H5OH and HNO3 in the ratio of 1: 1: 26: 11.76 respectively at 353 K for two hours. A sample of solution was diluted with C2H5OH in the ratio of 1:18 and membrane was dipped for a few seconds. It was then dried at 393 K for three hours with heating rate of 1 K/min and calcined at 673 K for three hours with the same heating rate. The dipping was repeated a second time with the dilution being 1:180.
After silica coating processes of Vycor glass and alumina
membrane were completed, they were exposed to gas permeation experiments with using H2, CO2, CO, N2 and CH4 gases among 323 and 823 K and H2 selectivites over other gases were detected.
3. Results And Discussion
Gas permeability test of samples including Vycor glass
and alumina membrane before and after silica coating was fulfilled by using constant volume-variable pressure measurement system for the temperatures around 323 and 823 K and H2 selectivites over other gases were determined. Permeability coefficient of each gas was calculated from (1) and selectivity was also detected from (2).
� LFPA
Q�M
������� ����
Q: flow rate of gas (m3/s)
A: membrane crossectional area (m2)
�P: pressure difference (Pa)
F: permeability coefficient (m3/m2.s.Pa)
�Pfeed
PpermeateL� ���������� ����
��P: pressure �������������������������������������
� : selectivity
Variation of H2 permeability with the
temperature for alumina membrane before and after silica
coating was given in Figures 1 and 2 respectively.
Variation of H2 permeability with the temperature for Vycor glass before and after silica coating was observed in Figures 3 and 4 respectively as well.
As it was observed from Figures 1, 2 ,3 and 4, H2 permeability decreased with increasing the temperature before silica coating both in Vycor glass and alumina membrane. However, H2 permeability increased with increasing the temperature, which was a characteristic of activated transport as in [13] after silica coating both in Vycor glass and alumina membrane. Moreover, H2 selectivities over other gases for both membranes were given in Tables 1 and 2.
Figure1. Variation of H2 permeability with temperature for alumina membrane before silica coating
Copyright © 2012 SciRes. 237

Figure 2. Variation of H2 permeability with temperature for alumina membrane after silica coating
According to the Tables 1 and 2, H2 selectivities over N2
and CH4 gases decreased, while H2 selectivity with respect to CO2 gas increasing after silica coating in alumina membrane. This result may be due to the surface diffusion of gas molecules. However, H2 selectivities over CO2 and CH4 gases increased, when H2 selectivity in view of CO2 gas decreased after silica coating in Vycor glass.
Figure 3. Variation of H2 permeability with temperature for Vycor glass before silica coating
Figure 4. Variation of H2 permeability with temperature for Vycor glass after silica coating
Results showed that alumina membrane with having higher permeability and lower selectivity, Vycor glass membrane having lower permeability and higher selectivity were obtained.
Table 1. H2 selectivities over other gases for alumina membrane
Alumina
membrane
Selectivities Before silica coating
After silica coating
H2/N2 0,221118012 0,030482257 H2/CO2 0,148472744 1,777078454 H2/CH4 0,15335213 0,030238693
Table 2. H2 selectivities over other gases for Vycor glass
Vycor glass
Selectivities Before silica coating
After silica coating
H2/N2 6.515 4.712 H2/CO2 5.346 5.763 H2/CH4 4.475 10.468
4. Acknowledgment
The authors would like to thank to THE SCIENTIFIC
AND TECHNOLOGICAL RESEARCH COUNCIL OF TURKEY for the financial support given in 2209 Scientist Supporting Programme related to the preparation of this work.
238 Copyright © 2012 SciRes.

REFERENCES [1] S.Kitao, H.Kameda, M.Asaeda, Membrane, 15(4), 222-227 (1990). [2] J.-H.Lee, S.-C. Choi, D.-S.Bae, K.-S. Han, Journal of Materials Science
Letters, 18(1999) 1367-1369. [3] Y.S.Lin, A.J.Burggraaf, J.Amer.Ceram.Soc., 74(1991) 29. [4] K.K. Chan, A.M. Brownstein, Amer.Ceram.Soc. Bull.70(1991) 703. [5] R.Ramachandran, R.K.Menon, Int.J.Hydrogen Energy 23(1998) 593. [6] T.N.Veziroglu, Chem.Ind.53(1999) 383. [7] A.J.Burggraaf, L.Cot, Fundamentals of Inorganic Membrane Science
and Technology, Elsevier, Amsterdam, 1996. [8] B.E.Yoldas, J.Non-Cryst.Solids 63, 145(1984). [9] C.J.Brinker, K.D.Keefer, D.W.Schaefer, C.S.Ashley, J.Non-Cryst.Solids
48, 47(1982). [10] J.Zarzycki, M.Prassas, J.Phalippou, J.Mater.Sci. 17, 3371(1982). [11] R.Aelion, A.Loebel, F. Eirich, Amer.Ceram.Soc. 72, 5705(1950). [12] H.Dislich, P. Hinz, J.Non-Cryst.Solids 48, 11(1982). [13] S.Giessler, L.Jordan, J.C.D.Da Costa, Separation and Purification
Technology, 32(2003) 255.
Copyright © 2012 SciRes. 239

�
Experimental Studies on the Influence of HCO3- on
Absorption and Desorption of CO2 from Ammonia Solution
Shaojian Jiang, Wei Zhong, Rui Peng, Yong Jiang, Jun Zhang School of Energy Science and Engineering
Central South University Changsha, China
Abstract—With aqueous ammonia in the process of CO2absorption and desorption to join sodium bicarbonate, the influence of HCO3
- on CO2 absorption and desorption from ammonia solution was investigated through the experimental analysis of the desorption quantity of CO2, desorption rate, CO2 loading and the absorption rate. The experimental results showed that, in experimental conditions, The desorption rate decreased gradually with increasing ammonia concentrations. The desorption rate increased 12%, 17%, 19% and 28.8% when 1 mol/L of ammonia solution is added in 0.1 mol/L, 0.3 mol/L, 0.5 mol/L and 1 mol/L of sodium bicarbonate. The higher concentration of ammonium bicarbonate solution which was added sodium bicarbonate the more observably the effect of CO2 desorption was promoted. The absorption rate had dropped when absorption process added 0.3 mol/L sodium bicarbonate, the CO2 loading was a little change.
Keywords-ammonia desorption; the desorption rate; CO2 absorption;CO2 loading
1. IntroductionAs the rapid development of modern industry, a large
number of the use of fossil fuels leads to increased CO2emissions, and CO2 is climate change and the main cause of global warming. Therefore, carbon capture and storage (CCS) projects have been reported[1]. The chemical absorption capture of CO2 has been studied and widely used as a reliable and cost-efficient method for CO2 because of its characteristics such as higher absorption rate, higher CO2recovery rate, no absorbent degradation and lower desorption energy requirement, etc[2]. The traditional chemical absorption methods include alcohol amine solution, alkali solution, aqueous alkanolamine solution, etc. Among them, MEA, as a representative of the alcohol amine is the most traditional absorbent[3], it is used in industry early in the 19 th century. However, because its higher desorption energy, amine degradation by O2, SO2 in flue gas which induces a high absorbent makeup rate and high equipment corrosion rate[4], on the actual plant there is still a limit used in decarburization. Compared with MEA, aqueous ammonia which has higher CO2 loading capacity (g CO2 absorbed per g absorbent), no corrosion problem, no absorbent degradation problem, lower desorption energy[5][6], and the ability to capture all three major acid gases(SO2, NOX, CO2), is becoming a hot research[7].
It has been concluded that the maximum CO2 removal efficiency by NH3 absorbent can achieve 95% and the major produced from the Aqua Ammonia Process including ammonium bicarbonate and ammonium carbonate etc[8]. Due to the process is reversible, therefore, a way to heat its bicarbonate salts to desorb the solution is used to make sorbent recycling. The process to CO2 desorption which is not desorbed completely has resulted in absorption capacity is reduced. Liu Fang[9] researched the process of CO2desorption from ammonium bicarbonate, Zeng Qing[10] studied the characteristics of CO2 desorption from Carbonated ammonia solution, which showed that desorption rate was influenced by temperature, CO2 loading. Houping Huang[11] investigated a method to regenerate ammonia so as to allow for the ammonia scrubbing technique to be practical in the capture of CO2 that a weakly basic ion-exchange resin containing amine functional groups is used. How to improve the desorption rate, and in the process of absorption recycling, keep the CO2 loading capacity the same are a key research direction.
Research has shown that[12], with the increasing of the concentration of bicarbonate ions, CO2 is easier to release from the solution. This paper studied the influence of HCO3
-
(put NaHCO3 into solution as a additives) on CO2 absorption and desorption from ammonia solution which keep the concentration of NH4
+ the same and change the solution of HCO3
-concentration.
2. Experiment A. Theory
The desorption reaction of CO2 into ammonia solution can be described as the following equations (1), (2), (3). it is shown the lowest enthalpy of dissociation for CO2 release from (1). Ammonium carbonate can be further dissociated to release more CO2, but at higher cost per mole CO2 desorbed. Therefore, in the process of the most favorable desorption is to transfer ammonium carbonate solution from the absorber and use it as CO2 absorbent, as shown in (7). Moreover, it can reduce the NH3 escape.
2NH4HCO3(aq) , (NH4)2CO3(aq)+CO2(g)+H2O(l) (1)
, NH3(aq)+CO2(g)+H2O(l) (2) NH4HCO3(aq)
(NH4)2CO3(aq) , 2NH3(aq)+CO2(g)+H2O(l) (3)
Advances in Materials Physics and Chemistry Supplement: 2012 world Congress on Engineering and Technology
24� Copyright © 2012 SciRes.

�
For absorption reaction,it is typical chemical reaction process as following equations (4), (5) ,(6), (7).
CO2+2NH3 NH2COONH4 (4)�NH2COONH4+H2O NH3+NH4HCO3 (5) ,
NH3+NH4HCO3 (NH4)2CO3 (6),
(NH4)2CO3+CO2+H2O, 2NH4HCO3 (7)
B. The experiment system The experiments were divided into desorption and
absorption process. The schematic diagrams for desorption process were represented in Fig. 1. It was experimented with ammonium bicarbonate solution preparation simulation of the practical absorbent, through the adjustment of ammonium bicarbonate solution concentration and adding additives way to control simulation absorbent. The desorption solution was controlled the temperature by water-bath pot. CO2 gas was purged the entire system before the start of the experiment.Then the solution was stirred by the magnetic stirrer.The gas was analysed by CO2 Analyzer through a mixture of gases from desorption after pickling bottle and desiccating agent. In the process of desorption, the temperature controlled in 60 ~99 . The desorption rate is tested at 99 .
�
Figure 1. Diagram of the apparatus to measure CO2 desorption from ammonium bicarbonate solution:(1) CO2 Gas,(2) Mass flow
controller,(3) Magnetic Stirrer(4) Pickling,(5) Desiccating Agent,(6) CO2 Analyzer
The experimental system for studying CO2 absorption is showed in the schematic diagram of Fig. 2. The simulated flue gas consisted of 14 vol.% CO2 and 86 vol.% Air. The temperature of the gases was 20 and the flow controlled by mess flow controlled which was 80 m3/h. The temperature of the absorber was controlled in 40 ~ 50 , and the flow was 1450 L/h(liquid/gas is about 18 L/m3). The pressure of the whole experiment process was close to 1 atmosphere. In the experimental process, flue gas was flowing through absorption tower continuously and absorber was recycling. After the absorption the gas was analysed by CO2 analyzer.
�Figure 2. Schematic diagram of experimental setup of CO2 and aqueous ammonia absorption:(1) CO2 Cylinder,(2) Mass Flow
Controller,(3) Air compressor,(4)Gas Compound,(5) CO2Absorber,(6)Reservoir,(7) Pump,(8) CO2 Analyzer
3. Result and Discussion A. CO2 desorption characteristics in Ammonium bicarbonate
solution Experiments of 100 mL ammonium bicarbonate solution
was heated which the concentrations were 1 mol/L, 1.5 mol/L and 2 mol/L. From 55 solution had been heated to a constant temperature when water-bath water was boiling. The desorption process was end when CO2 analyzer show flow velocity was zero. Desorption started quickly when the solution was decomposed and a large number of small bubbles were emerged. With the rise of temperature, the bubbles on the surface of liquid level were becoming bigger, and bubbles was rising quickly as well as they burst. Finally, the bubbles become less and less. It was shown that CO2 desorption from the method of ammonia absorber was obvious effective and with good reproducibility.
60 80 100
0
100
2001mol
1.5mol 2mol
60 80 100
0
1000
2000
1mol 1.5mol 2mol
CO
2 de
sorp
tion
spee
d(m
3 .h-1
CO
2 de
sorp
tion
amou
nt(m
L)
T ( )
)
�
Figure 3. Typical CO2 desorption curve of ammonium bicarbonate
Typical CO2 desorption curve of Ammonium bicarbonate solution changing with temperature rules was shown in Fig. 3. With the rise of temperature, CO2 desorption speeded rapidly,
Copyright © 2012 SciRes. 24�

�
when the temperature reached 85 , CO2 desorption speed was about to the biggest, and the amount of CO2 desorption increased quickly. It was closed to the best desorption temperature of 87.5 which Liu Fang [13] confirmed in the desorption of the ammonia method of absorbent. With the temperature rise further, the concentration of HCO3
- reduced gradually so that little CO2 desorbed out, desorption speed was reduced. As the increasing concentration of HCO3
-, the higher concentration of desorption solution could desorb more over CO2. The final desorption rates of 1 mol/L, 1.5 mol/L, 2 mol/L of ammonium bicarbonate solution were 57%, 54% and 48%, it was shown that the higher the concentration of solution was, CO2 desorption rate gradually reduced. Because the concentration of HCO3
- reduced and CO32- increased, leading
to inhibit the reaction (1).
B. The influence on the desorption of ammonium bicarbonate solution within Sodium bicarbonate The Fig. 3 showed the higher the concentration of
ammonium bicarbonate solution was, CO2 desorption rate gradually reduced. The following experiments were conducted. Sodium bicarbonate was added into the ammonium bicarbonate solution to change the concentration of HCO3
- and ensure NH4
+ concentration under the condition of invariable, to investigate HCO3
- to the effect of CO2 desorption. 100 mL, 1mol/L of ammonium bicarbonate was added 0.1 mol/L, 0.3 mol/L, 0.5 mol/L and 1mol/L of sodium bicarbonate to study its CO2 desorption characteristics. The desorption of 1mol/L ammonium bicarbonate solution as a function of sodium bicarbonate concentration was shown in Fig. 4.
0.0 0.5 1.01200
1300
1400
1500
1600
1700
CO2 desorption amount(mL)
CO2 desorption rate(%)
the concentration of sodium bicarbonate(mol/L)
CO
2 de
sorp
tion
amou
nt(m
L)
0.50
0.55
0.60
0.65
0.70
0.75
0.80
CO
2 de
sorp
tion
rate
(%)
�
Figure 4. The desorption of ammonium bicarbonate solution as a function of sodium bicarbonate concentration
The CO2 desorption quantity and rate were increased by adding sodium bicarbonate and intensified with higher concentration of sodium bicarbonate.The desorption rate was 58% for the solution of 1 mol/L ammonium bicarbonate solution.The CO2 desorption rate with ammonium bicarbonate solution adding 0, 0.1 mol/L, 0.3 mol/L, 0.5 mol/L and 1 mol/L of sodium bicarbonate solutions were 58%, 65% , 68%, 69%, 74% ,respectively,the efficiencies were increased 12%, 17%, 19% and 28.8%. The sodium bicarbonate solutions of 0.1~0.3 mol/L into 1mol/L ammonium bicarbonate solution afforded the greatest rate of increased desorption.Over 0.3
mol/L the rate was slow. According to the chemical reaction kinetics,it was supposed to make positive reaction for desorption to make the amount of CO2 desorption increased when the concentration of HCO3
- continued to increase. The higher concentration of sodium bicarbonate which was weakly alkaline salt was,the degree of hydrolysis was more and more small. Meanwhile, it's inhibit effect to the NH4HCO3ionization and makes the growth of desorption amount.
C. The influence of the desorption of different concentration of ammonium bicarbonate solution within Sodium bicarbonate
1.0 1.5 2.0 2.51000
1500
2000
2500
3000
3500
4000
the concentration of NH4HCO3(mol.L-1)
CO
2 de
sorp
tion
amou
nt(m
L)
1.0 1.5 2.0 2.50.40
0.45
0.50
0.55
0.60
0.65
0.70
0.75
NH4HCO3 NH4HCO3+0.3mol/L NaHCO3
CO
2 de
sorp
tion
amou
nt(%
)
�Figure 5. The desorption of different concentration of ammonium
bicarbonate solution as a function of sodium bicarbonate concentration
CO2 desorption characteristics for 1 mol/L, 1.5 mol/L, 2 mol/L, 2.5 mol/L of ammonium bicarbonate solution were investigated which was joined 0.3 mol/L of sodium bicarbonate. The desorption of different concentration of ammonium bicarbonate solution as a function of sodium bicarbonate concentration was shown in Fig. 5. The increasing desorption amount with increasing concentration expressed on approximate linear relationship. Nevertheless, the result that the higher the concentration of solution was, CO2 desorption rate gradually reduced had been confirmed in Fig. 3. the quantity of CO2 desorption and the concentration had an inverse proportion relation.When adding sodium bicarbonate, CO2 desorption rate increased and the higher concentration of ammonium bicarbonate solution the better effect of the CO2desorption rate bringing about by introducing HCO3
-, and the speed reduction of desorption rate slowed down. Compared with 1.5 mol/L,plus 0.3 mol/L sodium bicarbonate into 2 mol/L of ammonium bicarbonate solution had only declined 3.2%. Add 2 mol/L of sodium bicarbonate ammonium bicarbonate solution of the CO2 desorption rate than only 1.5 mol/L declined 3.2%. This shown that the higher concentration of absorbent plus sodium bicarbonate,the more observably the effect of CO2 desorption was promoted.
D. Sodium bicarbonate of CO2 absorption effect Using ammonia method to absorb CO2, the absorbent
circulated after desorption.When plus sodium bicarbonate,it had an influence on the absorption process.Carbon dioxide absorption rates for 5% ammonia solution and plus 0.3 mol/L
24 Copyright © 2012 SciRes.

�
sodium bicarbonate were measured in the experiment equipment(Fig. 2). For each amine concentration about CO2loadings were tested. The experimental results were represented in Fig. 6. Ammonia solution had an great effect on absorbing CO2, the CO2 absorption capacity reduced with increasing CO2 loading. When added sodium bicarbonate, the absorption rate decreased. There was so much free ammonia in low CO2 loading in the early stage that carbamate(NH2COO-) was the main species[14]. Meanwhile, the concentration of carbamate increased with increasing CO2loading. Moreover, Carbamate and carbonate ions would be gradually converted to bicarbonate ions as increasing absorbed amount of CO2 in ammonia solution(Eq. 5) after a certain time. The process was inhibited by adding sodium bicarbonate and leading to the drop of the CO2 absorption rate. While by changing the operation conditions, as well as the absorption tower structure could be improved the absorption rate.
0.0 0.1 0.2 0.3 0.4 0.5 0.60.1
0.2
0.3
0.4
0.5
0.6
0.7
0.8
0.9
1.0
CO
2 ab
sopt
ion
rate
(%)
CO2 loading (mol.mol-1)
NH3(Aq)5%NH3(Aq)5%+0.3mol/LNaHCO3
�
REFERENCES[1] STEENEVELDT R, BERGER B, TORP T A. CO2 CAPTURE AND
STORAGE Closing the Knowing–Doing Gap[J]. Chemical Engineering Research and Design, 2006, 84:739-763.
[2] Choi W J, Min B M, Shon B H, Seo J B, Oh K J. Characteristics of absorption/regeneration of CO2–SO2 binary systems into aqueous AMP + ammonia solutions[J]. Journal of Industrial and Engineering Chemistry, 2009, 15:635-640.
[3] Jassim M S, Rochelle G, Eimer D, Ramshaw C. Carbon Dioxide Absorption and Desorption in Aqueous Monoethanolamine Solutions in a Rotating Packed Bed[J]. American Chemical Society,2007, 46:2823-2833.
[4] Yeh A C, Bai H. Comparison of ammonia and monoethanolamine solvents to reduce CO2 greenhouse gas emmisions[J]. The Science of the Total Environment, 1999,228:121-133
[5] Puxty G, Rowland R, Attalla M. Comparison of the rate of CO2absorption into aqueous ammonia and monoethanolamine[J]. Chemical Engineering Science, 2010, 65:915-922.
[6] DIAO Yong-fa, ZHENG Xian-yu, HE Bo-shu, Chen Chang-he, Xu Xu-chang. Experimental study on capturing CO2 greenhouse gas by ammonia scrubbing[J]. Energy Conversion and Management, 2004,45:2283-2296.
[7] Resink K P, Yeh J T, Pennline H W. Aqua ammonia process for simultaneous removal of CO2 ,SO2 and NOx[J]. Int. J. Environ Technol Manag, 2004,4(1/2):89-104
[8] Mani F, Peruzzini M, Stoppioni P. CO2 absorption by aqueous NH3solutions: speciation of ammoniumcarbamate, bicarbonate and carbonate by a 13C NMR study[J]. Green Chemistry, 2006, 8:995-1000.
[9] Liu Fang, WANG Shu-juan, ZHANG Xi, Sun Xin-yu, Chen Chang-he, Xu Xu-chang. Study on ammonium bicarbonate decomposition after CO2 sequestration by ammonia method [J]. Acta Scientiae Circumstantiae ,2009,29(9):1886–1890.(in Chinese)
[10] Zeng Qing, Guo Yin-cheng, Niu Zhen-qi, Lin Wen-xi. Experimental Studies on Carbon Dioxide Desorption from Carbonated Ammonia Solution in a Packed Column. //Third International Conference on Measuring Technology and Mechatronics Automation, 2011.
[11] Huang H, Chang S G. Method to Regenerate Ammonia for the Capture of Carbon Dioxide[J]. Energy Fuels, 2002, 16:904-910. Figure 6. CO2 removal efficiency lines in aqueous ammonia and
aqueous ammonia within sodium bicarbonate
Along with the absorption process, the absorption rate reduced gradually with increasing CO2 loading, and the CO2loading capacity reduced when added sodium bicarbonate, but the speed reduction of CO2 loading slowed down.Respectively, the concentration of free ammonia decreased rapidly,while the speed reduction of that slowed down. The concentration of NH4
+ remained the same in whole solution, for the same absorption effect, CO2 loading changed a little.
[12] Liu Fang, WANG Shu-juan, Chen Chang-he, Xu Xu-chang. Research progress of CO2 capture by using ammonia from flue gas of power plant[J]. CIESC Journal, 2009, 60:269-278. (in Chinese)
[13] Yeh J T, Resnik K P, Rygle K, Pennline H W. Semi-batch absorption and regeneration studies for CO2 capture by aqueous ammonia[J]. Fuel Processing Technology, 2005, 86:1533–1546.
[14] Bai H, Yeh A C. Removal of CO2 Greenhouse Gas by Ammonia Scrubbing[J]. American Chemical Society,1997, 36:2490-2493.
[15] Liu Fang. Experimental Study on CO2 Capture from Flue Gas of Coal-Fired Power Plant by Regenerated Aqua Ammonia[D]. Power Engineering and Engineering Thermophysics. Tsinghua University, 2009, 102-103. (in Chinese)
4. Conclusion [16] Ahn C K , Lee H W, Lee M W,Chang Y S, Han K, Rhee C H, Kim J Y, Chun H D, Park J M. Determination of Ammonium Salt/Ion Speciation in the CO2 Absorption Process Using Ammonia Solution: Modeling and Experimental Approaches[J]. Energy Procedia, 2011, 4:541-547.
1) Using ammonia method had an good effect on CO2absorption and desorption. High concentration of absorbent could also have lower rates of desorption.
2) Sodium bicarbonate as additives, could greatly improve the CO2 desorption rate, with the increasing of the concentration of HCO3
-, the speed reduction of CO2desorption rate slowed down.
3) For different concentration of absorbent, the higher concentration of absorbent plus sodium bicarbonate,the more observably the effect of CO2 desorption was promoted.
4) The absorption process joined sodium bicarbonate, the absorption rate had reduced, CO2 loading changed a little.
Copyright © 2012 SciRes. 24�

Developing A Mathematical Model for Hydrate Formation in A Spray Batch Reactor
Mohammad Kazemeini Department of Chemical and Petroleum Engineering, Sharif
University of Technology, P.O. Box 11365-9465, Tehran, Iran
E-mail: [email protected]
Farideh Freidoonian Islamic Azad University, South Tehran Branch,
Tehran, Iran E-mail: [email protected]
Moslem Fattahi
Department of Chemical and Petroleum Engineering, Sharif University of Technology, P.O. Box 11365-9465,
Tehran, Iran E-mail: [email protected]
Abstract-The formation of methane hydrate was undertaken in this research. The purpose of this work was to model the methane hydrate formation with a hydrate-water–methane system in a semi-batch reactor under steady–state, isothermal and isobaric conditions. Obtained results were validated with experiments conducted in a semi-batch spray reactor at low temperatures and high pressures. The investigated formation of gas hydrate from pure methane required physical constants of these materials which were determined through experimental data. The experiments hence, the theoretical calculations were conducted with pure methane and carried out in a spray reactor at 273.95K and 8705kPa to determine the actual amount of hydrate formation in such reactor. Ultimately; the comparison of the results generated from the developed mathematical model with those of experimental data of others indicated a very satisfactory agreement obtained.
Keywords- hydrate formation;methane; spray reactor; semi-batch; modeling
1. Introduction Hydrate are crystalline water-based solids physically resembling ice, in which low molecular weight (light) gas molecules are trapped by water molecules bounded by hydrogen and stabilized due to Van-der-waals forces. In hydrate formation host molecule is water and guest molecule is a gas or liquid [1]. Thermodynamic conditions of hydrate formation are often found in pipelines. It is unfavorable because these crystals might plug the flow line and damage valves and instrumentation. Hydrate formation within pipelines slows down the flow of materials due to blockage causing significant economic losses. Hydrate might be used for gas storage and transportation as well. Utilizing hydrate as a storage mean for transportation depends upon the maximum gas storable through hydrate and the hydrate formation rate. Research in this area started at beginning of the 1990s. Gudmundsson and his group at Norwegian University reported results of
experimental investigations on production, storage and transportation of gas hydrates [2, 3]. The hydrates are to crystallize in 3 structures, I, II and H, depending upon the nature and the size of guest molecules [4, 5]. A unit cell of structure I contained eight cavities (two smalls and six large ones) and formed by 46 hydrogen-bonded water molecules. While a unit cell of structure II contained 136 water molecules and enclosed 24 cavities including 16 smalls and 8 large ones. The gas molecules of methane, ethane, propane, isobutene, CO2, H2S, and N2 were known to stabilize the micro cavities formed by either of the two hydrate structures. The formation of either of structures I or II is related to the ratio of the guest molecule to the cavity size while the thermodynamic operating conditions including temperature, pressure and gas composition are also very important affecting formation of these structures. The kinetic models of hydrate formation studied previously have been developed based upon stirred tank batch systems [6]. Such reactors included water at hydrate formation conditions being injected along with the gas for production of the hydrates. Natural gas hydrate formation condition was usually determined experimentally in the laboratory however; such data were not always available. Hence, correlations utilized in order to determine values for the natural gas hydrate formation conditions. Hydrate formation kinetics usually improved through addition of a promoter. One of the most popular promoters was paratoluenesulfonic acid (pTSA) which was undertaken in the present research. The work reported here therefore; described a theoretical analysis for the methane hydrate formation in presence of the pTSA, the results for which were compared with experimental data available in the open literature to verify the model.
Advances in Materials Physics and Chemistry Supplement: 2012 world Congress on Engineering and Technology
244 Copyright . 2012 SciRes.

2. Theoretical Background The mathematical model of the hydrate formation in this work included two main steps of: (1) nucleation and growth modeling of hydrate and (2) modeling of a semi-batch spray reactor process. The presence of non-polar molecules such as hydrocarbons in water distorted water molecules to organize themselves into clusters forming the needed nuclei. The nucleation time named induction period. Furthermore, due to the highest concentration of gas at the water-gas interface, the hydrate formation took place at this location. The process to be modeled was then a semi-batch heterogeneous spray reactor for methane hydrate production into a pressurized vessel. This process involved a spraying period during which the reactor operated in a semi-batch mode and a stabilization period during which the reactor operated in a batch mode.
A. Materials The main component of methane hydrate was water which occupied around 80% by mass and the remainder devoted to methane. The simulated promoter mixed with water was the pTSA with predetermined concentration of 1.25g/l. Pure methane was also utilized to form hydrates.
B. Apparatus Figure 1 showed a schematic drawing of the experimental apparatus leading to the present investigation. A known amount of water was fed into the reactor, which was purged continuously with the pure methane. The reactor operated in a semi-batch mode. A fixed stabilization period of 5min was maintained after spraying, where the reactor behaved as a batch system to form the product [7].
Figure-1: Schematic diagram of the spray reactor leading to
hydrate formation
3. Computational Procedures In this simulation the MATLAB software of version 2011
to calculate the correlations of hydrate formation was utilized. As mentioned above, initial phase of hydrate formation was semi-batch water injection or spraying process, and the second phase was a batch process requiring stabilization period. The injection time, ti, for spraying period was determined to be 798s and the induction time, ts, for stabilization period was found to be 370s. Water molecules with initial velocity were accounted for to travel the horizontal distance thru the reactor. During this traversal, the methane was injected inside the reactor to form the hydrate. The reaction between water molecules and methane was a physical interaction. The hydrate formation reaction equation might have been written as:
GAS + (1/B) WATER = HYDRATE
In which B was the equilibrium gas to water molar ratio. The constant for calculating the equations were based upon the experimental data. As mentioned, in this model operating condition were taken to be isothermal, hence only mass transfer during hydrate formation existed and respective calculations were performed accordingly. The model parameters were of geometrical dimensions and physical constants used in developing the model [7]. In the present work, through solving equations involving hydrate formation, the theoretical data were calculated then compared with experimental ones.
C. Governing equations The distance travelled x(t) by water in reactor was
calculated from following correlation [7]:
������ = 4.41 − 0.093(
����
)� (1)
The boundry conditions were: t=0, at x=0 and v=v0
The constant of this correlation was calculated by MATLAB software with model parameters related to hydrate formation kinetics. By water molecules travelling the horizontal distance thru the reactor (x), the initial velocity decreased. Hence, the acceleration subsequently lowered as well with the following equation:
�� =ℎ���
(2)
In which ht was the distance travelled by the spray flow. The diffusion coefficient of gas in water for hydrate formation was calculated through the following equation:
�� =7.4 × 10��(ʈ���)�.� × �
�����.� (3)
where μw is the associate factor of solvent (i.e.; water) and V is the molar volume. Mass transfer coefficient of methane in water during spraying was provided by:
Copyright . 2012 SciRes. 245

�� =0.16��
�����.����.����
��� (4)
Supersaturation, Δμ, was the driving force for hydrate formation where it was the difference between the chemical potentials of the old and new phases. For hydrate nucleation this parameter should be Δμ=0 and for a single gas component system such as methane it was calculated as follows:
�� = �� �� �(��,�)���(��,�)��
+���(�� − ��) (5)
When water mixed with the hydrate, a promoting chemical was sprayed into the reactor and maintained at subzero temperatures at which hydrate as well as; ice nucleations occurred together. The nucleation rate was determined as follows:
� = � exp �����
� ���(������
�ϭ���
������� ) (6) where A is the kinetic parameter for nucleation. Vh is velocity of hydrate and ϭ�� is the effective surface energy. The concentration of water, Cw(t), at any given time during water injection could be determined from the following:
� ���(�)��
+ (1 + ���(�)�)��(�) = ��� (7)
In which, Ke is the varying rate constant used to determine Cw. The moles of water crystallized, during semi-batch and batch process might be calculated as: For semi-batch period at t≤ ti:
��� (�) = (���
� ��(�))�� (8) For batch period at t=ti:
��� (�) = ��
� (��)�1 + (���(� − ��)�(� − ��)] (9)
According to the above equations one might observe the growth of water crystallized with time. Now, the moles of water crystallized and remained as well as; that of the gas farmed into hydrate in vessel might be determined. The relationship for moles of gas in hydrates at any time is given by:
���(�) = ��
� (�)� (10) Water remaining in the system would be in the form of ice the formation of which was inevitable in the spray reactor operation due to the low temperature, where could be written as:
��� (�) = ��
� (�) − ��� (�) (11)
where, ��� (�), is the initial moles of water in the system. So
the moles of gas remaining in the vessel are given as: ��
�(�) = ���(�) − ��
�(�) (12) where, ��
�(�), is the total moles of methane in the system at t=t0. The gas to total water volume ratio, HFVF, or hydrate volume factor assuming the ideal gas law could be calculated as:
����(�) =��
�(�)(�������
�)
��� (13)
Details of all correlation and equation for hydrate formation kinetics were presented in Ref. [7].
II. Results and discussion According to the Equation (1), the distance travelled by water in vessel, X, was shown in Figure 2.
Figure 2: Variation of material’s travelled distance with time
According to correlation (2), the hydrate acceleration, a, in reactor with time decreased. The variations of acceleration with time were showed in Figure 3.
Figure 3: Material’s acceleration variation with time
The initial water in the system, Mw,i, at any given time was presented in Figure 4.
0
100
200
300
400
500
600
0 5 10 15 20 25
Xt (min)
00.20.40.60.8
11.21.41.6
0 5 10 15 20 25
a
t (min)
246 Copyright . 2012 SciRes.

Figure 4: The initial mole of water injected variation with time
The water crystallized into hydrate form, Mthrough the correlation (9) and shown in Figremained in vessel was ice.
Figure 5: The mole of water crystallized variation with time
The mole fraction of methane in hydrate was aboutequation (10), mole of methane in hydrate, Min Figure 6:
Figure 6: Variation of the mole of methanehydrate with time
The amount of gas in hydrate was indeed less than water hence,the variation of remaining gas with time, MThis was calculated through the equation (11) and Figure 7.
0102030405060
0 500 1000
Mw
i
ti+ts
__Modeling• Experimental data [
-100
102030405060
0 500 1000
Mw
c
ti+ts
__Modeling•Experimmental data [7]
00.5
11.5
22.5
33.5
44.5
55.5
6
0 200 400 600 800
Mgh
ti+ts
____Modeling•Exprimental data [
er injected variation with time
Mc,w, was calculated igure 5. The water
rystallized variation with time
was about 0.2. The , Mgh, was displayed
he mole of methane formed in the
was indeed less than water hence, , Mgr, was also low.
equation (11) and shown in
Figure 7: Variation of the mole of with time
Hydrate formation volume factor, HFVF, or the gas total water volume ratio was determined from correlation (13) and shown in Fig. 8.
Figure 8: The HFVF
The error percentage in terms experimental and theoretical from the developed model wasconsider the accuracy of the hydrate formation model put together in this research.
Table 1: The AAD and AE of effecting parameters
Quantity Percentage of Error
Absolute Error (%)
Mwi 6.45
Mwc 10.42
Mgr 0.90
Mgh 10.27
HFVF 6.42
It is seen through the above changes in the governing equations of hydrate formation leading to variations in spraying might see fractures in the behaviorthe AAD (Average Absolute Deviation) Error) values between theoretical and experimental several key affecting parameters displayed in Table 1 revealed
1000 1500
• Experimental data [7]
1500
1000 1200
•Exprimental data [7]
100
102
104
106
108
110
0 500
Mgr
0
50
100
150
200
0 200 400
HFV
F
____Modeling•Experimental data [
he mole of remaining gas in the vessel
with time
Hydrate formation volume factor, HFVF, or the gas total water determined from correlation (13) and shown
HFVF variation with time
in terms of absolute error between (or calculated) data generated
was reported in Table 1 in order to consider the accuracy of the hydrate formation model put
AE of effecting parameters
Percentage of Error
(%) AAD (Experimental)
AAD (Modeling)
5.70 5.37
12.56 13.37
0.19 0.20
12.91 11.59
16.40 12.62
above figures that at t=798, due to in the governing equations of hydrate formation
in spraying and stabilization periods, one behaviors displayed. Nonetheless;
(Average Absolute Deviation) and AE (Absolute between theoretical and experimental extents of
several key affecting parameters displayed in Table 1 revealed
1000 1500ti+ts
_______Modeling•Eperimental data [7]
600 800 1000 1200ti+ts
____Modeling•Experimental data [7]
Copyright . 2012 SciRes. 247

that the accuracy of the developed model might be considered rather satisfactory.
4. Conclusions The following behavioral patterns were demonstrated by this investigation:
• When hydrate molecules traveled thru horizontal distance of the reactor, their average flight velocity increased while their acceleration decreased.
• The increase in the water injected showed an enhancement in the hydrate formation because as mentioned, the highest volume of hydrate was related to the water species.
• Increase in the stabilization period enhanced hydrate
amount formation.
• During induction time period, hydrate formation occurred and an exponential hydrate crystal growth followed.
• The initial amount of water in the reactor increased with time since the most important component of the hydrate was indeed the water. In other words, not only the mole fraction of this species in the hydrate was 80% but also, it was injected into the reactor with passage of time.
• As time went by, the moles of methane in system decreased rather slowly due to the low initial consumption (i.e.; about 5% of the total initial moles) of this species
All of these issues were indicative of how the chemistry and physics of the hydrate material affected its displayed behavior. This model paved down the road toward further optimization of hydrate formation process and its applications which are currently undertaken in this laboratory.
REFERENCES [1] D. Kashchive, and A. Firoozabadi, “Driving force for crystallization of
gas hydrates,” Journal of Crystal Grwoth, vol. 241, pp. 220-230, 2002. [2] J.S. Gudmundsson, V. Andersson and O.I. Levik, “Gas storage and
transportation using hydrates,” Offshore Mediterranean Conference, Ravenna, March 19-21, 1997.
[3] J.S. Gudmundsson, and A. Børrehaug, “Frozen hydrate for transport of natural gas,” 2nd International Conference on Natural Gas Hydrate, June 2-6, Toulouse, France, 1996.
[4] E.D. Solan, and C.A. Koh, “Clathrate hydrate of natural gases,” 2nd Edition, New York; Taylor & Francis, 2007.
[5] M. A. Clarke, and P.R. Bishno, “Measuring and modelling the rate of decomposition of gas hydrates formed from mixtures of methane and ethane,” Chemical Engineering Science, vol. 56, pp. 4715-4724, 2001.
[6] P. Englezos, N. Kalogerakis, P.D. Dholabhai, and P.R. Bishnoi, “Kinetics of formation of methane and ethane gas hydrates,” Chemical Engineering Science, vol. 42, pp. 2647-2658, 1987.
[7] N. Gnanendran, and R. Amin, “Modelling hydrate formation kinetics of a hydrate promoter–water–natural gas system in a semi-batch” Chemical Engineering Science, vol. 59, pp. 3849-3863, 2004.
248 Copyright . 2012 SciRes.

Catalytic Feedstock Recycling of polymersA green approach towards sustainable environment
Raju FrancisDepartment of chemistry
MahatamaGandhi UniversityKottayam, Kerala, [email protected]
Beena SethiDepartment of chemistry
K.L. Mehta Dayanand College for WomenFaridabad, Haryana, India
Abstract— This piece of study involves degradation of plastic waste in presence of two different catalysts. It was found in gaschromatography (GC) analysis results that in presence of these catalysts more than 80% of polymer by weight was converted into either liquidor gaseous hydrocarbons. These can be utilized as fuel or can be transformed into other useful products. Thermo gravimetric analysis (TGA) anddifferential scanning calorimetric (DSC) analysis of polymers suggest that presence of these catalysts lowers degradation temperature andchange mechanism of degradation.
Keywords- polymer degradation;catalyst; green chemistryr;feedstock recycling;GC; TGA; DSC.
1. IntroductionPolyolefins (polyethylene, polypropylene, polystyrene) are
plastic materials used extensively in containers and packing.Polyethylene (PE) is the worldwide most produced polymerwith about 60 million tons per year and the main component ofplastic waste [1-3]. Other than PE polypropylene (PP),polyvinyl chloride (PVC) and polystyrene are the maincomponents of solid waste [4-6]. They present approximate60% of the total solid plastic waste generated in urban solidwaste[1].
The current strategies to deal with solid plastic waste(around 62% of total available solid waste is collectable) arestill based on land filling and incineration without energyrecovery [7]. Because of this huge plastic solid waste manymunicipal cities are facing disposal problems such as emissionof toxic substances (dioxins and furanes) on incineration andshortage of landfill sites [8].
Plastic material has almost same composition to petroleumand they are high yielding energy sources. For example oneliter of heating oil has a net calorific value of 10,200 Kcal,whereas 1 Kg of plastic releases 11,000,Kcal worth of energy.1Kg briquettes (blocks of pressed coal dust) have a net calorificvalue of 4,800 Kcal only. So it can be recycled into petroleumproducts safely with suitable technique without producing anyharmful gases [9-12]. At one side it will provide sustainablealternative of energy recovery and material recovery and otherside society will get rid from the disposal problem of plasticwaste.
Polyethylene (PE) and polypropylene (PP) as typicalcommodity plastics are better known as randomly degradingpolymers rather than depolymerizing polymers [13]. This is notsurprising because the heat of polymerization, an importantparameter for estimating the depolymerizability of polymers,
has larger negative values for ethylene and propylene, than forstyrene (St) and methyl methacrylate, indicating the difficultyin depolymerising PE and PP [14]. However, cases in whichthe zip length is controlled by chain-transfer reactions and inwhich the activation energy value for a depolymerisationreaction, such as β-scission, is higher than that of the chain-transfer reactions, the monomer yield can be increased withincrease in temperature.
Many methods have been investigated by differentresearchers for feed stock recycling. These are broadly dividedinto two categories as mechanical recycling and chemicalrecycling methods. A promising method for the reprocessing ofwaste plastic is feedstock recycling, or clean incineration ofmunicipal solid waste which allows the conversion of plasticresidues into raw chemicals, monomers of plastics andhydrocarbon feedstock It is a sustainable way for the recoveryof the organic content from polymeric waste and also topreserve petroleum resources in addition to protectingenvironment [13-15].
In spite of many R&D projects over the three decades, it isreported that recycling of waste plastic in oil productionprocess covers negligible amount in the total amount of wasteplastic generated all over the world. Moreover these methodsare economically not good due to technical problems such aslow treatment ability of techniques and high energyconsumptions and low quality of products obtained. Theproduced oils have limited uses and applications only inindustrial boilers, burners and power generators. And the fuelgas generated by plastic recycling is two or three times moreexpensive than fuel oil [16].
So, it is correct time to develop more economic, safe, eco-friendly and sustainable method for feedstock recycling ofwaste polymer.
Advances in Materials Physics and Chemistry Supplement: 2012 world Congress on Engineering and Technology
Copyright © 2012 SciRes. 249

In this study, attempts are taken to obtain useful productsand virgin monomer by degradation of polymers in presence ofdifferent catalysts without generation of any furtherhazardous/poisonous chemicals at low temperature.
2. Materials and methodA. Linear low density polyethylene (LLDPE)
It was purchased B.R. Scientific and Chemicals Company,Faridabad, Haryana. It was washed and dried in open air forone day. After that it was used for practical purposes. It wassoaked in solvent for three days then warmed to get it liquidstate.
B. Toluene, transition metal oxideand nonmetal oxideThese entire chemicals are also purchased from B. R.
Scientific and Chemicals Company, Faridabad, Haryana. Theseall were used without further purification.
C. Preparation of films of polymers samples
Films of polymer samples are prepared by dissolvingpolymer into solvent in presence of weighed amount of desiredcatalyst and dried in oven at 330 K.
D. TGA and DSC analysisTGA and DSC analysis of pure polymer and in presence of
catalyst was carried out at North Maharashtra University,Jalgaon, Maharashtra. All these analyses were carried out onShimadzu DSC- 60 & Shimadzu TGA- 60 WS.
E. GC analysis
The GC studies were carried out in a special GC-MSinstrument equipped with gas sample injector. This facility waskindly provided by Mahatma Gandhi University, Kottayam.
3. Result and discussionWe were interested to obtain useful products and virgin
monomer by degradation of polymers in presence of differentcatalysts at low temperature. We observed certain catalystsdecrease the degradation temperature of polymers. Further inpresence of these catalysts polymer degrades in more than onestep while in absence of these catalysts they showdecomposition in one step at little higher temperature thusdecrease the reaction temperature. The quality of degradationproducts is improved as well as percentage of dioxins andaromatic compounds are decreased. These harmful productsand aromatics are generally produced at high temperature(above 6000C).
Preliminary TGA data presented in Figures 1&2 shows thatthere is considerable increase in the thermal decomposition ofpolymer sample when cracked in presence of catalyst A incomparison to catalyst B. From the graph it can be seen that inthe former case the weight loss is 36% whereas in the lattercase it is only 20%. The amount of catalyst required for thischange is only 10% of the total polymer mass.. However theonset of decomposition temperature remains the same in bothcases. Nevertheless the interesting point is the substantial dropin the decomposition temperature to ~ 220oC, in the presenceof catalyst (Figures 1&2). We also observed the possibility of
decreasing the catalyst amount and its reusability for thiscracking experiment.
The DSC results showed a marked effect on the ability ofcatalyst to effect the endothermic decomposition process. Thisis can be clearly distinguished from the sluggish and sharpchanges in DSC profiles at the decomposition temperature inabsence and presence of catalyst (Figures 3, 4 & 5).
Figure 1. TGA of polymer in presence of catalyst A
To get these tests polymer (LLDPE) was mixed withcatalyst physically in presence of solvent then a film wasprepared for analysis.
TGA and DSC were carried out each time prior to GCanalysis. This gave information of number of steps involved ineach reaction and gave information of optimum and startingtemperature for each step of reaction.
Figure 2. TGA of polymer in presence of catalyst B
To test obtained degradation products GC analysis ofeffluent gases was carried out in absence and presence ofcatalysts. Results obtained are given in Table 1. The GCstudies were carried out in a special GC-MS instrumentequipped with gas sample injector.
250 Copyright © 2012 SciRes.

GC results of degraded products show that in presence ofcatalyst A, B and in presence of both, percentage of C3- C4hydrocarbons is very high while percentage of higherhydrocarbons (above C10) is almost negligible.
It is found that on degradation of pure polymer results only32% C3-C4 hydrocarbons while, in presence of catalyst A andB percentage of C3-C4 hydrocarbon was 72 and 82respectively. GC analysis of polymer in presence of bothcatalysts together also gave high percentage of C3- C4hydrocarbons and low percentage of higher hydrocarbons.
Table 1. G C analysis of fragments obtained during catalyticcracking of LLDPE
Carbonfragment
Sample
Polymer + catA
Polymer + catB
Polymer + catA+B
PurePolymer
C3/C4
(wt%)72.3 82.5 72.9 32.4
C5/C6
(wt%)
0 1.5 7.2 12.0
C7
(wt%)
5.5 14.5 1.7 1.2
C8
(wt%)
9.2 0 14 37
C9
(wt%)
0 0 0 16.4
C10
(wt%)
3.0 1.5 4.2 1.0
>C10
(wt%)
10 0 2 0
0.00 10.00 20.00Time [min]
0.00
5.00
10.00
mWDSC
100.00
200.00
300.00
CTemp
110.88COnset
122.26CEndset
116.82CPeak
-153.31mJ
-48.98J/g
Heat
-3.04mWHeight
5.00mW
File Name: S1.tadDetector: DSC60Acquisition Date12/01/26Acquisition Time11:03:19Sample Name: S1Sample Weight: 3.130[mg]Annotation:
[Temp ProgramStart Temp100.0Temp Rate Hold Temp Hold Time[C/min ] [ C ] [ min ]10.00 300.0 0
Thermal Analysis Resu
S1.tadS1.tad
TempDSC
Figure 3. DSC of polymer in absence Catalyst
To get good quality of products by varying dose of catalysts,admixtures, temperature and rate of heating is still required.Attempts will be made to use nano particles of catalyst tocheck catalytic activity of catalyst in future.
Activity of catalyst and possibility of recyclization ofcatalysts will also be tested by some methods. Attempts will bemade to get maximum fraction of monomer and gaseousfraction.
All the above studies encouraged us and created lot ofinterest to pursue further the degradation of polymer inpresence of catalysts.
0.00 10.00 20.00Time [min]
0.00
10.00
mWDSC
100.00
200.00
300.00
CTemp
109.11COnset
122.59CEndse
116.38CPeak
-272.10mJ
-64.02J/g
Heat
-4.14mWHeigh
10.00mW
File Name: S2.tadDetector: DSC60Acquisition Date12/01/26Acquisition Time11:35:47Sample Name: S2Sample Weight:4.250[mgAnnotation:
[Temp ProgramStart Temp100.0Temp RateHold TempHold Time[C/min ] [ C ] [ min 10.00 300.0 0
Thermal Analysis Res
S2.tadS2.tad
TempDSC
Figure 4. DSC of polymer in presence Catalyst A
Copyright © 2012 SciRes. 251

0.00 10.00 20.00Time [min]
0.00
10.00
20.00
mWDSC
100.00
200.00
300.00
CTemp
113.33 COnset
123.13 CEndset
116.84 CPeak
-200.51 mJ
-59.85J/g
Heat
-2.30mWHeight
10.00mW
File Name: S3.tadDetector: DSC60Acquisition Date 12/01/26Acquisition Time 12:07:32Sample Name: S3Sample Weight: 3.350[mg]Annotation:
[Temp Program]Start Temp 100.0Temp Rate Hold Temp Hold Time[C/min ] [ C ] [ min ]10.00 300.0 0
Thermal Analysis Result
S3.tadS3.tad
TempDSC
Figure 5. DSC of polymer in presence Catalyst B
4. ConclusionFrom the experimental findings of the present work, the
following conclusion can be drawn:
1. Pure polymer degrades at much higher temperatureand it involves single step in association ofproduction of green house and toxic gases like dioxin.
2. In presence of catalyst A and B, degradationtemperature lowers and degradation reaction involvesmore than one steps.
3. Degradation of pure polymer produces only 32%C3/C4 hydrocarbons and 12% C5/C6 hydrocarbons.
4. In presence of catalyst A and B degradation ofpolymer produces 72% and 82% C3/C4hydrocarbons respectively.
5. Adjusting dose of catalyst, use of nano particles andrecycling of catalyst can make this catalytic feedstockrecycling method a good tool to get sustainableenvironment.
6. This can help to get sustainable source of petroleumproducts.
5. AcknowledgmentAuthor sincerely thank to Dr. R.D. Kulkarni, Professor in
Chemistry, Department of polymer science, N.M. University,Jalgaon, Maharashtra, giving facility of TGA and DSCanalyzers to carry out this study successfully
REFERENCES[1] K. C Kirkwood, S. A Leng, and David, “Stem cracking of
unconventional hydrocarbon feedstocks for production ofpetrochemicals”. Proceedings of 45th International PetroleumConference June 13, 2011, Bratislava, Slovak Republic.
[2] J. Walenzievski, “Continuous flow cracking of waste plastics”.Fuel Process. Technol. vol. 86, pp. 1265- 1272, 2005.
[3] W. Kaminsky, and F. Hartman, “Simulation and experiments ofpolyethene pyrolysis in a Fuildized Bed Process”. Proceedingsof III International Symphosium of Feedstock Recycling of
Plastics and other Innovative Recycling Techniques. Karlsruhe,Germany, Sept 25-29, (2000). pp 201.
[4] M. Predel, and W. Kaminsky, “Feedstock recycling of polymersby pyrolysis in a fluidised bed”. Polymer. Degradation Stabil.vol.70, pp. 373-378, (2000).
[5] P. T. Williams, and E. A. Williams, “Pyrolysis of post consumedwaste plastics for the recovery of btx-aromatics using a fluidizedbed reactor”. J. Anal. Appl. Pyrolysis, vol. 51, pp. 107-112, 1999.
[6] W. Kaminsky, and H. Sinn, “Recycling and Recovery ofPlastics, Hanser, New York” . Proceedings of III InternationalSymphosium of Feedstock Recycling of Plastics and otherInnovative Recycling Techniques. Karlsruhe, Germany, Sept 25-29, pp 435-442. 2005.
[7] J. Aguado, and D. P. Serrano,“European trends in the feedstockrecycling of plastic”. Global NEST Journal, vol. 9(1), pp 12-19,2007
[8] P. Connet, “Muncipal waste incineration: A poor solution fortwenty first century”. Journal of the Air & Waste ManagementAssociation, vol. 56, pp. 709-742, 2006.
[9] J. Aguado, and D. P. Serrano, “Feedstock Recycling of PlasticWastes”. Cambridge: Royal Society of Chemistry. 1999.
[10] D. P. Serrano, J. Aguado, G. Vicente, N. Sanchez, and L.Estebon, “Enhanced Production of ά-Olefins by thermaldegradation of HDPE in De Calin Solvent”. 2000.
[11] S. Suga, Y. Wakayama, and T. Funazukuri, “Hydrothermaldechlorination of Poly (vinylchloride) in the absence and thepresence of hydrogen peroxide”. Polym, Degrad, Stab. vol. 67,pp. 285 -298, 2000.
[12] R. Maraghi, Disposal, recycling and reuse. In Mosta Fa N.;Dekker, M. Editors, Plastic Waste Management. New York,USA; pp 223-226. 1993.
[13] I. Mita, Effect of structure on degradation and stability ofpolymers. In Aspect of Degradation and Stabilization ofPolymers (ed. Jellinek, H. H. G.) 1978, Ch. 6, 247–294 (Elsevier,Amsterdam).
[14] J. Leonard, Heats and entropies of polymerization, ceilingtemperatures, equilibrium monomer concentrations, andpolymerizability of heterocyclic compounds. In PolymerHandbook Fourth Edition (eds, Brandrup, J., Immergut, E. H.,& Grulke, E. A.) Ch. II, 363–414 (Wiley Interscience, NewYork, 1999).
[15] S. Kumar, A. K. Panda, and R. K. Singh. “A review on tertiaryrecycling of high- density Poly ethylene to fuel”. Conservationand Recycling, vol. 55, pp. 893-910, 2011.
[16] Uemichi, Y. Makino, and T. Kanazuka, “Degradation ofpolypropylene to aromatic hydrocarbons over Pt- and Fe-containing activated carbon catalysts”. J. Anal. Appl. Pyrol.vol.16, pp. 229-232, 1989.
252 Copyright © 2012 SciRes.
Obtaining the thin semiconductive covering Re-Se from sulphate electrolyte
E.A.Salakhova A.M.Aliyev Institute of Chemical Problems of the ANAS 29, H. Javid
ave., AZ1143, Baku,Azerbaijan e-mail: [email protected]
Institute of Chemical Problems of the ANAS 29, H. Javid ave., AZ1143, Baku,Azerbaijan e-mail: [email protected]
Abstract There have been investigated the kinetics and mechanism of the cathode electrodeposition of thin coverings Re-Se from the sulphate electrolyte, containing NH4ReO4, SeO2 and H2SO4. On the base of X-ray phase analysis and by the method of cyclic avometry there have been determined the content of obtained coverings, electrosettled at the various concentrations of components in electrolyte. The co-deposition process was shown to be attended by depolarization, which is due to the energy release upon the formation of the alloy. Keywords electrodeposition, alloys, rhenium, selen, semiconductive cover
1. Introduction
Rhenium and its alloys have a unique physico-chemical property, which provides their application in the most important fields of modern technology [1, 2]. The high temperature of melting and stable mechanical properties at the high temperatures provided its application in the heat-resistant alloys production. The alloys of rhenium with selenium in the form of thin photosensitive films are used in semi-conducting technology. The semi-conducting films of alloys of rhenium with selenium are usually obtained by the method of separate components meeting together [3, 4]. As the mentioned above method is rather difficult, it demands complicated instruments and the process is going at the high temperatures, we tried to apply electrochemical method based on the electrolysis of water solutions of selenium dioxide and ammonium perrenate in sulphuric acid for obtaining the thin coverings of Re-Se alloys.
In order to obtain Re-Se alloy from the sulphate electrolyte [5, 6] we studied the joint electrodeposition of rhenium with selenium and there was found the optimal regime for obtaining a semi-conducting alloy.
Analysis of results of indicated works showed that films depend not only on the composition and nature of electrolyte, but also on the material of cathode.
The use of different according to the origin electrolytes in order to obtain the thin coverings Re-Se, is certainly connected with the hardships which are usually met in every concrete occasion and it’s directed to the search of the electrolyte composition, which gives the chance of obtaining the qualified cathode films, suitable for use in different fields of modern technology.
The present work is a continuation of our investigations in the field of electrochemical obtaining the semi-conducting alloys Re-Se and it’s devoted to the study of scientific basis of the joint electrodeposition Re-Se alloy by the method of cycling avometry.
2. Methods of experiment
For making the experiment there have been used the following reactants: SeO2, H2SO4 (chemical pure) and NH4ReO4 (pure for analysis). The experiments have been made in a glass cell provided with the water jacket.
The cycling avometer curves’ have been reading taken by means of potentiostat P-5827M and 2D registering device PDP4-002. As a working electrode there have been used a platinum electrode with 0.15 square cm, and as comparative electrode there have been used a chlorine-silver plate electrode, as anode – the platinum plate with 4 square sm. The acidity of solution was determined by pH-meter 673M with the glass electrode. The temperature of electrolyte was regulated by means of thermostat UH. the content of Re-Se alloy components has been analyzed as the following: 10 ml of concentrated HNO3 were dissolved while heating and after repeated evaporation in the water boiler-both there was added 5 n of H3PO4 to the solution. The obtained solution has been diluted in the measured retort till 50 ml and then by extraction with isoamyl spirit rhenium was separated from selenium. The rhenium has been determined by photometry of rodanide complex at the device FEK-56M [7], and selenium has been determined by thiocarbomide complex [8].
X-ray graphical investigations of thin films Re-Se have been carried out at difractometer URS-55 in CuK�-irradiation in RKD camera 57,3.
3. The results and their discussion
In order to study the mechanism of formation Re-Se alloy there have been measured cycling avometer curves in different according to composition electrolytes as well as there was held the chemical and X-ray difractive analysis of cathode settlements, obtained at the certain potentials.
For detailed investigation of the process of obtaining the thin electrolytic coverings of Re-Se alloys
Advances in Materials Physics and Chemistry Supplement: 2012 world Congress on Engineering and Technology
Copyright © 2012 SciRes. 25�

you must have the information about kinetics of deposition of separate components and alloys. With this aim there were indicated the polar curves of Re-Se alloys extractions and of the separate metals at the platinum electrode.
As it is known the rhenium stays in sulphate electrolytes in the form of ReO4
� and its reduction consists of several separate processes.
ReO4� + 8H+ + 7e � Re + 4H2O
According to the work [9] the degree of ReO4� -
ions goes stage-by-stage and each stage of formation the intermediate products is characterized by a certain electrode potential, which becomes more negative in the process of rehabilitation, which can also provide the approach of Re and Se potentials settlement.
ReO4� + 2H+ + e � ReO3 + H2O ;
E1 = +0,77V
As it follows from these works, deposition of H2SO3 is a multistage process. At the first stage the adsorption of Se acid takes place, where on the surface of electrode the adsorbed compounds of Se with intermediate degree of oxidation are being formed.
ReO3 + 2H+ + 2e � ReO2 + H2O ; E2 = +0,4V
ReO2 + 4H+ + 4e � Re + 2H2O ; E3 = +0,26V
Thus, the rhenium reduction in strong acid
electrolytes goes according to the stage, through the formation of intermediate oxides film, about which tell us red and blue sediments in the obtained film.
In order to have a whole information about the joint electrodeposition of Re with Se, there were measured the cycling polar curves of rhenium in sulfate electrolyte at the different involutions. There are two sharp waves on the curve of a cathode halfcycle. One of them is at the potential 0,2 - 0,3 V, the other – at(-0,3)-(0,4)V (s.c.e). Formation of these waves can be explained by the step mechanism of reduction the perrenate ions. The character of anode halfcycle also proves this suggestion. The anode wave forming at the potential 0,1-0,2V (s.c.e.) can be explained by Re dissolving, and distinctly expressed peaks – to dissolving of ReO3 and ReO2 correspondingly.
There have been studied the dependence of involution rate of potential on the rise of limited current value. Dependence of limited current from square root of potential involution rate has a rectilinear character, which is observed in those cases, when the deposition rate is controlled by ions diffusion to the surface of cathode.
Then, in order to have additional information about the processes taking place while Se deposition, there were measured cycling polar curves of Se in sulphate solutions at the different involution.
As it can be seen in the diagram on the cycling volt-ampere curves of cathode deposition and anode oxidation of Se there appears a wave, which refers correspondingly to rehabilitation of SeO3
2� till Se and to oxidation of the obtained product till SeO3
2�. As well as it can be seen from the diagram that with the rise of evolution rate the volt-ampere curves are shifted to the positive side and at the involution of 80 mV/seÍ the wave disappears and there is formed a maximum limited current.
Perhaps, while formation the wave of reduction the main role plays the high resistance of created semi-
conducting layer of Se, and therefore the process velocity decreases. With shifting the potential to the negative side a stormy discharge of hydrogen on the cathode takes place.
It’s been established, that electrochemical formation of thin layer films goes through a number of complicated electrochemical reactions.
One of the factors influencing simultaneous deposition of electrolyte components is the state of a platinum cathode. It’s also well-known, that electrocatalytic activity of electrode surface can change while depositing the other metals in a small quantity.
There were suggested several various mechanisms of electrochemical rehabilitation of Se [10], in the field of positive potentials (from +0.75 to +0.35 V s.c.e.).
There have been shown the typical avogrammes of SeO2 solution in sulphuric acid at the platinum electrode. According to the results of investigations [5], the processes concerning peaks C1 and C2 are connected with formation of adsorbed compounds of Se with intermediate degrees of oxidation on the electron surface:
1) deposition and reduction of Se compounds (IV) on the active surface of platinum electrode H2SeO3 + 2H+ + 2e � H2SeO2 (Pt) + H2O E = +0.70V
2) the current of reduction C2 is connected with the process an substrate surface, which reminds the deposition of amorphous Se: H2SeO2(Pt) + 2H+ + 2e � OSe (Pt) + 2H2O E = +0.35V
Our results are coordinated with the literature information.
In order to investigate the joint electrodeposition and to study kinetics and mechanism of the process of joint electrodeposition of Re with We from sulphate electrolyte there were taken the cycling voltamper curves of Se, Re and Re-Se alloy. The Re deposition on platinum electrode takes place at the potential about 0.6 V (s.c.e), and Se – at 0.5 V (s.c.e.). The curves of alloy are quite different from the curves taken from solutions, having separate components. The joint deposition of Re with We takes place at the more positive potentials, than these metals extraction separately, i.e. both components in alloy are extracted by depolarization. Such location of polar curves is observed in those cases, when it’s possible to form a chemical compound on the cathode. The depolarization itself is a direct evidence of the fact that at the joint deposition there is a chemical interaction between the components with formation of ReSe2 on the cathode.
Re + 2Se � ReSe2 At the change of the direction of potential
evolution on the anode semi-cycles of voltampere curves, being obtained for individual components, there is observed just one peak of anode oxidation. For rhenium the pear of
25( Copyright © 2012 SciRes.

oxidation starts at the potential 0.6 V (s.c.e.) and for Se about 0.95 V (s.c.e.).
However, there have been observed 3 peaks of anode oxidation on the voltampere curve of the anode semi-cycle. The peaks of oxidation, observed at 0.60 and 0.95 V (s.c.e.) no doubt, are caused by Re and Se oxidation. The new peak of oxidation, observed at the potential 0.80 V (s.c.e.) refers to the oxidation of complex ReSe2, forming on the cathode according to the reaction
ReSe2 = Re + 2Se + 2e Hence, at the indicated potentials on the cathode
the joint deposition of Re with Se doesn’t take place and the only cathodic product is Se.
The joint deposition of Re with Se starts at the potential some about 0.20 V (s.c.e.) which is confirmed by the appearance on the curve the anodic semi-cycle of the second wave of anodic current at the potential 0.80 V (s.c.e.) connected with ReSe2 oxidation.
The sediment very close to ReSe2 according to the composition is obtained in the interval of potentials 0.15 V (s.c.e.). By shifting the potential to the negative side the content of Se in cathodic sediments is rising. These sediments consist of ReSe2+Se. According to X-ray phaseous analysis, the films, having surplus quantity of Se and obtained at the potentials more positive than 0.25 V, consist of two phases ReSe2 and Re.
The information taken from microanalyser showed that Re is mostly in the lower layers of the films. And the films rich with Se, obtained at the potential 0.10 V, consist of two phases ReSe2 and Se. Here Se is located in the upper layers of the films.
The films, very close to ReSe2 according to their composition are formed in the interval of potentials 0.25 V.
There were analyzed the content and morphology of thin layers ReSe2, electrodeposited on the platinum electrode. From the X-ray phaseous analysis it follows the film consist from 54% of Re and 46% of Se (according to the mass).
We have established that the compound ReSe2 is crystallized in triclinic syngony with the parameters of the lattice: a=6.7275 Å; b=6.6065 Å; c=6.7196 Å.
4. Conclusion
There have been investigated the kinetics and mechanism of the cathode electrodeposition of thin coverings Re-Se from the sulphate electrolyte. Was shown, that co-deposition of rhenium and selenium occur with some depolarization, which is due to the energy release upon the formation of the alloy.
REFERENCES
1. Speranskaya E.F. Electrochemistry of Rhenium. p.53. Gylym, Alma-Ata, (1990)
2. Obolonchik V.A., Yanaki A.A. Col. “Rhenium in the new Technics”. p. 59. Publishing House “Nauka”, Moscow, (1970)
3. Obolonchik V.A., Mikhlina T.M. The Ukraine chemical journal, “Rhenium Selenide obtaining and properties” p. 1037-1040, v.30, Kyev, (1964)
4. Opalovsky A.A., Fedorov V.Y., Lobkov Y.U. Journal Non-organic materials, “The new selenides and rhenium tellurides”. p. 144-148, Publishing House of the USSR AS, v. 1, No 2, (1971)
5. Salakhova E.A. Az. Chem. Journal, “The joint reduction of rhenium and selenium in sulphuric acid solutions”, p.9-12, No 3, Baku, (1999)
6. Salakhova E.A. Az. Chem. Journal, “The main regularities of the joint electrodeposition of Re with Se from sulphate electrolyte”, No 4, Baku, (2003), p.140-144.
7. Borisova L.V., Yermakov A.N. “Analytic chemistry of rhenium”. Publishing House “Nauka”, Moscow, (1974), p. 95.
8. Nazarenko I.I., Yermakov A.N. “Analytic chemistry of Se and Te”. Publishing House “Nauka”, Moscow, (1971), p.46
9. Salakhova E.A., Medjidzade V.A. at all “The electrodeposition of rhenium in alkalin and acidic electrolytes”, Journal of Chemistry and Chemical Engineering, Volum 6, No 5, (2012), p.489-494.
10. Dikstiene N. Electrochemistry, “Deposition of thin films Cu-Cd-Se”, v. 39, No 12, Moscow, (2003), p. 1487-1493
Copyright © 2012 SciRes. 25)

Resolving a challenge in the modeling of hydrogenproduction using steam reforming of Methane in monolith
reactors using CFD methods
Mohammad IraniResearch Institute of Petroleum Industry (RIPI)
Tehran, Iran.
Email: [email protected]
Abstract—Reaction modeling of SMR (Steam MethaneReforming) process inside monolith reactors using two approacheswere investigated and compared with each other. In the firstapproach, the reactions were assumed to take place exactly on thewall surfaces, while in the second approach they considered inside athin thickness near the walls. Experiments of SMR were carried outin a lab-scale monolith reactor. A single-channel was considered andCFD model were developed for each of aforementioned approaches.Comparisons between modeling results and experimental datashowed that the first approach (surface model) gives better results.Performing reactions are difficult and expensive, CFD simulationsare considered as numerical experiments in many cases . It wasconcluded that obtained results from CFD analysis gives preciseguidelines for further studies on optimization of SMR monolithicreactor performance.
Keywords- Hydrogen production, monolithic reactor, CFD,SMR, surface-model, volume-model
1- INTRODUCTIONHydrogen is one of the cleanest fuels which can be used
instead of fossil fuels. There are variety of applications forhydrogen in industries such as: fuel cells, green cars, metalproduction and fabrication, Petroleum recovery and refinery,chemical processing, power generation, etc. The mentionedapplications made the Hydrogen a strategic product. The mostfamous process for hydrogen production is Steam Reformingof Methane (SMR) which converts Methane and otherhydrocarbons presented in natural gas into Hydrogen in largecentralized industrial plants. Researchers are being done inorder to develop small-scale SMR technologies to enable thedevelopment of distributed hydrogen production and deliveryinfrastructure [1, 2]. Therefore due to attaining this goal small-scale SMR technologies should be modeled and optimized [3-7]. Monolith catalysts can be widely used in manyapplications particularly for their high geometric surface area,low pressure drop and good mechanical strength anddurability [8]. In addition using monolithic reactors havesignificant advantages such as reduced capital cost, smallerfootprints and potentially easier transportation [1, 9-11]. Theseadvantages can be particularly valuable when considering theexploration of remote resources such as offshore reserves ofnatural gas[12]. In the present work, hydrogen production in a
bench-scale SMR monolith reactor was studied. Two differentapproaches were presented in the literature for implementingreaction rates in monolith reactor models, namely surfaceapproach and volumetric approach. In the first approach, thediffusion into the thin catalytic layers (washcoat) in modelingof monolithic reactors is neglected and the reactions areassumed to take place at the surface of the washcoat. Casestudies for this approach include steam Methane reforming(SMR) [14], steam reforming of methanol [15, 16, and 17],ethanol steam reforming [18] and autothermal reforming of n-hexadecane [19]. Hartmann et al. [20, 21] studied Hydrogenproduction by catalytic partial oxidation of iso-octane atvarying flow rate and fuel/oxygen ratio.
Massing et al. [24] studied the catalytic conversion ofpropene and demonstrated that diffusional limitations withinthe washcoat limit the propene conversion. Stutz andPoulikakos [25] considered diffusion and reaction inside thewashcoat of a monolithic reformer.
In the present study, the surface and volumetric approacheswere used to model SMR in a single-channel monolith reactor.The obtained results from each model were compared withexperimental data.
2- MATHEMATICAL MODELIn order to model the problem, five sets of equations
should be solved; continuity equation, momentum balance,energy and species transport equations.
0)v.( (1)
Sgvv.P)vv.( T (2)
R
n
1iii Sq.Jh.)PHv.(
(3)
Where, represents mixture density, v is velocity vector, is the mixture viscosity, H and hi are total enthalpy andenthalpy of species, respectively and Ci stands forconcentration of chemical species. P is the static pressure andSR is the heat of reaction.
Advances in Materials Physics and Chemistry Supplement: 2012 world Congress on Engineering and Technology
256 Copyright © 2012 SciRes.

Fluent 6.2.16 CFD software was used and an axi-symmetric model was employed for each of the twoapproaches.
2.1. Approach (I): surface-based reaction rate
In this model, it was assumed that the reactions take placeat the reactor walls. This model ignores the effect of washcoatthickness, porosity and diffusion in pores because of the smallthickness of washcoat. The reaction rate can be multiplied byloading of the catalyst, Fwashcoat, to give the surface basedreaction rate (si) that is implemented in the CFD code:
s.m
kgmol
m
catkg
s.kgcat
kgmolrS
22ii washcoatF
(4)
The value of measured Fwashcoat was 0.04kg/m2 .Thesurface based catalytic reaction is used as source term in righthand of species continuity equation (equation 4).
2.2. Approach (II): volume-based reaction rate
In this model, the reactions were assumed to take place ina porous zone of catalyst with 0.07mm thickness.
Diffusive mass flux in the porous zone was calculatedusing the following equation:
ii,eff,Mi
i XDW
WJ
(7)
Here i,effe,MD is the equivalent Fick’s diffusion coefficient
which includes two terms: i,KnudD and i,MD :
i,kdudi,Mi,eff,M D
1
D
1
D
1(8)
i,MD and i,KnudD are mixture diffusion and Knudsendiffusion coefficients. Also R is the gas constant, porosity,T the gas temperature and is tortuosity that represents thedeviation of the washcoat pore length from the ideal cylinder[26, 27]. In order to describe catalytic reaction rate inkmol/m3.s, the surface exposed to reaction per unit volume ofwashcoat should be calculated:
2out
inwashcoat
rh
hr2P
volume washcoat
reaction to exposed surface(
12)
Here, rin is inner diameter and rout the outer diameter ofwashcoat and h is the monolith’s height. By multiplying
washcoatP by iS , the reaction rate based on catalyst volume,
iV is obtained:
s.m
kmol
m
m
s.m
kmolPSV
33
2
2washcoatii
(13)
This term is used as reaction source in equation (4) forapproach II.
2.3. The kinetic models describing the catalytic reactions
The reaction rates of SMR on Ni catalyst reported byFroment [29, 30] are adopted in this study. The species whichexist as reactant and products in SMR consist of: CO, H2, CO,CO2, H2O and CH4.
3. Results and DiscussionThe predicted distribution of the products and reactants
along the reactor using approach (I) is given in figure 1.
Fig.1 distribution of H2, CH4, CO, H2O along the reactor (Model- I)
The figure shows exponential changes in the massfractions of reactants and products along the reactor. Inaddition, almost 95% of the changes occur at a distance of9mm from the entrance.
The contour plots of Hydrogen mole fraction inside thereactor is given in figure 2.
Fig2. Contour of H2 mole fraction (Model- I)
Higher concentrations of Hydrogen are observed near thereactor walls where it is produced. However, the radialgradient of hydrogen concentration is descended along thereactor due to convectional and diffusional mass transfer andlower rate of Hydrogen production in the frontier regions.Figures 3 and 4 reveal that the main changes in theconcentrations of reactants and products occur in the first9mm of the reactor. The predicted distribution of the productsand reactants along the reactor using approach (II) is given infigure 8.
Copyright © 2012 SciRes. 257

Fig3. H2 mole fraction at 6 locations (Model- I)
Fig.4 Dِistribution of H2, CH4, CO, H2O along the reactor (Model- II)
This figure shows that there are considerable changes inthe concentrations at the reactor output. Radial distribution ofhydrogen plotted in figure 9 confirms this point by showingthat there is still a significant difference between theconcentrations in the lengths of 25 and 30mm. The productgas species from experiments were measured by GC. Acomparison between experimental and predicted values ofMethane conversion at different reactor temperatures is givenin Figure.6 . This figure shows that the predicted conversionsof approach (I) at all the examined temperatures are moreaccurate than that of approach (II).
It can be explained by the fact that due to low diffusioncoefficient in the washcoat, the species can only diffuse to alimited thickness of the washcoat. Therefore, the availablevolume of the porous zone for chemical reactions is smallerthan the total volume of washcoat. Thus the conversions of thereactions are underestimated in this model. In the other hand,by considering the fact that the residence time of gas speciesinside the reactor is in the order of milliseconds [10], it can berealized that the species don't have enough opportunity todiffuse into the porous washcoat.
Fig5. H2 mole fraction at 6 locations (Model- I)
65
70
75
80
85
90
95
100
923 973 1023 1073 1123
Temperature(K)
% C
H4
Con
vers
ion
Experiment Model - I Model - II
Fig.6- Comparison of CH4 conversions between Model-1, Model-2 and
experiments
Fig.7- Comparison of H2 yield between Model-I, Model-II and experiments
The comparison of predicted and experimental values ofHydrogen yield (Figure.7) shows similar results and thepredictions of approach (I) are better than that of approach (II)for all examined reactor temperatures.
The experimental and predicted values of Hydrogenselectivity are compared in table 1. The values in this tableshow that the error values for approach (I) are less than 5%,while for approach (II) it is more than 30%. The whole abovediscussion testify that predictions of approach (I) is moreaccurate than that of approach (II).
258 Copyright © 2012 SciRes.

Table1- Comparisons between the two models and experimental results
Model
1
Model 2 Exp Model 1
Error
(%)
Model 2
Error
(%)
H2 selectivity*
(T=700 ºC)71.26 51.83 73.78 3.41 29.7
H2 selectivity
(T=750 ºC)75.65 55.37 77.81 2.775 28.8
H2 selectivity
(T=800 ºC)78.1 58.36 79.11 1.27 26.2
4. ConclusionThe current study presents two approaches for numericalmodeling and implementation of reaction rates in simulationof heat and mass transfer in monolithic reactors. The chemicalconversion on the Ni-catalyst is modeled using general kineticmodels for SMR and Water–Gas-Shift (WGS) reaction ratesbased on Langmuir–Hinshelwood type. Monolithic reactorwas simulated using mentioned two approaches under steady-state condition. The results of two approaches were comparedto corresponding experimental data and a comprehensiveevaluation was carried out. The results showed that thepredictions of surface-based approach are more accurate thanthat of volume-based approach. The volume-based modelunderestimates the conversion of reactions. Small values ofeffective diffusion coefficient in porous washcoat layer andlow residence time are the main reasons of discrepancybetween volume-based approach and experiment results. Intotal, despite of its ease of implementation, the first approach(surface reactions) gives better results both in generality andaccuracy. Also . It was concluded that obtained results fromCFD analysis gives precise guidelines for further studies onoptimization of SMR monolithic reactor performance.
References[1] A.Y. Tonkovich , S. Perry, Y. Wang, D. Qiu, T. LaPlante and W.A.
Rogers , “Microchanel process technology for compact Methane steamreforming,” Chem. Eng .Sci , vol. 59, pp. 4819–4824, 2004.
[2] D. Hickman and L.D. Schmidt, “ Production of syngas by directcatalytic oxidation of Methane”, Science , vol. 259, pp. 343–346,1993.
[3] E.E. Gonzo, “ Hydrogen from methanol-steam reforming. Isothermaland adiabatic monolith reactors’ simulation.” ,Int J Hydrogen Energy,vol.33,pp. 3511 – 3516, 2008.
[4] E. Lo´pez, A. Irigoyen, T. Trifonov, A. Rodrı´guez, J. Llorca, “ Amillion-channel reformer on a fingertip: Moving down the scale inhydrogen production”, Int.J. Hydrogen Energy, vol.35 ,pp. 3472 – 3479,2010.
[5] L. Shi, “ Bayless D J and Prudich M E. A CFD model of autothermalreforming”, Int J Hydrogen Energy ,vol .35 ,pp. 3472 – 3479 , 2010.
[6] W. Cai, F. Wang, A.V. Veen, C. Descorme, Y. Schuurman and W. Shen ,“ Mirodatos C. Hydrogen production from ethanol steam reforming in amicro-channel reactor”, Int J Hydrogen Energy, vol. 35,pp. 1152 – 1159,2010.
[7] X. Zhai, S. Ding, Y. Cheng, Y. Jin and Y. Cheng, “ CFD simulationwith detailed chemistry of steam reforming of Methane for hydrogenproduction in an integrated micro-reactor” , Int J Hydrogen Energy , vol.35, pp. 5383 – 5392, 2010.
[8] T. Boger, “ Monolithic catalysts for the chemical Industry”, Ind EngChem Res, vol.43 ,pp. 4602-4611, 2004.
[9] R.S. Benson and J .W. Ponton., “ Process Miniaturisation-A Route toTotal Environmental Acceptability”, Chem. Eng. Res. Des. ,vol. 71,pp.160–168,1993.
[10] A.Y. Tonkovich, B. Yang , S.T. Perry, S.P. Fitzgerald, Y. Wang ,“ From seconds to milliseconds to microseconds through tailoredmicrochannel reactor design of a steam Methanereformer” , CatalToday , vol.120 ,pp. 21-29, 2007.
[11] R.J. Bradley, L.C. Nathan, N.T. Diana, A.D. Robert, D.H. Jamelyn, Y.Wang , “ Engineered SMR catalysts based on hydrothermally stable,porous, ceramic supports for microchannel reactors” ,Catal Today,vol.120 , pp. 54-62, 2007.
[12] A.K. Avci, D.L. Trimm, M. Karakaya, “ Microreactor catalyticcombustion for chemicals processing”, Catal Today,vol.155 ,pp. 66-74 ,2010.
[13] G. Arzamendi, P.M. Diéguez, M. Montes, J.A. Odriozola, E. Falabella,E. Sousa-Aguiar and L.M .Gandía, “Methane steam reforming in amicrochannel reactor for GTL intensification: A computational fluiddynamics simulation study ”, Chemical Engineering Journal ,vol.168 ,pp. 168-173, 2009.
[14] A. Fazeli, M. Behnam, “ Hydrogen production in a zigzag and straightcatalytic wall coated micro channel reactor by CFD modeling”, Int JHydrogen Energy, vol.35 ,pp. 9496-9503, 2009..
[15] G. Arzamendi, P.M. Diéguez, M. Montes, M.A . Centeno, J.A.Odriozola, L.M . Gandía, “Integration of methanol steam reforming andcombustion in a microchannel reactor for H2 production: A CFDsimulation study ”, Catalysis Today, vol.143, pp. 25-31,2009.
[16] S. Fukahori, H. Koga, T . Kitaoka, M. Nakamura, H. Wariis hi ,“ Steam reforming behavior of methanol using paper-structuredcatalysts: experimental and computational fluid dynamic analysis”, Int JHydrogen Energy, vol. 33, pp. 1661-70¸2008.
[17] I.Uriz, G.Arzamendi, E.,López,J. Llorca, L.M. Gandía , “Computationalfluid dynamics simulation of ethanol steam reforming in catalytic wallmicrochannels ”, Chemical Engineering Journal, vol.167 ,pp. 536-544 ,2011.
[18] L. Shi, D.J. Bayless and M.E. Prudich , “ A CFD model of autothermalreforming” , Int J Hydrogen Energy, vol.34 ,pp. 7666-7675, 2009.
[19] M. Hartmanna, L . Maierb, O. Deutschmann, “ Hydrogen productionby catalytic partial oxidation of iso-octane at varying flow rate andfuel/oxygen ratio: From detailed kinetics to reactor behavior”, AppliedCatalysisA:General , vol.391, pp. 144–152, 2011.
[20] M . Hartmann, L. Maier and H.D .Minh, “ Deutschmann O. Catalyticpartial oxidation of iso-octane over rhodium catalysts: An experimental,modeling, and simulation study”, Combustion and Flame , vol.157, pp.1771–1782,2010.
[21] K. Zygourakis and R. Aris, “ Multiple oxidation reactions and diffusionin the catalytic layer of monolith reactors”, Chem. Eng Sci ,vol.32, pp.733-744 ,1983.
[22] Influence of the propene diffusion inside the catalytic layer”, ChemicalEngineering Science, vol.55,pp. 1707-1716,2000.
[23] M.J. Stutz, D. Poulikakos, “ Optimum washcoat thickness of a monolithreactor for syngas production by partial oxidation ofMethane” ,Chemical Engineering Science ,vol.63 ,pp. 1761 – 1770,2008.
[24] N. Mladenov, J. Koop, S. Tischer, O. Deutschmann “Modeling oftransport and chemistry in channel flows of automotive catalyticconverters ”, Chem.Eng.Sci, vol.65, pp. 812-826, 2010.
[25] Hoseini N, Msc thesis, Tarbiat Modares University: Tehran- Iran, 2010.
[26] J.P. Du Plessis, W.G. Gray, “ Pore-scale modeling of interstitialtransport phenomena. In: Fluid Transport in Porous media”,Computational Mechanics Publication Southampton, pp. 61–104,1997.
[27] H.K. Plummer , R.J. Jr, R.H. Baird , A.A. Hammerle and Adamczyk JD,“ Measurement of Automotive Catalyst Washcoat Loading Parametersby Microscopy Techniques”, Microscopy and Microanalysis, vol.5, pp.267-281,1999.
Copyright © 2012 SciRes. 259

Photocatalytic Degradation of Ethylene Dichloridein Water Using Nano TiO2 Supported on
Clinoptilolite as a PhotocatalystManouchehr Nikazar; Soheil Jalali Farahani; Mastaneh Reza SoltaniChemical Engineering Department of Amirkabir University of Technology
Tehran, [email protected]
Abstract - In this article one of the advanced oxidationprocesses (AOP) combined methods, photocatalyst /H2O2, isutilized in order to study photodegradation of ethylenedichloride (EDC) in water. Nano Titanium (IV) Oxide,supported on Clinoptilolite (CP) (Iranian natural zeolite) usingsolid-state dispersion (SSD) method for improvement of itsphotocatalytic properties. The results show that theTiO2/Clinoptilolite (SSD) is an active photocatalyst. The effectsof five important photocatalytic reaction parameters includingthe initial concentration of ethylene dichloride, the ratio ofTiO2/Clinoptilolite, the catalyst concentration, H2O2
concentration and pH in photodegradation of ethylenedichloride were examined. In this experiments, the design andalso the optimum parameters were obtained by Taguchi Method,using Design Expert8® software. Taguchi's L27 (5^3) orthogonalarray design was employed for the experimental plan. Fourparameters were found to be significant whereas, pH was foundto be an insignificant parameter after conducting experiments.A first order reaction with K = 0.007 min-1 was observed for thephotocatalytic degradation reaction.
Keywords- Photodegradation; Photocatalysts; TiO2/Clinoptilolite;Ethylene Dichloride
I. INTRODUCTIONEffects of several different pollutions such as phenol
compounds, alcohols, organic acids, hydro-carbonic sulfurcompounds, pesticides and insecticides compounds, dyes,output wastewater from various industries and etc. usingphotocatalytic oxidation has been investigated on sewagetreatment. All of these experiments show high efficiency indegradation and removal of these pollutions from water andsewage by this method [1,2]. Usual biological treatmentmethods for hazardous compounds such as chlorinatedhydrocarbons are not efficient, because of high toxicity ofthese compounds which results in destroying microorganisms.TiO2 is one of the most effective photocatalysts due to itsbiological and chemical inertness and photo stability in near-UV band energy gap, and can be used as a fine powder orcrystals dispersed in water and wastewater treatmentapplications. However, the need to filter TiO2 particles afterreaction makes such a process troublesome and costly. Thus,in order to solve this problem, many researchers haveexamined several methods for fixing TiO2 on supportingmaterials including glass beads [3–5], fiber glass [6–8], silica[9,10], and zeolite [11,12]. When using zeolite as TiO2
support, care should be taken that TiO2 does not lose its
photo activity and the adsorption properties of zeolite are notaffected. Matthews [4] showed that the photo efficiency ofTiO2 is suppressed when TiO2 is in interaction with thezeolite.In this work TiO2 was supported on a zeolite without
losing photo efficiency and affecting the adsorptionproperties of zeolite using the exact method suggested byNikazar et. al. [13] for supporting TiO2 on Clinoptilolite. Thismixture was used for photodegradation of aqueous EDC.
II. EXPERIMENTAL
A. Materials
Degussa P-25 titanium dioxide with a crystallographicmode of 80% anatase and 20% rutile, a 50 m2g-1 BET surfacearea and an average particle size of 30 nm (according to themanufacturer’s specifications) and the raw material was anIranian commercial Clinoptilolite (CP) (Afrand Tuska, Iran)from deposits in the region of Semnan. According to thesupplier’s specifications, it contains about 90 wt% CP (basedon XRD internal standard quantitative analysis) and the Si/Almolar ratio is 5.78. The concentration of Fe2O3, TiO2, MnOand P2O5 impurities has been reported to be 1.30, 0.30, 0.04and 0.01 wt% respectively, and were used for preparation ofthe photocatalyst. Merck H2O2 with 30% purity, andEthylene dichloride (EDC) produced by Bandar ImamPetrochemical Comlex, with 96% purity for making reactingsolution.
B. Preparation of TiO2-supported on CP catalysts
The Solid State Dispersion (SSD) method was applied forsupporting photocatalyst on zeolite. In this method, nanotitanium peroxide was mixed with CP using ethanol as asolvent and mixture was grinded for 3 hours. Ethanol wasthen removed by evaporation. Samples were dried at 110°Cin the oven and calcined at 450°C in the furnace for 5 hoursto obtain TiO2-supported zeolite photocatalysts [13].
C. ApparatusPhotocatalytic reaction was performed in a batch Pyrex
double wall reactor of 1.5 L in volume with two 8-W UV-Cmercury lamps located in quartz tubes inside the reactor. The
Advances in Materials Physics and Chemistry Supplement: 2012 world Congress on Engineering and Technology
260 Copyright © 2012 SciRes.

Fig.1. Schematic of photo reactortubes were made from quartz because UV-C light cannot passthrough glass and Pyrex.The photo reactor used in thisexperiment is shown in Fig. 1. Circulator has been used fortemperature adjustment and GC VARIAN CP-3800 was usedfor EDC concentration measurement.
D. ProceduresA solution containing known concentration of EDC was
prepared; subsequently 800 cc of this solution was pouredinto the reactor. The solution pH value was adjusted atdesired level using dilute NaOH and H2SO4. Then certainamount of prepared photocatalyst and H2O2 was added to thesolution. Photocatalytic reaction took place under theradiation of mercury lamps while agitation and aeration wasmaintained to keep the suspension homogeneous andoxygenized. Sampling was performed at specified times andconcentration of EDC was determined using GC.
III. DESIGN OF EXPERIMENTSEffects of five parameters that influence the efficiency of
photocatalytic reaction have been studied in theseexperiments. Initial concentration of pollutant (EDC), H2O2
concentration, catalyst amount, TiO2% and pH, each of themin three levels, are shown in Table 1.
TABLE 1. Experimental parameters and their levels
Process Parameters Level 1 Level 2 Level 3
Catalyst
Concentration g/LA 0.1 0.25 0.5
H2O2 Concentration
(ppm)B 0 50 100
Initial Concentration
of EDC (ppm)C 200 400 600
pH D 4 7 10
TiO2% E 10 15 20
Because of numerous studying parameters, each at 3different levels, Taguchi method for design of experiments
using Design Expert 8.0.5® was employed to decrease thenumber of experiments to 27 for obtaining optimum terms.Temperature is one of the effective parameters onphotocatalytic reactions that are usually set at ambienttemperature, but due to high volatility of ethylene dichloridein the ambient temperature and aeration during process, largeamount of EDC would be vaporized from the solution.Therefore, reaction’s temperature was set at 5 °C usingcirculator.Temperature is one of the effective parameters on
photocatalytic reactions that are usually set at ambienttemperature, but due to high volatility of ethylene dichloridein the ambient temperature and aeration during process, largeamount of EDC would be vaporized from the solution.Therefore, reaction’s temperature was set at 5 °C usingcirculator.
IV. RESULTS AND DISCUSSIONA. Taguchi Method
ANOVA analysis is shown in the Tab. 2.
TABLE 2. ANOVA analysis report
SUM of Squares: sum the squared differences between theaverage values for the blocks and the overall mean.DF: degrees of freedom attributed to the blocks, generally
equal to one less than the number of blocks.Mean square: estimate of the block variance, calculated by
the bock sum of squares divided by block degrees offreedom.The F-value of 33.10 implies the model is significant Valuesof “Prob > F” less than 0.0500 indicate model terms aresignificant. In this case A, B, C, E are significant modelterms.
In the Fig. 2 we can see a graph of the predicted responsevalues versus the actual response values. It is clear that all ofthe values are predicted by the model.
Responses should be assigned as “larger is better” forenhancing optimized parameters as showed below:
[Catal] [H2O2][EDC]
0pH TiO2% R1 Desirability
0.25 50 200 7 15 0.739634 1
SourceSum ofSquares
DFMeanSquare
F ValueProb. >F
Model 52.27853 8 6.5348162 33.101924 < 10-4
A-[Catal] 10.67263 2 5.336314 27.030945 < 10-4
B-[H2O2] 4.036541 2 2.0182704 10.223491 0.0011C-[EDC]0 31.69998 2 15.849991 80.287672 < 10-4
E-TiO2% 5.86938 2 2.9346898 14.865587 0.0002Residual 3.55347 18 0.197415Cor Total 55.832 26
Copyright © 2012 SciRes. 261

Design-Expert® Software(R1) -̂2.81
Color points by value of(R1) -̂2.81:
7.88595
2.3486
Actual
Pre
dict
ed
Predicted vs. Actual
2.00
3.00
4.00
5.00
6.00
7.00
8.00
2.00 3.00 4.00 5.00 6.00 7.00 8.00
Fig. 2. Predicted vs. Actual plot
B. Kinetics of photocatalytic degradation of EDC
Several experimental results indicated that thedegradation rates of photocatalytic oxidation overilluminated TiO2 fitted by the first-order kinetic model [14-16]. Fig. 3 shows the plot of ln([EDC]0/[EDC]) vs.irradiation time for EDC. The linearity of plot suggests thatthe photodegradation reaction approximately follows thepseudo-first order kinetics with K = 0.007 min-1.
C. Effects of UV irradiation and photocatalyst ingredient
In Fig 4. the comparison of four experiments is shown.First column is degradation efficiency of EDC using onlyUV light without photocatalyst, this column shows theimportance of photocatalyst because eliminatingphotocatalyst from reaction caused decrease in efficiencyabout 47%. Second column is about degradation efficiencyof EDC employing 15% wt TiO2 photocatalyst without UVirradiation, this column shows influence of UV light inactivating photocatalyst, reaction efficiency with elimination
Fig.3. Plot of reciprocal of pseudo-first order rate constant against initialconcentration of EDC = 200 ppm, concentration of photocatalyst (15 wt%
TiO2/CP) = 0.25 g/L, [H2O2]=50 ppm, T = 278 K, pH = 7.
Fig. 4. Comparison of degradation efficiency in four different experiment inT= 278 K, pH=7, [H2O2]=50 ppm, [EDC]0=200 ppm, [catalyst]=0.25 g/L.
of UV light cause 45% efficiency reduction. Third column isshown degradation efficiency of EDC using pure TiO2
(degussa P25 without zeolite) catalyst with UV irradiation,supporting catalyst on zeolite increase reaction efficiencyabout 37% . In last column degradation efficiency of EDCwith optimum parameters has been brought for comparison.All of the other parameters are the same.
V. CONCLUSION
1. SSD method is an effective method for supportingTiO2 on Clinoptololite.
2. The following optimum terms obtained withTaguchi method :
Initial concentration of EDC 200 ppm, catalystconcentration 0.25 g/L, H2O2 concentration 50ppm, TiO2% 15 and effect of pH and twoparameters interactions were not significantenough.
3. Initial concentration of EDC, Catalystconcentration, TiO2% and H2O2 concentration wereeffective in reaction efficiency, respectively.
4. Maximum efficiency of 74% for photocatalyticdegradation of EDC was obtained with optimizedparameters.
5. The kinetic of photocatalytic degradation of EDC isof the pseudo‐first order with K = 0.007 min‐1.
262 Copyright © 2012 SciRes.
REFERENCES[1] A. Shafai, M. Nikazar, et al., ”Petrochemical wastewater
treatment containing heavy metals and TPA using EC and nanophotocatalyst processes”, PhD Thesis (2009).
[2] M. R. Hoffmann, S. T. Martin, W. Choi and D. W. Bahnemann,“Environmental application of semicondustor photocatalysis”,Chem. Rev. 95 (1995) 69-96.
[3] J. Sahate, M.A. Anderson, H. Kikkawa, M. Edwards and G.G.Hill, J. Catal., 127 (1991) 167.
[4] R.W. Mattews, J. Phys. Chem., 92 (1988) 6853.[5] Y. Xu and X. Chen, Chem. Ind. (London), 6 (1990) 497.[6] K. Hofstandler, K. Kikkawa, R. Bauer, C. Novalic and G.
Heisier, Environ. Sci. Technol., 28 (1994) 670.[7] R.W. Mattews, Solar Energy, 38 (1987) 405.[8] Y. Xu, P.C. Menassa and C.H. Langford, Chemosphere, 17
(1988) 1971.[9] M. Anpo, H. Nakaya, S. Kodama, Y. Kubokawal, K. Domen and
T. Onishi, J. Phys. Chem., 90 (1986) 1633.[10] S. Sato, Langmuir, 4 (1988) 1156.[11] H. Yoneyama, S. Hag and S. Yamanaka, J. Phys. Chem., 93
(1989) 4833.[12] X. Liu, K.K. Iu and J.K. Thomas, J. Chem. Soc. Faraday Trans.,
89 (1993) 1861.[13] Manouchehr Nikazar, Khodayar Gholivand, Kazem Mahanpoor,
“Photocatalytic degradation of azo Acid Red 114 in water withTiO2 supported on Clinoptilolite as a catalyst”, Desalination 219,(2008) 293–300.
[14] A.L. Linsebigler, L. Guangquan and J.T. Yates, Chem. Rev., 95(1995) 735.
[15] M. Saquib and M. Muneer, Dyes Pigments, 56 (2003) 37.[16] V. Augugliaro, C. Baiocchi, A. Bianco-Prevot, E. Garcia-Lopez,
V. Loddo, S. Malato, G. Marci, L. Palmisano, M. Pazzi and E.Pramauro, Chemosphere, 49 (2002) 1223.
[17] Y. Kim and M. Yoon, J. Mol. Catal. A Chem., 168 (2001) 257.[18] H. Chen, A. Matsumoto, N. Nishimiya and K. Tsutsumi, Coll.
Surf. A Physicochem. Eng. Aspects, 157 (1999) 295.
Copyright © 2012 SciRes. 263

Simulation of Thermophysical Processes at LaserWelding of Alloys Containing Refractory
Nanoparticles
Anatoly N. Cherepanov, Vasily P. ShapeevKhristianovich Institute of Theoretical and AppliedMechanics SB RAS; Novosibirsk State University
Novosibirsk, Russia
Liu Guangxun, Cao LameiBeijing Institute of Aeronautical Materials
Beijing, China
Abstract — Mathematical model is formulated fordescription of thermophysical processes at laser welding of metalplates for the case when modifying nanoparticles of refractorycompounds (nanopowder inoculators – NPI) are introduced intothe weld pool. Specially prepared nanoparticles of refractorycompounds serve here as crystallization centers, i.e. in fact theyare exogenous inoculants on which surface clusters are grouped.This can be used to control the melt crystallization process andformation of its structure, and, therefore, properties of the weldseam. As an example, calculation results of the butt welding ofaluminum alloy and steel plates are presented. The results ofcalculation and experimental data comparison are shown.
Keywords— Mathematical model; laser welding; nanopowderinoculators; crystallization process; calculation results
I. IntroductionIn the last years increasing attention has been paid to
development of technology for laser welding of metalproducts. In this connection, development of appropriatemathematical models and numerical algorithms for theirimplementation is a pressing problem [1,2].
A mathematical model is developed in this work fordescription of thermophysical processes at laser welding ofmetal plates for the case when modifying nanoparticles ofrefractory compounds (nitrides, oxides, etc) are introduced inthe molten pool. The mathematical model proposed is basedon non-equilibrium birth and growth of crystal phase on theinoculants, which are the nanoparticles, with use of theKolmogorov’s theory for calculation of the solid phasefraction. At that, the homogeneous nucleation can beneglected.
II. Physicomathematical modelof the process
Let us consider a steady-state process of two plates buttwelding. We introduce the Cartesian coordinate system with xaxis lying on the plates upper surface, z axis coinciding withthe symmetry axis and direction of the laser beam operation,and y axis perpendicular to the joint. The coordinates originlies on intersection of the beam axis and the plates upper
surfaces (Fig. 1). The beam moves along the joint in negativedirection of x axis with constant welding speed v=const. Themetal of the welded plates is protected from oxidation by aninert gas blow that carries away a part of the metal vapors. We
Fig. 1. The weld zone layout: 1 – laser beam, 2 – steam channel, 3 –liquid phase (molten pool), 4 – two-phase zone, 5 – solid phase.
assume the thermophysical parameters to be constant andequal to their average values in the temperature range underconsideration. Due to the small concentration of the dispersednanoparticles (~0.05% by mass), their influence on thephysical parameters of the alloy can be neglected. The alloy isconsidered to be a binary system. With these assumptions, thethree-dimensional equation of heat transfer in the weldpooland solid metal in the moving coordinate system takes theform:
2 2 2
12 2 2s
i i i
fT T T Tc v v
x x y z x
where ci, i, i are specific heat, heat conductivity, and densityof the i-th phase, respectively (indices i = 1, 2, 3 denoteparameters of solid, two-phase, and liquid states of the metal);δ = 0 in the melting zone; δ = 1 in the crystallization zone; fs isa share of the solid phase; fl =1–fs is a share of liquid phase inthe two-phase zone. In variant of the model used in this paper,all particles of the product in movable coordinate system moveparallel to x axis with the welding speed. The process ofmelting is considered in Stefan problem approximation,considering the phase transition boundary to be a smoothsurface, on which the conditions of thermodynamicequilibrium and heat balance are fulfilled:
Advances in Materials Physics and Chemistry Supplement: 2012 world Congress on Engineering and Technology
264 Copyright © 2012 SciRes.

2 1 1
2 1
, ( ),mT T
T Tn n
v n
where 2/)( 0 slm TTT is fictitious melting temperature,
sl TT ,0 are temperatures of equilibrium values of liquidus andsolidus, respectively, n is unit normal to the phase transitionboundary, κ is the melting heat (heat of crystallization),
1 1/T n and 2 2
/T n are the heat fluxes calculatedon the sides of the solid and liquid phases, respectively. Thisapproximation is reasonable, because at high temperaturegradients, zone of the phase transition at melting is a thin layer,which thickness is much less than the weld pool characteristic
size. Considering 2/)( 0 slm TTT to be the meltingtemperature, we can uninterruptedly proceed to modeling ofnonequilibrium heterogeneous crystallization on activesuperdispersed seeds in region of the alloy solidification
( 0lTTTe ). Here, Te is temperature of solidificationcompletion, determined from kinetic equation
/l Ke e e eT T C &
where , ,Ke e eC& are velocity of the solidification boundarymovement, impurity concentration on it, and the kineticcoefficient, respectively. For the problem's simplification, the
kinetic overcooling ( ee K/ ) is neglected due to its smallness,and the temperature of solidification completion, similarly tothe theory of quasi-equilibrium two-phase zone [3], isconsidered equal to the eutectic temperature ( )( ee CTT l ,
where eC is impurity concentration in the eutectic point). Inthe area of solidification (i = 2), the crystallization rate isdefined by the processes of origin and growth of solid phase inovercooled alloy on seeds, which are refractory activatednanoparticles. Considering all the nanoparticles to be centersof crystallization, we can define section of the solid phase,using the formula of Kolmogorov N.E. [4,5]:
esf 1
where 0
34
, ,3
l
x
p px
Kux y z N r Tdv
is volume of
the crystal phase formed in overcooled melt. Here, pN is thenumber of nanoparticles in volume unit; xl0 is the coordinate ofpoint x on isotherm with the temperature of liquidus Tl0 ,
0( )l lf T = 13/4
pNe
, pr is the radius of nanoparticles; Ku isthe constant of crystal growth in kinetic law [4 – 6]
u =Ku [Tl(C) T]n,
where u is the growth rate, n is a physical constant (n=1 atnormal mechanism of growth, n=2 at dislocation one); Tl(C) isthe liquidus temperature, which is approximated by lineardependence on dissolved (alloying) component С:
Tl(C) = Tl0 – β (C – C0 ),
where C0 is initial concentration of the dissolved component, is coefficient module of the liquidus line slope on the statediagram of corresponding binary alloy, T is localovercooling, defined by equation
爾 �lT T C T
According to (1), (2) and (3), in the crystallization zone
( 0lTTTe ) appears a source of heat, connected with heatgeneration during the melt crystallization. Due to nonlinear
dependence of ( )lf T , contribution of this heat generationcan be taken into account by solving the equation of heat
conduction iteratively, specifying on iterations lf and,consequently, T in the zone of crystallization.
Boundary conditions. At infinite distance from the
radiation source , x y we assume 0, , .T x y z TOn the plates upper and lower surfaces ( 0, )z z h blown by the inert gas, outside the steam channel, are fulfilledconditions of complex convective and radiation heat exchangewith the environment
0,0, ( ).i т z h gz h
TT T
z
Here, Tg is the gas temperature, m is the total coefficient ofheat transfer defined by expression
2 20 0 0 ,m km m z g z gT T T T
m is reduced emissivity of the heat transfer surfaces, m=0, 1
for the upper and lower surfaces, respectively; 0 is Stephan–
Boltzmann constant, km is coefficient of convective heattransfer [7]
1/ 2 1/ 30, 646 R e P r /km m g l ,
where Re / ; P / ;rm gm g g gv a gmv is the gas flow velocity; lis the characteristic length of the cooling zone; g, ag, g arethe gas kinematic viscosity, temperature conductivity, and heatconductivity, respectively.
Copyright © 2012 SciRes. 265

In the laser radiation impact zone (on the steam channelsurface z = Zc(x y) is fulfilled the heat balance condition:
.3T Lm &n q n
Here, m& is mass velocity of the substance evaporation fromthe surface unit, related to the vapors excessive pressure P(z)necessary for keeping the channel walls from collapse. It is
defined by relation v( )m P z & , v is the vapor density; Lis specific heat of the alloy evaporation, q is the absorbed heatflux with the re-reflection taken into account, n is unit normalto the channel surface. In numerical simulation, the lastrelation determines the heat flux on the steam channel surfaceand is the boundary condition for equation (1). We assume,that the welding is realized by CO2 laser radiation withwavelength 0=10,6 μm. The radiation intensity is described
by Gaussian normal distribution 2 20, , exp( 2 )zI x y z I r r
where 2
0 2 / ;zI W r W is the laser power, rz is the radius ofthe laser beam at depth z of the steam channel, determined byrelation [8]
22
0 ,
Fz F
F
z Zr r
r
where rF is the laser beam radius in focal plane; ZF is locationof the focus relative to the upper surfaces of the details welded.
For density distribution of the absorbed radiation power onthe surface of the steam channel with coordinates z=Zc(x, y) inthe zone of direct interaction we have expression
2 2
2
2, , , exp 2 /ef
z
z
A Wq x y Z x y r r
r .
Here, (1 )ef eA A A A is the absorption effective coefficient.The first member in this coefficient takes into accountabsorption of the radiation falling onto the surface directlyfrom the laser beam, while the second member takes intoaccount absorption of the radiation reflected repeatedly from
the channel walls; 1
1n
e b b cn
A A A S S S
value is
the equivalent absorption coefficient [9], Sb, Sc are areas oflateral surface of the channel and inlet, respectively, A iscoefficient of the laser radiation absorption by the steamchannel surface. In the area reached by the reflected radiation
only, efA lacks the first member.
III. Model of steam channelformation.
If the laser power exceeds some critical value, then in thearea of the beam interaction with the metal a steam channel
emerges. Even in the case of homogeneous material of theplates, and constant values of the radiation power and weldingrate, its walls oscillate chaotically due to the hydrodynamicinstability. The present model assumes that that channel wallsoscillate by their time-averaged location. There are variousmodels described in papers for considering the heat transferfrom the beam to metal as well as approaches to calculation of
Fig. 2. Temperature field and isotherms in calculation domain (cross-section y=0): 1 – steam channel, 2 – T = 2629.1 K (boiling-point temperature),3 – T = 2155 K, 4 – T = 1724 K, 5 – Tl0 = 862 K (equilibrium liquidustemperature), 6 – T = 420 K.
Fig. 3. Temperature field and isotherms in calculation domain (view fromabove, plane z = 0): 1 – steam channel, 4 – T = T = 1293 K, 5 – Tl0 = 862 K(equilibium liquidus temperature), 6 – T=560.3 K.
the steam channel shape. Here was used a slightly modifiedmethod described in [10]. Note that the channel wall shapeturns out to be similar to that of the channel front wallproposed in [11].
IV. Numerical method.For numerical solution of the problem about temperature
distribution in the calculation domain, a known iterative finite-difference scheme of steadying for 3D heat conductionequation is used [12]. As stated above, the heat balanceequations on different surfaces of the plates (4) were used asthe boundary conditions. Relation (5) was taken into accounton the steam channel surface. At a significant distance fromthe molten pool, i.e. on a remote boundary of the calculationdomain, the temperature was set equal to that of theenvironment.
V. Some results of numericalsimulation.
Some results of the temperature fields calculations in themolten pool and surrounding layers of the solid alloy areshown in the fig. 4. Boundaries of the pool, two-phasecrystallization zone were determined from characteristic
266 Copyright © 2012 SciRes.

1 2 3 4x
0.92
0.94
0.96
0.98
T
12
Fig. 4. Non-dimensional temperature profile in the crystallization zone. The x
axis begins at 0lx . Curve 1 corresponds to pN = 1810 m-3, curve 2
pN = 1910 m-3.
temperature values. The beam radius Fr in the focal planewas chosen as the length scale. Fig. 4 shows dimensionlesstemperature normalized to liquidus temperature Tl. The picturein a small part of the calculation domain is shown in thefigures for the purposes of obviousness. The numericalcalculations were carried out for alloy Аl + 10% Si (% of mass)at the same thermophysical parameters as in [10,13]. Forexample, laser power W=3.18 kW, welding rate v=4.7 m/min,plate thickness h=1.5mm. One can see in Fig. 2 that the mostwarmed-up areas as well as the largest temperature gradientsin calculation domain are located near the steam channelsurface. One can also notice that the temperature on asufficiently large part of front surface of the steam channelnear the laser beam axis is close to the boiling-pointtemperature, that correlates with the channel constructionmethod described in [10].
Particularity of alloy crystallization with a modifyingnanopowder is overcooling taking place in the region ofemergence and growth of crystal phase, that causes non-monotony of the temperature variation along the x coordinate(Fig. 4). Maximal value of overcooling is ~5 K and it depends
on nanoparticles quantity pN in the melt volume unit.
Welding simulation of carbon steel plates was carried outas well. The steel chemical composition: С:0.17-0.24;Mn:0.35-0.65; Si:0.17-0.37; S:0.04; P:0.35; Ni:0.3; Cu:0.3;Cr: 0.25. The welding was performed with CO2 laser with
a b
c d
Fig. 5. Morphology comparison of cross-sections of weld seam obtainedby the laser welding (a), (c) and by the numerical simulation (b), (d) at variouspowers of the laser radiation and the welding rate: (а), (b) W = 5.2 kW, V = 2m/min; (с), (d) W = 2,3 kW, V = 0.6 m/min..
power W = 5.2 kW and 2.3 kW, the welding rate Vw = 2m/min and 0.6 m/min, ZF = 0 mm. Fig. 5 (a) shows photo ofthe weld seam cross-section obtained in an experiment, Fig. 5(b) shows shape of this section obtained from the numericalsimulation. The comparison shows satisfactory agreementbetween the results of calculation and experiment.
VI.ConclusionsA mathematical model of crystallization of a multi-
component alloy modified by active nano-dispersedinoculators is built. It allows of analyzing influence of theinoculators concentration and their size on the structureformation processes. Particularity of heterogeneouscrystallization of alloy with modifying nanop owder isappearance of overcooling in the area of birth and growth ofthe crystal phase. Comparison of the numerical simulation andexperiment data shows satisfactory agreement of the results,that demonstrates a sufficient adequacy of the mathematicalmodel proposed.
AcknowledgmentThe work was supported by the Russian Foundation for BasicResearch, project no. 10-01-00575.
[1]. Dowden J. The Theory of Laser Materials Processing. – Springer Seriesin Materials Science, Vol. 119, 2009.
[2]. Zhao H., White D. R., DebRoy T. Current issues and problems in laserwelding of automotive aluminium alloys // International MaterialsReviews. 1999. V. 44, № 6. P. 238–266.
[3]. Borisov V.T. Theory of two-phase zone of metallic ingots. Moscow:Metallurgiya, 1987 [In Russian].
[4]. Balandin G.F. Theory of ingot formation. Moscow: Mashinostroenie,2002, 212 p. [In Russian].
[5]. A.N. Cherepanov, V.N. Popov, O.P. Solonenko. Three-dimensionalcrystallization of nickel drop containing refractory nanoparticles at itscollision with a plate. J. of Applied Mechanics and Technical Physics,2006, vol. 47, no. 1, p. 29 [In Russian].
[6]. Flemings M. Solidification processes. Moscow: Mir, 1977, 423 p. [InRussian].
[7]. Kutateladze S.S. Basics of heat exchange. Novosibirsk: Nauka, 1979,656 p. [In Russian].
[8]. Oraevsky A.N. Gaussian beams and optical resonators // Papers ofLebedev Physical Institute. Moscow: Nauka, 1988. V. 187. P. 3–59 [In
Copyright © 2012 SciRes. 267

Russian].
[9]. Sudnik V.A., Radai D., Dorofeev V.A. Computer simulation of laserbeam welding. Model and verification // Svarochnoe pr-vo. 1997. No. 1.P. 28–33 [In Russian].
[10]. Cherepanov A.N., Shapeev V.P. Numerical simulation of thin metalplates welding // Vychislitel'nye tekhnologii, 2009, vol. 14, no. 3, p. 96–106 [In Russian].
[11]. Xiangzhong Jin, Lijun Li, Yi Zhang. A heat transfer model for deeppenetration laser welding based on an actual keyhole. Heat and MassTransfer, 46 (2003) 15-22.
[12]. Yanenko N.N. The Method of Fractional Steps. Spriner-Verlag, Berlin-Heidelberg-NewYork, 1971.
[13]. Cherepanov A.N., Shapeev V.P., Fomin V.M., Semin L.G. Numericalsimulation of thermophysical processes at laser beam welding. J. ofApplied Mechanics and Technical Physics. 2006. No. 5. P. 88–96 [InRussian].
268 Copyright © 2012 SciRes.

Activation of quartz grain surface with chloride ions
Bondaletov D.N.,Commercial Director
Fedorova V.A.Development Consultant
OJSC “Gusevsky glassworks named after F.E. Dzerzhinsky»
Alteration of technological and optical states of glass activated with chloride ions, entered to the surface ofquartz sand and quartz grain by way of sodium chloride was investigated in the article. Concentrationoptimum of activating agent was determined.Keywords activating agent of surface, flor ion, quartz sand, grain, optical transmission
The present paper is concerned with certainmethods of improving optical properties ofspecial-purpose glasses: soda- lime glasses usedfor making solar batteries and very-high-purityquartz glasses. The raw materials used for makingphotovoltaic glass are known for strictrequirements to be made on their iron content(0.012%). Quartz glass, by virtue of its structureand when containing impurities and admixtures, isfurthermore capable of undergoing someconsiderable changes in its properties andpossibly structure.[1,2]
As the assessment criterion the variation of ironcontent, as well as of the optical transmission ofthe glass, which had been molten using sand andquartz grains activated with chloride ions, hasbeen taken. The research works carried outfeatured the introduction of chloride ions directlyonto the quartz raw material at the batchpreparation stage. A 0.1 mass % NaCl solutionhas been used for this purpose.The objectives pursued by introducing chlorideions by way of a solution are as follows:-to obtain an uniform per-quartz-grain distributionof the active admixture.- to remove the iron impurities during the processof melting a multicomponent glass or quartz.Soda- lime glassSand chlorination has been carried out at the
stage of the batch preparation in using the rawmaterial with a 0,015% iron content.
A 0.1% NaCl water solution has been preparedpreliminarily. Sand has been further poured withthe NaCl water solution at 4% batch moisture
content and stirred thoroughly. The sand has beendried at 40°C and 120°С. Quartz grains having aporous and crumbling surface get coated with auniform chloride-ion containing layer.The theoretical chemical interreactions to takeplace at the quartz grain surface are as follows:
Fe2O3 + 3NaCl + 3H2O FeCl3↑+3Na (OH) + Fe (OH)3 , (1)
NaOH + SiO2 Na2SiO3, (2)
Electron microscopic studies of the activatedquartz grain surface and the resulting coatinglayer content by scanning electron microscopymethod and using an electron probe X-rayspectroscopic microanalyzer have been carried out.Microphotographs of the sample surface havebeen 0made at various magnifications. In Fig. 1amicrophotograph of the sand grains is shownwithout chloride ions applied.
Fig. 1 Microphotograph of quartz grains
In that microphotograph the crystal-form grainsare visible having clearly defined borders andcracks.
Advances in Materials Physics and Chemistry Supplement:2012 world Congress on Engineering and Technology
Copyright © 2012 SciRes. 269

Fig. 2 Microphotographs of quartz grains activated with 0.1% NaClа – material dried at 40˚С; b – material dried at 120˚С
A qualitative elemental analysis has shown thequartz grains without NaCl treatment to berepresented by the following principal elementalcomposition: Si, O, C, Al, Fe (s. Fig. 3а). Thequalitative elemental composition has changedafter the chloride-ion treatment due to appearanceof Cl and Na on the grain surface (s. Fig 3b).
Fig. 3а
Fig. 3b
Fig. 3 Qualitative elemental composition of quartz sandgrain surface
а – surface without chloride ion activation ; б - surfaceactivated with chloride ions
Glasses have been molten at 1450°C using thebatch without chlorine and with 0.1; 0.2; 0.5%NaCl admixtures.In all obtained glasses the ferric oxide residualhas been determined and the integral opticaltransmission has been measured in the rangebetween 300 nm and 2500 nm for the purpose ofdetermining the sunlight transmission.The total ferric oxide percentage in the initialglass has been determined at 0.0148% and it hasdecreased by 18% down to 0.0122% for the glassthat has been activated with 0.1% NaCl. Onfurther increasing the introduction of the activator,the process of the ferric oxide content decreasehas decelerated and its percentage has beendetermined at 0.0120% and 0.0117% when havingintroduced 0.2% and 0,5% of chloride ions,correspondingly.
Fig. 4 Ferric oxide – vs- activator admixturepercentage curve.
270 Copyright © 2012 SciRes.

A reduction in the content of iron impurities dueto formation and volatilization of FeCl3 accordingto the above- stated reaction has thus beenobserved in all the glasses under study. The ironimpurities partly remain in glass what isapparently attributed to time and temperaturefactors.Optical transmission of glasses, which has beenmeasured in the range between 300 nm and2500 nm, has shown that a 0.1% chloride ionadmixture results in an effective increase of theoptical transmission of glass from 89% up to91.8% and in case the admixture percentage isincreased up to 0.5% the optical transmission ofthe glass remains practically constant (s. Fig. 5).
Fig. 5 Optical transmission of glass –vs - activator percentage curve
An optimal activator concentration has thus beendetermined to be equal to 0.1% of chloride ionsfor the low initial iron content glasses.
Quartz glass
Quartz grains have been doped using 0.1% and0.5% NaCl solution concentrations by introducingthe salt solution onto the quartz grain surfacefollowed by solution drying at 350°C. Quartzgrains have been further molten in anoxyhydrogen furnace. The doped quartz grainshave been observed to be low-melting rawmaterial with a resulting increase of the meltingspeed from 1.3 kg/h up to 1.5 kg/h at 2000°C. Itshould be noted that while melting 0.5% NaCldoped quartz grains the formation ofsemitransparent flocks has been observed,
whereas the cooled glass melt has turned whitedramatically and become opaque which is likelyto be due to glass crystallization. Crystallizationis known to take place when glass, being anonstoichiometric product, is doped with somechemical components capable of changing thesystem by shifting it to stoichiometry(crystallization). Such components can be eitherchloride ions or sodium cations. Therefore glasseshave been under study doped with other chlorideion concentrations and various cationiccomponents.In activating the quartz grain surface with 0.1%NaCl the glass melt has remained transparent bothduring its melting and after cooling. The masspercentage of iron impurities and sodium has beendetermined in the initial and doped glass that havechanged in the ratios as shown in the table below.
Glassdescription
Content ofadmixtures/impurities · 10-4 ,
mass %Na Fe
Initial glass 9.87 2.7Glass
activated with0.1% NaCl
12.07 0.6
Glassactivated with
0.5% NaCl17.2 1.7
As evident from the table, chloride ion doping ofquartz grains enhances the initial material purityin decreasing the iron content by a factor of1.5- 4. Increased percentage of sodiumadmixtures has contributed to a favorable glassmelt viscosity change and a resulting meltingspeed increase from 1.3kg/h up to 1.5kg/h.Optical transmission values of the glasses understudy in UV and visible part of spectrum havebeen determined. Increased optical transmissionof the quartz glass activated with chloride ions isobserved, especially in UV part of spectrum(s. Fig. 6.).
Copyright © 2012 SciRes. 271
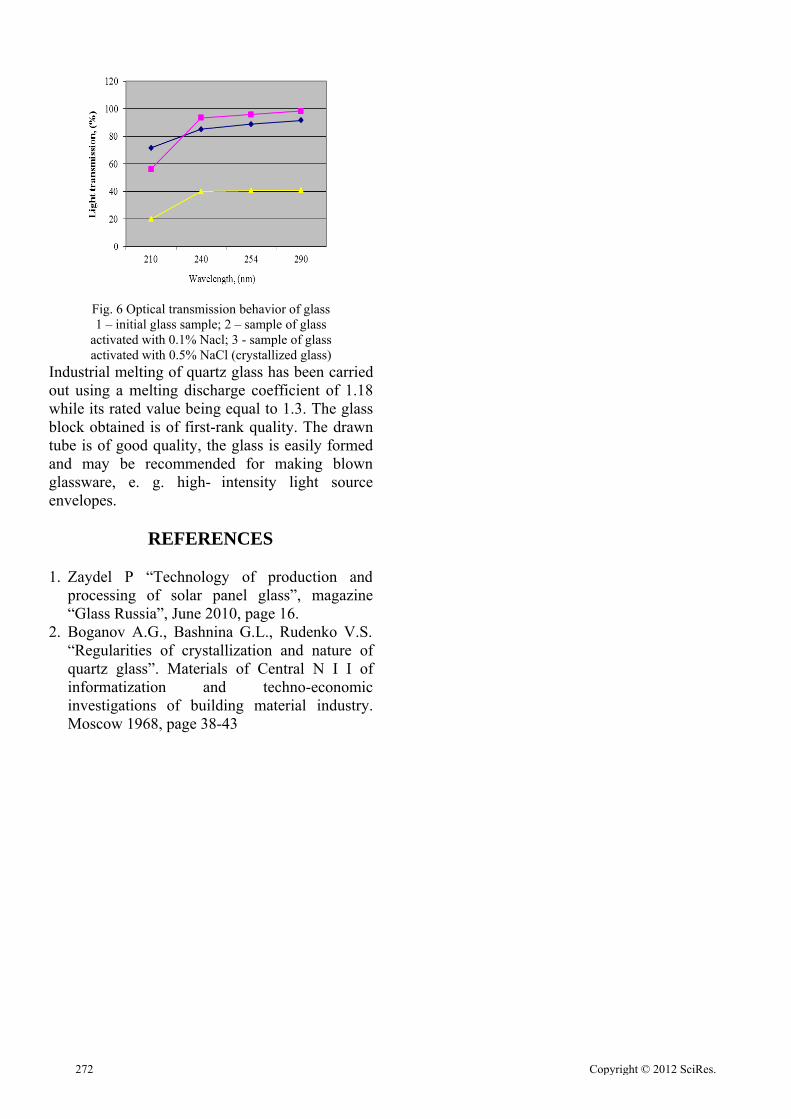
Fig. 6 Optical transmission behavior of glass1 – initial glass sample; 2 – sample of glass
activated with 0.1% Nacl; 3 - sample of glassactivated with 0.5% NaCl (crystallized glass)
Industrial melting of quartz glass has been carriedout using a melting discharge coefficient of 1.18while its rated value being equal to 1.3. The glassblock obtained is of first-rank quality. The drawntube is of good quality, the glass is easily formedand may be recommended for making blownglassware, e. g. high- intensity light sourceenvelopes.
REFERENCES
1. Zaydel P “Technology of production andprocessing of solar panel glass”, magazine“Glass Russia”, June 2010, page 16.
2. Boganov A.G., Bashnina G.L., Rudenko V.S.“Regularities of crystallization and nature ofquartz glass”. Materials of Central N I I ofinformatization and techno-economicinvestigations of building material industry.Moscow 1968, page 38-43
272 Copyright © 2012 SciRes.