ccm u/pharmacy pilot project
TRANSCRIPT

CCM U/PharmacyPilot Project
Program and Operations Analysis Team:
Project Final Presentation:
Jeff BieskeJessica GuibordAdrienne Niner
April 28, 1999
Industrial and Operations EngineeringUniversity Of Michigan, Ann Arbor
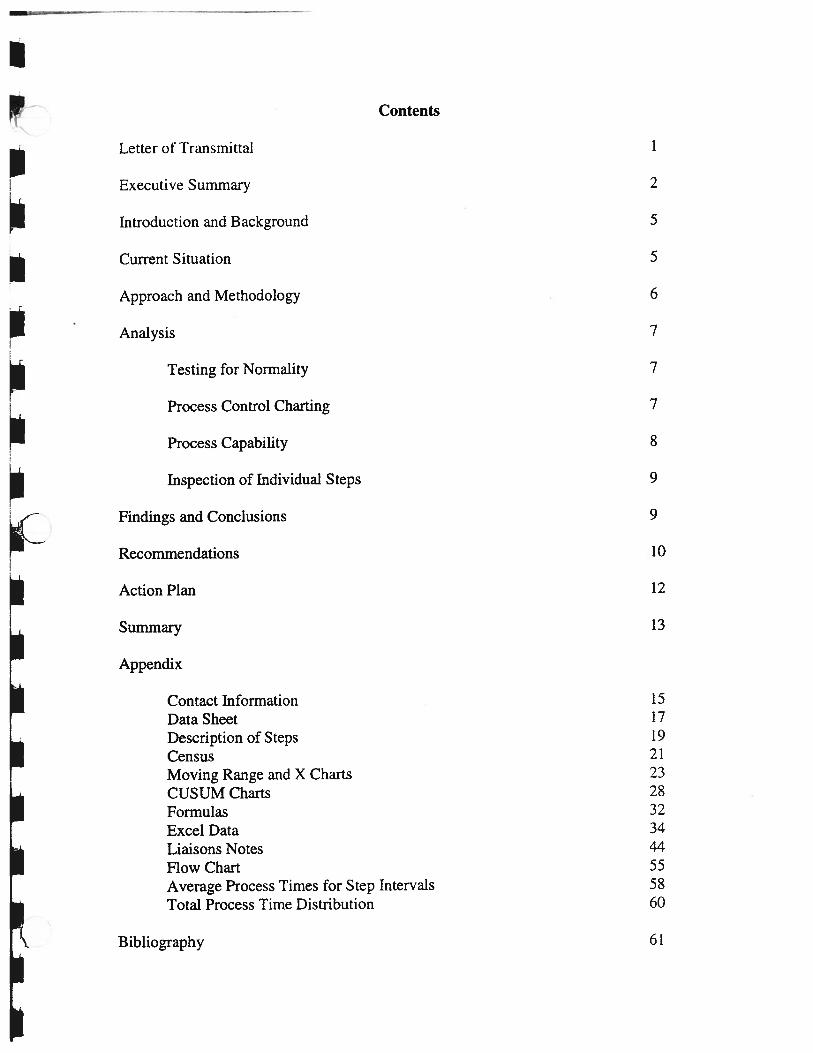
Contents
Letter of Transmittal 1
Executive Summary 2
Introduction and Background 5
Current Situation 5
Approach and Methodology 6
Analysis 7
Testing for Normality 7
Process Control Charting 7
Process Capability 8
Inspection of Individual Steps 9
Findings and Conclusions 9
Recommendations 10
Action Plan 12
Summary 13
Appendix
Contact Information 15Data Sheet 17Description of Steps 19Census 21Moving Range and X Charts 23CUSUM Charts 28Formulas 32Excel Data 34Liaisons Notes 44Flow Chart 55Average Process Times for Step Intervals 58Total Process Time Distribution 60
Bibliography 61
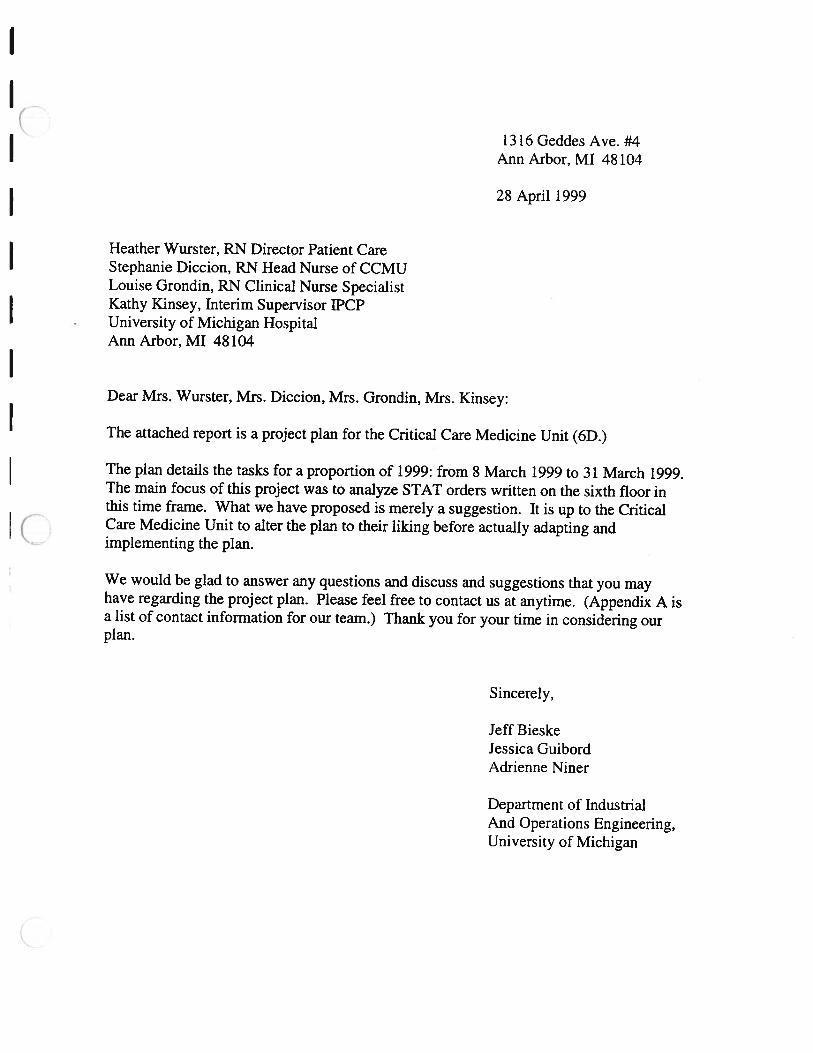
1316 Geddes Ave. #4Ann Arbor, MI 48104
28 April 1999
Heather Wurster, RN Director Patient CareStephanie Diccion, RN Head Nurse of CCMULouise Grondin, RN Clinical Nurse SpecialistKathy Kinsey, Interim Supervisor IPCPUniversity of Michigan HospitalAnn Arbor, MI 48104
Dear Mrs. Wurster, Mrs. Diccion, Mrs. Grondin, Mrs. Kinsey:
The attached report is a project pian for the Critical Care Medicine Unit (6D.)
The plan details the tasks for a proportion of 1999: from 8 March 1999 to 31 March 1999.The main focus of this project was to analyze STAT orders written on the sixth floor inthis time frame. What we have proposed is merely a suggestion. It is up to the CriticalCare Medicine Unit to alter the plan to their liking before actually adapting andimplementing the plan.
We would be glad to answer any questions and discuss and suggestions that you mayhave regarding the project plan. Please feel free to contact us at anytime. (Appendix A isa list of contact information for our team.) Thank you for your time in considering ourplan.
Sincerely,
Jeff BieskeJessica GuibordAdrienne Niner
Department of IndustrialAnd Operations Engineering,University of Michigan
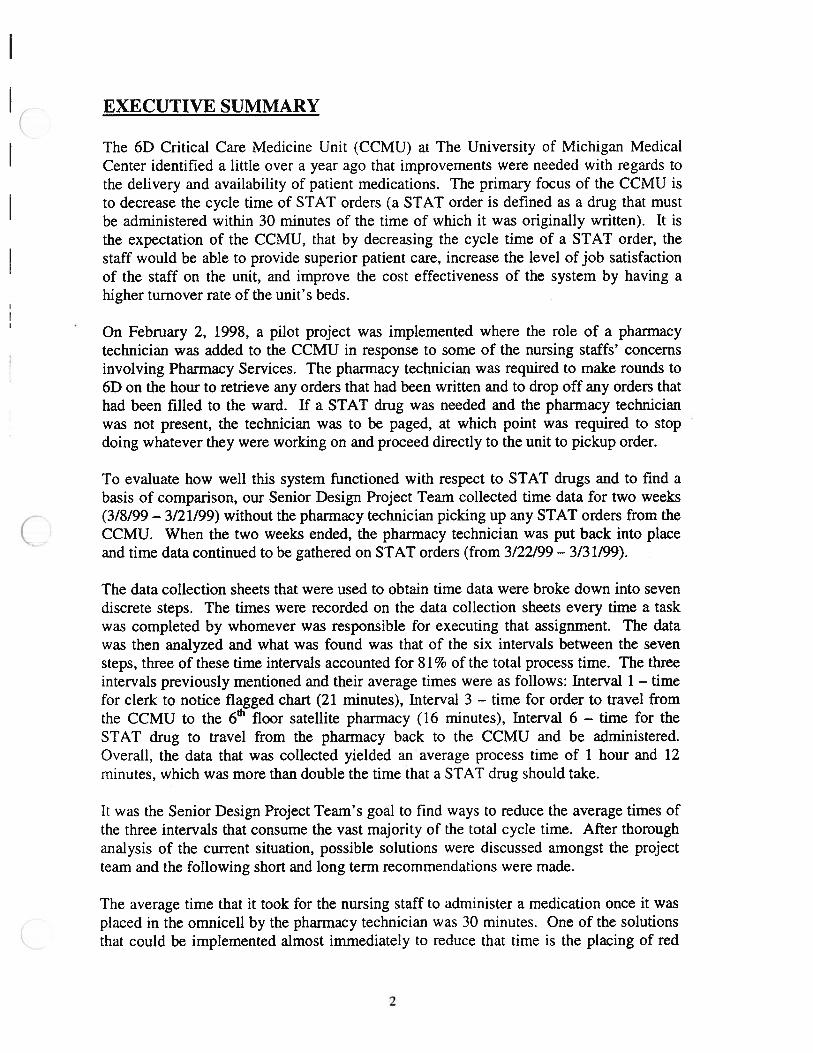
EXECUTIVE SUMMARY
The 6D Critical Care Medicine Unit (CCMU) at The University of Michigan MedicalCenter identified a little over a year ago that improvements were needed with regards tothe delivery and availability of patient medications. The primary focus of the CCMU isto decrease the cycle time of STAT orders (a STAT order is defined as a drug that mustbe administered within 30 minutes of the time of which it was originally written). It isthe expectation of the CCMU, that by decreasing the cycle time of a STAT order, thestaff would be able to provide superior patient care, increase the level of job satisfactionof the staff on the unit, and improve the cost effectiveness of the system by having ahigher turnover rate of the unit’s beds.
On February 2, 1998, a pilot project was implemented where the role of a pharmacytechnician was added to the CCMU in response to some of the nursing staffs’ concernsinvolving Pharmacy Services. The pharmacy technician was required to make rounds to6D on the hour to retrieve any orders that had been written and to drop off any orders thathad been filled to the ward. If a STAT drug was needed and the pharmacy technicianwas not present, the technician was to be paged, at which point was required to stopdoing whatever they were working on and proceed directly to the unit to pickup order.
To evaluate how well this system functioned with respect to STAT drugs and to find abasis of comparison, our Senior Design Project Team collected time data for two weeks(3/8/99 — 3/21/99) without the pharmacy technician picking up any STAT orders from theCCMU. When the two weeks ended, the pharmacy technician was put back into placeand time data continued to be gathered on STAT orders (from 3/22/99 — 3/31/99).
The data collection sheets that were used to obtain time data were broke down into sevendiscrete steps. The times were recorded on the data collection sheets every time a taskwas completed by whomever was responsible for executing that assignment. The datawas then analyzed and what was found was that of the six intervals between the sevensteps, three of these time intervals accounted for 81% of the total process time. The threeintervals previously mentioned and their average times were as follows: Interval 1 — timefor clerk to notice flagged chart (21 minutes), Interval 3 — time for order to travel fromthe CCMU to the 6th floor satellite pharmacy (16 minutes), Interval 6 — time for theSTAT drug to travel from the pharmacy back to the CCMU and be administered.Overall, the data that was collected yielded an average process time of 1 hour and 12minutes, which was more than double the time that a STAT drug should take.
It was the Senior Design Project Team’s goal to find ways to reduce the average times ofthe three intervals that consume the vast majority of the total cycle time. After thoroughanalysis of the current situation, possible solutions were discussed amongst the projectteam and the following short and long term recommendations were made.
The average time that it took for the nursing staff to administer a medication once it wasplaced in the omnicell by the pharmacy technician was 30 minutes. One of the solutionsthat could be implemented almost immediately to reduce that time is the placing of red
2
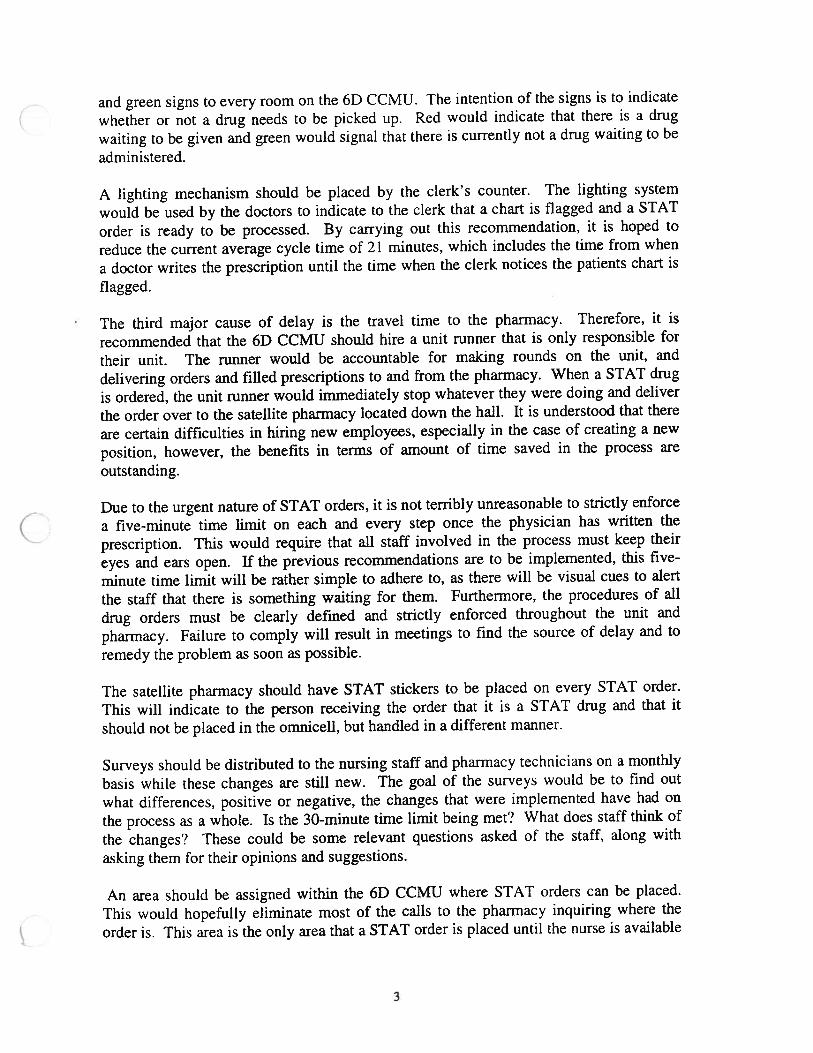
and green signs to every room on the 6D CCMU. The intention of the signs is to indicate
whether or not a drug needs to be picked up. Red would indicate that there is a drug
waiting to be given and green would signal that there is currently not a drug waiting to be
administered.
A lighting mechanism should be placed by the clerk’s counter. The lighting system
would be used by the doctors to indicate to the clerk that a chart is flagged and a STAT
order is ready to be processed. By carrying out this recommendation, it is hoped to
reduce the current average cycle time of 21 minutes, which includes the time from when
a doctor writes the prescription until the time when the clerk notices the patients chart is
flagged.
The third major cause of delay is the travel time to the pharmacy. Therefore, it is
recommended that the 6D CCMU should hire a unit runner that is only responsible for
their unit. The runner would be accountable for making rounds on the unit, and
delivering orders and filled prescriptions to and from the pharmacy. When a STAT drug
is ordered, the unit runner would immediately stop whatever they were doing and deliver
the order over to the satellite pharmacy located down the hall. It is understood that there
are certain difficulties in hiring new employees, especially in the case of creating a new
position, however, the benefits in terms of amount of time saved in the process are
outstanding.
Due to the urgent nature of STAT orders, it is not terribly unreasonable to strictly enforce
a five-minute time limit on each and every step once the physician has written the
prescription. This would require that all staff involved in the process must keep their
eyes and ears open. If the previous recommendations are to be implemented, this five-
minute time limit will be rather simple to adhere to, as there will be visual cues to alert
the staff that there is something waiting for them. Furthermore, the procedures of all
drug orders must be clearly defined and strictly enforced throughout the unit and
pharmacy. Failure to comply will result in meetings to find the source of delay and to
remedy the problem as soon as possible.
The satellite pharmacy should have STAT stickers to be placed on every STAT order.
This will indicate to the person receiving the order that it is a STAT drug and that it
should not be placed in the omnicell, but handled in a different manner.
Surveys should be distributed to the nursing staff and pharmacy technicians on a monthly
basis while these changes are still new. The goal of the surveys would be to find out
what differences, positive or negative, the changes that were implemented have had on
the process as a whole. Is the 30-minute time limit being met? What does staff think of
the changes? These could be some relevant questions asked of the staff, along with
asking them for their opinions and suggestions.
An area should be assigned within the 6D CCMU where STAT orders can be placed.
This would hopefully eliminate most of the calls to the pharmacy inquiring where the
order is. This area is the only area that a STAT order is placed until the nurse is available
3
to pick it up. The reason for recommending the STAT order not be placed in theomnicell is due to the fact that it is difficult to see into the omnicell to see if themedication is in there without actually opening it up. Since there are rules againstleaving prescription drugs unsecured in the unit, it will be necessary to either keep thisarea in a secured location behind the clerk’s desk, much like how IV’s are currentlydelivered and held until the nurse retrieves them.
In addition to the short-term recommendations, a few long-term recommendations werealso made and were provided. The primary recommendation that should be implementedin the future is to install a computer system to both Courtside and Riverside that links theCCMU to the satellite pharmacy. If this suggestion were to be implemented, thephysician would simply enter the necessary drug into the computer. This wouldeliminate travel time, which currently accounts for a considerable portion of time in theprocess. Furthermore, it would also eliminate the importance of the clerk to notice that achart has been flagged, which again accounted for a substantial portion of the total cycletime from the time data measured.
In addition, more incentives should be provided to all employees in an attempt to increasejob satisfaction, which in turn will ultimately contribute to a higher level of jobperformance which translates into a lower cycle time for the administration of STATdrugs. The focus should be looked into, increasing the base pay for pharmacy techniciansfrom the current rate of $9.52 per hour. It was the project team’s understanding that thereexists a high turnover rate among pharmacy technicians due to the stressful nature of thejob combined with a salary scale that does not adequately compensate for the job-relatedstress.
Finally, training seminars should be developed whereby the CCMU staff and pharmacystaff would be trained to use the new computer system, along with other items of interest,such as methods on how to keep the process time within the 30-minute limit.
4

INTRODUCTION AND BACKGROUND
The purpose of this project is to evaluate the Pilot Program that has been implemented in
the Critical Care Medicine Unit (6D) of the University of Michigan Hospital.
Approximately one year ago, it became evident that improvements were needed in
regards to the delivery and availability of patient medications. Currently, the problem in
the system is that STAT drugs are not meeting the time frame of 30 minutes. A STAT
drug is a medication that needs to be administered to the patient within 30 minutes from
the time the prescription was written by the physician. In most cases the medication will
arrive to the unit later than the expected time limit. One cause of delay for a STAT order
could be from back up within the pharmacy. There is only one pharmacy on the floor
that is responsible for all STAT orders as well as non-STAT orders at certain times of the
day. The pharmacy is responsible for four units on the including the Critical Care
Medicine Unit (CCMU), and after midnight it is responsible for the entire hospital.
In response to this problem, a pilot project was devised where pharmacy technicians
would make rounds on the CCMU on an hourly basis to receive the orders. They would
also meet with clerks and nurses to communicate pharmaceutical needs and efficiently
resolve problems that could arise unexpectedly. As a result, the pharmacy technicians
were instructed to carry pagers with them at all times. These pagers were used for
communication between the unit and the pharmacy in an event that a STAT order arrived.
The pharmacy technician would then go to the unit as soon as possible to pick up the
order. During the trial and testing period, the only method used to fill STAT orders was
through the liaison. The purpose of the liaison was to observe what levels of
improvement the pilot could achieve. If there were noticeable improvements, expansion
throughout the entire hospital was to be implemented.
A problem that arose was that there was not enough lead-time to get a prescription filled
and administered by the required time. Presently, another critical problem that can not be
avoided is that the pharmacy is overloaded.
The objective of this project is to critically evaluate the pilot program initiated in the
CCMU and provide recommendations to improve the system in place. The analysis and
recommendations given will hopefully lead to better patient care, minimize delays in the
response time of a STAT order, and increase the level of satisfaction of the nursing and
pharmacy staff.
CURRENT SITUATION
Presently the CCMU Pilot Project is still in effect with the pharmacy technician making
rounds on an hourly basis. One change was implemented; STAT orders are to be placed
inside a red envelope located at the clerk’s desk. The purpose of the red envelope is to
distinguish a STAT order from a non-STAT prescription order. Prior to this, all
medication orders were placed together in a pile. The pharmacist or technician would
5

then enter the orders into the computer. When a STAT order was discovered in the pile,
the pharmacist or technician would fill the order immediately and send it back to the unit.
There was not an efficient way of identifying a STAT order in the pile from routine
orders, which only served to extend the process time. With the red envelopes in place,
the pharmacist can immediately identify which orders need to be filled without delay and
expedite their delivery.
APPROACH AND METHODOLOGY
Originally, the Program and Operations Analysis Team (P& OA Team) proposed that in
order to analyze the process of getting the necessary medication from the sixth floor
satellite pharmacy to the CCMU, the P & OA would shadow the process and collect the
times themselves. This turned out to be infeasible because of the unpredictability with
which STAT orders occur. Taking this into consideration, it was necessary that the P &
OA Team use a method to collect the data without being present.
The P & OA Team observed the process and separated it into steps where the different
time intervals could be written in (See Appendix B for the data sheet.) The data sheet
would circulate along with the prescriptions and medications. From these break downs
the P & OA Team expected to see which steps took the longest and where the largest
delays in the process occurred. Our data sheets were set up to collect the date, the
patient’s name, and the drug ordered. The data sheets also collected times:
1) Physician wrote the order
2) When the clerk processed the order
3) When and how it was sent to the sixth floor satellite pharmacy
4) When the prescription was entered into the computer
5) When the pharmacist checked that the prescription was filled correctly
6) When and how it was sent back to the CCMU
7) When it was administered to the patient (See Appendix C for descriptions)
These data collection sheets were used from March 8, 1999 to March 31, 1999.
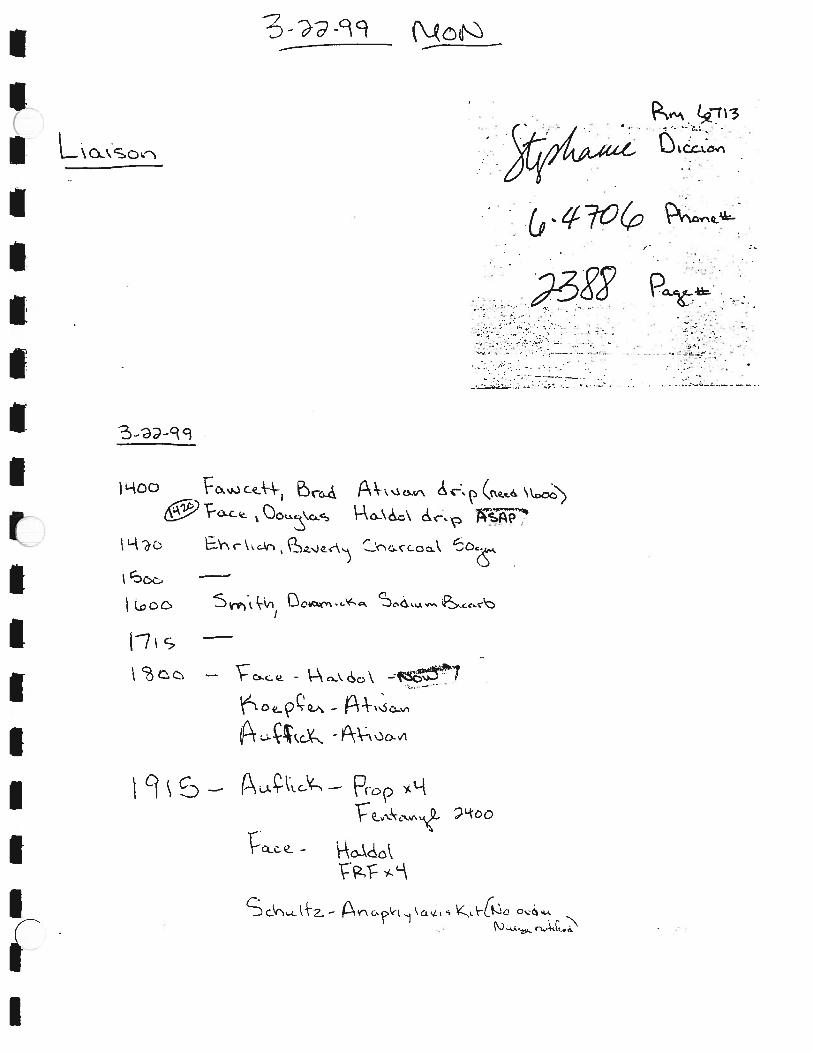
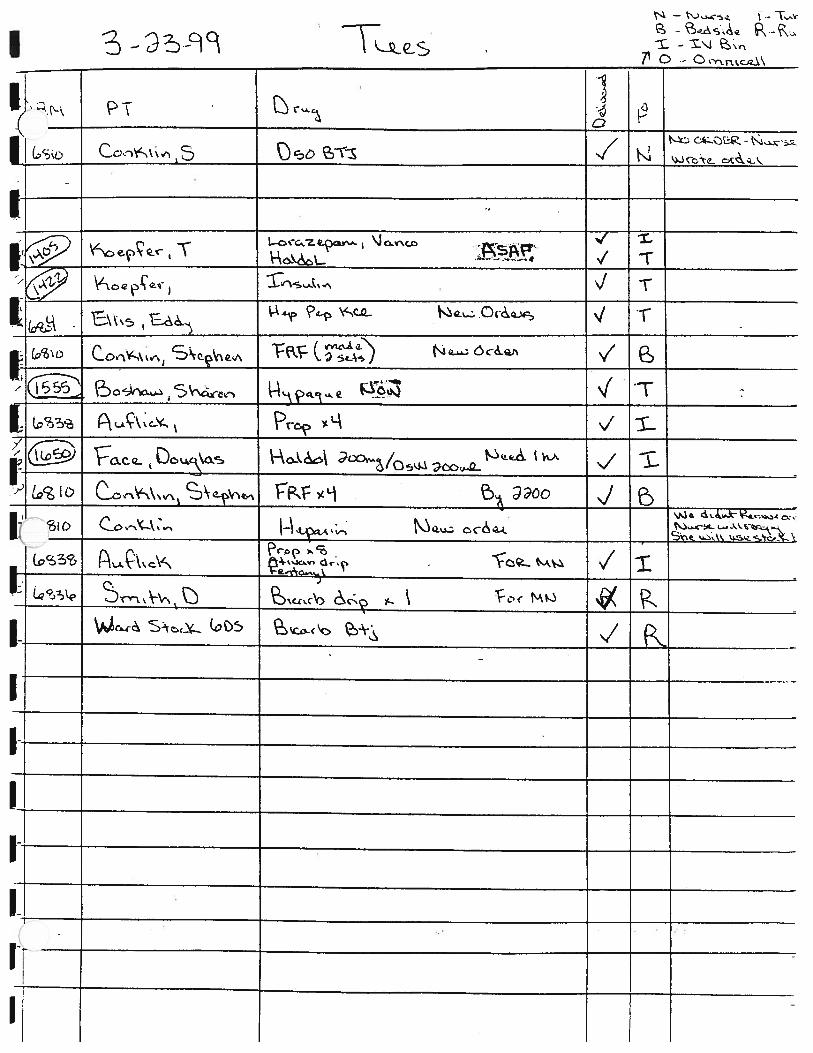
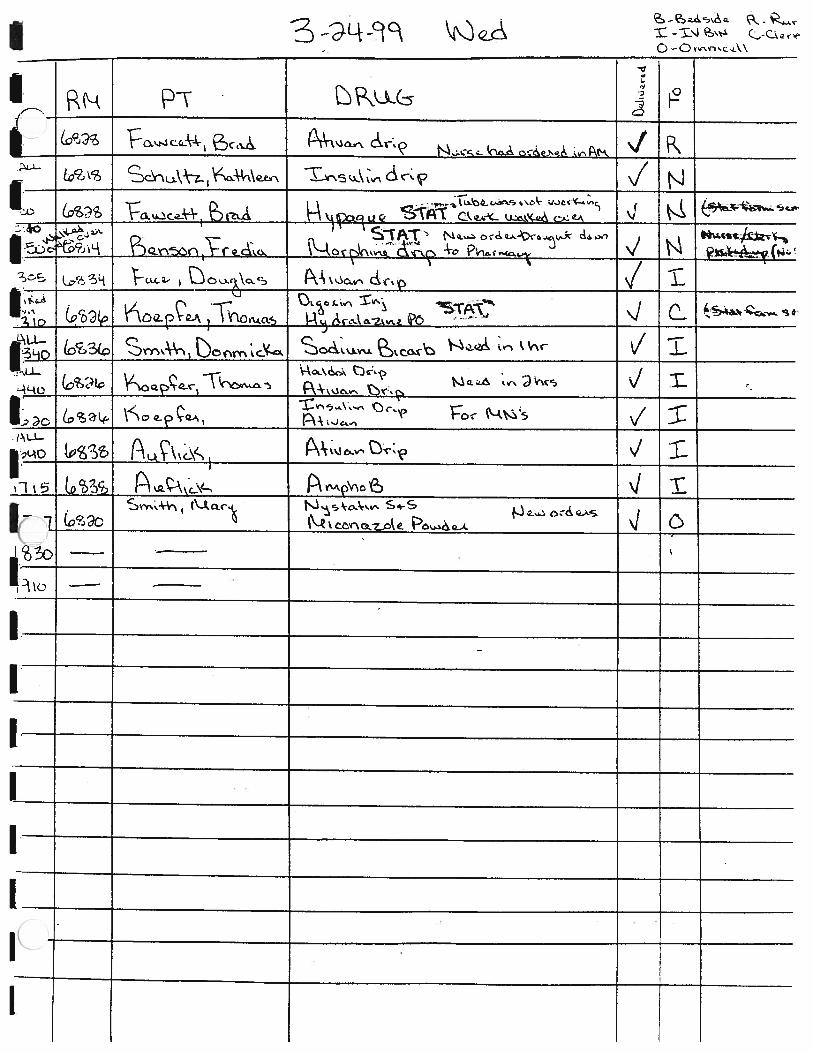
This liaison was a pharmacy technician who would circulate between the 6th floor
satellite pharmacy to the CCMU. The liaison would make stops at both the river side and
court side of the CCMU, communicate with the people present in the unit, and check a
logbook located on each side of the unit to get any information necessary from the people
they did not make verbal contact with. The liaison made rounds every hour on the hour
when possible. The liaison carried a pager to be contacted when they are not in the
CCMU unit. Once an order was encountered by the liaison, they finished their rounds,
returned to the pharmacy, entered the order into the computer, filled the order, had it
checked by the pharmacist, and delivered the order back to the unit.
6

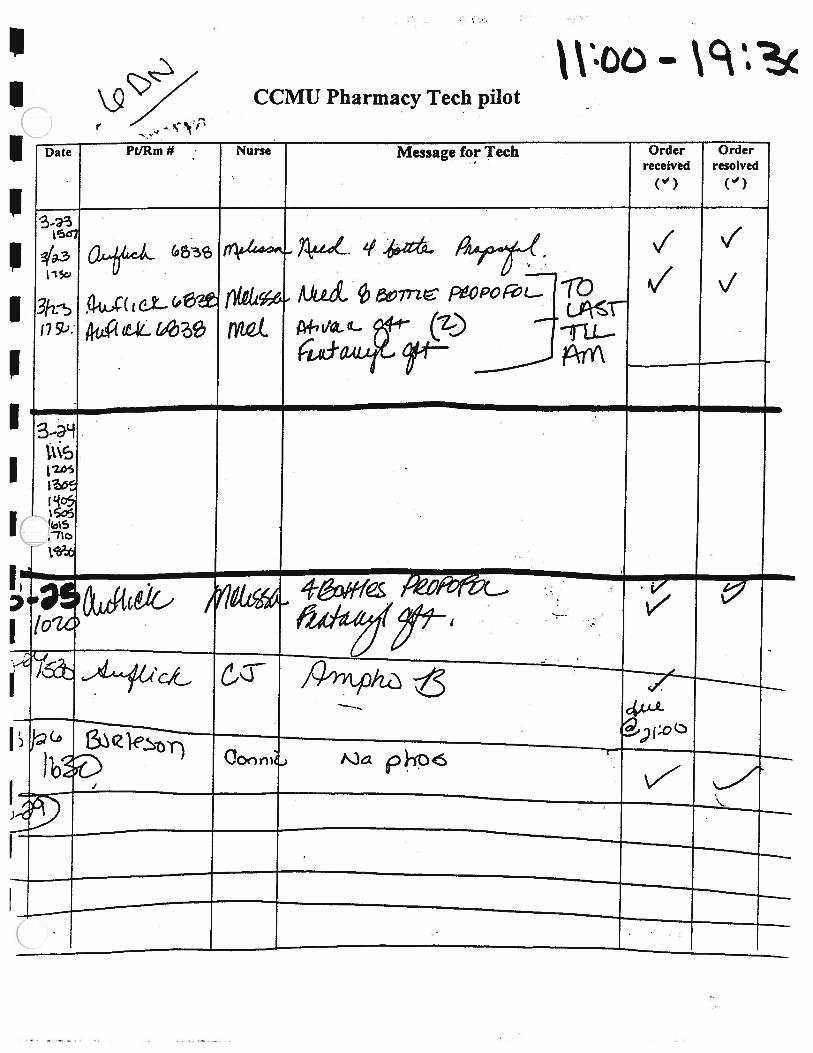
The P & OA Team’s goal was to collect at least 25 samples before the liaison started andat least 25 samples from when the liaison was running. The data collection sheets werepicked up every three days until it was noticed that some of the administered times weremissing. It was decided to pick them up everyday in order to look up the administeredtimes on the MAR (Medication Administration Record) and communicate with any staffmember, as necessary. The P & OA Team were able to collect 38 complete data sheetswithout the liaison but were only able to collect 3 with the liaison. When data wascollected with the liaison, a census was conducted (See Appendix D). The censusrevealed that the admissions to the CCMU was lower between March 22 — 31 then March8 - 21. Furthermore, the unit shut down the entire Courtside ward. After talking to thehead nurse, Stephanie Diccion, it was confirmed that the low admissions does not occurvery often, but rather roughly once a year. This is one reason why there was not enoughdata to analyze the process with the liaison. With that in mind, the group was unable tolook further into the process and give any strong recommendations backed up by data forthat procedure.
ANALYSIS
Testingfor Normality
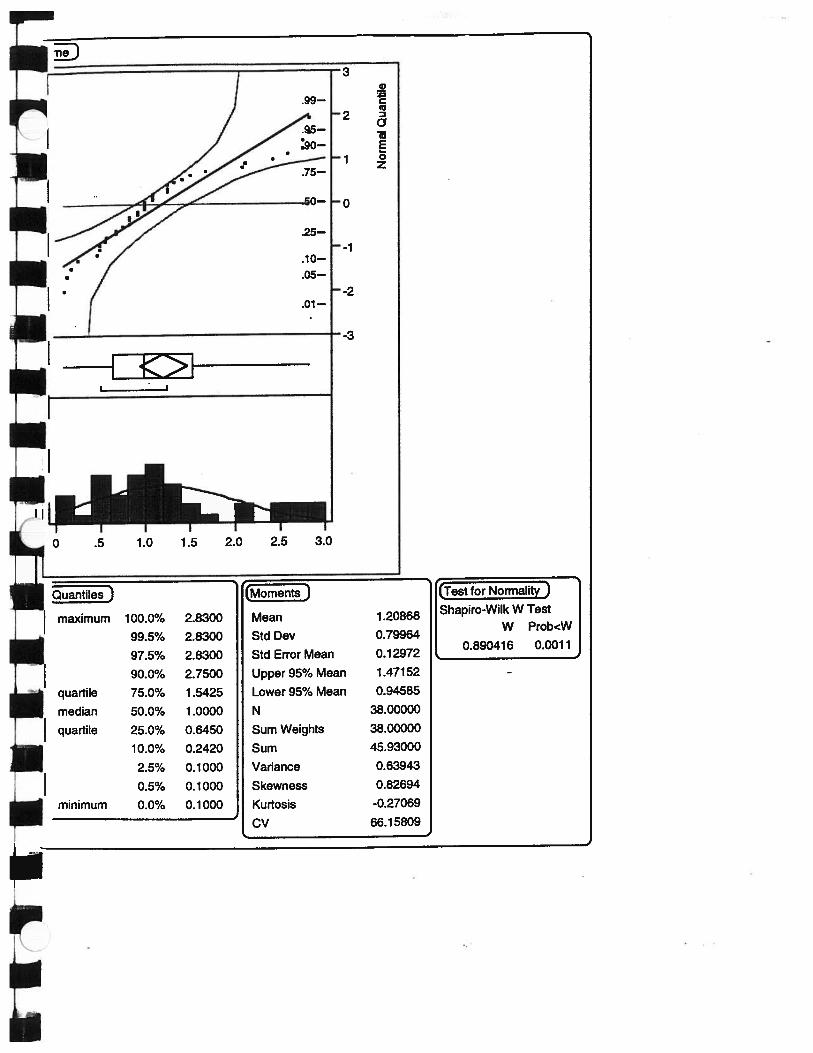
Before it could be analyzed whether the process was in control, it was first necessary todetermine whether the data was normally disthbuted. The two key factors in determiningwhether a distribution is normal are the skew and kurtosis of the collected data. A 95%confidence interval was created for both the skew and kurtosis based on the number ofobservations collected, If the value for the skew fell within ± 0.587 and the value forkurtosis fell within —0.93 kurtosis 1.06, it could be concluded with 95% confidencethat the data was normally distributed. The skew of the data was 0.82694 and thekurtosis was —0.27069. Since the value for skew fell just outside of the range, and bothvalues must fall within their respective ranges, it was initially infeasible to conclude thatthe data was normally distributed.
However, several experts in the field of statistical quality control have investigated theeffect on departures from normality. Burr (1967) notes that “the usual normal theorycontrol limit constants are very robust to the normality assumption and can be employedunless the data is extremely non-normal.” Schilling and Nelson (1976) have also studiedthe effects of non-normality on the control limits of control charts. Their studies concurwith those of Burr. It is also important to understand that we had collected only 38observations. Usually, at least 100 to 200 observations are necessary to accuratelydetermine whether the population is normally distributed. Since the value for kurtosis didfall within the specified range, and the amount that the skew fell outside of its range wasnegligible, it can be assumed that the data was normally distributed.
Proce.rs Control C’harting
7

In monitoring the process of the cycle time of a STAT order, it was important to detectboth large and small shifts in location and variation. Shewhart charts are the mosteffective in detecting large shifts, but do not signal smaller shifts. Cumulative-sum chartsare designed to detect small shifts in both location and variation, but are not very
effective in detecting large shifts. Since it was desired to be able to detect both types ofshifts in our analysis of the CCMU’s cycle time of STAT orders, both the Shewhart
moving-range control charts and the standardized cumulative-sum control charts were
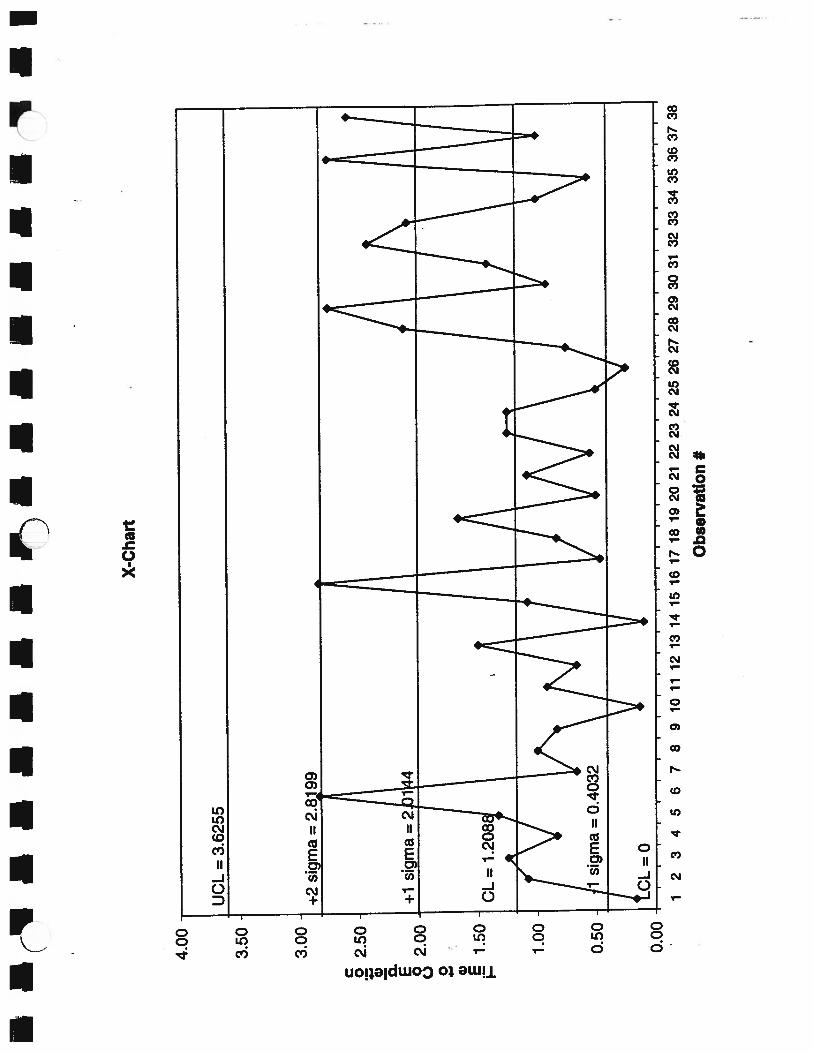
performed (see Appendices E & F). It was chosen to use the moving range charts instead
of the more traditional x-bar and r charts because the data collected was individual
observations, therefore, x-bar and r charts were not applicable to the data. Instead, it was
required to use control charts that were sensitive to the fact that samples of only size onewere collected.
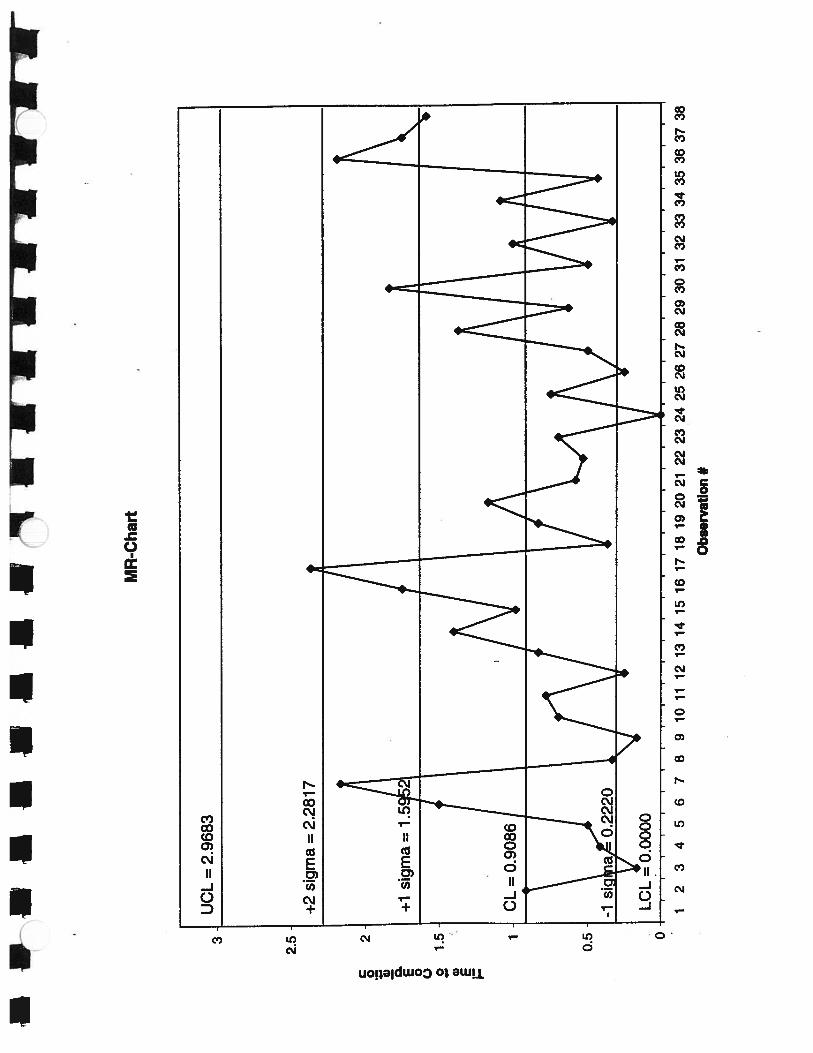
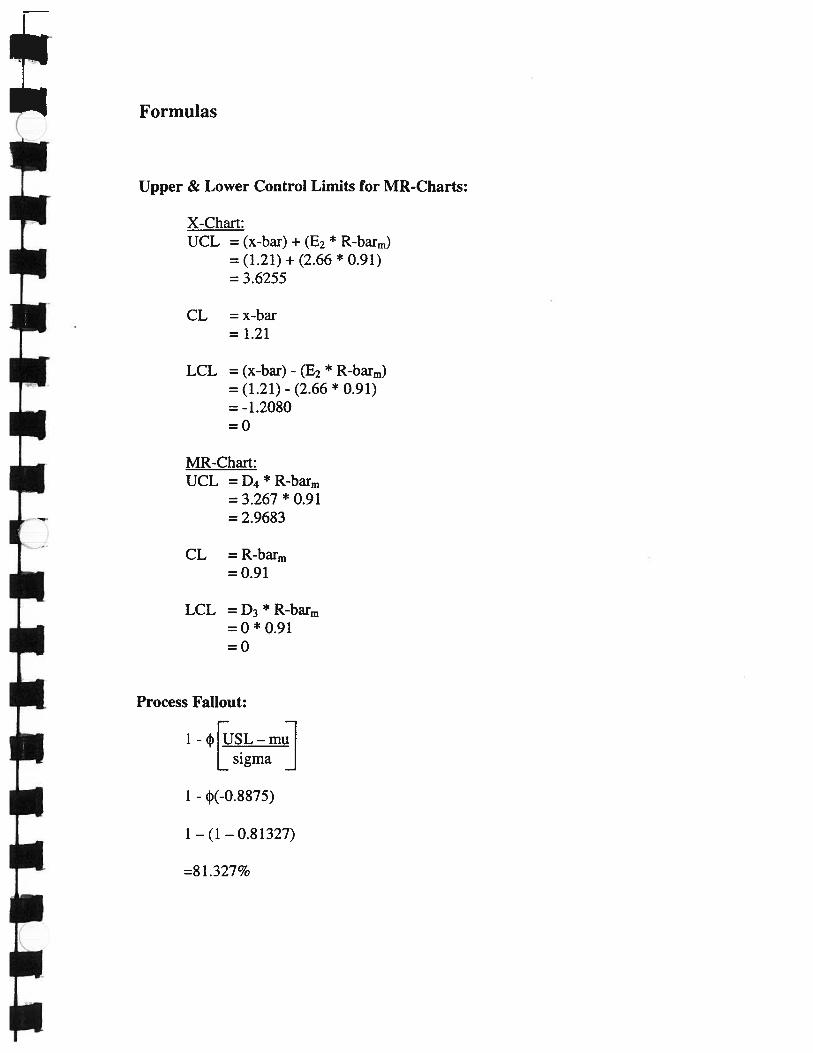
To create the MR-charts, a table of the observations was first constructed and the values
for the moving range were calculated. From this table the upper and lower control limits
were determined, which are approximately ±3 standard deviations from the calculated
average values. (See appendix G for equations) These are the standard limits used,because 99.7% of the population data would fall within these limits. If a point were tofall outside of these limits, there are two possibilities to consider. The first is that theprocess is out of control and the point came from a shifted distribution. The other
possibility is that the process is in control and the point is just rare. The two controlcharts that are created from these calculations are the x-chart and the MR-chart. The xchart assesses the process stability in location, while the MR-chart assesses the processstability in variation. Both of these charts were inspected and signals were looked forthat would indicate that the process is out of control, such as points beyond control limits,runs, and where the points are located relative to where it would be expected to see anormally distributed process. No signals were found that would represent that theprocess was unstable, so it was concluded that there were not any large shifts in process
location or variation. (See appendix E)
In constructing the CUSUM charts, values had to be chosen to use for the parameter hand parameter k. Values were selected that would give an average run length of 370observations. This means that on average, one would expect to see a point outside of thecontrol limits of a process that is in control once in approximately every 370
observations. The value for h is similar to the upper and lower control limits on any
control chart. Unless a CUSUM falls outside the ±h range, it can be assumed the process
is in control. Next, the positive and negative cumulative sums for both the process
location and the process variation were calculated. These values were plotted and the
charts were inspected for signals that the process had gone out of control. Since nosignals were found that showed the process had become unstable, it was concluded that
the process had not experienced any small shifts in either process location or processvariation. (See appendix F)
It was the intention to be certain the process did not experience any shift in location orvariation, large or small. Since both the Shewhart MR-chart and the standardized
CUSUM-chart were inspected, and all of the control charts indicated that the process had
8

remained in control, it was concluded that the process had remained stable throughout theentire time it was being monitored.
Process Capability
Unfortunately, just because it was confirmed that the process was in control, it did notmean that the process met specifications and is a capable process. Since the average totaltime to complete all stages in the cycle is higher than the upper specification limit of 30minutes, it can be immediately seen that the majority of the time, the cycle time of aSTAT order is above the upper specification limit. In order to make this assumptionmore concrete; the fallout of the process was calculated (See appendix G forcalculations). The fallout was found to be approximately 8 1.327%. This means that over80% of the time, CCMU is not meeting specifications on the cycle time of a STAT order.
Inspection ofIndividual Steps
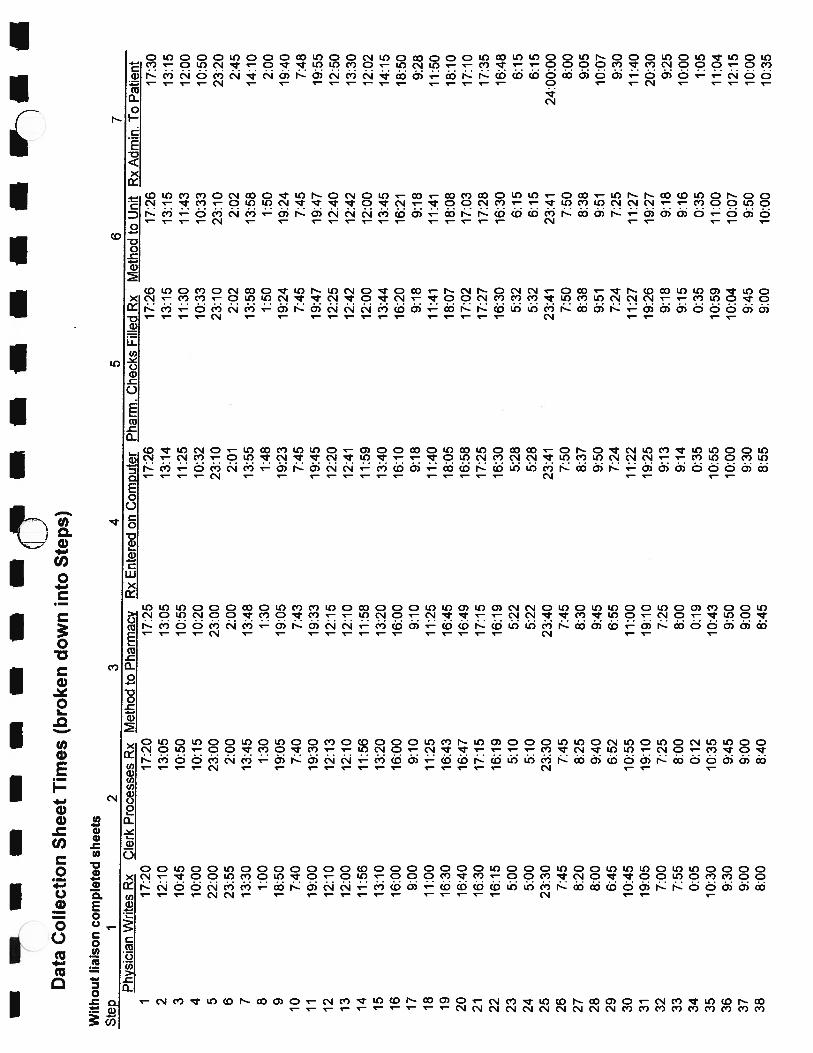
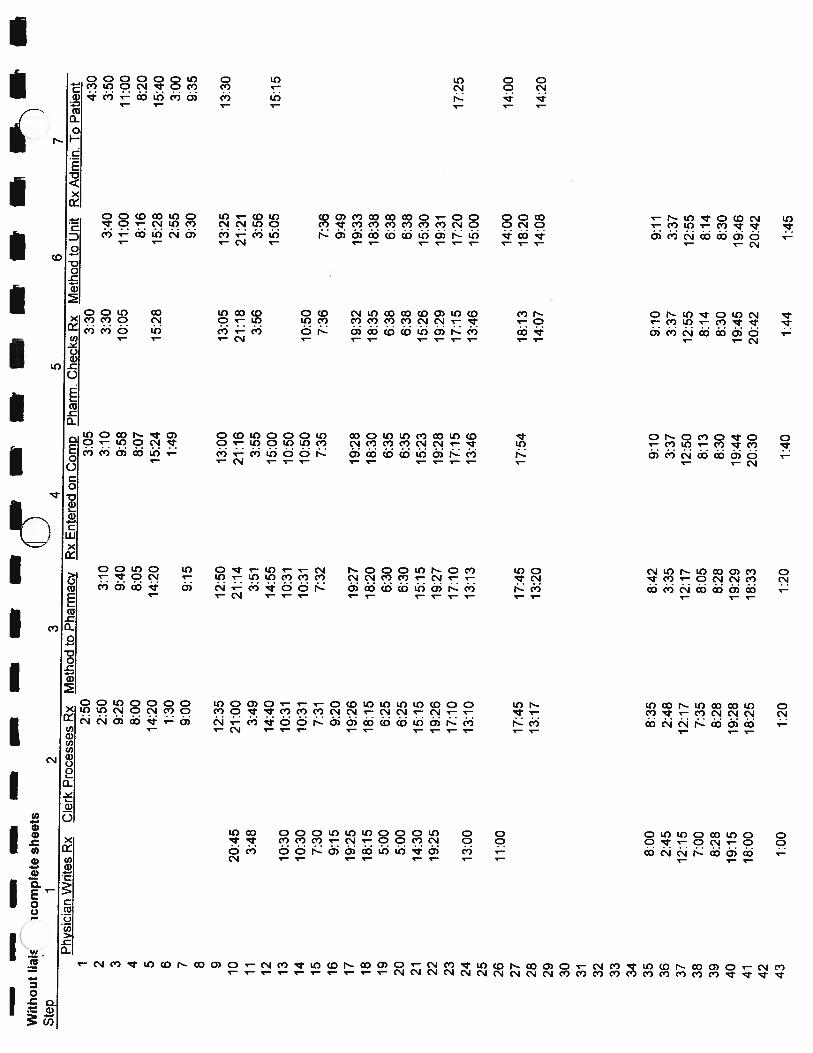
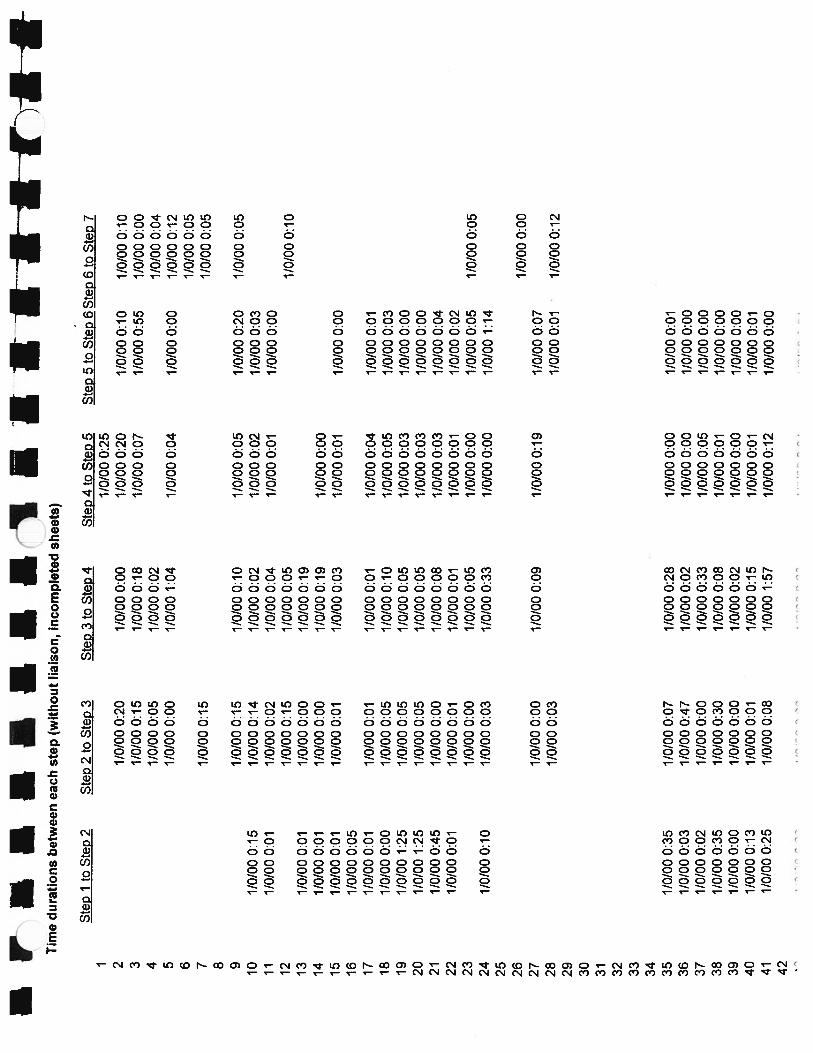
The CCMU had not set target values or specification limits for the individual stepsrequired to complete a STAT order. However, since the total time to complete a STATorder was frequently not meeting specifications, it was important to look at the areas thatmay be causing the problem. The CCMU felt that each step should, on average, takeabout the same amount of time. If the upper specification limit for total time tocompletion is exactly met, then each step should take no more than five minutes. Foreach observation, a breakdown of each step was made to see how much time was spenton each step (See Appendix H). For example, the average time to go from stage one tostage two takes about 21 minutes, which leaves a lot of room for improvement. On theother hand, going from stage four to stage five only requires approximately 4 minutes,which would indicate that the step is completed efficiently.
FINDINGS AND CONCLUSIONS
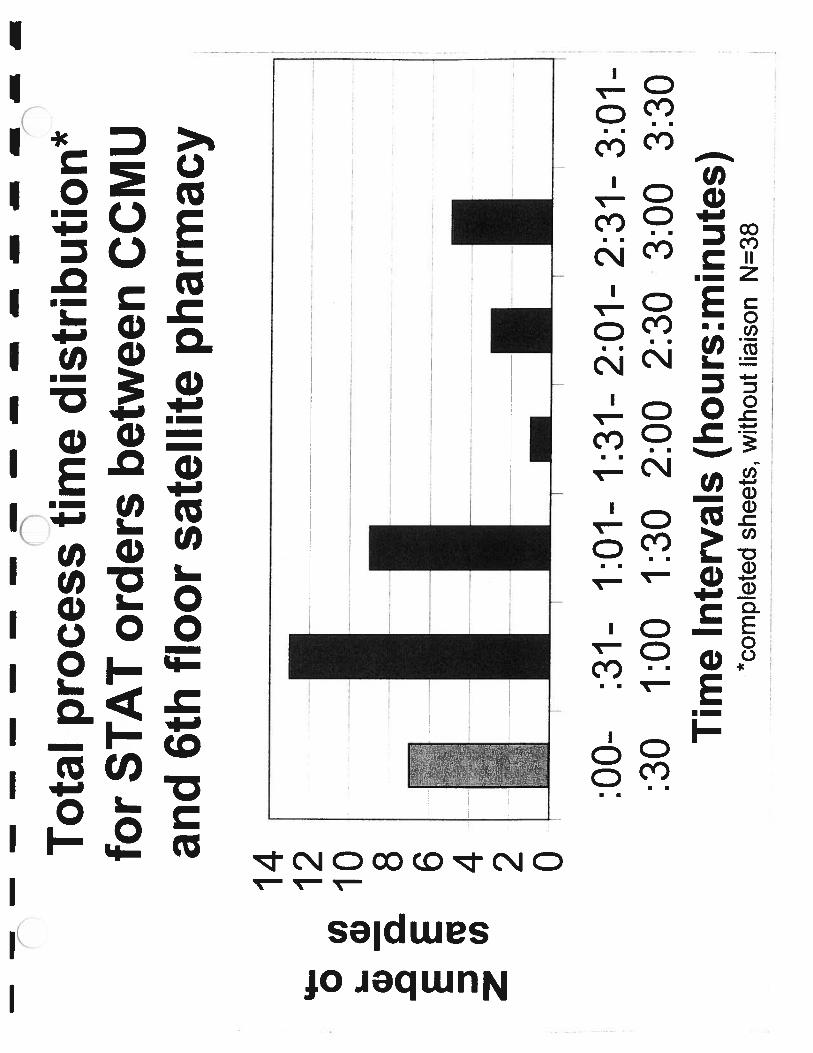
Overall, 38 completed samples were collected on the process times for STAT orders inthe CCMU without the liaison. The average process time of the 38 samples wascalculated to be one hour 12 minutes. The average time of the data collected was morethan double the time allowed (30-minutes) for STAT drugs according to the unit’sdefinition. Furthermore, of the 38 samples, only seven samples (18.4%) actually met the30-minute requirement (See Appendix L). Therefore, the project team broke down thedata collected into step intervals to see where the delays were occurring (See AppendixK). It was found that three of the six intervals accounted for 81% of the average processtime. If any improvements are to be made on the process, these three areas must betargeted.
Unfortunately, only three data points were collected when the liaison was in service fromMarch 22 — March 31. It was suggested by Louise Grondin to consult the census (See
9

Appendix D) of ward admissions on 6D to see if the number of patients in the CCMU
was unusually low. That was in fact the case that the number of patients admitted was
low. Due to this the courtside was shut down in order to conserve resources.
To investigate possible reasons for why there were so few STAT orders, the project team
interviewed pharmacy technician, Pat Starzec, to see if she could provide any insight on
the problem. In the interview, she stated that she only received five STAT orders
between 3/22/99 — 3/31/99, and showed the team the liaison’s notes (See Appendix I).
These notes showed the recording of a STAT order that they picked up. Furthermore, the
liaison made note in the logbook that some members of the nursing staff were bypassing
the liaison altogether and tubing the STAT orders directly to the pharmacy, rather than
paging her. Interesting enough, the P & OA team found that the liaison did not receive
any pages during the trial period. The P & OA team decided to do a trial test on the
paging system to see how long an actual page would take for the pharmacy technician to
receive. The P & OA Team found that it takes 45 seconds to receive the page. This
length of time does not justify why the liaison was not paged. Pat Starzec also mentioned
that the pharmacy receives calls daily in regards to nurses looking for their orders. She
said that there is not an assigned area for STAT orders. Because of not having an
assigned place orders are misplaced and nurses are not able to find them when they need
to be administered.
RECOMMENDATIONS
The Senior Design Project Team concluded to offer the following recommendations for
the Critical Care Medicine Unit for the short term. It was seen from the data that was
collected that one of the steps that heavily prevented STAT drugs from meeting their 30-
minute time limit was the time from when the doctor wrote the prescription to the time
when the clerk processed the order. Therefore, it was believed that by placing a lighting
mechanism at the clerk’s counter to indicate to the clerk that the doctor had written an
order for a STAT drug, the average time between steps I and 2 could be drastically
reduced from the current average time of 18 minutes.
Another area that prevented STAT drugs from meeting their 30-minute time limit was the
time from when the order filled until the time it was finally administered to the patient.
In response to this, red and green signs should be placed on the outside of every room in
the unit to indicate when a prescription has been dropped off. Red meaning that the order
has arrived, green meaning that there is nothing waiting. The person (nurse or clerk) that
receives the order is expected to and responsible for changing the sign to red and placing
the drug in the appropriate place. When the nurse is ready to administer the drug to the
patient they will then change the sign to green.
The third major cause of delay is the travel time to the pharmacy. Therefore, it isrecommended that the CCMU should hire a unit runner that is only responsible for theirunit. The runner would be accountable for making rounds on the unit, and deliveringorders and filled prescriptions to and from the pharmacy. When a STAT drug is ordered,the unit runner would immediately stop whatever they were doing and deliver the orderover to the satellite pharmacy located down the hail. It is understood that there arecertain difficulties in hiring new employees, especially in the case of creating a newposition, however, the benefits in terms of amount of time saved in the process areoutstanding.
Due to the urgent nature of STAT orders, it is not unreasonable to strictly enforce a five-minute time limit on each step once the physician has written the prescription. Thiswould require that all staff involved in the process must keep their eyes and ears open. Ifthe previous recommendations are to be implemented, this five-minute time limit will berather simple to adhere to, as there will be visual cues to alert the staff that there issomething waiting for them. Furthermore, the procedures of all drug orders must beclearly defined and strictly enforced throughout the unit and pharmacy.
The satellite pharmacy should have STAT stickers to be placed on every STAT order.This will indicate to the person receiving the order that it is a STAT drug and that itshould not be placed in the omnicell, but handled in a different manner.
Surveys should be distributed to the nursing staff and pharmacy technicians on a monthlybasis while these changes are still new. The goal of the surveys would be to find outwhat differences, positive or negative, the changes that were implemented have had onthe process as a whole. Is the 30-minute time limit being met? What does staff think ofthe changes? These could be some relevant questions asked of the staff, along withasking them for their opinions and suggestions.
An area should be assigned within the CCMU where STAT orders can be placed whenthe nurse is away or with a patient when the pharmacy technician or unit runner comes tothe ward to deliver the STAT drug. This would hopefully eliminate most of the calls tothe pharmacy inquiring where the order is. This area is the only area that a STAT orderis placed until the nurse is available to pick it up. The reason for recommending theSTAT order not be placed in the omnicell is due to the fact that it is difficult to see intothe omnicell to see if the medication is in there without actually opening it up. Sincethere are rules against leaving prescription drugs unsecured in the unit, it will benecessary to either keep this area in a secured location behind the clerk’s desk, much likehow TV’s are currently delivered and held until the nurse retrieves them.
In addition to the short-term recommendations, a few long-term recommendations werealso made and provided. The primary recommendation that should be implemented inthe future is to install a computer system to both courtside and riverside that links theCCMU to the satellite pharmacy. If this suggestion were to be implemented, thephysician would simply enter the necessary drug into the computer. This wouldeliminate travel time, which currently accounts for a considerable portion of time in the
11

process. Furthermore, it would also eliminate the importance of the clerk to notice that a
chart has been flagged, which again accounted for a substantial portion of the total cycle
time from the time data measured.
In addition, more incentives should be provided to all employees in an attempt to increase
job satisfaction, which in turn will ultimately contribute to a higher level of job
performance which translates into a lower cycle time for the administration of STAT
drugs. The focus should be increasing the base pay for pharmacy technicians from the
current rate of $9.52 per hour. It was the project team’s understanding that there exists a
high turnover rate among pharmacy technicians due to the stressful nature of the job
combined with a salary scale that does not adequately compensate for the job-related
stress.
Finally, training seminars should be developed whereby the CCMU staff and pharmacy
staff would be trained to use the new computer system, along with other items of interest,
such as methods on how to keep the process time within the 30-minute limit when minor
details go wrong.
ACTION PLAN
It is estimated that none of the short-term recommendations should take longer than six
weeks to implement. Actions that can be implemented in the first week include a
uniform five-minute time limit on each step in the process, surveys to all staff for
feedback on implementations, and the assignment of a designated area to place STAT
orders upon arrival. Two weeks should be enough time for STAT stickers to be used by
both pharmacy and the unit, for the red and green signs to be in use, and to define and
enforce the procedures better. The lighting mechanism and a unit runner recommended
time is about six weeks.
The long-term recommendations include raising the base wage of pharmacy technicians,
introducing training seminars on how to adhere to the 30 minute time limit for STAT
orders and how to avoid errors, and providing small incentives for the staff complying
with the official procedure. The long-term recommendations suggested should be
implemented with the goal in mind to have in place within six months from the time that
they were initially undertaken. Finally, the computer system should be implemented
within the target of two years. The two years will be used to research relevant systems
and their competitors, analyze the budget to find where the funds will be allocated from,
and to perform a study that will estimate the time, money, and lives saved through an
overall improvement in the quality of service that would result from the system.
12

SUMMARY
The P & QA Team found that within the Critical Care Medicine Unit, the total averageprocess time for a STAT order was 1 hour 12 minutes. After collecting 38 sampleswithout the liaison, we were able to conclude that the current process was not meetingtheir upper specification time limit of 30 minutes. This was due to a number of things.Inconsistency among the doctors, nurses, clerks, and pharmacy personnel is a primaryreason for the unit not meeting their expectations. Only 18.4% of the samples met the30-minute process time within the unit. In conclusion, changes that will drasticallyreduce some of the average process times must be implemented in order for the CCMU tomeet their STAT expectation. Collecting data at another point in time with the liaison,when admissions is high, would be able to give the unit a more concrete finding withdata.
13

Appendix A

Contact Information:
Jeff Bieskebieskej @ engin.umich.edu734-665-3835
Jessica [email protected]
Adrienne Nineraniner@ engin.umich.edu734-662-1018

—=
——
——
——
——
——
——
——
—
—.
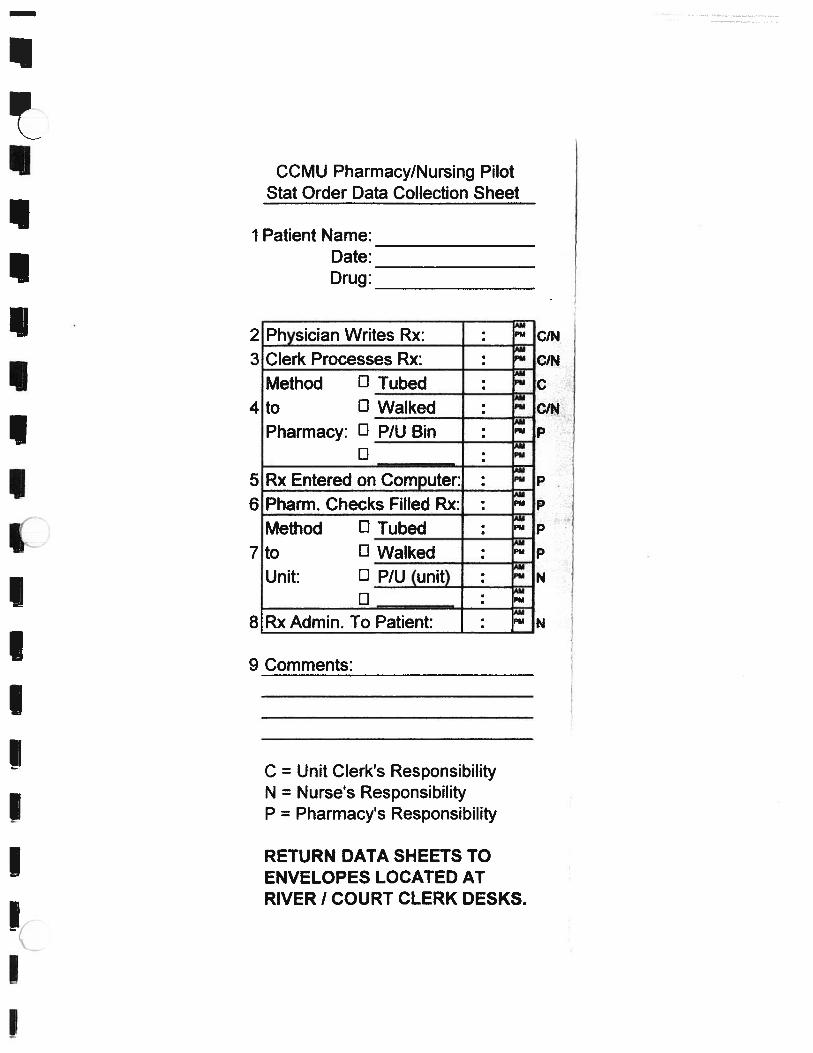
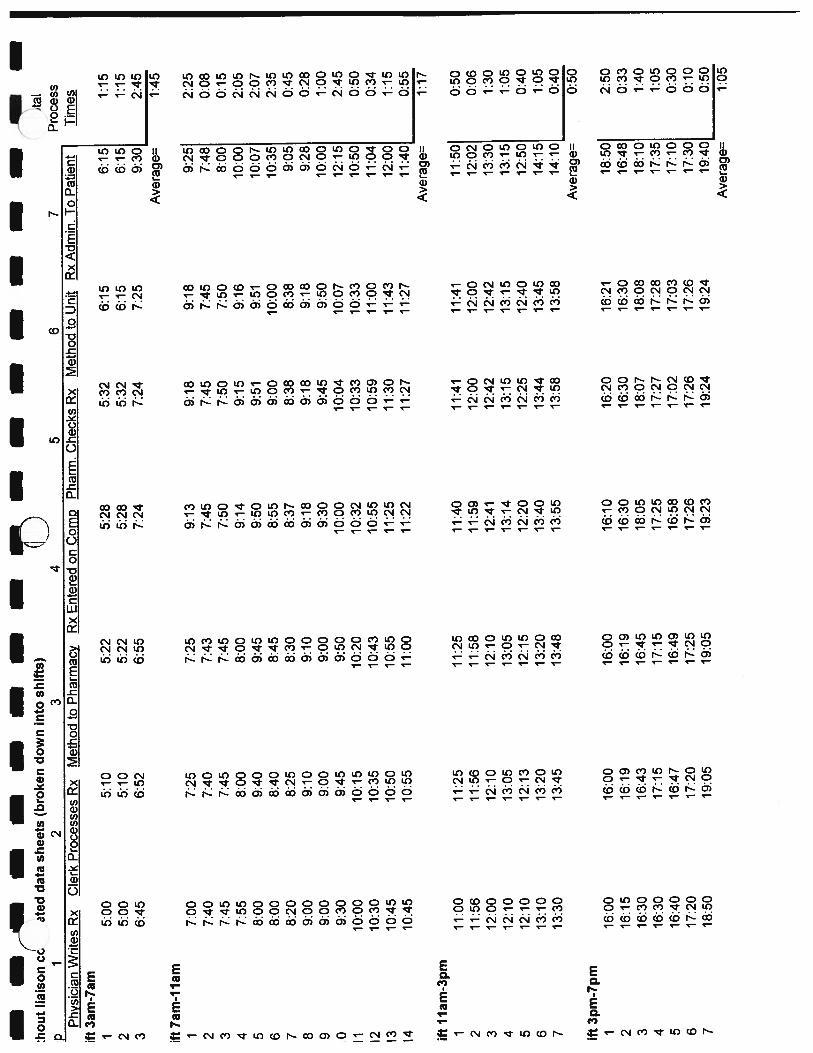
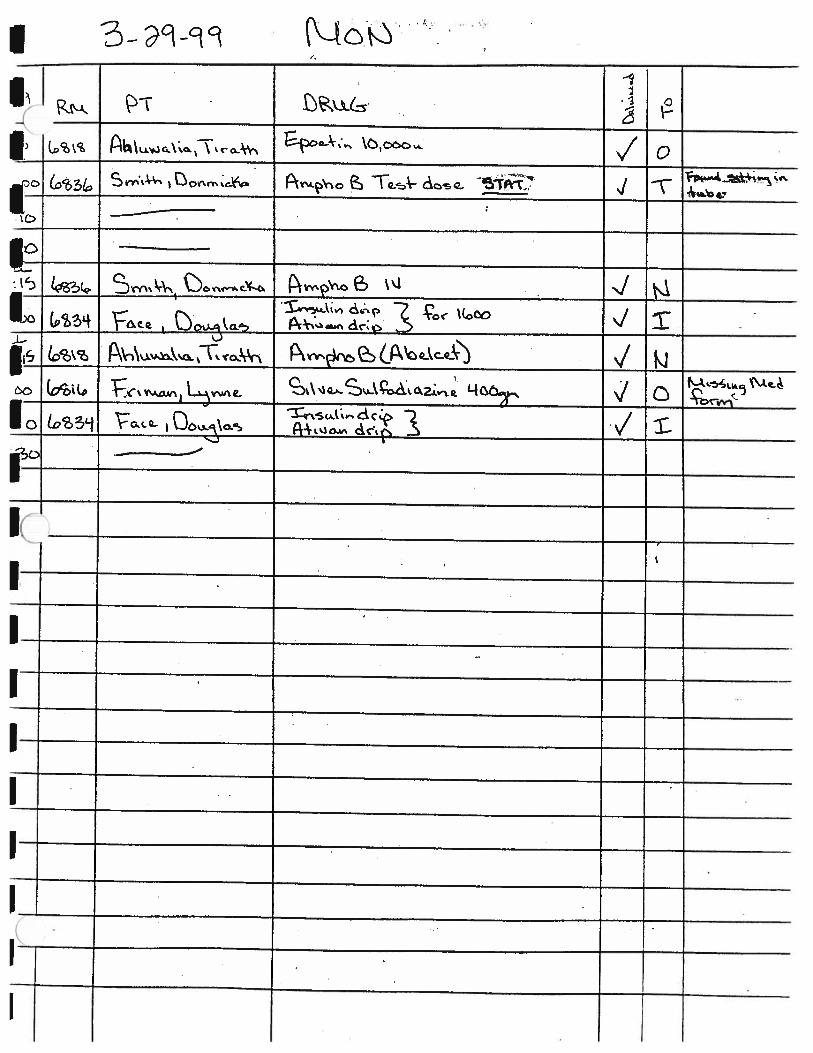
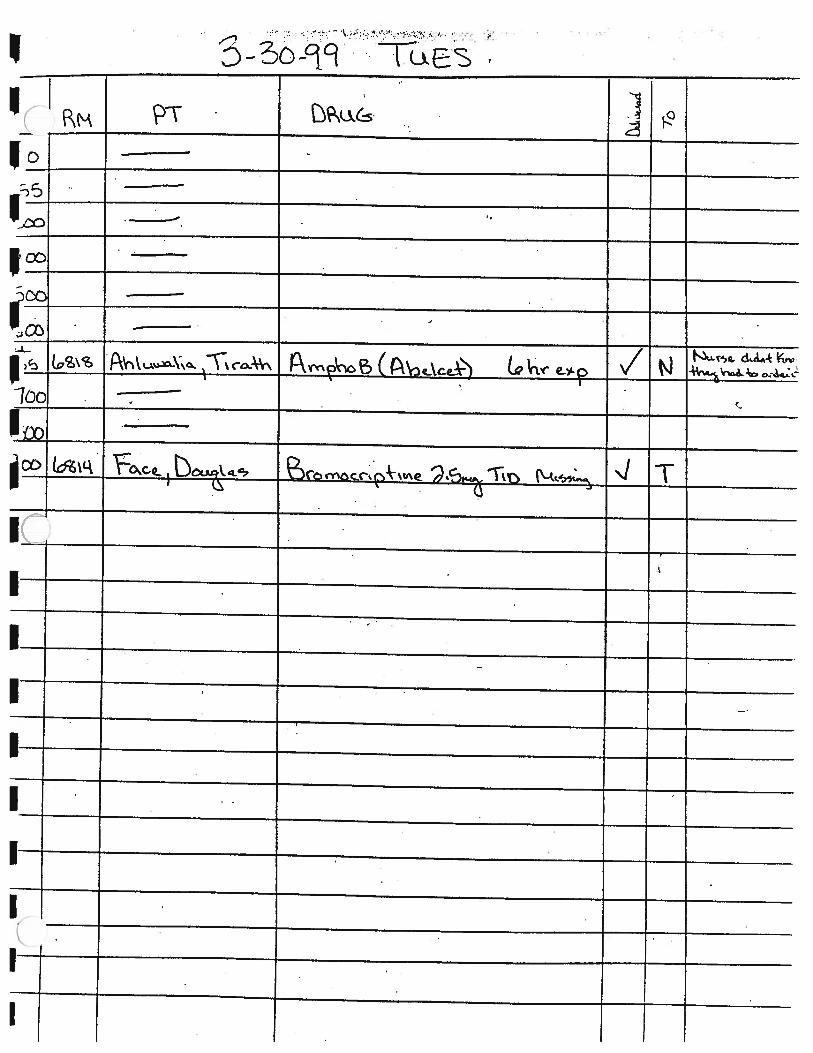
CCMU Pharmacy/Nursing PilotStat Order Data Collection Sheet
1 Patient Name:
23
Date:Drug:
Physician Writes Rx:Clerk Processes Rx:Method I]
4to El
56
7
Pharmacy: ElEl
Rx Entered on CPharm. ChecksMethod El
to El
Unit: El
ElRx Admin. To
9 Comments:
C = Unit Clerk’s ResponsibilityN = Nurse’s ResponsibilityP = Pharmacy’s Responsibility
RETURN DATA SHEETS TOENVELOPES LOCATED ATRIVER I COURT CLERK DESKS.
8

Appendix C

Description of Steps
Step] to 2
Includes: time from when physician writes the prescription order, to when the doctorflags the chart, and the clerk notices that the chart is flagged.
Step 2 to 3
Includes: time the clerk separates the RX, puts the white slip in the chart, and sends theslip to the pharmacy by one of three ways (tube, walking it over, or liaison.)
Step 3 to 4
Includes: time to travel to the pharmacy, and time it was waiting to be entered into thecomputer.
Step 4 to 5
Includes: time entered into the computer by either a pharmacist or a technician, and timeto fill the RX order.
Step 5 to 6
Includes: time it takes the pharmacist to check the order that has been filled.
Step 6 to 7
Includes: travel time back to the unit, time waiting in the unit to be noticed by a nurse orclerk, and the time it is administered to the patient.
‘C
II
II
IAppendix D
I
II
III
III

——
——
——
——
——
——
——
——
—
a)
a)
a)
a)
a)
a)
a)
a)
a)
a)
a)
a)
a)
a)
a)
a)
a)
a)
a)
a)
a)
a)
a)
a)
a)
a)
a)
a)
a)
a)
a)
a)
a)
a)
a)
a)
a)
a)
C)
00
00
00
00
00
00
00
00
00
000
00
00
00
00
00
00
00
00
00
t.
..
..
U)
U)
U)
U)
U)
U)
U)
U)
U)
U)
U)
U)
U)
U)
U)
U)
U)
U)
U)
U)
U)
U)
U)
U)
U)
U)
U)
U)
U)
—-
—-
—-..---
..-.-
—,-
.-—
...-
—.-
-.-
.-
——
S.
-.
--
-.-
--.
0t—
I—i
00
00
00
00
U)
U)
F’)
F’)
F’)
IN-)
F’)
F’)
F’)
F’)
F’)
F’)
f—i
I—i
I—I—
sI—
sê—
I-I-
i—i
00
C)
00
C)
0C
)(fl
C)
coCX
)—
Ia)
(ii
U)
)-
I—0
CL)
a)
S.)
a)
Xn.
U)
F’)
C)
CD
a)
—I
a)
Ui
U)
F’)
I-
C)
CL)
CX)-
a)
(SI
U)
F’)
S.
S.
-S
-S
S.
-S
---S
S.5
-S-S
5-S
-SS
..
CD
CD
CO
CO
CO
COCL
)C
OC
OC
DC
OC
DC
OC
DC
DC
OC
DC
DC
DC
OC
OC
DC
DC
DC
OC
OC
DCO
CD
CO
CD
CO
CD
CD
CO
CO
CO
COC
OCO
COCO
COCD
CC)
CO
CO
CO
CD
CD
CD
CD
CO
CD
CD
CD
CD
CDCD
CDCD
CDCD
CDCD
CDCD
CDCD
CDCD
COCO
CDCD
CDC
DC
DC
OC
D
0 fli Ct 0 0 çt
I-)—
I-
—I-
F-
FF
-I-
I-i—
iF-
I-
I—I—
iI-
I-
I-
I—s
I-
-
CD
CO
a)
Ja)
Ui
a)
Ui
a)
a)
Ui
—J
CL)
I—U
)F’
)IN
-.)F’
)CD
01
a)
F’)
a)
—.1
F’)
f—i
F-
F’)
Ui
a)
U)
I—s
F’)
F’)
U)
a)
—1
(SI

Appendix E
r>
a,
a,
95 0
:900• z
•50— -0
.25—
.10—--1
• .05—
.01 —
--3
IF tc*
2.0 2.5 3.0
Quantiles) [Momen) cit for NorrnalitJ
maximum 100.0% 2.8300 Mean 1.20868 Shapiro-Wilk W Test
W Prob.cW I99.5% 2.8300 Std Dev 0.79964
97.5% 2.8300 Std Error Mean 0.12972
__________________
0.890416 0.0011
90.0% 2.7500 Upper 95% Mean 1.47152
quartde 75.0% 1.5425 Lower 95% Mean 0.94585
median 50.0% 1.0000 N 38.00000
quartile 25.0% 0.6450 Sum Weights 38.00000
10.0% 0.2420 Sum 45.93000
2.5% 0.1000 Variance 0.63943
0.5% 0.1000 Skewness 0.82694
minimum 0.0% 0.1000 Kurtosis -0.27069
CV 66.15809

RW
bR
IR
.III
II
I
I-
Ci-
C000
000
i1r
iri
roP
2o
OC
DO
)o
oo
cx
oo
iooro
oazcn
00)0)
CD 1 CD CD I!
LcD
O:.,I
0)
00)0)040)C
fl.P
.ø
-0
CuF’
)
00ro
0o
00
0-0
o)C
yIa-.,1
-1(n
oD) C
D1— 41
: zi
0 — z G)
xZ
C)
X-C
hart
4.00
UC
L=
3.62
55
3.50
3.00
+2si
gma
=2.
8199
.22.
50
:+1
sigm
a=
21
E1
50C
L=
1.2
08
1.00
0.50
1si
gma
=0.
4032
CL
=0
0.00
II
8I
II
II
II
II
12
34
56
78
91
01
11
21
31
41
51
61
71
81
92
02
12
22
32
42
5262728293031
32333435363738
Obse
rvat
ion
#
MR
-Cha
rt
UC
L=
2.96
83
2.5
÷2si
gma
=2.
2817
C 0
+1si
gma=
1.5
2
o1.
5
E I
1C
L=
O.9
086
0.5
-1si
ga
—0.
2220
LC
L=
0.00
000
II
I
12
34
56
78
91011121314151617181920212223242526272829303132333435363738
Obs
erva
tion
I

JX!pUddV
J1

s•
sm
nss•••••••
IR
.—
I0 -I r -1 m C-
)C (1
)C C 3,
(0 CII
IiII
IIII
U
20
-‘
(0 C 3 C C C)
+ z + C) z S. S + a + 2 a

aa
aa
aa
ra
aa
aa
ai
1
U,
D C-) N I.. C U)
Sta
ndar
dize
dC
USU
Mfo
rP
roce
ssM
ean
6
Obs
erva
tion
#

•W
R••
••
...
11
11
K
6 4 2
Cl)
C) a) N 0 b. a) C a) 4
-. Cl)
-2 -4 -6
Sta
ndar
dize
dC
USU
Mfo
rP
roce
ssS
tand
ard
Dev
iati
on
Obs
erva
tion
#

fJX!pUddV
Formulas
Upper & Lower Control Limits for MR-Charts:
X-Chart:UCL = (x-bar) + (E2 * RbWEm)
=(1.21)+(2.66*0.91)= 3.6255
CL =x-bar= 1.21
LCL = (x-bar) - (E2 * R-barm)= (1.21) -(2.66 * 0.91)= -1.2080=0
MR-Chart:UCL = D4 * R-barm
=3.267*0.91= 2.9683
CL =R-barm= 0.91
LCL = D3 * R-barm=0*0.91=0
Process Fallout:
1 -ørusL-mulL sigma ]
1 - 4’(-0.8875)
1 —(1—0.81327)
=81.327%
Appendix H
——
——
——
——
—_
__
__
aD
ata
Coll
ecti
on
Shee
tT
imes
(bro
ken
do
wn
into
Ste
ps)
Wit
hout
liai
son
com
ple
ted
shee
tsS
tep
12
34
56
7P
hysi
cian
Wri
tes
Rx
Cle
rkP
roce
sses
Rx
Met
hod
toP
harm
acy
Rx
Ent
ered
onC
ompu
ter
Pha
rm.
Che
cks
FHle
dR
xM
etho
dto
Uni
tR
xA
dmin
.T
oP
atie
nt1
17:2
017
:20
17:2
517
:26
17:2
617
:26
17:3
02
12:1
013
:05
13:0
513
:14
13:1
513
:15
13:1
53
10:4
510
:50
10:5
511
:25
11:3
011
:43
12:0
04
10:0
010
:15
10:2
010
:32
10:3
310
:33
10:5
05
22:0
023
:00
23:0
023
:10
23:1
023
:10
23:2
06
23:5
52:
002:
002:
012:
022:
022:
457
13:3
013
:45
13:4
813
:55
13:5
813
:58
14:1
08
1:00
1:30
1:30
1:48
1:50
1:50
2:00
918
:50
19:0
519
:05
19:2
319
:24
19:2
419
:40
107:
407:
407:
437:
457:
457:
457:
4811
19:0
019
:30
19:3
319
:45
19:4
719
:47
19:5
512
12:1
012
:13
12:1
512
:20
12:2
512
:40
12:5
013
12:0
012
:10
12:1
012
:41
12:4
212
:42
13:3
014
11:5
611
:56
11:5
811
:59
12:0
012
:00
12:0
215
13:1
013
:20
13:2
013
:40
13:4
413
:45
14:1
516
16:0
016
:00
16:0
016
:10
16:2
016
:21
18:5
017
9:00
9:10
9:10
9:18
9:18
9:18
9:28
1811
:00
11:2
511
:25
11:4
011
:41
11:4
111
:50
1916
:30
16:4
316
:45
18:0
518
:07
18:0
818
:10
2016
:40
16:4
716
:49
16:5
817
:02
17:0
317
:10
2116
:30
17:1
517
:15
17:2
517
:27
17:2
817
:35
2216
:15
16:1
916
:19
16:3
016
:30
16:3
016
:48
235:
005:
105:
225:
285:
326:
156:
1524
5:00
5:10
5:22
5:28
5:32
6:15
6:15
2523
:30
23:3
023
:40
23:4
123
:41
23:4
124
:00:
0026
7:45
7:45
7:45
7:50
7:50
7:50
8:00
278:
208:
258:
308:
378:
388:
389:
0528
8:00
9:40
9:45
9:50
9:51
9:51
10:0
729
6:45
6:52
6:55
7:24
7:24
7:25
9:30
3010
:45
10:5
511
:00
11:2
211
:27
11:2
711
:40
3119
:05
19:1
019
:10
19:2
519
:26
19:2
720
:30
327:
007:
257:
259:
139:
189:
189:
2533
7:55
8:00
8:00
9:14
9:15
9:16
10:0
034
0:05
0:12
0:19
0:35
0:35
0:35
1:05
3510
:30
10:3
510
:43
10:5
510
:59
11:0
011
:04
369:
309:
459:
5010
:00
10:0
410
:07
12:1
537
9:00
9:00
9:00
9:30
9:45
9:50
10:0
038
8:00
8:40
8:45
8:55
9:00
10:0
010
:35

——
——
——
——
——
——
——
——
Tim
edura
tions
betw
een
each
step
(wit
hout
liai
son,
com
plet
edsh
eets
)
Ste
p1
toS
tep
2S
tep
2to
Ste
p3
Ste
p3
toS
tep
4S
tep
4to
Ste
p5
Ste
p5
toS
tep
6S
tep
6to
Ste
p7
10:
000:
050:
010:
000:
000:
042
0:55
0:00
0:09
0:01
0:00
0:00
30:
050:
050:
300:
050:
130:
174
0:15
0:05
0:12
0:01
0:00
0:17
51:
000:
000:
100:
000:
000:
106
2:05
0:00
0:01
0:01
0:00
0:43
70:
150:
030:
070:
030:
000:
128
0:30
0:00
0:18
0:02
0:00
0:10
90:
150:
000:
180:
010:
000:
1610
0:00
0:03
0:02
0:00
0:00
0:03
110:
300:
030:
120:
020:
000:
0812
0:03
0:02
0:05
0:05
0:15
0:10
130:
100:
000:
310:
010:
000:
4814
0:00
0:02
0:01
0:01
0:00
0:02
150:
100:
000:
200:
040:
010:
3016
0:00
0:00
0:10
0:10
0:01
2:29
170:
100:
000:
080:
000:
000:
1018
0:25
0:00
0:15
0:01
0:00
0:09
190:
130:
021:
200:
020:
010:
0220
0:07
0:02
0:09
0:04
0:01
0:07
210:
450:
000:
100:
020:
010:
0722
0:04
0:00
0:11
0:00
0:00
0:18
230:
100:
120:
060:
040:
430:
0024
0:10
0:12
0:06
0:04
0:43
0:00
250:
000:
100:
010:
000:
000:
1926
0:00
0:00
0:05
0:00
0:00
0:10
270:
050:
050:
070:
010:
000:
2728
1:40
0:05
0:05
0:01
0:00
0:16
290:
070:
030:
290:
000:
012:
0530
0:10
0:05
0:22
0:05
0:00
0:13
310:
050:
000:
150:
010:
011:
0332
0:25
0:00
1:48
0:05
0:00
0:07
330:
050:
001:
140:
010:
010:
4434
0:07
0:07
0:16
0:00
0:00
0:30
350:
050:
080:
120:
040:
010:
0436
0:15
0:05
0:10
0:04
0:03
2:08
370:
000:
000:
300:
150:
050:
1038
0:40
0:05
0:10
0:05
1:00
0:35
Ave
rage
Tim
e/
Ste
p:A
vg.
Pro
cess
Tim
e0:
180:
020:
170:
020:
050:
251:
12
——
——
——
——
——
——
——
—w
—*
Wit
hout
Iiai
ico
mp
lete
sheets
Ste
p1
23
45
67
Phy
sici
anW
rite
sR
xC
lerk
Pro
cess
esR
xM
etho
dto
Pha
rmac
yR
xE
nter
edon
Com
pP
harm
.C
heck
sR
xM
etho
dto
Uni
tR
xA
dmin
.T
oP
atie
nt1
2:50
3:05
3:30
4:30
22:
503:
103:
103:
303:
403:
503
9:25
9:40
9:58
10:0
511
:00
11:0
04
8:00
8:05
8:07
8:16
8:20
514
:20
14:2
015
:24
15:2
815
:28
15:4
06
1:30
1:49
2:55
3:00
79:
009:
159:
309:
358 9
12:3
512
:50
13:0
013
:05
13:2
513
:30
1020
:45
21:0
021
:14
21:1
621
:18
21:2
111
3:48
3:49
3:51
3:55
3:56
3:56
1214
:40
14:5
515
:00
15:0
515
:15
1310
:30
10:3
110
:31
10:5
014
10:3
010
:31
10:3
110
:50
10:5
015
7:30
7:31
7:32
7:35
7:36
7:36
169:
159:
209:
4917
19:2
519
:26
19:2
719
:28
19:3
219
:33
1818
:15
18:1
518
:20
18:3
018
:35
18:3
819
5:00
6:25
6:30
6:35
6:38
6:38
205:
006:
256:
306:
356:
386:
3821
14:3
015
:15
15:1
515
:23
15:2
615
:30
2219
:25
19:2
619
:27
19:2
819
:29
19:3
123
17:1
017
:10
17:1
517
:15
17:2
017
:25
2413
:00
13:1
013
:13
13:4
613
:46
15:0
025 26
11:0
014
:00
14:0
027
17:4
517
:45
17:5
418
:13
18:2
028
13:1
713
:20
14:0
714
:08
14:2
029 30 31 32 33 34 35
8:00
8:35
8:42
9:10
9:10
9:11
362:
452:
483:
353:
373:
373:
3737
12:1
512
:17
12:1
712
:50
12:5
512
:55
387:
007:
358:
058:
138:
148:
1439
8:28
8:28
8:28
8:30
8:30
8:30
4019
:15
19:2
819
:29
19:4
419
:45
19:4
641
18:0
018
:25
18:3
320
:30
20:4
220
:42
42 431:
001:
201:
201:
401:
441:
45

—A
AA
AA
’AK
KI
IM
J44
1:00
1:30
1:49
1:50
1:50
45 460:
000:
300:
310:
320:
3547
10:0
011
:00
11:0
511
:25
11:3
012
:30
4810
:00
11:0
011
:05
11:2
511
:30
12:3
049
10:0
011
:00
11:0
511
:25
11:3
012
:00
504:
254:
455:
005:
205:
308:
0051
4:25
4:45
5:00
5:20
5:30
7:00
524:
254:
455:
005:
205:
309:
0053
2:45
2:58
3:00
3:00
3:15
541:
051:
101:
402:
10
Tim
edura
tions
bet
wee
nea
chst
ep(w
itho
utli
aiso
n,in
com
ple
ted
shee
ts)
Ste
p1
toS
tep
2S
tep
2to
Ste
p3
Ste
p3
toS
tep
4S
tep
4to
Ste
p5
Ste
p5
toS
tep
6S
tep
6to
Ste
p7
11/
0/00
0:25
21/
0/00
0:20
1/0/
000:
001/
0/00
0:20
110/
000:
101/
0/00
0:10
31/
0/00
0:15
1/0/
000:
181/
0/00
0:07
1/0/
000:
551/
0/00
0:00
41/
0/00
0:05
1/0/
000:
021/
0/00
0:04
51/
0/00
0:00
1/0/
001:
041/
0/00
0:04
110/
000:
001/
0100
0:12
61/
0/00
0:05
71/
0/00
0:15
1/0/
000:
058 9
1/0/
000:
151/
0/00
0:10
1/0/
000:
051/
0/00
0:20
1/0/
000:
0510
1/0/
000:
151/
0/00
0:14
1/0/
000:
021/
0/00
0:02
1/0/
000:
0311
1/0/
000:
011/
0/00
0:02
1/0/
000:
041/
0/00
0:01
1/0/
000:
0012
1/0/
000:
151/
0/00
0:05
1/0/
000:
1013
1/0/
000:
011/
0/00
0:00
1/0/
000:
1914
1/0/
000:
011/
0/00
0:00
1/0/
000:
191/
0/00
0:00
151/
0/00
0:01
1/0/
000:
011/
0/00
0:03
1/0/
000:
011/
0/00
0:00
161/
0/00
0:05
171/
0/00
0:01
1/0/
000:
011/
0/00
0:01
1/0/
000:
041/
0/00
0:01
181/
0/00
0:00
1/0/
000:
051/
0/00
0:10
1/0/
000:
051/
0/00
0:03
191/
0/00
1:25
1/0/
000:
051/
0/00
0:05
1/0/
000:
031/
0/00
0:00
201/
0/00
1:25
1/0/
000:
051/
0/00
0:05
1/0/
000:
031/
0/00
0:00
211/
0/00
0:45
1/0/
000:
001/
0/00
0:08
110/
000:
031/
0/00
0:04
221/
0/00
0:01
1/0/
000:
011/
0/00
0:01
1/0/
000:
011/
0/00
0:02
231/
0/00
0:00
1/0/
000:
051/
0/00
0:00
1/0/
000:
051/
0/00
0:05
241/
0/00
0:10
1/0/
000:
031/
0/00
0:33
1/0/
000:
001/
0/00
1:14
25 261/
0/00
0:00
271/
0/00
0:00
1/0/
000:
091/
0/00
0:19
1/0/
000:
0728
1/0/
000:
031/
0/00
0:01
1/0/
000:
1229 30 31 32 33 34 35
1/0/
000:
351/
0/00
0:07
1/0/
000:
281/
0/00
0:00
1/0/
000:
0136
1/0/
000:
031/
0/00
0:47
1/0/
000:
021/
0/00
0:00
1/0/
000:
0037
1/0/
000:
021/
0/00
0:00
1/0/
000:
331/
0/00
0:05
1/0/
000:
0038
1/0/
000:
351/
0/00
0:30
1/0/
000:
081/
0/00
0:01
1/0/
000:
0039
1/0/
000:
001/
0/00
0:00
1/0/
000:
021/
0/00
0:00
1/0/
000:
0040
1/0/
000:
131/
0/00
0:01
1/0/
000:
151/
0/00
0:01
1/0/
000:
0141
1/0/
000:
251/
0/00
0:08
1/0/
001:
571/
0/00
0:12
1/0/
000:
0042

•K
441/
0/00
0:30
1/0/
000:
191/
0/00
0:01
1/0/
000:
0045 46
1/0/
000:
011/
0/00
0:01
471/
0/00
1:00
1/0/
000:
051/
0/00
0:20
1/0/
000:
0548
1/0/
001:
001/
0/00
0:05
1/0/
000:
201/
0/00
0:05
491/
0/00
1:00
1/0/
000:
051/
0/00
0:20
1/0/
000:
0550
1/0/
000:
201/
0/00
0:15
1/0/
000:
201/
0/00
0:10
1/0/
002:
3051
1/0/
000:
201/
0/00
0:15
1/0/
000:
201/
0/00
0:10
1/0/
001:
3052
1/0/
000:
201/
0/00
0:15
1/0/
000:
201/
0/00
0:10
1/0/
003:
3053
1/0/
000:
131/
0/00
0:02
1/0/
000:
1554
1/0/
000:
051/
0/00
0:30
2539
3834
2815
Avg
.ti
mes
Avg
.to
tal
pro
cess
inco
mpl
ete:
0:23
0:09
0:15
0:05
0:07
0:35
N/A
com
plet
e:0:
180:
020:
170:
020:
050:
251:
12to
geth
er:
0:21
0:06
0:16
0:04
0:06
0:30
N/A
——
——
——
——
——
——
——
—-
—:h
out
liai
son
ccat
eddat
ash
eets
(bro
ken
dow
nin
tosh
ifts
))ta
l
12
34
56
7P
roce
ss
Phy
sici
anW
rite
sR
xC
lerk
Pro
cess
esR
xM
etho
dto
Pha
rmac
yR
xE
nter
edon
Com
pP
harm
.C
heck
sR
xM
etho
dto
Uni
tR
xA
dmin
.T
oP
atie
ntT
imes
ift3a
m-7
am5:
005:
105:
225:
285:
326:
156:
151:
15
25:
005:
105:
225:
285:
326:
156:
151:
15
36:
456:
526:
557:
247:
247:
259:
302:
45A
vera
ge=
1:45
ft7
am-l
lam
17:
007:
257:
259:
139:
189:
189:
252:
25
27:
407:
407:
437:
457:
457:
457:
480:
08
37:
457:
457:
457:
507:
507:
508:
000:
15
47:
558:
008:
009:
149:
159:
1610
:00
2:05
58:
009:
409:
459:
509:
519:
5110
:07
2:07
68:
008:
408:
458:
559:
0010
:00
10:3
52:
35
78:
208:
258:
308:
378:
388:
389:
050:
45
89:
009:
109:
109:
189:
189:
189:
280:
28
99:
009:
009:
009:
309:
459:
5010
:00
1:00
9:30
9:45
9:50
10:0
010
:04
10:0
712
:15
2:45
Ii10
:00
10:1
510
:20
10:3
210
:33
10:3
310
:50
0:50
210
:30
10:3
510
:43
10:5
510
:59
11:0
011
:04
0:34
1310
:45
10:5
010
:55
11:2
511
:30
11:4
312
:00
1:15
1410
:45
10:5
511
:00
11:2
211
:27
11:2
711
:40
0:55
Ave
rage
=1:
17
ift
llam
-3p
m11
:00
11:2
511
:25
11:4
011
:41
11:4
111
:50
0:50
211
:56
11:5
611
:58
11:5
912
:00
12:0
012
:02
0:06
312
:00
12:1
012
:10
12:4
112
:42
12:4
213
:30
1:30
12:1
013
:05
13:0
513
:14
13:1
513
:15
13:1
51:
05
512
:10
12:1
312
:15
12:2
012
:25
12:4
012
:50
0:40
613
:10
13:2
013
:20
13:4
013
:44
13:4
514
:15
1:05
713
:30
13:4
513
:48
13:5
513
:58
13:5
814
:10
0:40
Ave
rage
=0:
50
ift
3pm
-7pm
16:0
016
:00
16:0
016
:10
16:2
016
:21
18:5
02:
50
216
:15
16:1
916
:19
16:3
016
:30
16:3
016
:48
0:33
316
:30
16:4
316
:45
18:0
518
:07
18:0
818
:10
1:40
16:3
017
:15
17:1
517
:25
17:2
717
:28
17:3
51:
05
16:4
016
:47
16:4
916
:58
17:0
217
:03
17:1
00:
30
617
:20
17:2
017
:25
17:2
617
:26
17:2
617
:30
0:10
718
:50
19:0
519
:05
19:2
319
:24
19:2
419
:40
0:50
Ave
rage
=1:
05

——
——
——
——
——
——
——
——
——
Shif
t7pm
-llp
iT1
19:0
019
:30
19:3
319
:45
19:4
719
:47
19:5
50:
55
219
:05
19:1
019
:10
19:2
519
:26
19:2
720
:30
1:25
322
:00
23:0
023
:00
23:1
023
:10
23:1
023
:20
1:20
Ave
rage
=1:
13
Shif
tll
pm
-3am
23:3
023
:30
23:4
023
:41
23:4
123
:41
24:0
0:00
0:30
23:5
52:
002:
002:
012:
022:
022:
452:
50
0:05
0:12
0:19
0:35
0:35
0:35
1:05
1:00
1:00
1:30
1:30
1:48
1:50
1:50
2:00
1:00
Av
erag
e1:
20
Num
ber
ofS
tats
Avg
.T
otal
Pro
cess
Tim
eSh
ift
3am
-7am
31:
45S
hif
t7am
-lla
m14
1:17
Shif
tll
am-3
pm
70:
50S
hift
3pm
-7pm
71:
05S
hif
t7pm
-llp
m3
1:13
Shif
t11
pm-3
am4
1:20

——
——
——
——
——
——
——
——
——
Dat
aC
olle
ctio
nS
hee
tT
imes
(bro
ken
dow
nin
toS
teps)
Wit
hli
aiso
nco
mple
ted
shee
tsS
tep
12
34
56
7P
hysi
cian
Wri
tes
Rx
Cle
rkP
roce
sses
Rx
Met
hod
toP
harm
acy
Rx
Ent
ered
onC
ompu
ter
Pha
rm.
Che
cks
Rx
Met
hod
toU
nit
Rx
Adm
in.
To
Pat
ient
115
:00
15:4
516
:05
16:0
816
:10
16:1
218
:32
215
:00
15:4
516
:05
16:0
816
:11
16:1
218
:00
312
:30
12:3
012
:40
12:4
712
:50
12:5
113
:15
Tim
edura
tions
bet
wee
nea
chst
ep(w
ith
liai
son,
com
ple
ted
shee
ts)
Ste
p1
toS
tep
2S
tep
2to
Ste
p3
Ste
p3
toS
tep
4S
tep
4to
Ste
p5
Ste
p5
toS
tep
6S
tep
6to
Ste
p7
Tot
alP
roce
ssT
imes
10:
450:
200:
030:
020:
022:
203:
322
0:45
0:20
0:03
0:03
0:01
1:48
3:00
30:
000:
100:
070:
030:
010:
240:
45A
VG
0:30
0:16
0:04
0:02
0:01
1:30
2:25
Avg
.T
otal
Pro
cess
Tim
e=2:
25
Wit
hli
aiso
nin
com
ple
ted
shee
tsS
tep
12
34
56
7P
hysi
cian
Wri
tes
Rx
Cle
rkP
roce
sses
Rx
Met
hod
toP
harm
acy
Rx
Ent
ered
onC
ompu
ter
Pha
rm.
Che
cks
Rx
Met
hod
toU
nit
Rx
Adm
in.
To
Pat
ient
114
:55
14:5
514
:56
14:5
614
:57
15:1
02
11:2
011
:20
12:0
012
:02
12:0
712
:07
Tim
edura
tions
bet
wee
nea
chst
ep(w
ith
liai
son,
inco
mp
lete
dsh
eets
)
Ste
p1
toS
tep
2S
tep
2to
Ste
p3
Ste
p3
toS
tep
4S
tep
4to
Ste
p5
Ste
p5
toS
tep
6S
tep
6to
Ste
p7
10:
000:
010:
000:
010:
132
0:00
0:40
0:02
0:05
0:00
AV
G0:
000:
200:
010:
020:
000:
13N
=1
22
22
1

Appendix I
I L\LçT13
\Do;’)
ccc\
---
ci ô.CQ
UcCxTh._ Pcç2o
D -?D
—
24S R-c-3: -
3 Ic
I.
____
p-c
aC(A
C) — a
R-- I
I.. ?S UQv:Lc
I ‘ -
ç) -- i r’. i - Nu. c’- cLE
OflkfQ&o 4o Pcc
I_i
(ç3 J IU— 4ô’%&\ )cç - I
-ii%ct oçc1 ‘I :t.
-‘‘
/)I1._
I-- ‘
i ‘1 t. C-cu- S4-S —I - -i (L,cc
l---
C) —
I.—I—I—I_____

I
cwU:,bcecI

I
I
dcJCw.
- d9-99
‘7 -i;
(
(3f4 & Ji
10‘1
- t9% :; ,
IL 9\% c0wo (o,i1p L..\VWL
‘c0Q Dj\o-J
‘—
1 o
r
:..
I
II

1
I

I. 3’3I 4to(‘;L) 5i (w
C)
jq C
CCMU Pharmacy Tech pilotI1’ôo- 1930
Date PtfRm # Nurse Message for Tech Order Orderreceived resolved
(b)(i’)
‘; -SoLLb
——---
3-a9
\% ;ilcz
CCMU Pharmacy Tech pilot\Voo
-
Date PtfRm : Nurse Message for Tech Order Order‘ received resolved
. (•_)
V Vw
3h .(7: ivzrzL p4-’-- pfr (z)
i4&Ofi4 -
.— —-
1o1s,atoi&tii
•&W(ec Peof7cV
OOflr

Appendix J

Process Flow Chart: ‘STAT’ Medication Turnaround 7/21/94
MD Writes (RNTakes Verbal)
Order
2
Order Noted byClerk
3
Is Order Considered
Yes
5RN PreparesMedication forMministration
RN AdministersMedication
10Pharmacy Technicianor Pharmacist EntersOrders in Pharmacy
Computer
11
Technician Notes OrderIs Stat and InformsAppropriate Staff of
Urgency (IV TectiIRPH)
Diagramed by: Bruce Chaffee, Pharm.D.,team leader STAT medication QIT
21Nurse Sends
Medication Order toPharmacy via
Pneumatic Tube
22
Pharmacy Technician orPharamcist Pulls Orderfrom Pneumatic Tubes
STAT MedicationTurnaround Time Team
VNo
9Pharmacy
Technician PicksNew Orders
19Does NurselClerk
Take Order toPharmacy to Obtain
Medication?
Yes
20
Nurse or Unit Clerk Walksto Pharmacy and Hands
Order(s) to PharmacyTechnician or Pharmacist
__I
RN’Chirts
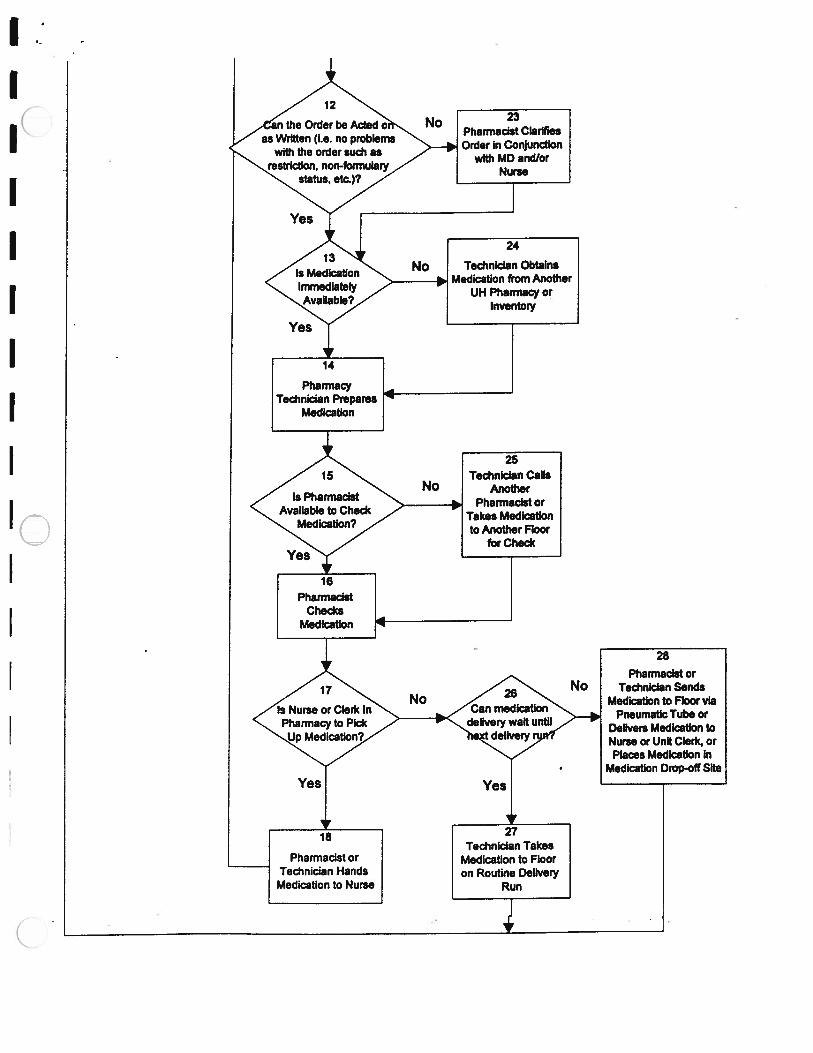
the Order be Acted NoPharmacst Clarifies
as Written (i.e. no problems Order In Conjunctionwith the order such as with MD and/or
restriction, non-form Nustatus, etc.)?
Technician ObtainsMedication from Another
UH Pharmacy orInventory
Technician TakesMedication to Flooron Routine Delivery
Run
Pharmacist orTechnician Sends
Medication to Floor viaPneumatic Tube or
Delivers Medication toNurse or Unit Clerk, orPlaces Medication In
Medication Drop-off Site

Appendix K
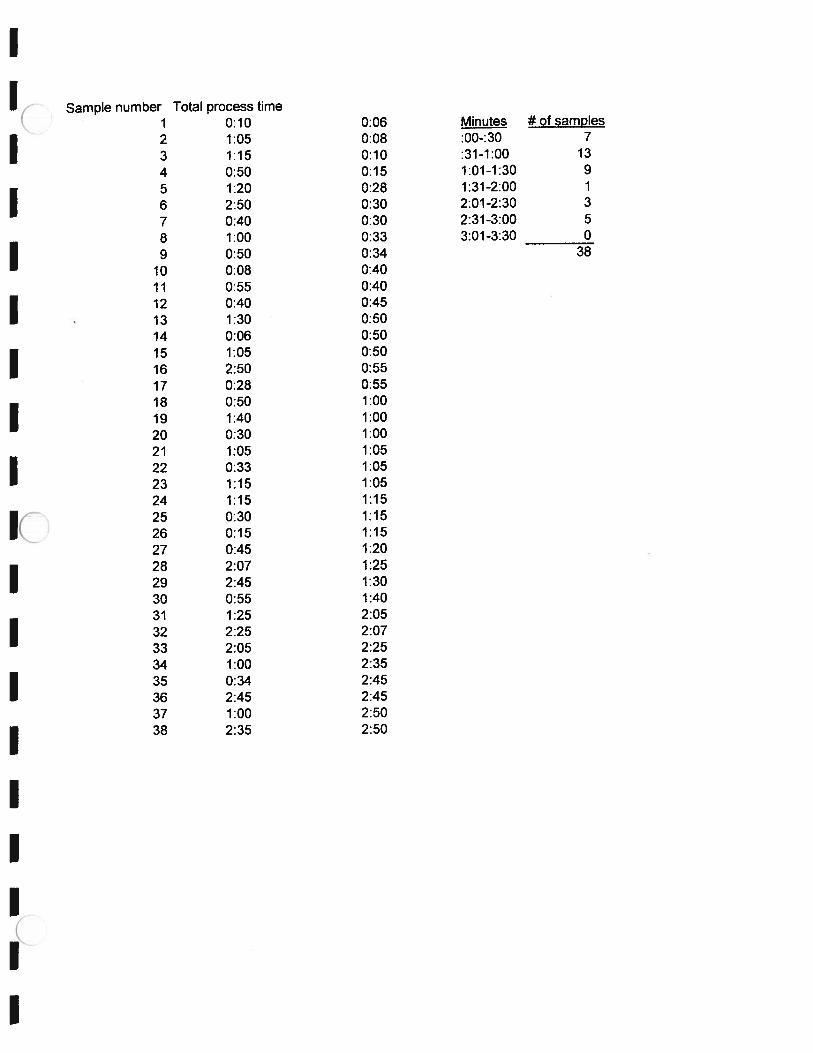
Sample number Tot& process time1 0:10 0:06 Minutes #ofsamples2 1:05 0:08 :00-:30 7
3 1:15 0:10 :31-1:00 13
4 0:50 0:15 1:01-1:30 9
5 1:20 0:28 1:31-2:006 2:50 0:30 2:01-2:30 3
7 0:40 0:30 2:31-3:00 5
8 1:00 0:33 3:01-3:30 0
9 0:50 0:34 38
10 0:08 0:4011 0:55 0:4012 0:40 0:45
• 13 1:30 0:5014 0:06 0:5015 1:05 0:5016 2:50 0:5517 0:28 0:5518 0:50 1:0019 1:40 1:0020 0:30 1:0021 1:05 1:0522 0:33 1:0523 1:15 1:0524 1:15 1:1525 0:30 1:1526 0:15 1:1527 0:45 1:2028 2:07 1:2529 2:45 1:3030 0:55 1:4031 1:25 2:0532 2:25 2:0733 2:05 2:2534 1:00 2:3535 0:34 2:4536 2:45 2:4537 1:00 2:5038 2:35 2:50
——
0
-
2 z
——
——
——
——
——
——
——
——
Tot
alpro
cess
tim
edi
stri
buti
on*
for
STA
Tord
ers
bet
wee
nC
CM
Uan
d6t
hfl
oor
sate
llit
ephar
mac
y
I ICl
) w E Cl)
4 2 0 8 6 4 2 0
I-
I:00
—:31
—1:
01—
1:31
—2:
01-
2:31
—3:
01—
:30
1:00
1:30
2:00
2:30
3:00
3:30
Tim
eIn
terv
als
(hours
:min
ute
s)*c
ompl
eted
shee
ts,
wit
hout
liais
onN
=38

Appendix L
IIIIIIIII

——
——
——
——
——
——
——
——
——
—
Cl)
G) E iz
Aver
age
Pro
cess
Tim
esfo
rS
tep
Inte
rval
s(w
ithout
liai
son)
lto2
2to
33to
44to
5to
66to
7
Ste
pIn
terv
als
0:21
0:36
0:28
0:21
0:14
0:07
0:00
0:30
0:16
0:06
0:04
0:06
I5

Bibliography
1. Burr, I.J. (1967). “The Effect of Nonnormality on Constants for Control Charts,”Industrial Quality Control, Vol. 23
2. Montgomery, Douglas C. (1997). “Introduction to Statistical Quality Control,” JohnWiley & Sons, Inc.
3. Schilling, E.G., and P.R. Nelson (1976). “The Effect of Nonnormality on ControlLimits,” Journal of Quality Technology, Vol.8
4. Coffey, Richard J. (1998-99). “JOE 481 Special Projects In Hospital Systems,”Cousepack for Winter 1999.