c.c. graf technical services, newmont boddington gold ... · rocfall requires several input...
TRANSCRIPT
Slope Stability 2013 – P.M. Dight (ed) © 2013 Australian Centre for Geomechanics, Perth, ISBN 978-0-9870937-5-2
1 Slope Stability 2013, Brisbane, Australia 1
C.C. Graf Technical Services, Newmont Boddington Gold, Australia
T. Peryoga Technical Services, Newmont Boddington Gold, Australia
G. McCartney Technical Services, Newmont Boddington Gold, Australia
T. Rees Technical Services, Newmont Boddington Gold, Australia
The Boddington gold mine is owned by Newmont Asia Pacific and is located approximately 130 km southeast of Perth in Western Australia. Operations officially commenced in 2010 with production from two large pits. At full capacity Boddington will become the largest gold mine in Australia. Boddington is located within the Saddleback Greenstone Belt and the pits are being developed in a largely hard rock environment.
In open pit mining generally, isolated falls of individual or small clusters of rock pose a risk to personnel and equipment. The aspects of interest in modelling the rockfall behaviour includes the rock trajectory path, landing distance from the bench and the lateral spread from the point of origin that have detached from the slope. Readily available software for the modelling of rockfalls simplifies the problem to two-dimensions that does not account for the three-dimensional pit surfaces, and does not represent the rock geometry. This makes rockfalls difficult to model accurately and does not address all the aspects that are of interest in the modelling of rockfall behaviour. These shortcomings were addressed in a three-dimensional rigid body rockfall analysis program software program Trajec3D (BasRock, 2013). Trajec3D is able to simulate the trajectory of rocks during free fall, rolling, bouncing and sliding.
A project was undertaken at Boddington to verify the use of Trajec3D to model rockfall events, and understand rockfall behaviour. The project involved completing a series of tests to determine the coefficient of restitution on different floor surfaces within the pit, and undertaking rockfall experiments in the pit. The experimental rockfalls were then back-analysed with Trajec3D to determine appropriate physics interaction properties.
It was found that there were some limitations to the model, however the model did aid in understanding rockfall behaviour, and potential rockfall motion paths. It is believed that the Trajec3D model provides a fair representation of the rockfalls, and is able to be used to establish a procedure whereby potential rockfall areas can be identified, and effective rockfall mitigation techniques determined.
Boddington is located approximately 130 km southeast of Perth in Western Australia. The mine officially commenced production in 2010, and produced its first one million ounces (oz) in 2011. Mining takes place from two large open pits at a production rate of 100 million tonnes per annum (ore and waste), producing 750,000 oz of gold, and 30,000 tonnes of copper. At full capacity Boddington will become one of Australia’s largest gold producers.
Isolated falls of individual or small clusters of rock pose a risk to personnel and equipment. The aspects of interest in modelling the rockfall behaviour includes the rock trajectory path, landing distance from the bench, and the lateral spread from the point of origin that have detached from the slope. A project was undertaken at Boddington to verify the use of Trajec3D (BasRock, 2013) to model rockfall events, and understand rockfall behaviour.
https://papers.acg.uwa.edu.au/p/1308_87_Graf/
Verification of Trajec3D for use in rockfall analysis at Newmont Boddington Gold C.C. Graf et al.
2 Slope Stability 2013, Brisbane, Australia
Boddington is located within the Saddleback Greenstone Belt, a northwest trending fault approximately 45 km long and 7 km wide. The belt is steeply dipping and has been intruded by quartz diorite and post mineralisation dolerite dykes.
The Boddington deposit occurs as clinozoisite-biotite-sulphide veins/fractures/clots and late actinolite-sulphide veins in both the major lithologies, andesite and diorite. Subvertical dolerite dykes and sub-horizontal dolerite sills intrude the main rock types. The vast majority of dolerite dykes were formed later than mineralisation and are barren.
Laboratory tests have been conducted on a number of samples of the major rock types at Boddington. A study of the rock property tests found that the andesite and diorite can be defined as a strong to very strong rock with Unconfined Compressive Strengths (UCS) ranging from 100 to 200 MPa. The dolerite is predominantly very strong with UCS range of 200 to 300 MPa.
The Boddington rock mass is generally good to very good rock, categorised by high Rock Quality Designation (RQD) values (85% to 90%), and a Geological Strength Index (GSI) (Marinos and Hoek, 2000) of between 80 and 90 (Ross, 2010). The exposed walls indicate that the healed or closed joints open after blasting, and the presence of geological structures in some areas where the geometry is unfavourable can contribute to loss of berm widths.
The geological structures are typically undulating and rough, but in the fine grained dolerite are often planar and smooth. Friction angles for joints range between 31˚ to 44˚.
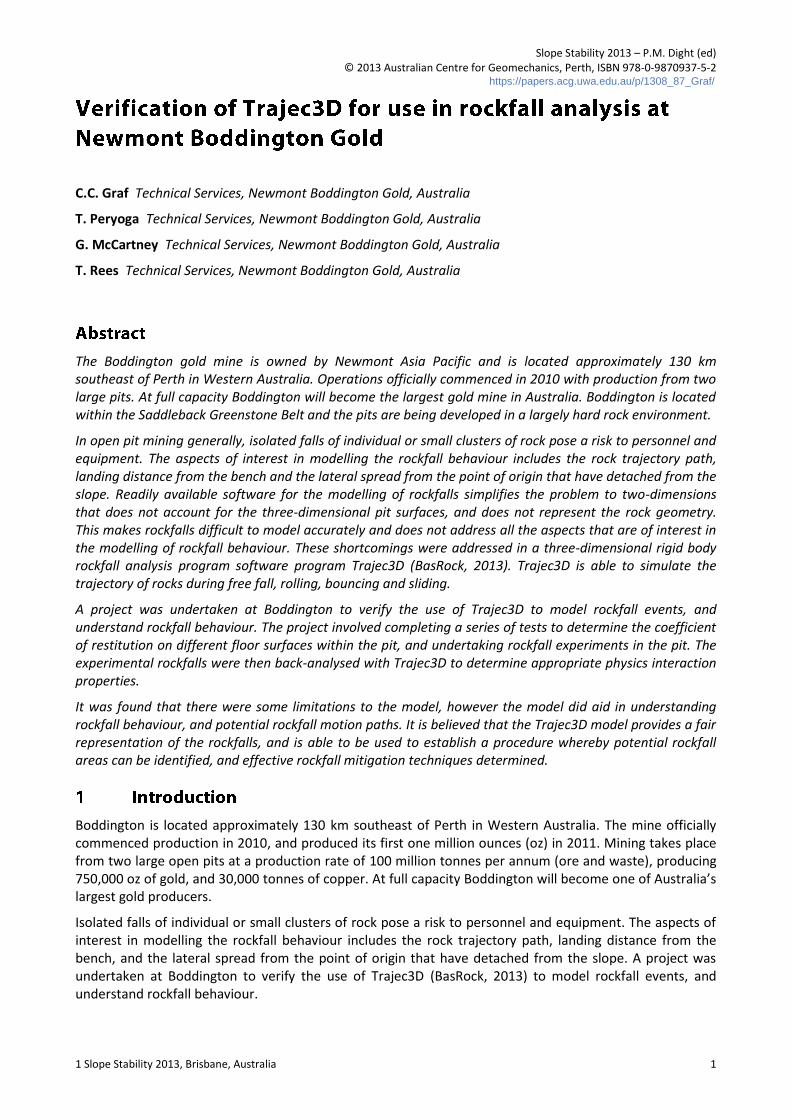
In 2010 rockfall analysis was completed using RocFall v4.0 (Rocscience, 2010), a 2D statistical software package. RocFall requires several input parameters. To calibrate the model to mimic the characteristics of the rockfalls, a series of 15 rockfall experiments were completed. This involved releasing rocks of varying sizes from the top of the pit wall, measuring each rocks dimension and size, recording each descent, and adjusting the RocFall input parameters so the model reflected the observations during testing. The location of the testing, and RocFall model showing the experiment rockfall trajectories are shown in Figure 1.
Rockfall
Slope Stability 2013, Brisbane, Australia 3
As a result of this testing it was concluded that the RocFall model provided a fair representation of the expected trajectory, speed, bounce height, and kinetic energy for rockfalls at Boddington. However, this model has some limitations:
The model assumes that slope geometry is consistent, in reality it will change between cross sections.
The model assumes that the rockfall occurs in a two-dimensional vertical plane, in reality the trajectory of the rock will be affected by structure surfaces and the pit geometry.
This makes rockfalls difficult to model accurately, and does not address all the aspects that are of interest in the modelling of rockfall behaviour. These shortcomings were addressed in a three-dimensional rigid body rockfall analysis program software program developed by Basson (2012), Trajec3D. Trajec3D is able to simulate the trajectory of rocks during free fall, rolling, bouncing and sliding.
In 2012 rockfall analysis was completed for Boddington using Trajec3D to verify the use of the program for future rockfall modelling.
Trajec3D was developed using rigid body mechanics (Basson, 2012). The Trajec3D input parameters include:
Pit survey shell.
Rock shape.
Rock weight (tonnes).
Static friction angle (the angle at which a rock will begin to slide).
Dynamic friction angle (it is the angle at which the rock will continue to slide, and will be less than the static friction angle.
Coefficient of restitution (the ‘bounciness’ of the rock).
The pit survey shell, rock shape, and rock weight are known parameters, whereas the friction angles and coefficient of restitution are determined from test work or experimentation.
The general approach that was used to simulate rockfall events in Trajec3D is outlined below, and discussed for Boddington in the following sections.
1. Coefficient of restitution tests.
The coefficient of restitution (CR) is defined as (Basson, 2012):
H
hCR
(1)
Where:
h = the height of the bounce.
H = the height from which the rock is dropped.
The coefficient of restitution can be determined by a series of experiments where a rock is dropped onto a horizontal surface. The experiments should be repeatable, and be completed on a range of surfaces commonly found in the pit.
2. Rockfall experiments.
Verification of Trajec3D for use in rockfall analysis at Newmont Boddington Gold C.C. Graf et al.
4 Slope Stability 2013, Brisbane, Australia
A series of controlled rock fall experiments are completed to determine parameters required for future rockfall analysis. Rocks of varying sizes are artificially induced to fall, and captured by high definition video cameras. The start and end point of each rockfall is surveyed.
3. Trajec3D modelling to determine appropriate physics interaction properties.
A Trajec3D model is built of the exact configuration at the time of the experimental rockfall. The input parameters can be varied until the model simulates the rockfall.
The coefficient of restitution tests were completed by dropping rocks from known heights onto a horizontal surface. The scale of the tests was reduced for practicality. Ten rocks of varying shapes were collected for the tests, then weighed, measured, and photographed. The selected rocks are shown in Figure 2.
Rock 1: 0.85 kg Rock 2: 0.56 kg Rock 3: 1.46 kg Rock 4: 0.35 kg Rock 5: 0.73 kg
s
Rock 6: 0.90 kg Rock 7: 0.49 kg Rock 8: 2.08 kg Rock 9: 0.50 kg Rock 10: 0.53 kg
Four floor surfaces typically encountered in the pit were selected (Figure 3):
Pit floor.
Haul road.
Catch berm.
Hard rock surfaces.
Pit floor Haul road Catch berm Hard rock
The rocks were dropped from 1.4 m, and the rebound distance measured from a scaled whiteboard. Due to the speed at which the rocks fell, each drop test was filmed and the rebound distance measured from the video in slow motion. Ten drops were undertaken for each selected rock on each of the four surfaces giving
Rockfall
Slope Stability 2013, Brisbane, Australia 5
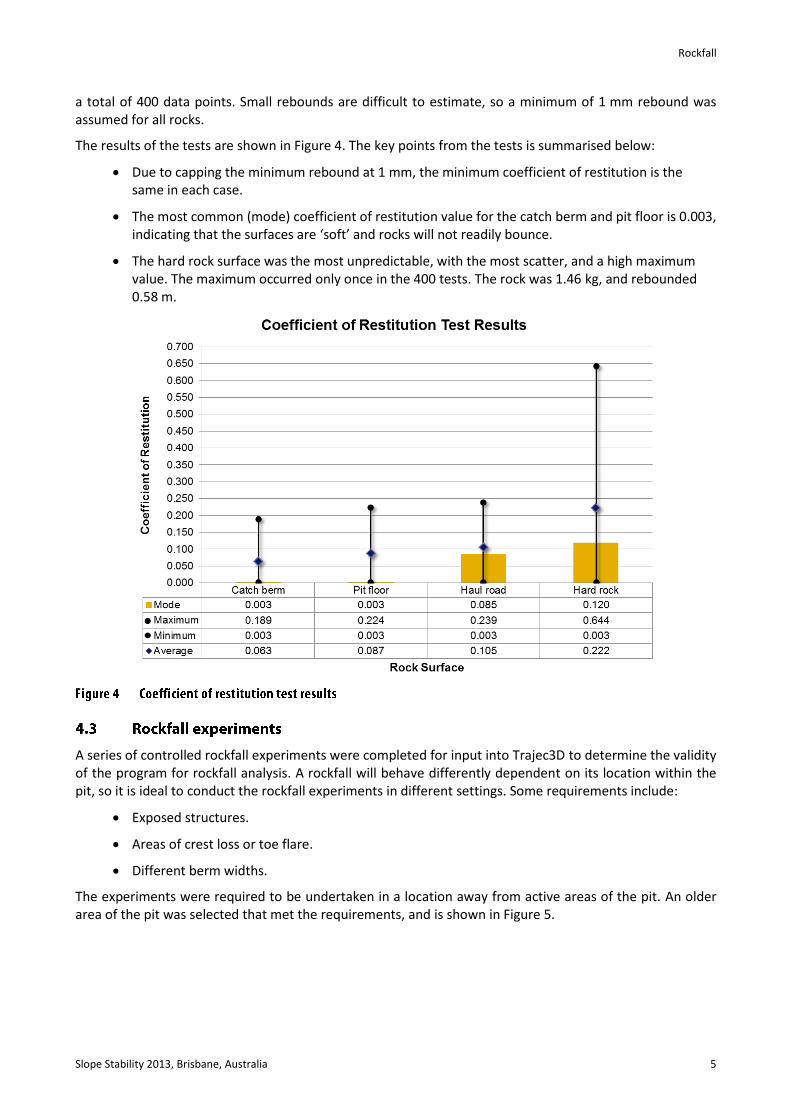
a total of 400 data points. Small rebounds are difficult to estimate, so a minimum of 1 mm rebound was assumed for all rocks.
The results of the tests are shown in Figure 4. The key points from the tests is summarised below:
Due to capping the minimum rebound at 1 mm, the minimum coefficient of restitution is the same in each case.
The most common (mode) coefficient of restitution value for the catch berm and pit floor is 0.003, indicating that the surfaces are ‘soft’ and rocks will not readily bounce.
The hard rock surface was the most unpredictable, with the most scatter, and a high maximum value. The maximum occurred only once in the 400 tests. The rock was 1.46 kg, and rebounded 0.58 m.
A series of controlled rockfall experiments were completed for input into Trajec3D to determine the validity of the program for rockfall analysis. A rockfall will behave differently dependent on its location within the pit, so it is ideal to conduct the rockfall experiments in different settings. Some requirements include:
Exposed structures.
Areas of crest loss or toe flare.
Different berm widths.
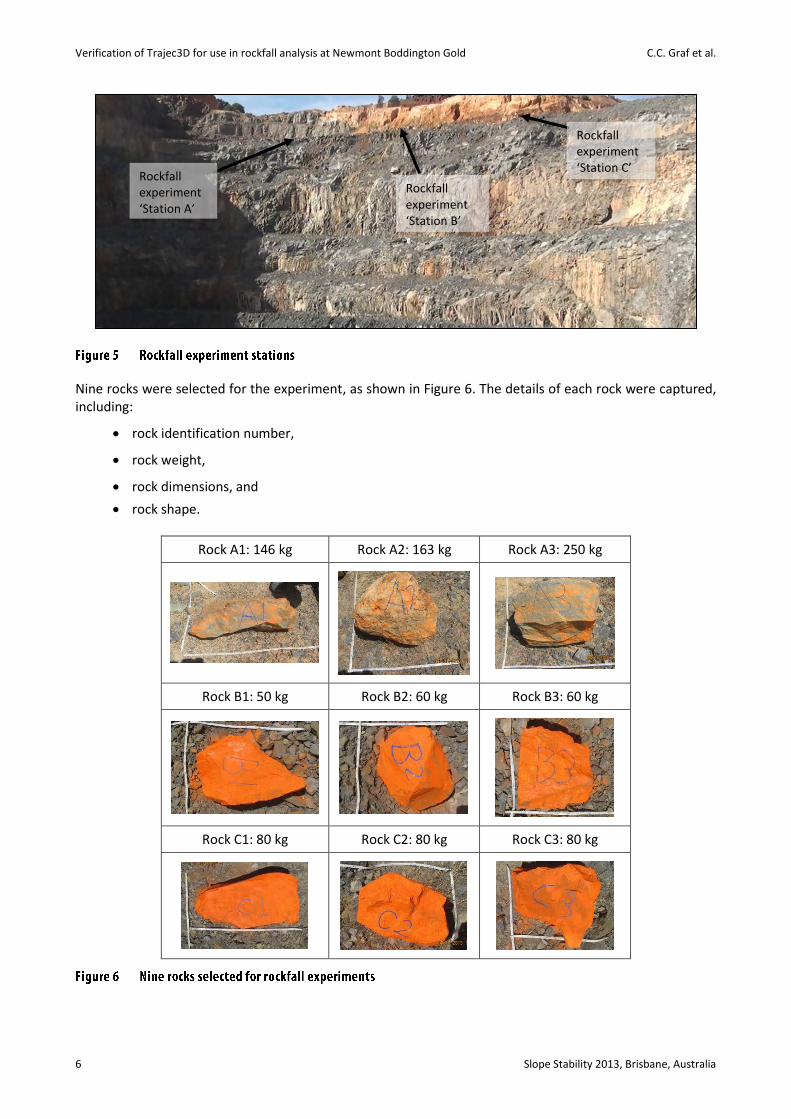
The experiments were required to be undertaken in a location away from active areas of the pit. An older area of the pit was selected that met the requirements, and is shown in Figure 5.
Verification of Trajec3D for use in rockfall analysis at Newmont Boddington Gold C.C. Graf et al.
6 Slope Stability 2013, Brisbane, Australia
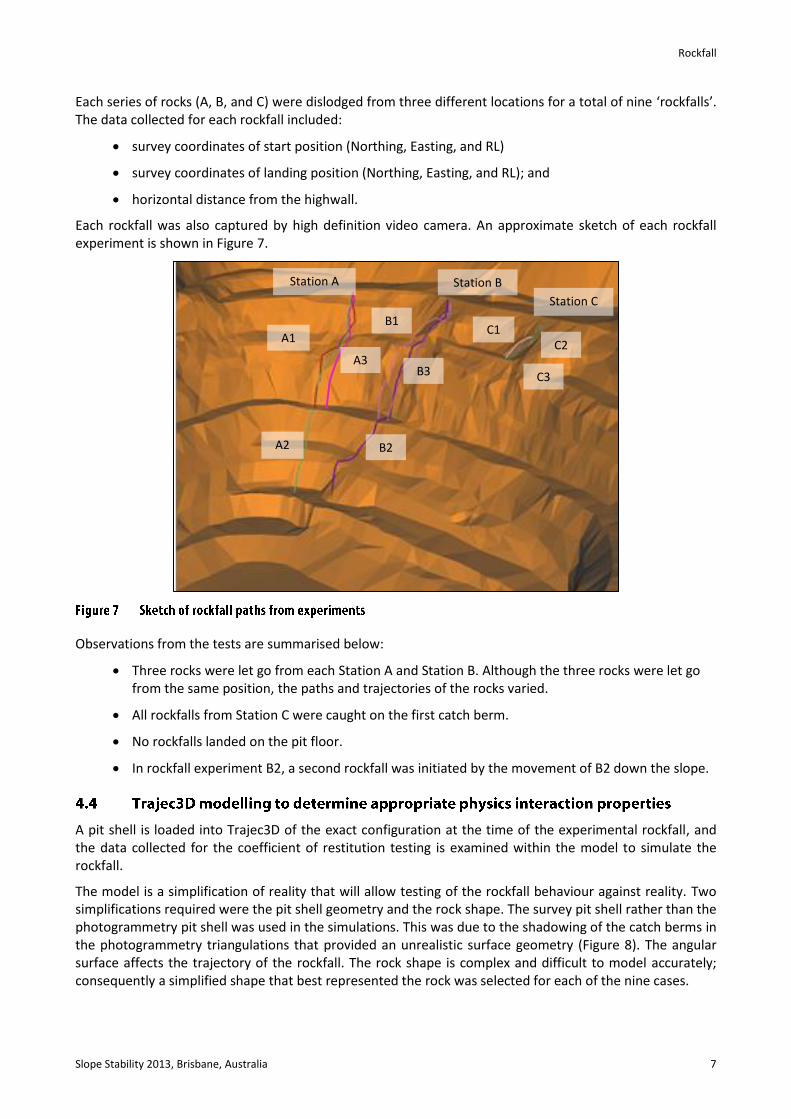
Nine rocks were selected for the experiment, as shown in Figure 6. The details of each rock were captured, including:
rock identification number,
rock weight,
rock dimensions, and
rock shape.
Rock A1: 146 kg Rock A2: 163 kg Rock A3: 250 kg
Rock B1: 50 kg Rock B2: 60 kg Rock B3: 60 kg
Rock C1: 80 kg Rock C2: 80 kg Rock C3: 80 kg
Rockfall experiment ‘Station B’
Rockfall experiment ‘Station C’
Rockfall experiment ‘Station A’
Rockfall
Slope Stability 2013, Brisbane, Australia 7
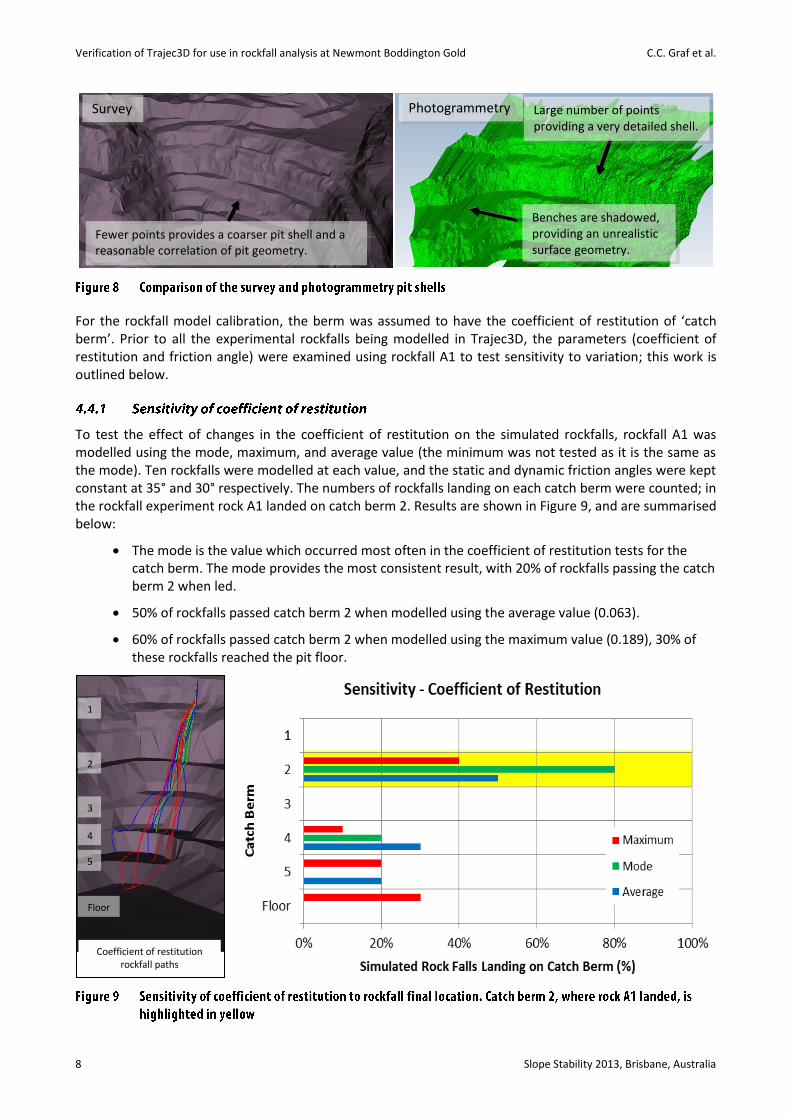
Each series of rocks (A, B, and C) were dislodged from three different locations for a total of nine ‘rockfalls’. The data collected for each rockfall included:
survey coordinates of start position (Northing, Easting, and RL)
survey coordinates of landing position (Northing, Easting, and RL); and
horizontal distance from the highwall.
Each rockfall was also captured by high definition video camera. An approximate sketch of each rockfall experiment is shown in Figure 7.
Observations from the tests are summarised below:
Three rocks were let go from each Station A and Station B. Although the three rocks were let go from the same position, the paths and trajectories of the rocks varied.
All rockfalls from Station C were caught on the first catch berm.
No rockfalls landed on the pit floor.
In rockfall experiment B2, a second rockfall was initiated by the movement of B2 down the slope.
A pit shell is loaded into Trajec3D of the exact configuration at the time of the experimental rockfall, and the data collected for the coefficient of restitution testing is examined within the model to simulate the rockfall.
The model is a simplification of reality that will allow testing of the rockfall behaviour against reality. Two simplifications required were the pit shell geometry and the rock shape. The survey pit shell rather than the photogrammetry pit shell was used in the simulations. This was due to the shadowing of the catch berms in the photogrammetry triangulations that provided an unrealistic surface geometry (Figure 8). The angular surface affects the trajectory of the rockfall. The rock shape is complex and difficult to model accurately; consequently a simplified shape that best represented the rock was selected for each of the nine cases.
Station A
A1
A2
Station B
Station C
B1
B2
B3
C1 C2
C3
A3
Verification of Trajec3D for use in rockfall analysis at Newmont Boddington Gold C.C. Graf et al.
8 Slope Stability 2013, Brisbane, Australia
For the rockfall model calibration, the berm was assumed to have the coefficient of restitution of ‘catch berm’. Prior to all the experimental rockfalls being modelled in Trajec3D, the parameters (coefficient of restitution and friction angle) were examined using rockfall A1 to test sensitivity to variation; this work is outlined below.
To test the effect of changes in the coefficient of restitution on the simulated rockfalls, rockfall A1 was modelled using the mode, maximum, and average value (the minimum was not tested as it is the same as the mode). Ten rockfalls were modelled at each value, and the static and dynamic friction angles were kept constant at 35° and 30° respectively. The numbers of rockfalls landing on each catch berm were counted; in the rockfall experiment rock A1 landed on catch berm 2. Results are shown in Figure 9, and are summarised below:
The mode is the value which occurred most often in the coefficient of restitution tests for the catch berm. The mode provides the most consistent result, with 20% of rockfalls passing the catch berm 2 when led.
50% of rockfalls passed catch berm 2 when modelled using the average value (0.063).
60% of rockfalls passed catch berm 2 when modelled using the maximum value (0.189), 30% of these rockfalls reached the pit floor.
Benches are shadowed, providing an unrealistic surface geometry.
Photogrammetry Survey Large number of points providing a very detailed shell.
Fewer points provides a coarser pit shell and a reasonable correlation of pit geometry.
Coefficient of restitution rockfall paths
1
2
3
4
5
Floor
Rockfall
Slope Stability 2013, Brisbane, Australia 9
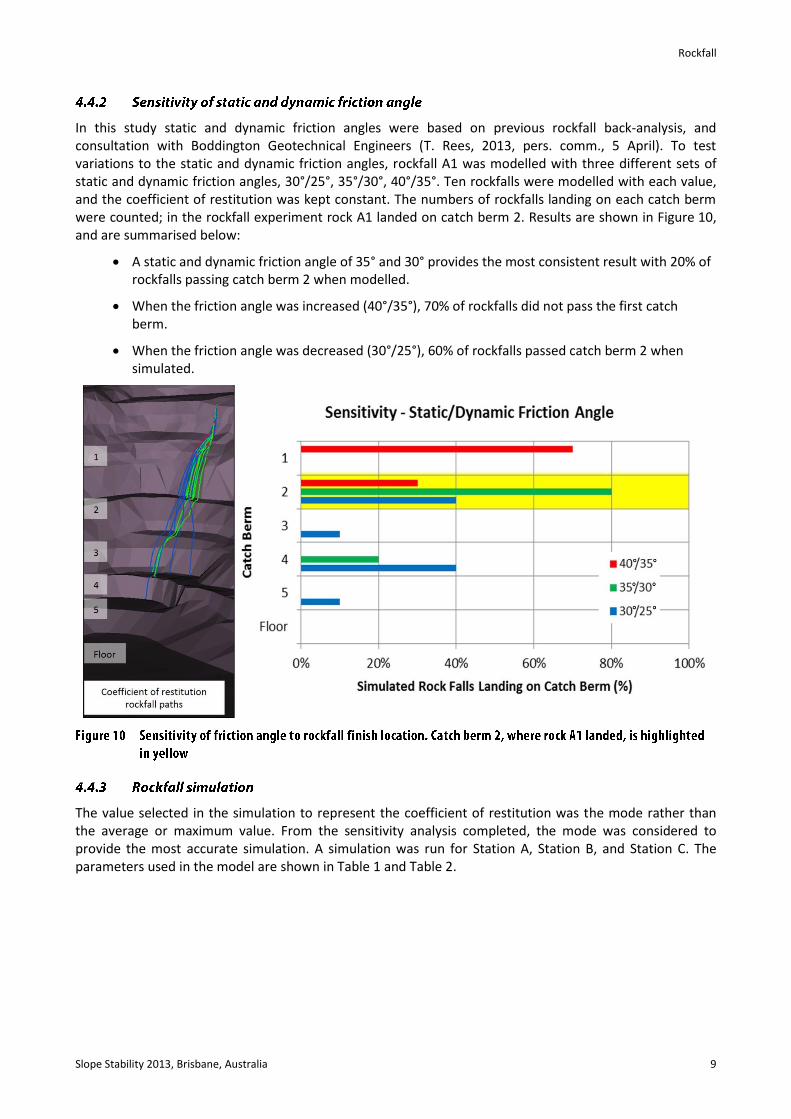
In this study static and dynamic friction angles were based on previous rockfall back-analysis, and consultation with Boddington Geotechnical Engineers (T. Rees, 2013, pers. comm., 5 April). To test variations to the static and dynamic friction angles, rockfall A1 was modelled with three different sets of static and dynamic friction angles, 30°/25°, 35°/30°, 40°/35°. Ten rockfalls were modelled with each value, and the coefficient of restitution was kept constant. The numbers of rockfalls landing on each catch berm were counted; in the rockfall experiment rock A1 landed on catch berm 2. Results are shown in Figure 10, and are summarised below:
A static and dynamic friction angle of 35° and 30° provides the most consistent result with 20% of rockfalls passing catch berm 2 when modelled.
When the friction angle was increased (40°/35°), 70% of rockfalls did not pass the first catch berm.
When the friction angle was decreased (30°/25°), 60% of rockfalls passed catch berm 2 when simulated.
The value selected in the simulation to represent the coefficient of restitution was the mode rather than the average or maximum value. From the sensitivity analysis completed, the mode was considered to provide the most accurate simulation. A simulation was run for Station A, Station B, and Station C. The parameters used in the model are shown in Table 1 and Table 2.

Verification of Trajec3D for use in rockfall analysis at Newmont Boddington Gold C.C. Graf et al.
10 Slope Stability 2013, Brisbane, Australia
Parameter Value
Static friction angle 35⁰
Dynamic friction angle 30⁰
Coefficient of restitution 0.003
Rock Modelled Geometry
Rock A1 Flat rectangular prism
Rock A2 Cube
Rock A3 Rectangular prism
Rock B1 Cube
Rock B2 Cube
Rock B3 Cube
Rock C1 Flat rectangular prism
Rock C2 Rectangular prism
Rock C3 Rectangular prism
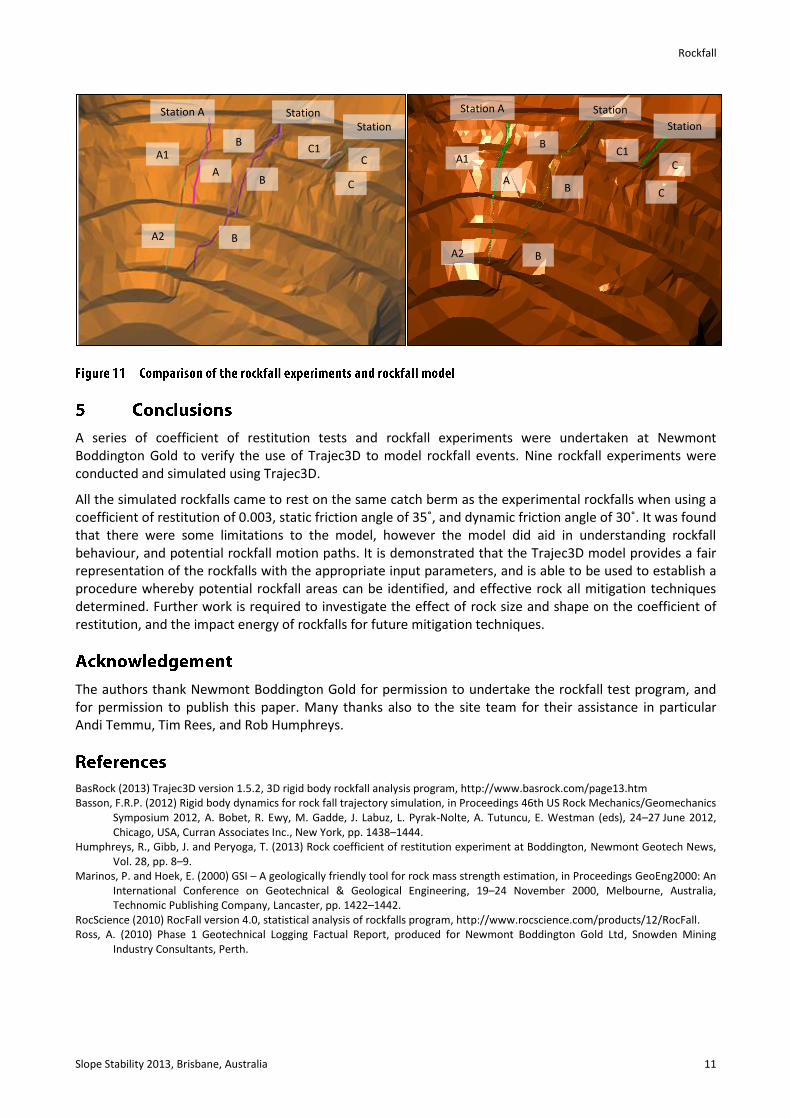
Each rockfall was simulated using these parameters and compared to the rockfall experiment outcomes (Figure 11). All the simulated rockfalls came to rest on the same catch berm as the experimental rockfalls, however landing position coordinates did not match exactly. This difference may be due to:
Rockfalls were pushed and had an initial start velocity. A start velocity cannot be set in Trajec3D. The initial start velocity will assist the rock to overcome initial friction, and influence the direction of motion of the rock.
Simplification of the pit shell geometry and rock shape. The interaction between the rock and pit geometry will affect the direction of the rockfall. If the pit shell is too coarse, the rock may follow a different trajectory to reality.
Whilst these aspects are limitations of the model, the model does aid in understanding rockfall behaviour, and potential rockfall motion paths. It is believed that the Trajec3D model provides a fair representation of the rockfalls, and could be used to establish a procedure whereby potential rockfall areas can be identified, and effective rockfall mitigation techniques determined.
Rockfall
Slope Stability 2013, Brisbane, Australia 11
A series of coefficient of restitution tests and rockfall experiments were undertaken at Newmont Boddington Gold to verify the use of Trajec3D to model rockfall events. Nine rockfall experiments were conducted and simulated using Trajec3D.
All the simulated rockfalls came to rest on the same catch berm as the experimental rockfalls when using a coefficient of restitution of 0.003, static friction angle of 35˚, and dynamic friction angle of 30˚. It was found that there were some limitations to the model, however the model did aid in understanding rockfall behaviour, and potential rockfall motion paths. It is demonstrated that the Trajec3D model provides a fair representation of the rockfalls with the appropriate input parameters, and is able to be used to establish a procedure whereby potential rockfall areas can be identified, and effective rock all mitigation techniques determined. Further work is required to investigate the effect of rock size and shape on the coefficient of restitution, and the impact energy of rockfalls for future mitigation techniques.
The authors thank Newmont Boddington Gold for permission to undertake the rockfall test program, and for permission to publish this paper. Many thanks also to the site team for their assistance in particular Andi Temmu, Tim Rees, and Rob Humphreys.
BasRock (2013) Trajec3D version 1.5.2, 3D rigid body rockfall analysis program, http://www.basrock.com/page13.htm Basson, F.R.P. (2012) Rigid body dynamics for rock fall trajectory simulation, in Proceedings 46th US Rock Mechanics/Geomechanics
Symposium 2012, A. Bobet, R. Ewy, M. Gadde, J. Labuz, L. Pyrak-Nolte, A. Tutuncu, E. Westman (eds), 24–27 June 2012, Chicago, USA, Curran Associates Inc., New York, pp. 1438–1444.
Humphreys, R., Gibb, J. and Peryoga, T. (2013) Rock coefficient of restitution experiment at Boddington, Newmont Geotech News, Vol. 28, pp. 8–9.
Marinos, P. and Hoek, E. (2000) GSI – A geologically friendly tool for rock mass strength estimation, in Proceedings GeoEng2000: An International Conference on Geotechnical & Geological Engineering, 19–24 November 2000, Melbourne, Australia, Technomic Publishing Company, Lancaster, pp. 1422–1442.
RocScience (2010) RocFall version 4.0, statistical analysis of rockfalls program, http://www.rocscience.com/products/12/RocFall. Ross, A. (2010) Phase 1 Geotechnical Logging Factual Report, produced for Newmont Boddington Gold Ltd, Snowden Mining
Industry Consultants, Perth.
Station A
A1
A2
A3
Station B Station
C B1
B2
B3
C1 C2
C3
Station A
A1
A2
Station B Station
C B1
B2
B3
C1 C2
C3
A3

Verification of Trajec3D for use in rockfall analysis at Newmont Boddington Gold C.C. Graf et al.
12 Slope Stability 2013, Brisbane, Australia