cattle industry “situation and outlook ” tscra march, 2012
TRANSCRIPT
Cattle Industry“Situation and
Outlook ”TSCRA
March, 2012


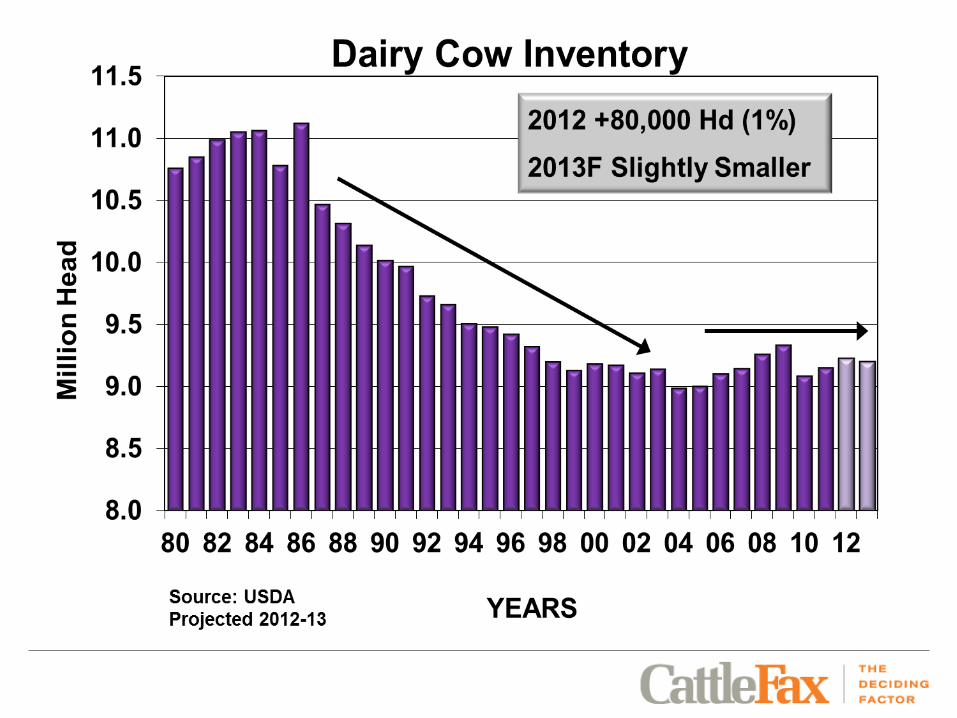
2012 -967,000 Hd. (3%)2013F Flat


Slaughter Reductions2013 vs. 2011
•1.4 Million Non-Fed
•.8 Million Fed
•2.2 million Total
•8,500/day
•2- 4,000+/day packing plants
•1-4,000+/day and 4-1,000+/day packing plants


A Long-Term Chart…
Source: U.S. Dept of Census, various published research estimates


U.S. Dollar Index
The weak dollar has stimulated exports
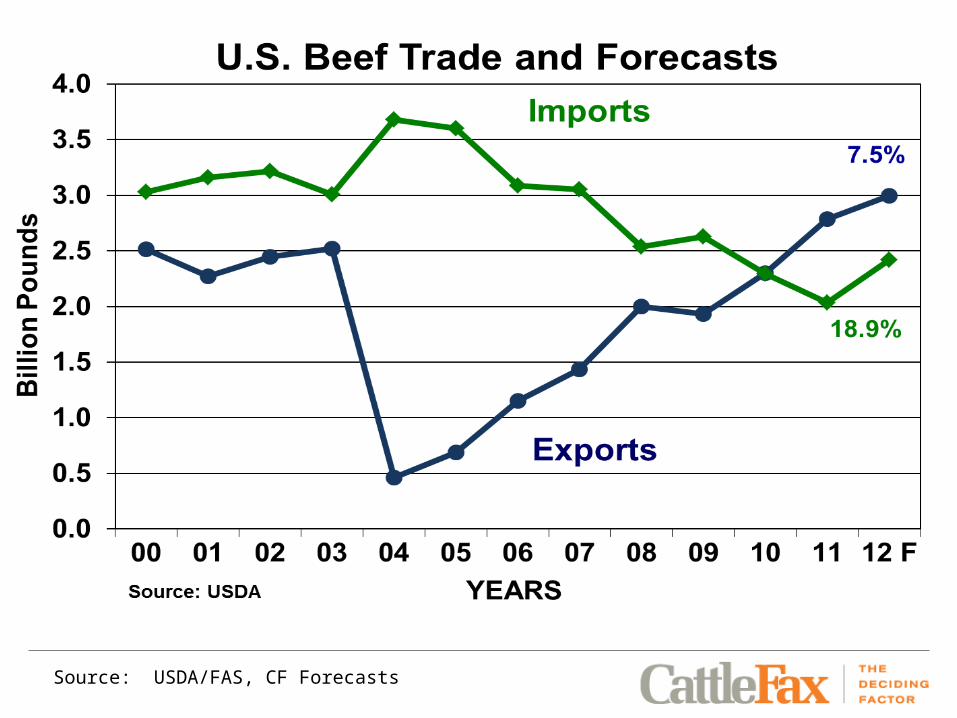
Source: USDA/FAS, CF Forecasts


The U.S. exports 18 percent of totalred meat and poultry production.

United States28%
Brazil22%EU-27
15%
Canada7%
Australia6%
Others22%
2011 Global Meat/Poultry ExportsTotal: 24 million metric tons (53.4 bil
lbs.) 15 billion pounds of U.S.beef, pork and poultrywere exported in 2011.
2.8 bil beef, 5.2 bil pork, 7 bil poultry


Demand
Retail- Higher prices will limit movement and featuring. Competition between proteins.
Food Service- Improvements noted in SSS. Fast food ,casual dinning, high end.
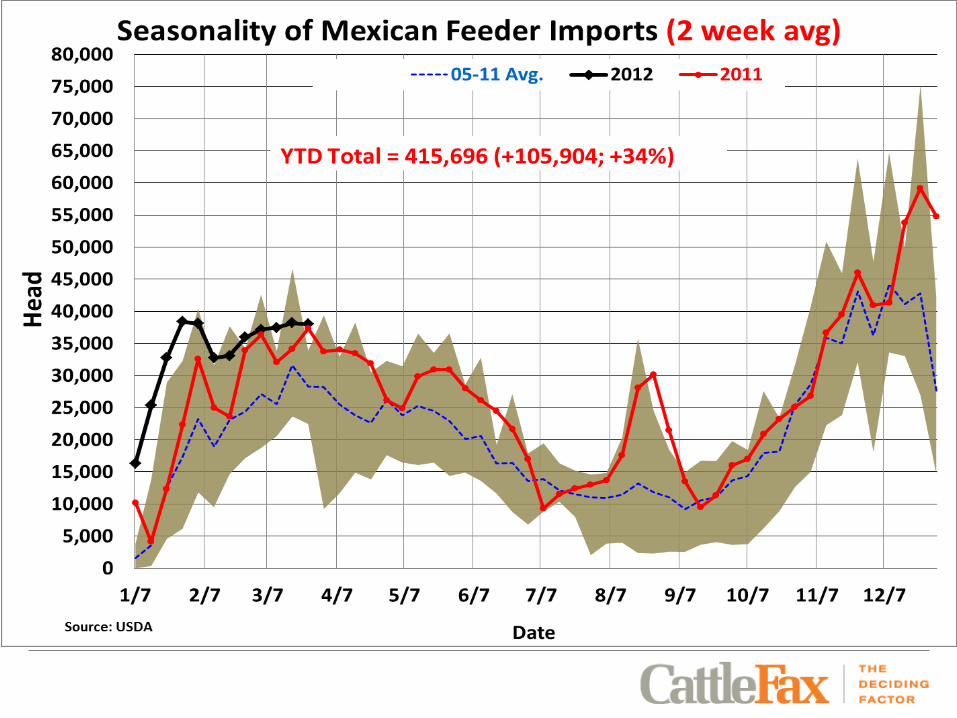
Exports- Slowing YOY gains, Low Dollar, Challenges with access.Imports- Increasing, High domestic prices vs. tighter Global supplies.

2012 Retail Protein Prices
Feb.Percent Change
vs. Year AgoChoice Beef $5.05 +9.2%
All-Fresh Beef $4.61 +6.1%
Ground Beef $2.95 +10.8%
Composite Pork $3.50 +6.5%
Composite Broiler $1.83 +2.9%Fresh Whole Chicken $1.36 +7.1%Boneless Breast $3.11 -2%
Whole Frozen Turkey $1.67 +9.5%Source: USDA and BLS


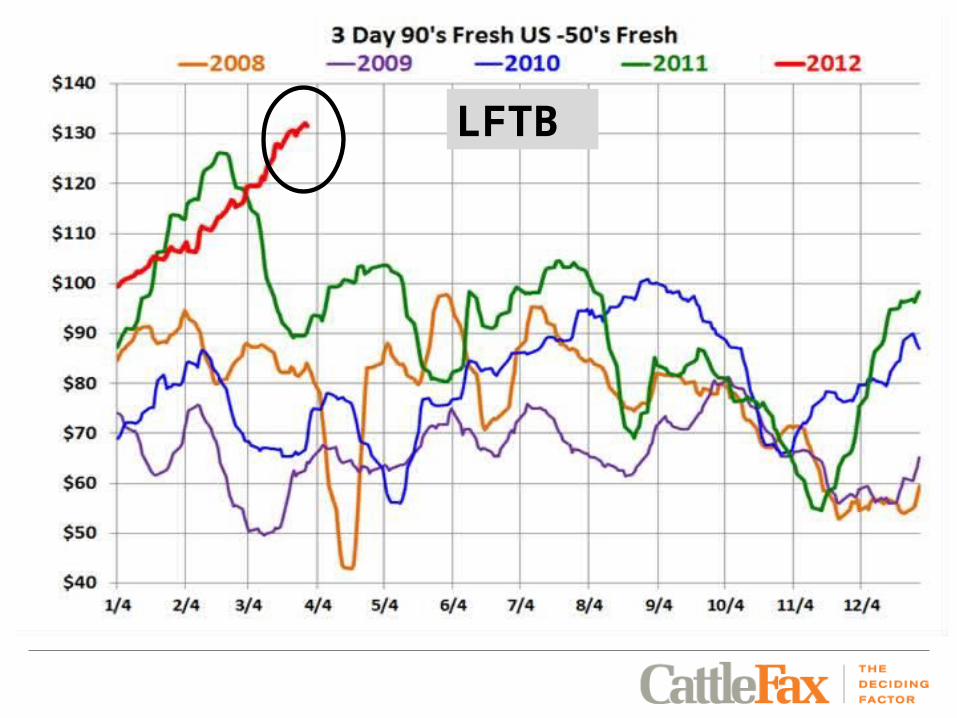
LFTB

1Q 2012 vs. 1Q 2011
2011 vs. 2010
2010 vs. 2006
90s Trimmings
+10% +18% +20%
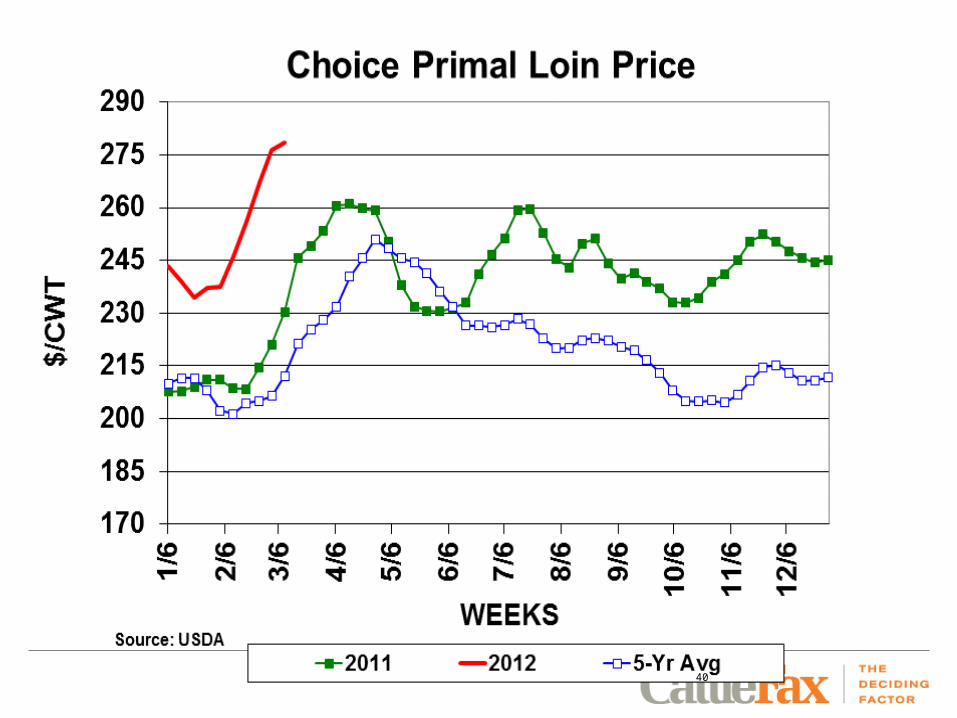
Chuck +1% +20% +26%Round +.5% +19% +13%Rib +11% +11% +3%Loin +16% +11% -9%
Price Changes Beef

40
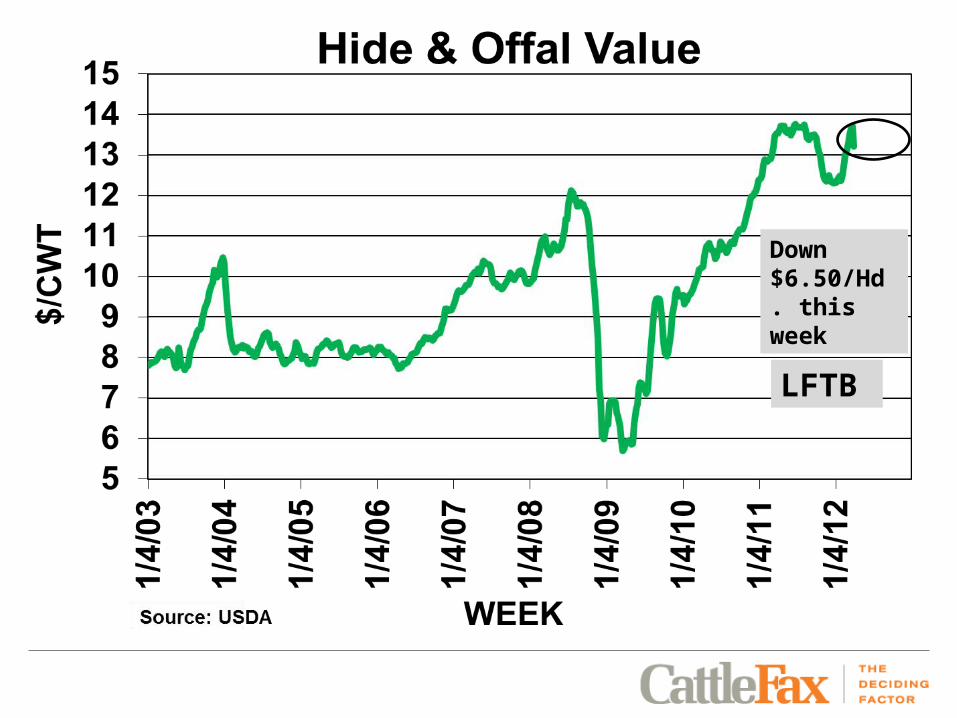
Down $6.50/Hd. this week
LFTB


Per Capita Net Beef Supply Demand Change vs. Prior Year
-5% -2% +0% +2% +5%58 $109.9
6$112.98 $114.99 $117.01 $120.03
57 $112.93
$115.96 $117.97 $119.99 $123.01
56 $115.91
$118.93 $120.95 $122.96 $125.99
55 $118.89
$121.91 $123.93 $125.94 $128.96
54 $121.89
$124.91 $126.93 $128.94 $131.96
53 $124.87
$127.89 $129.90 $131.92 $134.94
52 $127.82
$130.85 $132.86 $134.88 $137.90
51 $130.80
$133.83 $135.84 $137.86 $140.88
50 $133.78
$136.80 $138.82 $140.83 $143.86
2012 Fed Price projections based on Changes in Supply and Demand


Record high prices for all class’s of cattle


2012 Profitability
•Feedlot - Negative for the year. Risk management a must.
•Stocker/Backgrounder- Still Positive- But narrow margins are expected.
•Cow/Calf- Positive margins, record high calf values more than offset increasing input cost.

Markets work! The industry will expand.
More structural change on the way.
Global market access is crucial.
Production cost increases staggering, will moderate.
Record amount of volatility, risk, capital.
“Manage for a margin” don’t “guess markets”
Great time to be in Ag, but you must adapt to a global market environment.
SUMMARY

Thank You
Have a Profitable 2012