www.lmic.info james robb director – lmic 655 parfet street suite e310 lakewood, co 80215-5517 beef...
Post on 21-Dec-2015
213 views
TRANSCRIPT

www.lmic.info
James RobbDirector – LMIC655 Parfet Street
Suite E310Lakewood, CO 80215-5517
Beef and Cattle --- Market Situation and Outlook
Midwest, Great Plains and Western Outlook Conference
August 14-15, 2007

Livestock Marketing Information Center

Livestock Marketing Information Center
BOXED BEEF CUTOUT VALUEChoice 600-900 Lbs. Carcass, Weekly
120
130
140
150
160
170
180
JAN APR JUL OCT
$ Per Cwt.
Avg.2001-05
2006
2007

Livestock Marketing Information Center
STEER HIDE AND OFFAL VALUELive Animal Basis, Weekly
7.60
8.10
8.60
9.10
9.60
10.10
10.60
JAN APR JUL OCT
$ Per Cwt.
Avg.2001-05
2006
2007

Livestock Marketing Information Center
LIVE TO CUTOUT BEEF PRICE SPREADMonthly
90
110
130
150
170
190
210
230
250
JAN MAR MAY JUL SEP NOV
$ Per Head
Avg.2001-05
2006
2007
Livestock Marketing Information Center
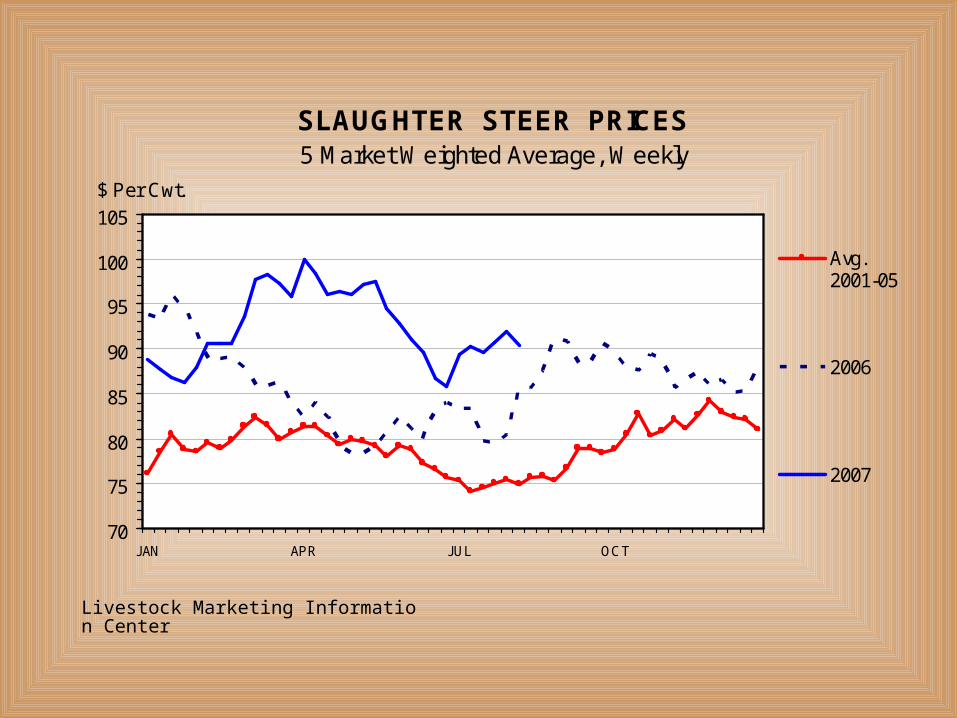
SLAUGHTER STEER PRICES5 Market Weighted Average, Weekly
70
75
80
85
90
95
100
105
JAN APR JUL OCT
$ Per Cwt.
Avg.2001-05
2006
2007

Livestock Marketing Information Center
MED. & LRG. #1 STEER CALF PRICES400-500 Pounds, Southern Plains, Weekly
100
110
120
130
140
150
160
JAN APR JUL OCT
$ Per Cwt.
Avg.2001-05
2006
2007

Livestock Marketing Information Center
MED. & LRG. #1 STEER CALF PRICES500-600 Pounds, Southern Plains, Weekly
95
100
105
110
115
120
125
130
135
140
JAN APR JUL OCT
$ Per Cwt.
Avg.2001-05
2006
2007

Livestock Marketing Information Center
MED. & LRG. #1 FEEDER STEER PRICES700-800 Pounds, Southern Plains, Weekly
85
90
95
100
105
110
115
120
125
JAN APR JUL OCT
$ Per Cwt.
Avg.2001-05
2006
2007

Livestock Marketing Information Center
FEEDER STEER vs FED STEER PRICES700-800 Lbs. Minus Slaughter Steer, S. Plains, Weekly
5
10
15
20
25
30
35
40
45
JAN APR JUL OCT
$ Per Cwt.
Avg.2001-05
2006
2007

Livestock Marketing Information Center
SLAUGHTER COW PRICESSouthern Plains, 85-90% Lean, Weekly
40
42
44
46
48
50
52
54
56
58
JAN APR JUL OCT
$ Per Cwt.
Avg.2001-05
2006
2007

Livestock Marketing Information Center
COMMERCIAL BEEF PRODUCTIONQuarterly
5.4
5.8
6.2
6.6
7.0
JAN-MAR APR-JUN JUL-SEP OCT-DEC
Bil. Pounds
Avg.2001/05
2006
2007
2008

Livestock Marketing Information Center
U S BEEF AND VEAL EXPORTSCarcass Weight, Annual
0.0
0.5
1.0
1.5
2.0
2.5
3.0
1983 1986 1989 1992 1995 1998 2001 2004 2007
Bil. Pounds

Livestock Marketing Information Center
U S BEEF CONSUMPTIONPer Capita, Retail Weight, Annual
55
60
65
70
75
80
1983 1986 1989 1992 1995 1998 2001 2004 2007
Pounds

Livestock Marketing Information Center
ANNUAL AVERAGE CATTLE PRICES
45
55
65
75
85
95
105
115
125
135
1979 1981 1983 1985 1987 1989 1991 1993 1995 1997 1999 2001 2003 2005 2007
$ Per Cwt
500-600lbSteerCalves
700-800lbFeederSteers
FedSteers

Livestock Marketing Information Center

Livestock Marketing Information Center
OMAHA CORN PRICESWeekly
1.50
2.00
2.50
3.00
3.50
4.00
4.50$ Per Bu.
Avg.2001-05
2006
2007

Livestock Marketing Information Center
U S TOTAL CORN SUPPLY AND PRICECrop Year
6
7
8
9
10
11
12
13
14
15
1983 1986 1989 1992 1995 1998 2001 2004 2007
Bil. Bushels
1.25
1.50
1.75
2.00
2.25
2.50
2.75
3.00
3.25
3.50$ Per Bushel
Supply
Price

Livestock Marketing Information Center
KANSAS FEEDLOT CLOSEOUTSFeeding Costs per Cwt, Steers
48
53
58
63
68
73
78
83
Jan Feb Mar Apr May Jun Jul Aug Sep Oct Nov Dec
$ Per Cwt.
Avg.2001/05
2006
2007
Livestock Marketing Information Center
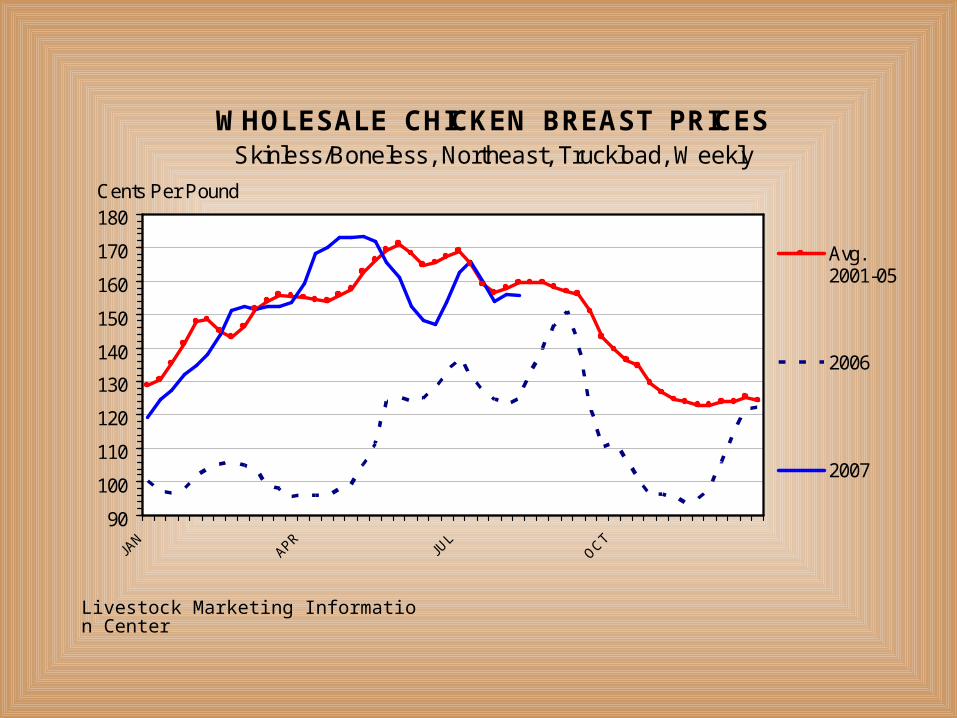
WHOLESALE CHICKEN BREAST PRICESSkinless/Boneless, Northeast, Truckload, Weekly
90
100
110
120
130
140
150
160
170
180Cents Per Pound
Avg.2001-05
2006
2007

Livestock Marketing Information Center
BROILER EGGS SETWeekly
180
185
190
195
200
205
210
215
220
225Mil. Eggs
Avg.2001-05
2006
2007

Livestock Marketing Information Center
COMMERCIAL MEAT & POULTRY PRODUCTION
By Type of Meat, Annual
0
10
20
30
40
50
60
70
80
90
100
1983 1985 1987 1989 1991 1993 1995 1997 1999 2001 2003 2005 2007
Bil. Pounds
Turkey
Chicken
Lamb &Veal
Pork
Beef

Livestock Marketing Information Center

Livestock Marketing Information Center
COW-CALF RETURNS AND CATTLE INVENTORY
U.S., Annual
-100
-50
0
50
100
150
1978 1980 1982 1984 1986 1988 1990 1992 1994 1996 1998 2000 2002 2004 2006
$ Per Cow
90
95
100
105
110
115
Mil. Head
Cow-CalfReturns
CattleInventoryJan 1

Livestock Marketing Information Center
HEIFERS HELD AS BEEF COW REPLACEMENTS
July 1, U.S.
3
4
5
6
7
1977 1980 1983 1986 1989 1992 1995 1998 2001 2004 2007
Mil. Head
-6 %

Livestock Marketing Information Center
MAJOR U S BEEF IMPORT SOURCESCarcass Weight, Annual
0
200
400
600
800
1000
1200
Australia New Zealand Canada Argentina
Mil. Pounds
Avg.2000/04
2005
2006

Livestock Marketing Information Center
103 to 391 (2)-2 to 103 (4)
-52 to -2 (3)
CHANGE IN BEEF COW NUMBERSJANUARY 1, 1998 TO JANUARY 1, 2007
Canada, 1000 Head
-0
Prince Ed. Isl.
Canada
-3
Nova Scotia -2
0
-14
-52
103391
20916
646

Livestock Marketing Information Center
0.1 to 0.9 (2)-29 to 0.1 (4)-75.5 to -29 (4)
CHANGE IN BEEF COW NUMBERSJANUARY 1, 2006 TO JANUARY 1, 2007
Canada, 1000 Head
Canada
Prince Ed. Isl.
0
Nova Scotia 1
-12-29
-51-76
-63-35
-263
0
0
Livestock Marketing Information Center
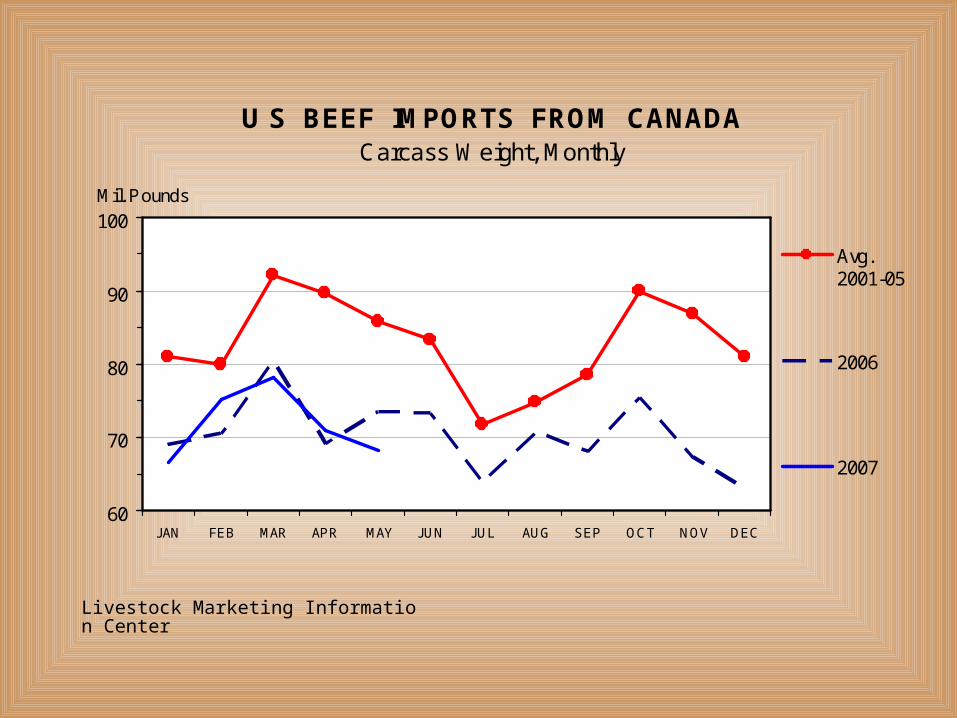
U S BEEF IMPORTS FROM CANADACarcass Weight, Monthly
60
70
80
90
100
JAN FEB MAR APR MAY JUN JUL AUG SEP OCT NOV DEC
Mil. Pounds
Avg.2001-05
2006
2007

Livestock Marketing Information Center
U.S. EXPORTS OF BEEF MUSCLE CUTSWeekly
0
1
2
3
4
5
6
7
8
9
Jan-03 Jul-03 Jan-04 Jul-04 Jan-05 Jul-05 Jan-06 Jul-06 Jan-07 Jul-07
1000 MT
Canada
Japan
Mexico
KoreanRep.

Livestock Marketing Information Center
U S BEEF INDUSTRY NET EXPORT VALUESAnnual
-3
-2
-1
0
1
2
3
1981 1984 1987 1990 1993 1996 1999 2002 2005
Bil. $
LiveCattle
Beef &Veal
Hides &Skins
Tallow,Grease &Var Meat
Total

Livestock Marketing Information Center
TOTAL COW SLAUGHTERFederally Inspected, Weekly
70
80
90
100
110
120
130Thou. Head
Avg.2001-05
2006
2007

Livestock Marketing Information Center
HEIFER SLAUGHTERFederally Inspected, Weekly
150
160
170
180
190
200
210
220
230
240Thou. Head
Avg.2001-05
2006
2007

Livestock Marketing Information Center
LIVE WEIGHT -- STEER AND HEIFERTexas/Oklahoma Panhandle Area, Weekly
1140
1160
1180
1200
1220
1240
1260
1280Pounds
Avg.2001-05
2006
2007
Livestock Marketing Information Center

Livestock Marketing Information Center
QTRLY GROSS DOMESTIC PRODUCT (GDP)Real Dollar (2000) Change from Previous Quarter
-0.5
0.0
0.5
1.0
1.5
2.0
1992 1994 1996 1998 2000 2002 2004 2006
Percent Change

Livestock Marketing Information Center
RETAIL CHOICE BEEF DEMAND INDEXAnnual, Using CPI 1980=100
10094
88 8683
79 7670 69
66 65 6359 58 56 55 53 51 50 52 53 56 55
5963 61
57
0
20
40
60
80
100
120
1980 1982 1984 1986 1988 1990 1992 1994 1996 1998 2000 2002 2004 2006
Index Value

Livestock Marketing Information Center
RETAIL CHOICE BEEF DEMAND INDEXSecond Quarter, Using CPI 1980=100
10093 90 90
86 8582
74 7470 70 68
64 61 60 58 57 54 53 55 5760 60 62
67 6761 62
0
20
40
60
80
100
120
1980 1982 1984 1986 1988 1990 1992 1994 1996 1998 2000 2002 2004 2006
Index Value

Livestock Marketing Information Center

Livestock Marketing Information Center
CHOICE MINUS SELECT BEEF PRICESCarcass Cutout Value 600-900 Lbs., Weekly
0
5
10
15
20
25
JAN APR JUL OCT
$ Per Cwt.
Avg.2001-05
2006
2007

Livestock Marketing Information Center
BEEF GRADED CHOICEAs a Percent of Beef Graded, Weekly
48
49
50
51
52
53
54
55
56
57
Percent
Avg.2001-05
2006
2007

Livestock Marketing Information Center
CUTOUT VALUEMonthly
110
120
130
140
150
160
170
180
190
200
Aug-06 Oct-06 Dec-06 Feb-07 Apr-07 Jun-07
$/Cwt
Prime
Branded
Choice
Select
Ungraded

Livestock Marketing Information Center
PRIMAL LOIN VALUEMonthly
120
170
220
270
320
370
Aug-06 Oct-06 Dec-06 Feb-07 Apr-07 Jun-07
$/Cwt
Prime
Branded
Choice
Select
Ungraded

Livestock Marketing Information Center
PRIMAL CHUCK VALUEMonthly
90
95
100
105
110
115
120
Aug-06 Oct-06 Dec-06 Feb-07 Apr-07 Jun-07
$/Cwt
Prime
Branded
Choice
Select
Ungraded

Livestock Marketing Information Center
LOIN VALUE COMPARISONMonthly
175
195
215
235
255
275
295
315
335
355
375
Jan-06 Mar-06 May-06 Jul-06 Sep-06 Nov-06 Jan-07 Mar-07 May-07 Jul-07
$/Cwt
Prime
Branded
Choice
Select

Livestock Marketing Information Center
WHOLESALE BEEF RIB ROLL PRICES2 In.-Lip On, Weekly
420
470
520
570
620
670
720
770$ Per Cwt.
Avg.2001-05
2006
2007

Livestock Marketing Information Center
WHOLESALE BEEF CHUCK PRICESBoneless 2 Piece, Weekly
110
120
130
140
150
160
170$ Per Cwt.
Avg.2001-05
2006
2007

Livestock Marketing Information Center
WHOLESALE BONELESS BEEF PRICESFresh, 90% Lean, Weekly
110
115
120
125
130
135
140
145
150
155
160$ Per Cwt.
Avg.2001-05
2006
2007

Livestock Marketing Information Center
CHOICE STEER PRICE vs BREAKEVENCattle Feeding, S. Plains, Monthly
55
60
65
70
75
80
85
90
95
100
105
1999 2000 2001 2002 2003 2004 2005 2006 2007
$ Per Cwt
SteerPrice
Breakeven
ProjectedBreakeven
Latest Data: July 2007

Livestock Marketing Information Center
LIVESTOCK MARKET ISSUES
• Ethanol – Corn• Domestic Economy• Export Demand (Beef, Pork, Chicken)• Mandatory COOL and Animal ID• Swift Assets• Farm Bills and Other Legislation• Again Watch Poultry!

Livestock Marketing Information Center
Thank You