cash flow forecast fy 2019- fy 2025 maryland
TRANSCRIPT

CASH FLOW FORECAST FY 2019- FY 2025
MARYLAND TRANSPORTATION AUTHORITY(millions $)
FY 2019 FY 2020 FY 2021 FY 2022 FY 2023 FY 2024 FY 2025
REVENUES
Toll Revenues 735.9$ 746.1$ 744.9$ 754.9$ 767.4$ 776.0$ 780.8$
Concession Income 6.4 6.4 6.4 6.4 6.5 6.5 6.5
Investment Income & Other Revenue 7.5 7.0 6.7 6.7 6.6 6.7 6.7
MDOT Loan Repayment - Interest - - 0.6 1.9 3.7 3.5 3.2
BWI/Port Police Reimbursement 28.9 29.9 31.1 32.3 33.6 34.9 36.3
TOTAL REVENUES 778.7$ 789.5$ 789.7$ 802.2$ 817.8$ 827.5$ 833.5$
EXPENSES
Operating Expenses
Operating Account Budget 324.4$ 337.4$ 340.3$ 353.9$ 368.1$ 383.1$ 398.4$
Debt Service (net of capitalized interest) 92.5 91.8 99.9 113.2 135.0 158.7 166.3
Other Expenses - - - - - - -
Total Operating Expenses 416.9$ 429.2$ 440.2$ 467.1$ 503.0$ 541.7$ 564.7$
Capital Expenses
2018-2024 Total CTP 364.4$ 396.9$ 521.2$ 621.7$ 878.9$ 427.4$ 360.0$
Total Expenses (Operating and Capital) (and M&O) 781.3$ 826.1$ 961.4$ 1,088.8$ 1,381.9$ 969.2$ 924.7$
Capital Funding Sources / (Uses) and Intergovernmental:
Revenue Bonds -$ 20.0$ 130.0$ 195.0$ 465.0$ 115.0$ 80.0$
TIFIA - - 85.0 85.0 80.0 - -
Surety Policy Expense (1.0) (0.0) (0.2) (0.2) - (0.1) (0.1)
Revenue Bond Defeasance - - - - - - -
MDOT Loan / Principal Repayment (23.6) (66.4) (40.0) 3.9 8.2 8.5 8.7
VDOT Contribution / Grants - - - - 13.0 20.0
Accrual Accounting Reconciliation - - - - - - -
Total Current Year Sources (Uses) Available (24.6) (46.4) 174.8 283.7 566.2 143.3 88.6
Annual Cash Requirements 805.9$ 872.5$ 786.6$ 805.1$ 815.7$ 825.8$ 836.1$
Annual Cash Surplus/Deficit (27.2) (83.1) 3.1 (2.8) 2.1 1.7 (2.6)
Total Cash Balance 477.3$ 394.2$ 397.2$ 394.4$ 396.5$ 398.3$ 395.7$
Bonds Outstanding (≤$2.325 b. FY16-FY20; then ≤$3.0 b.) 1,548.3$ 1,530.4$ 1,707.1$ 1,944.2$ 2,442.5$ 2,505.8$ 2,523.1$
FINANCIAL COVERAGE RATIOS
Unencumbered Cash ($350 mm minimum) $433.2 $350.1 $353.2 $350.4 $352.5 $354.2 $351.6
Debt Service Coverage (>2.5x thru FY20; then >2.0x) 4.91 4.93 4.50 3.96 3.33 2.80 2.62
Rate Covenant Compliance (Legal - 1.0x) 3.96 3.97 3.63 3.20 2.68 2.26 2.11
PROJECTED FUTURE AVERAGE TOLL INCREASES:
2019-05
$0 IN FY 2019 Sept 2019 Official Forecast
$0 IN FY 2021 FY 2020 Final Op. Budget including
$0 IN FY 2023 3G exp reduction and increase ETL
- Does not show toll increases within FY19-25 period. FY 2020-25 Draft CTP
- Regardless of timing / need for system wide toll increases, tolls Oct./Nov. 2018 T&R Reports
on ICC and I-95 ETL could be revised to manage congestion Toll Modernization Proposal
2009 Bond Refunding
I:\Issuer files\Maryland\MDTA\2019\Pro Formas\2019-05 (with Authority Descriptions)

Plan of Finance - Scenario 2019-05 07/17/19
Maryland Transportation Authority Davenport & Company LLC
Years Shown Below are Fiscal Years
Scenario Number: 2019-05
Key Assumptions:
Toll IncreasesFY 19: $0.00FY 21: $0.00FY 23: $0.00
Notes:
Does not include toll increases which might be needed beyond FY 23.
Page 1
Does not indicate need for, or timing of, potential toll increases on ICC or I-95 ETL project, which would be implemented if needed for congestion management
0
100
200
300
400
500
600
700
800
900
2019 2021 2023 2025
$ M
illio
ns
Summary of OperationsToll Road System
Debt ServiceOperating ExpenseRevenue
0
200
400
600
800
1,000
1,200
1,400
2019 2021 2023 2025
$ M
illio
nsAnnual Funding
Annual Capital Requirements
MDOT FundingGarvee BondsMdTA Bonds - ICCMdTA Bonds - CTPMdTA Cash - CTP
0
1,000
2,000
3,000
4,000
5,000
6,000
7,000
8,000
9,000
10,000
2019 2021 2023 2025
$ M
illio
ns
Cumulative Utilization
Funding Capacity UtilizationToll Road System
MdTA Bonds - ICCMdTA Bonds - CTPCash Expended - CTPFunding Capacity
320
340
360
380
400
420
440
2019 2021 2023 2025
$ M
illio
ns
Liquidity
Unencumbered CashTarget
0.00
1.00
2.00
3.00
4.00
5.00
6.00
7.00
8.00
9.00
2019 2021 2023 2025
Debt Service Coverage
Covenant RequirementDebt Service CoverageCoverage Target
Summary of Operations 07/17/19
Maryland Transportation Authority Davenport & Company LLC
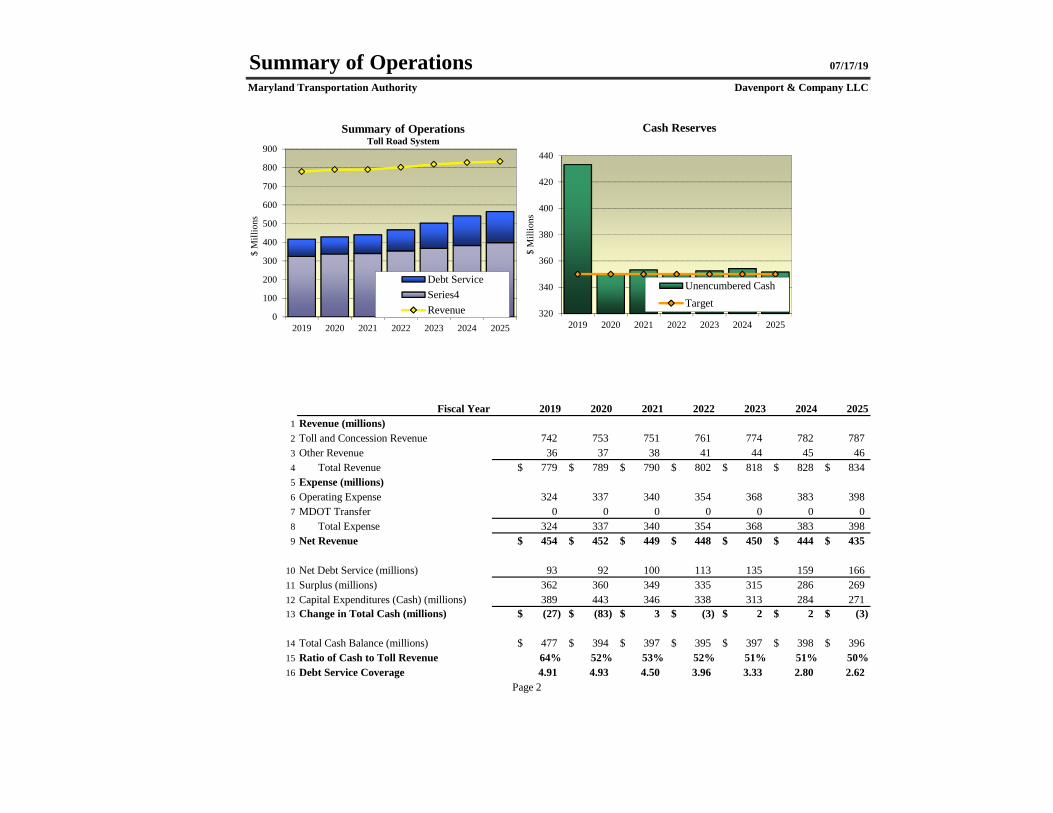
Fiscal Year ## 2019 2020 2021 2022 2023 2024 20251 Revenue (millions)2 Toll and Concession Revenue ## 742 753 751 761 774 782 7873 Other Revenue 36 36 37 38 41 44 45 464 Total Revenue # 779$ 789$ 790$ 802$ 818$ 828$ 834$ 5 Expense (millions)6 Operating Expense ## 324 337 340 354 368 383 3987 MDOT Transfer 0 0 0 0 0 0 0 08 Total Expense ## 324 337 340 354 368 383 3989 Net Revenue # 454$ 452$ 449$ 448$ 450$ 444$ 435$
10 Net Debt Service (millions) ## 93 92 100 113 135 159 16611 Surplus (millions) ## 362 360 349 335 315 286 26912 Capital Expenditures (Cash) (millions) ## 389 443 346 338 313 284 27113 Change in Total Cash (millions) # (27)$ (83)$ 3$ (3)$ 2$ 2$ (3)$
14 Total Cash Balance (millions) # 477$ 394$ 397$ 395$ 397$ 398$ 396$ 15 Ratio of Cash to Toll Revenue ## 64% 52% 53% 52% 51% 51% 50%16 Debt Service Coverage ## 4.91 4.93 4.50 3.96 3.33 2.80 2.62
Page 2
320
340
360
380
400
420
440
2019 2020 2021 2022 2023 2024 2025
$ M
illio
ns
Cash Reserves
Unencumbered CashTarget
0
100
200
300
400
500
600
700
800
900
2019 2020 2021 2022 2023 2024 2025
$ M
illio
ns
Summary of OperationsToll Road System
Debt ServiceSeries4Revenue

Outstanding Debt 07/17/19
Maryland Transportation Authority Davenport & Company LLC
Transportation Facilities Bonds: Conduit Financings:
Series 2009 528.16$ Airport Parking Revenue Bonds:Series 2010 312.42$ Series 2012A & B 136.90$ TIFIA 518.12$ Airport Car Rental Facility Bonds:Series 2012 60.27$ Series 2002 87.83$ Series 2017 169.67$ Airport PFC Bonds (4): Total 1,588.64$ Series 2012A, B, & C, 2014 190.98$
WMATA Parking Bonds: Series 2014 23.91$ Calvert Street Parking Bonds: Series 2015 18.01$ Total 457.63$
Page 3
Bonds Outstanding - June 30, 2018(Millions)
0
10
20
30
40
50
60
2018
2021
2024
2027
2030
2033
$ M
illio
ns
Conduit FinancingsAnnual Debt Service
Calvert Street Parking BondsAirport Passenger Facility BondsAirport Parking BondsWMATAAirport Car Rental Bonds
0
20
40
60
80
100
120
140
160
180
200
2018
2021
2024
2027
2030
2033
2036
2039
2042
2045
2048
$ M
illio
ns
Transportation FacilitiesAnnual Debt Service
Series 2017
TIFIA
Series 2012
Series 2010
Series 2009
Series 2008
Series 2007

Planned Debt 07/17/19
Maryland Transportation Authority Davenport & Company LLC
Fiscal Year 2019 2020 2021 2022 2023 2024 2025
1 Bonds Issued (millions)2 MdTA Bonds Issued (1) -$ 20$ 215$ 280$ 545$ 115$ 80$ 3 Garvee Bonds Issued - - - - - - - 4 Total Bonds Issued -$ 20$ 215$ 280$ 545$ 115$ 80$
5 Debt Service (millions)6 MdTA Debt Service 93$ 92$ 100$ 113$ 135$ 159$ 166$ 7 Garvee Bond Debt Service 86 51 - - - - -
8 Coverage (millions)9 Net Revenue 454$ 452$ 449$ 448$ 450$ 444$ 435$
10 MdTA Debt Service 93 92 100 113 135 159 166
11 Debt Service Coverage 4.91 4.93 4.50 3.96 3.33 2.80 2.62(1) Total Bonds Issued
Page 4
0.00
1.00
2.00
3.00
4.00
5.00
6.00
7.00
8.00
9.00
2019 2020 2021 2022 2023 2024 2025
Debt Service CoverageIncluding Planned Issues
Covenant RequirementDebt Service CoverageCoverage Target
0
50
100
150
200
250
300
350
400
2019
2020
2021
2022
2023
2024
2025
$ M
illio
ns
Debt Service PaymentsIncluding Planned Issues
Series 2007 Series 2008 Series 2009
Series 2010 Series 2012 Series 2017
TIFIA Future Debt

Capital Program 07/17/19
Maryland Transportation Authority Davenport & Company LLC
2019 2020 2021 2022 2023 2024 2025Funding Capacity (millions) 7,834$ 8,064$ 8,411$ 8,693$ 9,136$ 9,342$ 8,880$ Capacity Utilization (millions):Bonds Issued - CTP -$ 20$ 215$ 280$ 545$ 115$ 80$ Bonds Issued - ICC - - - - - - - Cash Expended 389 443 346 338 313 284 271 Total Utilization 389$ 463$ 561$ 618$ 858$ 399$ 351$ Cumulative Utilization (millions) 5,311$ 5,774$ 6,335$ 6,953$ 7,811$ 8,210$ 8,561$ ICC ProjectMdTA Bonds Issued (1) (millions) -$ -$ -$ -$ -$ -$ -$ Contributions (millions): Garvee Bonds -$ -$ -$ -$ -$ -$ -$ MDOT/Fed Funding - - - - - - - General Fund Transfers - - - - - - - Total - - - - - - - Total Capital (2) (millions) 389$ 463$ 561$ 618$ 858$ 399$ 351$ (1) As shown in Line 4 above.(2) Total Utilization plus ICC Contributions.
Page 5
0
200
400
600
800
1,000
1,200
1,400
2019 2020 2021 2022 2023 2024 2025
$ M
illio
ns
Annual Funding
Annual Capital Requirements
MDOT FundingGF TransfersGarvee BondsMdTA Bonds - ICCMdTA Bonds - CTPMdTA Cash - CTP
0
1,000
2,000
3,000
4,000
5,000
6,000
7,000
8,000
9,000
10,000
2019 2020 2021 2022 2023 2024 2025
$ M
illio
ns
Cumulative Utilization
Funding Capacity Utilization
MdTA Bonds - ICCMdTA Bonds - CTPCash Expended - CTPFunding Capacity
Summary Page 6Maryland Transportation Authority 07/17/19
In Millions $ Fiscal Year 2019 2020 2021 2022 2023 2024 2025
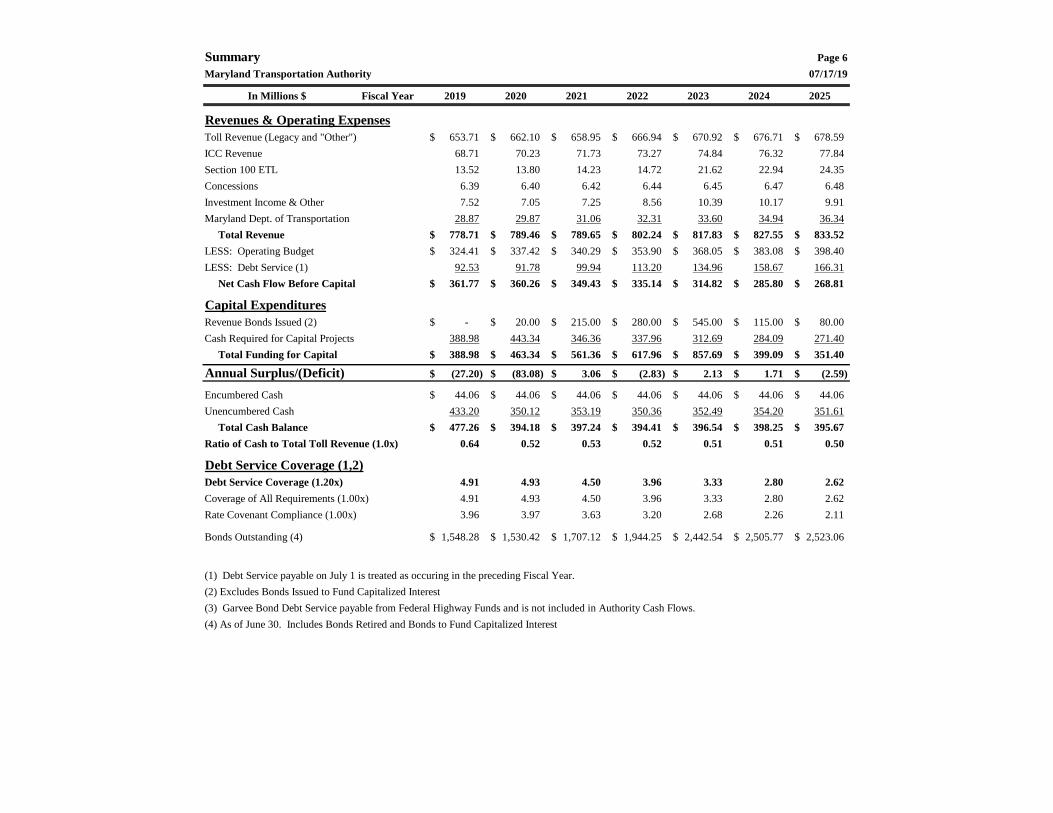
Revenues & Operating ExpensesToll Revenue (Legacy and "Other") 653.71$ 662.10$ 658.95$ 666.94$ 670.92$ 676.71$ 678.59$ ICC Revenue 68.71 70.23 71.73 73.27 74.84 76.32 77.84Section 100 ETL 13.52 13.80 14.23 14.72 21.62 22.94 24.35Concessions 6.39 6.40 6.42 6.44 6.45 6.47 6.48Investment Income & Other 7.52 7.05 7.25 8.56 10.39 10.17 9.91Maryland Dept. of Transportation 28.87 29.87 31.06 32.31 33.60 34.94 36.34 Total Revenue 778.71$ 789.46$ 789.65$ 802.24$ 817.83$ 827.55$ 833.52$ LESS: Operating Budget 324.41$ 337.42$ 340.29$ 353.90$ 368.05$ 383.08$ 398.40$ LESS: Debt Service (1) 92.53 91.78 99.94 113.20 134.96 158.67 166.31 Net Cash Flow Before Capital 361.77$ 360.26$ 349.43$ 335.14$ 314.82$ 285.80$ 268.81$
Capital ExpendituresRevenue Bonds Issued (2) -$ 20.00$ 215.00$ 280.00$ 545.00$ 115.00$ 80.00$ Cash Required for Capital Projects 388.98 443.34 346.36 337.96 312.69 284.09 271.40 Total Funding for Capital 388.98$ 463.34$ 561.36$ 617.96$ 857.69$ 399.09$ 351.40$
Annual Surplus/(Deficit) (27.20)$ (83.08)$ 3.06$ (2.83)$ 2.13$ 1.71$ (2.59)$
Encumbered Cash 44.06$ 44.06$ 44.06$ 44.06$ 44.06$ 44.06$ 44.06$ Unencumbered Cash 433.20 350.12 353.19 350.36 352.49 354.20 351.61 Total Cash Balance 477.26$ 394.18$ 397.24$ 394.41$ 396.54$ 398.25$ 395.67$ Ratio of Cash to Total Toll Revenue (1.0x) 0.64 0.52 0.53 0.52 0.51 0.51 0.50
Debt Service Coverage (1,2)Debt Service Coverage (1.20x) 4.91 4.93 4.50 3.96 3.33 2.80 2.62 Coverage of All Requirements (1.00x) 4.91 4.93 4.50 3.96 3.33 2.80 2.62 Rate Covenant Compliance (1.00x) 3.96 3.97 3.63 3.20 2.68 2.26 2.11
Bonds Outstanding (4) 1,548.28$ 1,530.42$ 1,707.12$ 1,944.25$ 2,442.54$ 2,505.77$ 2,523.06$
(1) Debt Service payable on July 1 is treated as occuring in the preceding Fiscal Year.(2) Excludes Bonds Issued to Fund Capitalized Interest (3) Garvee Bond Debt Service payable from Federal Highway Funds and is not included in Authority Cash Flows.(4) As of June 30. Includes Bonds Retired and Bonds to Fund Capitalized Interest

Revenue and Expense Summary Page 7Maryland Transportation Authority 07/17/19
In Millions $ Fiscal Year 2019 2020 2021 2022 2023 2024 2025
RevenueTolls (Legacy) 611.05$ 619.18$ 615.76$ 623.48$ 627.18$ 632.69$ 634.29$ Other Toll Revenue 42.65 42.92 43.19 43.47 43.74 44.02 44.30Concessions 6.39 6.40 6.42 6.44 6.45 6.47 6.48ICC Revenue 68.71 70.23 71.73 73.27 74.84 76.32 77.84Section 100 ETL 13.52 13.80 14.23 14.72 21.62 22.94 24.35MDOT Loan Repayment - Interest 0.00 0.00 0.60 1.91 3.74 3.50 3.24Other Revenue 2.64 2.71 2.71 2.71 2.71 2.71 2.71Investment Income 4.88 4.34 3.94 3.94 3.94 3.95 3.95Maryland Dept. of Transportation: BWI & Port Police 28.87 29.87 31.06 32.31 33.60 34.94 36.34 Misc 0.00 0.00 0.00 0.00 0.00 0.00 0.00 Masonville 0.00 0.00 0.00 0.00 0.00 0.00 0.00 Total Revenue 778.71$ 789.46$ 789.65$ 802.24$ 817.83$ 827.55$ 833.52$
ExpensesOperations (Basic and M&O) 283.89$ 295.48$ 296.67$ 308.54$ 320.88$ 333.71$ 347.06$ ICC Operations & Maintenance 11.05 11.47 11.93 12.41 12.90 13.42 13.96ETL Northern Extension 0.00 0.00 0.00 0.00 0.00 0.30 0.31Section 100 ETL 0.60 0.60 0.62 0.65 0.67 0.70 0.73BWI and Port Police 28.87 29.87 31.06 32.31 33.60 34.94 36.34MDOT Transit Initiative 0.00 0.00 0.00 0.00 0.00 0.00 0.00Other Expense 0.00 0.00 0.00 0.00 0.00 0.00 0.00 Total Expense 324.41$ 337.42$ 340.29$ 353.90$ 368.05$ 383.08$ 398.40$
Surplus 454.30$ 452.04$ 449.37$ 448.34$ 449.78$ 444.47$ 435.12$
Debt Service (1,2) 92.53 91.78 99.94 113.20 134.96 158.67 166.31
Net Cash Flow Before Capital 361.77$ 360.26$ 349.43$ 335.14$ 314.82$ 285.80$ 268.81$
Capital ProjectsM&O Reserve Expenditures -$ -$ -$ -$ -$ -$ -$ CTP Projects (ex. ICC, Nice) 344.18 351.60 324.07 407.35 670.98 356.47 360.01ICC 12.70 1.40 0.24 0.12 0.00 0.00 0.00Nice Bridge 7.49 43.91 196.90 214.19 207.92 70.94 0.00Total Capital Projects 364.37$ 396.92$ 521.20$ 621.66$ 878.90$ 427.41$ 360.01$ Surety Policy Expense 1.01 0.02 0.16 0.24 0.00 0.14 0.10Less: Intergovernmental / Grant Proceeds 0.00 0.00 0.00 0.00 0.00 (20.00) 0.00Less: Other Funding / Reconciling Item (2) 0.00 0.00 0.00 0.00 (13.00) 0.00 0.00Less: Revenue Bonds Issued 0.00 (20.00) (215.00) (280.00) (545.00) (115.00) (80.00)Cash Required for Cap. 365.38$ 376.94$ 306.36$ 341.90$ 320.90$ 292.55$ 280.11$ MDOT Loan / Principal Repayment (23.60) (66.40) (40.00) 3.94 8.21 8.45 8.71Other / Revenue Bond Defeasance 0.00 0.00 0.00 0.00 0.00 0.00 0.00Cash Required for Cap. & Other Uses 388.98$ 443.34$ 346.36$ 337.96$ 312.69$ 284.09$ 271.40$
Ending Cash Balance* 477.26$ 394.18$ 397.24$ 394.41$ 396.54$ 398.25$ 395.67$
Encumbered Cash Balance 44.06$ 44.06$ 44.06$ 44.06$ 44.06$ 44.06$ 44.06$ Unencumbered Cash Balance 433.20 350.12 353.19 350.36 352.49 354.20 351.61
(1) Debt Service payable on July 1 is treated as occuring in the preceding Fiscal Year.(2) Includes Reconciling Item for FY 13-18.*FY 08 Restated to reflect Cash Balances equivalent to Investment Values on a cost Basis

Capital Spending & Debt Capacity Page 8Maryland Transportation Authority 07/17/19
In Millions $ Fiscal Year 2019 2020 2021 2022 2023 2024 2025
Capital ProjectsMaint. & Oper. Res. Expenditures -$ -$ -$ -$ -$ -$ -$ CTP Projects & General 344.18 351.60 324.07 407.35 670.98 356.47 360.01ICC Funding Requirements 12.70 1.40 0.24 0.12 0.00 0.00 0.00Nice Bridge Funding Requirements 7.49 43.91 196.90 214.19 207.92 70.94 0.00LESS: System Bonds Issued - Existing 0.00 0.00 0.00 0.00 0.00 0.00 0.00LESS: System Bonds Issued - Detailed (customized) 0.00 0.00 0.00 0.00 0.00 0.00 0.00LESS: System Bonds Issued - General 0.00 20.00 130.00 195.00 465.00 115.00 80.00LESS: System Bonds Issued - Cap. Int. 0.00 0.00 0.00 0.00 0.00 0.00 0.00LESS: System Bonds Issued - TIFIA 0.00 0.00 85.00 85.00 80.00 0.00 0.00
Less: Intergovernmental / Grant Proceeds 0.00 0.00 0.00 0.00 0.00 20.00 0.00LESS: Other Funding / Reconciling Item 0.00 0.00 0.00 0.00 0.00 0.00 0.00Net Requirements from Other Sources 364.37$ 376.92$ 306.20$ 341.66$ 333.90$ 292.41$ 280.01$ Minimum Cash Funded Capital 24.00 24.00 24.00 24.00 24.48 24.97 25.47Ending Total Cash 477.26$ 394.18$ 397.24$ 394.41$ 396.54$ 398.25$ 395.67$ Total Bonds Issued -$ 20.00$ 215.00$ 280.00$ 545.00$ 115.00$ 80.00$ Debt Service (1,2)System Debt Service - Existing 67.58$ 66.37$ 68.92$ 68.92$ 68.91$ 70.15$ 70.12$ System Debt Service - Detail (customized) 0.00 0.00 0.00 0.00 0.00 0.00 0.00System Debt Service - General 0.00 0.45 6.07 19.33 41.09 63.56 71.23System Debt Service - Cap. Int. 0.00 0.00 0.00 0.00 0.00 0.00 0.00System Debt Service - Refunding Savings 0.00 0.00 0.00 0.00 0.00 0.00 0.00System Debt Service - Existing TIFIA 24.95 24.95 24.95 24.95 24.95 24.95 24.95
Total Debt Service 92.53$ 91.78$ 99.94$ 113.20$ 134.96$ 158.67$ 166.31$
Debt Service CoverageToll Revenue, Concessions, and other revenue 744.96$ 755.25$ 754.65$ 765.99$ 780.29$ 788.65$ 793.23$ Total Investment Income 4.88 4.34 3.94 3.94 3.94 3.95 3.95Operating Expense (295.54) (307.55) (309.22) (321.59) (334.45) (348.13) (362.06) Net Revenue Avail for DS 454.30$ 452.04$ 449.37$ 448.34$ 449.78$ 444.47$ 435.12$
System Debt Service (1,2) 92.53 91.78 99.94 113.20 134.96 158.67 166.31 Total Debt Service Requirement 92.53$ 91.78$ 99.94$ 113.20$ 134.96$ 158.67$ 166.31$
Coverage of Debt Service 4.91 4.93 4.50 3.96 3.33 2.80 2.62
Maintenance & Op Reserve Transfer -$ -$ -$ -$ -$ -$ -$
Coverage of All Req. 4.91 4.93 4.50 3.96 3.33 2.80 2.62
Rate Covenant Compliance (1.0x) 3.96 3.97 3.63 3.20 2.68 2.26 2.11
(1) Debt Service payable on July 1 is treated as occurring in the preceding Fiscal Year.(2) Garvee Bond Debt Service payable from Federal Highway Funds and is not included in Authority Cash Flows.(3) Debt Service Adjusment shown represents additional debt service not capitalized for bonds issued after 2011(4) For purposes of Rate Covenant compliance Eligible Investment Income is used in lieu of Total Investment Income.

Traffic & Revenue Assumptions Page 9Maryland Transportation Authority 07/17/19
Fiscal Year 2019 2020 2021 2022 2023 2024 2025
Average Toll Per Vehicle Beginning 4.98$ 5.02$ 5.04$ 5.04$ 5.02$ 5.01$ 5.01$ Change in Traffic Mix / Adopted Toll Changes 0.04 0.02 0.00 (0.02) (0.00) (0.00) (0.00) Toll Adjustment - - - - - - - Ending Avg. Toll 5.02$ 5.04$ 5.04$ 5.02$ 5.01$ 5.01$ 5.01$
Toll Adjustment as % of Beginning Toll Revenue Per Veh 0.00% 0.00% 0.00% 0.00% 0.00% 0.00% 0.00%
TrafficGrowth 0.13% 1.00% 0.30% 1.72% 0.68% 0.97% 0.32%Adjusted Forecast (transactions) 121.69 122.91 123.28 125.39 126.24 127.46 127.86
Toll RevenueAverage Toll Per Vehicle 5.02$ 5.04$ 5.04$ 5.02$ 5.01$ 5.01$ 5.01$ Traffic 121.69 122.91 123.28 125.39 126.24 127.46 127.86 Toll Revenue (millions) 611.05$ 619.18$ 621.27$ 629.04$ 632.80$ 638.37$ 640.04$
Other Toll RevenueGrowth 6.0% 0.6% 0.6% 0.6% 0.6% 0.6% 0.6%Amount (millions) 42.65$ 42.92$ 43.19$ 43.47$ 43.74$ 44.02$ 44.30$
Average Toll Per Vehicle Inlcuding "Other Toll Revenue" 5.37$ 5.39$ 5.35$ 5.32$ 5.31$ 5.31$ 5.31$ 0.00% 0.00% 0.00% 0.00% 0.00% 0.00% 0.00%
Adjustment 0.00 0.00 -5.51 -5.56 -5.62 -5.68 -5.75Total Toll Revenue (Millions) 653.71$ 662.10$ 658.95$ 666.94$ 670.92$ 676.71$ 678.59$
Toll Adjustment as % of Avg Toll Per Vehicle Inlcuding "Other Toll Revenue"

General Assumptions Page 10Maryland Transportation Authority 07/17/19
Fiscal Year 2019 2020 2021 2022 2023 2024 2025
Other RevenueConcessions 0.79% 0.25% 0.25% 0.25% 0.25% 0.25% 0.25%Other Revenue 3.00% 3.00% 0.00% 0.00% 0.00% 0.00% 0.00%Seagirt 0.00% 0.00% 0.00% 0.00% 0.00% 0.00% 0.00%DOT - BWI/ Port Police 6.25% 3.46% 4.00% 4.00% 4.00% 4.00% 4.00%Annual Funding Agreement, MDOT 0.00% 0.00% 0.00% 0.00% 0.00% 0.00% 0.00%Misc 0.00% 0.00% 0.00% 0.00% 0.00% 0.00% 0.00%Masonville (millions) 0.000 0.000 -100.00% 0.00% 0.00% 0.00% 0.00%Investment Yield 1.00% 1.00% 1.00% 1.00% 1.00% 1.00% 1.00%
ExpensesOperations (Basic) - Additional Adjustment (10.6) Operations (M&O)Operations (Basic and M&O) (millions) 10.53% 4.08% 4.00% 4.00% 4.00% 4.00% 4.00%Section 100 ETL 0.00% 0.00% 4.00% 4.00% 4.00% 4.00% 4.00%ETL Northern Extension 0.00 0.00 0.00 0.00 0.00 0.30 4.00%BWI and Port Police (millions) 6.25% 3.46% 4.00% 4.00% 4.00% 4.00% 4.00%MDOT Transit Initiative 0.00% 0.00% 0.00% 0.00% 0.00% 0.00% 0.00%Other Expense 0.00% 0.00% 0.00% 0.00% 0.00% 0.00% 0.00%
M&O Reserve Transfer (millions)M&O CTP -$ -$ -$ -$ -$ -$ -$ Other Requirements 0.00 0.00 0.00 0.00 0.00 0.00 0.00LESS: Advanced Funding 0.00 0.00 0.00 0.00 0.00 0.00 0.00LESS: Other Funding 0.00 0.00 0.00 0.00 0.00 0.00 0.00Required Transfer -$ -$ -$ -$ -$ -$ -$
Encumbered Cash (millions)Operating Account 44.06$ 44.06$ 44.06$ 44.06$ 44.06$ 44.06$ 44.06$ Maintenance & Operating Reserve 0.00 0.00 0.00 0.00 0.00 0.00 0.00Advanced Payments - M&O Reserve 0.00 0.00 0.00 0.00 0.00 0.00 0.00Seagirt Proceeds Account 0.00 0.00 0.00 0.00 0.00 0.00 0.00GARVEE Debt Service Reserve Fund 0.00 0.00 0.00 0.00 0.00 0.00 0.00Unspent Bond Proceeds 0.00 0.00 0.00 0.00 0.00 0.00 0.00TRB Debt Service Reserve Fund 0.00 0.00 0.00 0.00 0.00 0.00 0.00ICC Depository 0.00 0.00 0.00 0.00 0.00 0.00 0.00Total Encumbered Cash 44.06$ 44.06$ 44.06$ 44.06$ 44.06$ 44.06$ 44.06$
Section 100 ETL Traffic and RevenueSection 100 ETL Revenue (millions) 13.52$ 13.80$ 14.23$ 14.72$ 21.62$ 22.94$ 24.35$ Section 100 ETL Traffic (millions) 9.54 9.63 9.83 10.05 13.62 14.21 14.83 Section 100 ETL Average Toll 1.42$ 1.43$ 1.45$ 1.47$ 1.59$ 1.61$ 1.64$
ICC Revenue and ExpensesTraffic Growth 2.25% 2.03% 2.14% 2.14% 2.14% 1.99% 1.99%ICC Traffic 35.18 35.89 36.66 37.44 38.24 39.00 39.78Average Toll/Vehicle Adjustment (0.01)$ 0.00$ 0.00$ (0.00)$ 0.00$ 0.00$ 0.00$ Average Toll 1.95$ 1.96$ 1.96$ 1.96$ 1.96$ 1.96$ 1.96$ ICC Revenue (millions) 68.71$ 70.23$ 71.73$ 73.27$ 74.84$ 76.32$ 77.84$ Operating and Maintenance (Growth) 14.25% 3.80% 4.00% 4.00% 4.00% 4.00% 4.00%ICC O&M (millions) 11.05$ 11.47$ 11.93$ 12.41$ 12.90$ 13.42$ 13.96$
ICC Revenue Adjustment 0.00 0.00 0.00 0.00 0.00 0.00 0.00

ICC Project - Conceptual Finance Plan Summary Scenario: Page 11
Maryland Transportation Authority Davenport & Company LLC
In Millions Total FY 2004 FY 2005 FY 2006 FY 2007 FY 2008 FY 2009 FY 2010 FY 2011 FY 2012 FY 2013 FY 2014 FY 2015 FY 2016 FY 2017 FY 2018 FY 2019 FY 2020 FY 2021 FY 2022 FY 2023 FY 2024 FY 2025
Funding Requirement 2,377.14$ 6.96$ 37.92$ 29.84$ 145.74$ 277.30$ 385.70$ 565.89$ 532.28$ 194.76$ 68.05$ 77.75$ 24.04$ 5.07$ 0.90$ 10.60$ 12.70$ 1.40$ 0.24$ 0.12$ -$ -$ -$
Sources of Funds (millions)Garvee Bonds 750.00$ -$ -$ -$ 325.00$ -$ 425.00$ -$ -$ -$ -$ -$ -$ -$ -$ -$ -$ -$ -$ -$ -$ -$ -$ Additional Funds from GARVEE Sale (0.00) 0.00 0.00 0.00 16.91 0.00 0.00 0.00 0.00 (16.91) 0.00 0.00 0.00 0.00 0.00 0.00 0.00 0.00 0.00 0.00 0.00 0.00 0.00MDOT- P.A.Y.G. 180.00 0.00 22.00 38.00 30.00 30.00 30.00 30.00 0.00 0.00 0.00 0.00 0.00 0.00 0.00 0.00 0.00 0.00 0.00 0.00 0.00 0.00 0.00General Funds / General Obligation Bonds 264.91 0.00 0.00 0.00 53.00 0.00 0.00 55.00 89.28 46.15 0.00 21.48 0.00 0.00 0.00 0.00 0.00 0.00 0.00 0.00 0.00 0.00 0.00Spec. Fed Funds - P.A.Y.G. 19.27 0.00 0.00 0.58 18.00 0.69 0.00 0.00 0.00 0.00 0.00 0.00 0.00 0.00 0.00 0.00 0.00 0.00 0.00 0.00 0.00 0.00 0.00MdTa Bonds - TRB 496.40 0.00 0.00 0.00 0.00 176.77 0.00 235.59 84.06 0.00 0.00 0.00 0.00 0.00 0.00 0.00 0.00 0.00 0.00 0.00 0.00 0.00 0.00MdTa Bonds - TIFIA Loan 516.00 0.00 0.00 0.00 0.00 0.00 0.00 0.00 347.23 36.74 0.00 0.00 132.02 0.00 0.00 0.00 0.00 0.00 0.00 0.00 0.00 0.00 0.00MdTA Reserves(1) 150.56 6.960 19.840 0.00 0.00 0.00 0.00 0.00 0.00 132.02 4.23 87.89 (131.30) 5.07 0.90 10.60 12.70 1.40 0.24 0.12 0.00 0.00 0.00Total Sources of Funds 2,377.14$ 6.96$ 41.84$ 38.58$ 442.91$ 207.46$ 455.00$ 320.59$ 520.57$ 198.01$ 4.23$ 109.37$ 0.72$ 5.07$ 0.90$ 10.60$ 12.70$ 1.40$ 0.24$ 0.12$ -$ -$ -$
Cumulative Surplus (Deficit) 0.00 3.92 12.63 309.80 239.96 309.27 63.97 52.26 55.51 (8.30) 23.32 0.00 0.00 0.00 0.00 0.00 0.00 0.00 0.00 0.00 0.00 0.00
Debt Service (millions)(2)
Garvee Bonds - W/O Support -$ -$ -$ -$ 36.09$ 40.36$ 87.46$ 87.46$ 87.46$ 87.45$ 87.46$ 87.45$ 87.45$ 87.45$ 86.05$ 86.18$ 51.36$ -$ -$ -$ -$ -$ Total Garvee Debt Service -$ -$ -$ -$ 36.09$ 40.36$ 87.46$ 87.46$ 87.46$ 87.45$ 87.46$ 87.45$ 87.45$ 87.45$ 86.05$ 86.18$ 51.36$ -$ -$ -$ -$ -$
MDTA Bonds - System 0.00 0.00 0.00 0.00 0.00 0.00 0.00 0.10 16.79 22.03 27.66 28.83 33.72 33.76 33.74 20.28 12.99 13.67 13.68 13.68 20.98 20.97MDTA Bonds - TIFIA Loan 0.00 0.00 0.00 0.00 0.00 0.00 0.00 0.00 0.00 10.18 10.18 10.32 13.56 24.95 24.95 24.95 24.95 24.95 24.95 24.95 24.95 24.95Total MdTA Debt Service -$ -$ -$ -$ -$ -$ -$ 0.10$ 16.79$ 32.21$ 37.84$ 39.15$ 47.27$ 58.71$ 58.69$ 45.23$ 37.95$ 38.63$ 38.63$ 38.63$ 45.94$ 45.92$
Total All Debt Service -$ -$ -$ -$ 36.09$ 40.36$ 87.46$ 87.56$ 104.25$ 119.66$ 125.29$ 126.61$ 134.72$ 146.16$ 144.74$ 131.41$ 89.31$ 38.63$ 38.63$ 38.63$ 45.94$ 45.92$
Financing Assumptions Final Mat. Rate Def. Int.(Yr) DS Per $100 MMFuture MdTa Bonds - System 30 4.75% N/A 6.32
(1) Adjusted 2006 Surplus in December 2008 from 12.66 to 12.63 per PB Consult.(2) Debt service for GARVEE Bonds is precise. Debt service for MDTA Bonds is an approximate - MDTA debt service is not allocated on a project by project basis.
2019-05

Nice Bridge Project - Conceptual Finance Plan Summary Scenario: 2019-05 Page 12
Maryland Transportation Authority Davenport & Company LLCPrior
In Millions Total Years FY 2016 FY 2017 FY 2018 FY 2019 FY 2020 FY 2021 FY 2022 FY 2023 FY 2024 FY 2025
Funding Requirement 768.60$ 7.18$ 11.46$ 3.84$ 4.77$ 7.49$ 43.91$ 196.90$ 214.19$ 207.92$ 70.94$ -$
Sources of Funds (millions) MDTA Bonds - TRB 129.19$ -$ -$ -$ -$ -$ -$ -$ 129.19$ -$ -$ -$ MDTA Bonds - TIFIA Loan 250.00 - - - - - - 85.00 85.00 80.00 - - VDOT Contribution 13.00 - - - - - - - - 13.00 - - MDTA Reserves - Paygo Cash 376.41 7.18 11.46 3.84 4.77 7.49 43.91 111.90 0.00 114.92 70.94 -
Total Sources of Funds 768.60$ 7.18$ 11.46$ 3.84$ 4.77$ 7.49$ 43.91$ 196.90$ 214.19$ 207.92$ 70.94$ -$ Cumulative Surplus (Deficit) - - - - - - - - - - -
Debt Service (millions) MDTA Bonds - TRB(1) -$ -$ -$ -$ -$ -$ -$ 2.91$ 7.93$ 7.93$ 7.93$ MDTA Bonds - TIFIA Loan(2) - - - - - - 1.9 5.7 9.5 11.3 12.6 Total Sources of Funds -$ -$ -$ -$ -$ -$ 1.91$ 8.64$ 17.38$ 19.18$ 20.57$
Financing Assumptions Final Mat. Rate Def. Int.(Yr) DS Per $100 MM MDTA Bonds - TRB 30 4.50% N/A 6.14 MDTA Bonds - TIFIA Loan 34 4.50% 4 Years 6.14
Notes:Funds contributed by the Commonwealth of Virginia would reduce MDTA Bonds and / or MDTA Reserves - Paygo Cash contributions.(1) Debt Service for MDTA Bonds - TRB is an estimate.(2) Debt service for MDTA Bonds - TIFIA Loan is an estimate.