fy 2021/22 – fy 2025/26 short range transit plan
TRANSCRIPT
SHORT RANGE TRANSIT PLAN
FY 2021/22 – FY 2025/26
Approved June 9, 2021

i
TABLE OF CONTENTS
EXECUTIVE SUMMARY ....................................................................................... 1
1.0 SYSTEM OVERVIEW ................................................................................... 3
1.1 Riverside County Service Area ................................................................................ 3
1.2 Riverside County Demographics and Travel Characteristics .................................. 3
1.3 Description of RCTC Transit Services and Programs ............................................... 5
1.4 Key RCTC Partners ................................................................................................... 6
1.5 RCTC Transit Facilities ............................................................................................. 8
1.6 Previous Studies and Plans ................................................................................... 13
2.0 WESTERN COUNTY VANPOOL PROGRAM ................................................ 16
2.1 Vanpool Service Profile ......................................................................................... 16
2.2 Vanpool Existing Performance .............................................................................. 19
2.3 Vanpool Service Enhancements ........................................................................... 20
2.4 Vanpool Projected Ridership Growth ................................................................... 21
2.5 Vanpool Potential Fare Changes ........................................................................... 22
2.6 Vanpool Proposed Incentive Program .................................................................. 23
2.7 Vanpool Capital Investments ................................................................................ 24
3.0 COACHELLA VALLEY AND WESTERN COUNTY RAIL PROGRAMS ............... 25
3.1 Coachella Valley Rail ................................................................................ 25
3.1.1 Coachella Valley – San Gorgonio Pass Rail Corridor Project ........................... 25
3.2 Western County Rail - Metrolink ............................................................. 29
3.2.1 Metrolink Service Profile ................................................................................ 29
3.2.2 Metrolink Fare Structure ................................................................................ 33
3.2.3 Metrolink Revenue Fleet ................................................................................ 36
3.2.4 Metrolink Rider Profile.................................................................................... 36
3.2.5 Metrolink Existing Performance ..................................................................... 37
3.2.6 Metrolink Key Performance Indicator ............................................................ 40
3.2.7 Metrolink Productivity Improvement Efforts ................................................. 41
3.2.8 Metrolink Recent Service Changes ................................................................. 41
3.2.9 Metrolink Major Trip Generators ................................................................... 42

ii
3.2.10 RCTC Proposed Metrolink Service Plan ........................................................ 42
3.2.11 Metrolink and RCTC Marketing Plans and Outreach ....................................... 45
3.2.12 Metrolink Projected Ridership Growth ........................................................... 47
3.2.13 Metrolink and RCTC Capital Improvement Plans ............................................ 47
3.2.14 Overview of Long-Term Rail Capital Investments ........................................... 57
4. FINANCIAL PLANNING ............................................................................. 58
4.1 Operating and Capital Budget – FY 2021/22 ........................................................ 59
4.2 Funding to Support Future Operating and Capital Plans ...................................... 59
4.3 Regulatory and Compliance Requirements .......................................................... 60
4.4 Status of Current Capital Projects ......................................................................... 62
List of Figures and Tables Figure 1: Map of Service Area Figure 2: Map of RCTC-Owned Metrolink Stations in Western Riverside County Figure 3: Map of San Jacinto Branch Line Figure 4: Map of Park & Rides Figure 5: Map of Vanpool Origins Destined for Western Riverside County Figure 6: Project Vanpool Ridership, FY 2020/21 – 2024/25 Figure 7: Metrolink Commuter Rail System Figure 8: Map of Metrolink IEOC Line Figure 9: Map of Metrolink Riverside Line Figure 10: Map of Metrolink 91/PVL Line Figure 11: Metrolink Systemwide Annual Ridership, FY 2014/15 – 2019/20 Figure 12: Total Ridership Riverside County Metrolink Lines, FY 2014/15 – 2019/20 Figure 13: Riverside County Average Weekday Passenger Distribution by Line Figure 14: RCTC Stations Passenger Distribution Figure 15: Riverside County Served Lines On-Time Performance Figure 16: FY 2020/21 Operating and Capital Revenue Sources Table 1.0: Journey to Work by County, SCAG Region Table 1.1: RCTC Transit Facility Features Table 2.0: Projected No. of Vanpools, FY 2020/21 – 2024/25 Table 3.0: Metrolink Rider Profile Table 3.1: Metrolink Key Performance Indicators Table 3.2: Proposed Riverside County Metrolink Service Improvements Table 3.3: Long-Term Rail Capital Investments Table 4.0: Summary of Funding Request – FY 2020/21 Table 4.0A: Capital Project Justifications Table 4.1: Summary of Funding Request – FY 2021/22 Table 4.2: Summary of Funding Request – FY 2022/23 Table 4.3: Summary of Funding Request – FY 2023/24 Table 4.4: Summary of Funding Request – FY 2024/25 Table 4.5: Projected Total Operating Costs (Vanpool and Commuter Rail), FY 2020/21 – 2024/25 Table 4.6: List of Current Capital Projects and Funding Status

iii
GLOSSARY OF ACRONYMS
AA Alternatives Analysis
BNSF BNSF Railways
CMAQ Congestion Mitigation & Air Quality Funds
CTC County Transportation Commission
CVAG Coachella Valley Association of Governments
ETC Employer Transportation Coordinator
EIR/EIS Environmental Impact Report/Environmental Impact Statement
EPA Environmental Protection Agency
FHWA Federal Highway Administration
FRA Federal Railroad Administration
FTA Federal Transit Administration
FY Fiscal Year
IEOC Inland Empire-Orange County Line
LAUS Los Angeles Union Station
LOSSAN Los Angeles – San Diego – San Luis Obispo Rail Corridor Agency
LTF Local Transportation Funds
LRTS Long Range Transportation Study
Metro Los Angeles County Metropolitan Transportation Authority
MSRC Mobile Source Air Pollution Reduction Review Committee
NTD National Transit Database
OCTA Orange County Transportation Authority
PTC Positive Train Control
PVL Perris Valley Line
RCTC Riverside County Transportation Commission
RTA Riverside Transit Agency
RTPA Regional Transportation Planning Agency
RTP/SCS Regional Transportation Plan/Sustainable Communities Strategy
SB Senate Bill
SBCTA San Bernardino County Transportation Authority
SCAG Southern California Association of Governments
SCORE Southern California Optimized Rail Expansion
SCRRA Southern California Regional Rail Authority
SDP Service Development Plan
SJBL San Jacinto Branch Line
SR State Route
SRTP Short Range Transit Plan
STA State Transit Assistance Funds
TVM Ticket Vending Machine
UP Union Pacific Railroad
VCTC Ventura County Transportation Commission

1
EXECUTIVE SUMMARY
The Riverside County Transportation Commission (“Commission”) was established in 1976 by the State Legislature to oversee the funding and coordination of all public transportation services within Riverside County (County). The governing body consists of all five members of the County Board of Supervisors, one elected official from each of the County’s 28 cities, and one non-voting member appointed by the Governor of California. The Commission is one of 26 designated regional transportation planning agencies (RTPA) in the State. It is also one of the County Transportation Commissions (CTC) created under Public Utilities Code Section 130050. As the RTPA, it is required to set policies, establish priorities, and coordinate activities among the County’s various transit operators and local jurisdictions. The Commission approves the allocation of federal, state, and local funds for highway, transit, rail, non-motorized travel (bicycle and pedestrian), and other transportation activities by strategically programming funds and administering grant programs. The Commission is also legally responsible for allocating Transportation Development Act (TDA) funds, the major source of funds for transit in the County. The TDA provides two sources of funding: Local Transportation Fund (LTF), derived from a one-quarter of one-cent state sales tax, and State Transit Assistance (STA), derived from the statewide sales tax on diesel fuel. The Short Range Transit Plan (SRTP) focuses on the regional transit programs administered by the Commission, which includes the vanpool subsidy program known as VanClub and commuter rail service operated by the Southern California Regional Rail Authority (SCRRA) better known as Metrolink, both of which span the Western Riverside County area. The Commission is also leading the planning efforts for the proposed Coachella Valley-San Gorgonio Rail Corridor, which would extend intercity-rail services from Los Angeles to Palm Springs and Indio. The SRTP serves as the blueprint for the service improvement plan and capital priorities for the next five years. In order to receive local, state, and federal funds for the first fiscal year (FY) of the plan, transit operators in the county submit an updated SRTP annually for the allocation and programming of funds. The SRTP is guided by the overall mission set forth by the Commission and the respective program goals to encourage viable alternative modes of travel. In March 2021, the Commission approved four core mission objectives: 1) Quality of Life; 2) Operational Excellence; 3) Connecting the Economy; and 4) Responsible Partner. These objectives are used to direct policies and priorities for the coming year as well as underline the Commission’s leadership role in the region and its commitment as a community partner. The transit programs meet these objectives by improving mobility with investments in diverse modes such as vans and bicycle and pedestrian improvements; protecting transportation resources by maintaining existing transit infrastructure and using the existing transportation network more efficiently; promoting coordinated transportation, and mitigating project impacts in the community.

2
COVID-19 Impact on Transit Services Ridership projections for FY 2019/20 were promising with proposed service expansions for commuter rail and significant gains in new vanpools as it was entering its second year of service. However, the novel coronavirus which causes the disease now known as COVID-19 caused a pandemic worldwide. Beginning in mid-March 2020, local and state public health orders included the closure of schools, cancellations of gatherings of more than ten, social distancing of at least 6 feet, and the Governor’s statewide “stay at home” Executive Order. Although transit services were deemed essential, ridership plummeted immediately after the “stay at home” order was issued. Metrolink reported ridership declines of about 90% systemwide and the number of active vanpools declined 47%. Ridership levels are being closely monitored and services are reduced leading into FY 2020/21 with many uncertainties that remain. Metrolink has reduced services by 30% and will operate at the reduced service levels in FY 2021/22 until ridership recovery requires service to be reinstated. As a result of the continued travel and commute restrictions resulting from COVID-19, in FY 2020/21 VanClub did not regain the routes/ridership achieved before COVID-19. Since July 2020, there have been 30 vanpool routes that have continued during the fiscal year and the program anticipates minor increases in participation before the end of FY 2020/21. The service plans and strategies for both are described in this five-year plan and should be noted that the focus for the near-term will implement strategies to maintain and regain riders, including increasing safety and sanitization measures to meet customer needs. The proposed FY 2021/22 plan also provides flexibility to meet market changes when local and state health provisions are lifted. As the pandemic transpires, the service expansions and capital improvements set forth may be delayed as revenue and economic conditions are reassessed.

3
1.0 SYSTEM OVERVIEW
1.1 Riverside County Service Area
Riverside County is the fourth largest county in California with an area of 7,208 square miles, encompassing three subregions: Western, Coachella Valley, and Palo Verde, with a total of 28 cities and five county district seats. The Commission’s vanpool and commuter rail services are offered in Western Riverside County. In the Coachella Valley, the Commission is directly involved with leading the planning and environmental phase of future rail services. Figure 1 illustrates the Western and Coachella Valley subregions where these transit programs take place.
Figure 1: Map of Service Area
1.2 Riverside County Demographics and Travel Characteristics
Riverside County is diverse in geography and demographics. Total population is estimated at 2.4 million. In the Commission’s 2019 Long Range Transportation Study (LRTS), existing land use and population characteristics as well as travel market and mobility trends were analyzed. The LRTS summarized the notable population and employment trends in Riverside County as the following:
✓ 50% of households in Riverside County are one and two-person households; 35% of
households have four or more persons.

4
✓ 20% of Riverside County’s resident are school age; this proportion holds for all three
subareas.
✓ The Coachella and Palo Verde Valleys have a higher proportion of persons and heads of
household over 65 compared to Western Riverside County.
✓ Nearly one-third (31%) of households in the county have no worker present. This figure
includes retired households as well as households of unemployed persons and full-time
college students. The data reflects the great recession and slow recovery during the first half
of the current decade.
✓ More than one-third of households are one-worker households.
✓ Median income is higher in Western Riverside County compared to the eastern subareas.
✓ Countywide, nearly two-thirds of households had incomes of $75,000 or less.
✓ Over two-thirds of Riverside County’s dwelling units are single-family.
✓ Nearly 70% of jobs in Riverside County paid $35,000 per year or less.
✓ Only 13% of jobs in Riverside County paid $75,000 per year or more.
✓ Education is the dominant industry in Riverside County, representing a quarter of all County
jobs.
✓ Retail, arts and entertainment, and professional industry sectors all represent over 10% of
jobs.
✓ Employment in Riverside County grew from 1.1% from 2010 to 2015, which was significantly
higher than other counties such as Orange, San Bernardino, and Los Angeles, which saw
changes of -0.2%, 0.1%, and -1.3%, respectively, during the same period.
Commuter Travel Characteristics by Mode
The Commission’s transit programs will continue to play significant roles in advancing mobility in the county by offering travel options that can compete with the convenience of an automobile. Analyzing mode share data provides insight into the travel modes with the greatest growth potential and provides perspective on how the County compares to neighboring counties.
For example, according to the Southern California Association of Governments (SCAG) 2016 Regional Transportation Plan/Sustainable Communities Strategy (RTP/SCS) which analyzed the U.S. Census’s Journey to Work data (peak congestion periods) from the 2009-11 American Community Survey 3-Year Estimates, 1.5% of commute trips occurred by public transportation in Riverside County. In comparison, the state share is 5.2% and the national share is 5%. Although Riverside County is below the state and national averages, most other counties in the SCAG region were also below the averages. Moreover, Orange County’s transit share may only be 2.9% but OCTA still ranks amount the 50 largest providers of public transportation nationally.
Carpooling in Riverside County on the other hand is about 13% of the peak commute trips, which is one of the highest in the SCAG region. Table 1.0 below presents the Journey to Work data by county. Although the transit share is modest, the carpool share is the second highest means of

5
travel behind driving alone, signaling the potential that regional vanpool programs have in the region.
Table 1.0: Journey to Work by County, SCAG Region
Means of Transportation to Work
Imperial County
LA County Orange County
Riverside County
San Bernardino
County
Ventura County
Car, Truck, or Van 90.2% 83.0% 88.2% 90.0% 91.0% 89.1%
Drove Alone 78.9% 72.2% 78.1% 77.1% 74.4% 75.9%
Carpooled 11.3% 10.8% 10.0% 13.0% 16.7% 13.2%
In 2-Person Carpool 7.9% 8.4% 7.7% 9.6% 13.2% 9.7%
In 3-Person Carpool 1.7% 1.5% 1.3% 1.9% 2.0% 1.7%
In 4-Or-More Person Carpool 1.8% 1.0% 0.9% 1.5% 1.5% 1.8%
Workers Per Car, Truck, or Van 1.08 1.08 1.07 1.09 1.11 1.09
Public Transportation 1.5% 7.2% 2.9% 1.5% 1.9% 1.4%
Walked 2.0% 2.9% 2.0% 1.6% 2.0% 2.3%
Bicycle 0.5% 0.8% 1.0% 0.4% 0.4% 0.8%
Taxicab, Motorcycle, or Other Means
1.3% 1.2% 1.0% 1.4% 1.0% 1.0%
Worked at Home 4.5% 4.9% 5.0% 5.1% 3.7% 5.5%
Source: SCAG 2016 RTP/SCS, U.S. Census 2009-11 American Community Survey 3-Year Estimates
1.3 Description of RCTC Transit Services and Programs
RCTC administers and subsidizes two Western Riverside County transit programs:
• Vanpool – Better known as VanClub, is an incentive program where eligible vanpoolers receive a subsidy toward the cost of a vanpool lease.
• Commuter Rail – Better known as Metrolink, that is operated by the Southern California Regional Rail Authority (SCRRA), which the Commission is a member agency. This program also includes the operations and maintenance of the nine Metrolink stations and capital delivery of rehabilitation and expansion projects.
In the Coachella Valley, RCTC is leading the planning and environmental phases of the Coachella Valley – San Gorgonio Pass Corridor Service Project. Details of each program, including service profiles, existing service and route performance, and future service and capital planning efforts for each are found in Chapters 2 and 3 of this report.

6
1.4 Key RCTC Partners
Planning, programming, and delivery of transportation projects is achieved in conjunction and in partnership with dozens of other agencies at the federal, state, regional, subregional, and local levels. This section provides a summary of key partner agencies and their responsibilities with which RCTC collaborates. Federal Agency Partners Key federal partners include U.S. Department of Transportation and its two principal surface transportation agencies, the Federal Transit Administration (FTA) and the Federal Highway Administration (FHWA). Other federal agencies include the Federal Railroad Administration (FRA), and Amtrak, which operates interstate passenger rail services with support from Caltrans. State Agency Partners The California State Transportation Agency (CalSTA) is a cabinet-level agency focused on addressing all of the state’s transportation issues. Of its nine major divisions two have substantial intersection with RCTC’s operations. The California Department of Transportation (Caltrans) as the steward and operator of the state highway system, is involved in the implementation of RCTC-led projects on state highways and is a major funding partner for transit services and projects throughout the County. The California Transportation Commission (CTC) programs various state and federal funding on transportation projects, including state highways, rail, transit, and active transportation. The California Air Resources Board (CARB) sets air quality standards and in coordination with the U.S. Environmental Protection Agency (EPA) determines conformity between transportation and air quality plans; CARB also funds projects and programs that result in emissions reductions. Regional Agency Partners As a CTC, RCTC represents the Riverside County subregion and assists SCAG in carrying out its functions as the Metropolitan Planning Organization (MPO). SCAG, in coordination with RCTC, performs studies and develops consensus relative to regional growth forecasts, regional transportation plans, and mobile source components of the air quality plans maintained by the South Coast Air Quality Management District. RCTC also is responsible for submitting projects to SCAG for inclusion in the RTP. Per federal and state regulations, all projects programmed with federal and state funds, including locally funded regionally significant projects, are required to be included in the RTP. SCAG as the MPO is responsible for conducting analysis to enable CARB and the EPA to determine air quality conformity with adopted air plans for the six counties in the SCAG region (Imperial, Los Angeles, Orange, Riverside, San Bernardino, and Ventura counties). The SCRRA or Metrolink, is a joint powers authority consisting of five member agencies: Los Angeles Metropolitan Transportation Authority (Metro), Orange County Transportation Authority (OCTA), Riverside County Transportation Commission (RCTC), San Bernardino County Transportation Authority (SBCTA), and Ventura County Transportation Commission (VCTC)). Metrolink is the premier commuter rail system in Southern California connecting communities on a 536 route-mile network.

7
RCTC is also a voting member of the Los Angeles – San Diego – San Luis Obispo (LOSSAN) Rail Corridor Joint Powers Authority (JPA). The LOSSAN Rail Corridor is a 351-mile corridor between San Diego and San Luis Obispo and is the second busiest intercity passenger rail corridor in the nation supporting commuter, intercity, and freight rail services. LOSSAN is a forum for the transportation and regional agencies along the corridor to collaborate on ways to increase ridership, revenue, capacity, reliability, and safety on the LOSSAN Rail Corridor. LOSSAN does not pay for the operation of any of the passenger rail services within the corridor but is a means to help coordinate operations and planning. County-Level Partners RCTC works closely with peer county-level transportation agencies in Southern California, including:
✓ Imperial Valley Association of Governments (IVAG)
✓ Los Angeles Metropolitan Transportation Authority (LA Metro)
✓ Orange County Transportation Authority (OCTA)
✓ San Bernardino County Transportation Authority (SBCTA)
✓ San Diego Association of Governments (SANDAG)
✓ Ventura County Transportation Commission (VCTC) These above intercounty partnerships are especially important because of shared borders and transportation linkages between Riverside County and these counties. Since SANDAG is also a Metropolitan Planning Organization, the relationship with SANDAG may involve SCAG for larger MPO planning purposes. Subregional Agency Partners RCTC works with two primary subregional agencies. The Western Riverside County Council of Governments (WRCOG) promotes transportation solutions in the most populous western portion of the county. In the Coachella Valley, the Coachella Valley Association of Governments (CVAG) is the planning agency coordinating government services in the Coachella Valley. Both subregional agencies promote solutions to the common issues of the local governments and tribes that are its members. Both agencies administer the Transportation Uniform Mitigation Fee programs that complement and enhance Measure A projects and programs. CVAG, WRCOG, RCTC, and SCAG coordinate efforts to plan, fund, and implement transportation improvement projects. Tribal Governments RCTC consults with tribal governments in the development of projects and planning that have the potential to impact tribal lands. There are 11 tribal governments within Riverside County primarily located in Southwest, Central, Coachella Valley and Eastern portions of the county.

8
Local Agency Partners Local agencies include the County of Riverside and 28 incorporated cities. Other key local partner agencies include the County’s seven transit operators:
✓ City of Banning Transit
✓ City of Beaumont Transit
✓ City of Riverside Special Transportation Services
✓ Corona Cruiser
✓ Palo Verde Valley Transit Agency
✓ Riverside Transit Agency (RTA)
✓ SunLine Transit Agency
1.5 RCTC Transit Facilities
RCTC-Owned Metrolink Stations The Commission owns and maintains nine stations in Riverside County out of the 57 Metrolink stations in southern California. These stations are served by three Metrolink lines, Inland Empire – Orange County (IEOC) Line, Riverside Line, and 91/Perris Valley Line (91/PVL) and are located in Western Riverside County, as presented in Figure 2. They are multimodal transit centers with regional and local bus connections and offer customer amenities such as canopies, benches, electronic signage, and bicycle storage units for active transportation users. The stations also serve as designated park & rides to encourage rideshare.
Figure 2: Map of RCTC-Owned Metrolink Stations in Western Riverside County

9
The Commission also operates the Riverside Downtown Operations Control Center (RDNOCC) which is located on the west end of the Riverside Downtown station and provides monitoring of closed-circuit televisions (CCTV) at the stations as well as facilities for train crews. Over the last 27 years, the Commission has invested more than $145 million in capital improvements to develop stations and secure access to support commuter rail services. The PVL and related projects added over $250 million more to the Commission’s investment in commuter rail. Station operations and maintenance costs are part of the rail program budget and includes property management, utilities, grounds maintenance, repairs, cleaning, and security services. An overview of the features at each facility is provided in Table 1.1.
Table 1.1: RCTC Transit Facility Features
Location Transit Services Primary Features
Riverside Downtown 4066 Vine Street, Riverside
Rail: 91/PVL Line, IEOC Line, Riverside Line, Amtrak Bus: RTA, Amtrak OmniTrans, MegaBus
2 platforms with 4 boarding tracks 4 parking lots (1,240 spaces) Enclosed pedestrian bridge, elevators, stairwells Size: 26.5 acres In Service Date: June 1993
Jurupa Valley-Pedley 6001 Pedley Road, Jurupa Valley
Rail: Riverside Line Bus: RTA
Platform with boarding track Parking lot (288 spaces) Size: 4.5 acres In Service Date: June 1993
Riverside-La Sierra 10901-A & B Indiana Avenue, Riverside
Rail: 91/PVL, IEOC Line Bus: RTA
Platform with 2 boarding tracks Parking lot (1,065 spaces) Enclosed pedestrian bridge, elevators, stairwells Size: 9.35 acres In Service Date: October 1995

10
Corona-West 155 South Auto Center Drive, Corona
Rail: 91/PVL IEOC Line Bus: RTA
Platform with 2 boarding tracks Parking lot (564 spaces) Enclosed pedestrian bridge, elevators, stairwells Size: 5.49 acres In Service Date: October 1995
Corona-North Main 250 East Blaine Street, Corona
Rail: 91/PVL, IEOC Line Bus: RTA, Corona Cruiser
Platform with 2 boarding tracks Parking lot (579 spaces) Parking structure (1,000 spaces) Enclosed pedestrian bridge, elevators, stairwells Size: 6.72 acres In Service Date: November 2002
Perris-Downtown 121 South C Street, Perris
Rail: 91/PVL Bus: RTA
Platform with boarding track Parking lot (444 spaces) Size: 5.5 acres In Service Date: June 2016 (bus transit center opened 2010)
Riverside-Hunter Park/UCR 1101 Marlborough Avenue, Riverside
Rail: 91/PVL Bus: RTA
Platform with boarding track Parking lot (528 spaces) Size: 9.35 acres In Service Date: June 2016
Moreno Valley/March Field 4160 Meridian Parkway, Riverside
Rail: 91/PVL Bus: RTA Amtrak
Platform with boarding track Parking lot (476 spaces) Stairwell Size: 14.47 acres In Service Date: June 2016

11
Perris-South 1304 Case Road, Perris
Rail: 91/PVL Bus: RTA Amtrak
Platform with boarding track Parking lot (907 spaces) Size: 40.57 acres In Service Date: June 2016
RDNOCC 4344 Vine Street, Riverside
N/A
CCTV operations center Offices and meeting rooms Size: 3,000 square feet In Service Date: April 2016
RCTC-Owned San Jacinto Branch Line In 1993, the Commission purchased the former Santa Fe Railroad’s San Jacinto Branch Line (SBJL) and several adjacent properties as part of the regional acquisition of BNSF Railway (BNSF) properties and use rights for a total of $26 million using Western County Rail Measure A and state rail bonds (Proposition 108 of 1990). Under this agreement, BNSF retained exclusive freight operating rights, serving its customers along the line and maintaining the right-of-way until such time as passenger service is implemented. Figure 3 is the SJBL corridor that extends 38.3 miles between Highgrove and San Jacinto within Riverside County. The alignment roughly follows Interstate 215 to Perris where it veers east, parallel to State Route (SR) 74 to Hemet and San Jacinto.

12
Figure 3: Map of San Jacinto Branch Line
RCTC Leased Park & Ride Locations Park & ride facilities are a critical piece of a well-balanced transportation network. By providing parking spaces for commuters to support carpool/vanpool arrangements and transit connections, park & rides help improve mobility and the efficiency of transportation investments. RCTC leases excess parking spaces from property owners, typically churches and retail locations, to help expand park & ride capacity in the Western Riverside County. The lease, a three-party agreement between the property owner, Caltrans, and RCTC allows flexibility in meeting the dynamic needs of commuters. The Commission supplements the park & ride network in Western Riverside County with an incremental 942 spaces across 12 lease locations. Figure 4 is a map of all of the park & ride facilities in western county.

13
Figure 4: Map of Park & Ride Facilities, Western Riverside County
1.6 Previous Studies and Plans
Previous studies and plans conducted by the Commission have been used as the building blocks for setting goals and priorities for transit projects and programs. The following is a list of the most notable and recently completed efforts that have guided the implementation of this SRTP.
• Transit Vision (2009) - This set forth the development of a 10-year Transit Vision that set the course of implementing more transit services and follow on studies and plans to facilitate future development in the transportation system in the county. The Transit Vision goals were to increase coordination; remove barriers to transit use; provide more efficient and effective service; ensure adequate funding; and improve energy efficiency. Recommendations resulted in the Commission reassessing funding formulas for LTF and STA.
• Strategic Assessment (2016) – This comprehensive document analyzed current public policy surrounding transportation in Riverside County, forecast future transportation conditions, and forecast future funding to meet the county’s long-term needs. The Strategic Assessment recommended several long-term planning and funding pursuits and changes to Commission policy, including the development of an LRTS and Next Generation Rail Study.

14
• Coachella Valley Rail Alternative Analysis (2016) – The purpose of the Alternatives Analysis was to consider alternatives for improving intercity transit between the Coachella Valley and Los Angeles, and to identify the alternatives that demonstrate best performance for more detailed evaluation. A Route Alternative and a No-Build Alternative were carried forward for the Tier 1 Environmental Impact Statement/Environmental Impact Report.
• Perris Valley Line Growth Study Market Assessment (2017) – The assessment reviewed the commuter market within and around the Perris Valley. The purpose was to determine where residents of Western Riverside County commute and travel in order to define the ridership needs and trends that allow for the most useful integration of the 91/PVL Line into Metrolink and regional transit systems. The findings found a necessity for increased service from the Perris Valley to longer-distance service to Los Angeles and north Orange County. It also found that unique travel market exists within the immediate areas around the Perris Valley including intra-county service on Metrolink. This study was followed up with a service and infrastructure needs assessment to implement the goals of this effort.
• Service & Infrastructure Needs to Support 91/Perris Valley Line Market Assessment (2017) – This assessment reviewed the operational feasibility of addressing the forecast travel markets identified in the Market Assessment. This included evaluating the potential reverse commute options to service March Air Force Base and the businesses in the area in the near and long-term and defining the infrastructure projects necessary to support these service needs.
• Vanpool Study (2017) - The purpose of this study was to assess the potential for the Commission launching an ongoing, subsidized, vanpool program in Western Riverside County. The study conducted an inventory of all existing vanpools, worked with employers to determine future vanpool potential, created a multi-year budget, implementation plan and project timeline. The plan was taken to the Commission for approval in October 2017.
• Long Range Transportation Study (2019) – Provided data and analyses for the Commission to consider as it develops future transportation policies and strategies in addressing growth and demand on the multimodal transportation system over the next 25 years.
• Next Generation Rail Study (2019-2020) – The objective of the study was to identify high-capacity transit corridor, identify potential new corridors, and prioritize potential future rail corridor for proceeding into project development. Task 1 was accepted by the Commission in September 2019 and included a Corridors Analysis Report that identified three corridors (Perris to San Jacinto, Perris to Temecula, and Corona to Lake Elsinore) that had the most viable future opportunities for rail expansion. Task 2 is underway and includes further analysis of the next generation corridors that would extend the existing 91/PVL to both Temecula and Hemet/San Jacinto and was completed in 2021.
• Park & Ride Study (2020) – The purpose of this study done in partnership with SANDAG, was to proactively address park & ride demand by better managing existing lots and identifying potential park & ride solutions to accommodate future demand in San Diego and Western Riverside County. The report also identifies strategies and tools to help

15
improve the planning, operation, and management of site-specific lots and the regional network.
• Traffic Relief Plan (2020) - This is an aspirational plan containing needed transportation projects and services countywide. The purpose of the Traffic Relief Plan was to serve as the legally-required expenditure plan for a potential half-cent sales tax that the Commission could propose to the voters of Riverside County.

16
2.0 WESTERN COUNTY VANPOOL PROGRAM
2.1 Vanpool Service Profile
In May 2018, the Commission expanded its Commuter Assistance Program to launch a new Vanpool subsidy program called VanClub for commuters who travel to a workplace in Western Riverside County. Vanpools can be especially effective in providing transportation options in areas that are hard to serve by transit and can be an amenity for employers to attract and retain employees. Vanpool programs are also effective at reducing traffic and vehicle emissions by decreasing the number of vehicles traveling daily. VanClub supports long-distance commuters by offering a subsidy of up to $400 per month which reduces the cost of the vanpool lease. For FY 2020/21, the average VanClub monthly lease cost before the subsidy averaged $1,118 per vehicle per month. Vanpool Vendors VanClub is operated through a third-party lease arrangement, known as “purchased transportation” by the FTA, where RCTC competitively procures for third-party vendor(s), who then provide a leased vehicle to vanpool groups. The lease cost includes the vanpool vehicle, insurance, maintenance and roadside assistance. The vanpool groups pay their monthly lease to the leasing vendor (minus the subsidy). The vendor then invoices RCTC for the monthly subsidy. RCTC contracts with two types of vendors who provide vanpool vehicles to VanClub participants: private sector vendors (referred throughout as private leasing vendors), where RCTC is currently under contract with AVR Vanpool and Commute with Enterprise, and a public transit agency/vendor, the California Vanpool Authority (“CalVans”). Program Guidelines and Reporting Requirements For both programs, RCTC establishes the minimum program requirements and program guidelines. In the spring of FY 2019/20 when the State issued a shelter in place order as a result of the COVID-19 pandemic, RCTC lowered the threshold of two of the program guidelines’ requirements as it relates to monthly reporting. These changes were necessary to assist essential workers to continue their work commutes during the pandemic. The two areas are noted below and this temporary change has continued in FY 2020/21. RCTC requires that a VanClub vanpool must:
1. Transport commuters traveling to a worksite or a post-secondary educational institution. The driver is counted as a commuter and is unpaid and all participants are volunteers;
2. Commute more than 30 miles round-trip each day; 3. Commute to an employer which must be located within Western Riverside County;

17
4. Commute at least 12 or more days during a calendar month period (lowered to at least one day per month during COVID-19);
5. The ratio of riders to available seats, including the driver (“occupancy”) must be at least 70% when a vanpool applies to the program and the vanpool must maintain a minimum occupancy rate of 50% (lowered to 15% during COVID-19); and
6. Permit RCTC to advertise the vanpool and the route to the general public and accept additional riders to fill empty seats.
All vanpools that lease with private sector leasing vendor(s), apply and report directly to VanClub. CalVans vanpools primarily serve the agricultural and post-secondary educational markets. As a public transit provider, CalVans takes applications directly from the vanpool groups, leases the vehicles to those groups and reports all program statistics directly into the National Transit Database (NTD). Many of the CalVans’ agricultural vanpools do not require nor accept a subsidy from RCTC (which is provided from RCTC through CalVans). Although RCTC has yet to subsidize any CalVans vanpools, there has been CalVans vanpool activity in the RCTC service area. As a result, any FTA funding that is generated from the CalVans western county vanpool activity entered into the NTD, is provided directly to RCTC. Public transit agencies that provide ongoing subsidies to third party leased vanpools for the purpose of reducing the lease/capital costs of the vehicle, may report their transportation data to the NTD. The benefit to reporting into the NTD is that public agencies realize a minimum of $2 in additional FTA Section 5307 funding for every $1 invested/expended towards the ongoing subsidy program, two years after the reporting year. Some programs nationwide have claimed up to a 3:1 return in funding. Pricing Structure The pool of riders share the cost of the lease (minus the subsidy), fuel, tolls, parking fees, car washes, and any other out of pocket commute expenses. Some employers assist by providing additional funding to offset the groups’ out of pocket costs, which are still accounted for and reported into the VanClub system and ultimately into the NTD.

18
The VanClub program does not collect any fares or funds from the participating vanpools. The vanpool groups pay for their lease directly to the private sector vehicle leasing vendor. However, VanClub requires that the participants track all their out-of-pocket expenses, and report on those at month end into the VanClub online reporting system. Travel Characteristics VanClub was launched on May 1, 2018 with the program enrolling 49 vanpools by the end of June 2019. By March 2020, the number of vanpools approved and enrolled into the program was 96. However, due to COVID-19 impacts, the number of vanpools were reduced to 30, and has remained stable throughout FY 2020/21. Figure 5 reflects the originating locations of the current vanpools to show that 63% come from other counties and 37% are intra-county vanpools.
Figure 5: Map of Vanpool Origins Destined for Western Riverside County
During FY 2020/21, two of the 30 active vanpools commuted to a post-secondary educational institution (University of California at Riverside). The remaining 28 vanpools commuted to military worksites at the March Air Reserve Base in Moreno Valley. Coordination with IE Commuter (IEC)
RCTC engages and partners with large employers in Western Riverside County, through the IE Commuter brand, to increase awareness and consideration for alternative commute modes to driving alone. These
alternatives include carpool, vanpool, bus transit, Metrolink, biking, walking, and teleworking. Currently, there are more than 200 IEC employer partners, representing approximately 265,000 employees that have signed partnership agreements to gain access to IEC employer programs,

19
services, and commuter incentives. IEC provides hands on support to assist employers with implementing rideshare programs through surveying employees to generate match lists and provide statistics so as to comply with regional air quality regulations. IEC also provide incentives and rewards for commuters that rideshare, marketing workshops for ETCs, as well as annual contests and promotions to encourage ridesharing.
2.2 Vanpool Existing Performance
The Commission had the benefit of reviewing and analyzing neighboring ongoing vanpool programs, that have been providing service since the mid 1990’s. This analysis demonstrated that ongoing, subsidized vanpool programs perform and grow in a very different manner than traditional transit services. There are several key external forces which impact whether a vanpool program grows, declines or is stagnate:
1. Employer growth and size – the more employers and the larger the employer within a vanpool service area, will result in additional vanpools on the road;
2. Gas prices – when gas prices rise, commuters tend to consider vanpooling; 3. Traffic congestion – the greater the roadway congestion and commute distance, the more
likely commuters will consider vanpooling; and, 4. Employer subsidies – should an employer also offer subsidies or benefits to offset the cost
to vanpooling, the more likely there will be vanpools formed at that employer. Early on, the Southern California CTCs recognized that the region’s vanpool activity, in general, crosses county lines (RCTC’s intra-county vanpools only account for 37% of active vanpools). As a result, in 2007 the CTCs agreed that the subsidy will be provided and statistics reported into the NTD, based on where the vanpool’s employer resides. Since the Inland Empire employer market is not as robust as Orange or Los Angeles counties, it is challenging to work with and promote vanpooling in Western Riverside county. In addition, one of the largest employers in the RCTC vanpool service area, the County of Riverside, does not participate in VanClub because they have an internal rideshare vehicle program. Even with these constraints and obstacles, from July 2019 to January 2021, the vanpool program resulted in:
• 34,684 unlinked passenger trips;
• 402,833 vanpool miles travelled; and
• 9,197 vehicle revenue hours. This vanpool activity resulted in the following:
• 930,834 vehicle miles of travel reduced;
• 503 tons of emissions reduced; and
• 63% average monthly occupancy rate.
20
The program’s benefit to the individual commuter is tremendous, as based on seven months of performance during FY 2020/21, the individual commuter participating in a VanClub vanpool, realized:
• An average one-way commute distance of 51.6 miles, commuting 19.7 days each month;
• An average one-way fare of $6.49 per person per trip; and
• An average monthly out of pocket fare of $255.63.
2.3 Vanpool Service Enhancements
A cornerstone of the Commission’s Commuter Assistance Program (CAP), which VanClub falls under, is its continued partnership with commuters, employers, and government. The partnership, based on voluntary efforts, makes a collective difference to increase the efficiency of the County’s transportation system—local roads, freeways, commuter rail, and public transportation. The combined effort results in less congestion, decreased vehicle miles traveled, and improved air quality. The major initiatives to continue these partnerships and efforts in FY 2021/22 and beyond, are described below.
• Regionalize the Rideshare/Vanpool Database: In partnership with CTC partners, the Commission will transition (Summer 2021) from a locally provisioned Inland Empire-based rideshare and vanpool system to a regional platform/database solution. This shift will expand the commuter database and improve the ridematching potential for those interested in sharing the ride to work via carpool or vanpool. Additionally, the regional platform will offer enhanced functionality and reporting that will better support program administration staff and employer worksite efforts to increase participation in alternative modes.
• Maximize Employer Partnerships: Given that the highest percentage of vanpool arrangements is formed at work sites, voluntary employer participation is critical to address congestion and air quality goals. Employers are the conduit to directly influence their employees’ personal transportation choices. The ongoing success of the CAP serving Western Riverside County, is a testament to the significance of employer partnerships, and this beneficial partnership has carried over into VanClub and vanpool formation. However, the prior economic downturn created a corporate culture of doing more with less and RCTC anticipates this culture will continue through and beyond the COVID-19 recovery period. Many ETCs feel spread too thin to commit to offering a rideshare program, let alone assist with vanpool formation. Delivery of in person/worksite rideshare support value-added services and tools to make the ETC’s job easier is a critical motivation to continue rideshare partnerships and development of new ones.
• Recover, Adjust, & Expand: The preceding efforts and partnerships combined with strategically supporting employers during the critical “Fresh Start” period of employers returning to worksites will position CAP for a recovery effort back to pre-pandemic vanpool levels. Still, going forward, future vanpool formation will not only be competing
21
with the traditional resistance to sharing the ride, it will also be challenged with the ongoing fear or uncertainty with shared-ride arrangements as well as more widespread adoption and more frequent or permanent telework arrangements. As such, VanClub anticipates the need to revisit and potentially adjust program requirements to adapt to the “new normal”. As a counter, the CAP will be working towards expanding beyond the traditional employer markets it serves. The primary go-to-market strategy has been to leverage larger employer (250+) partnerships to cost effectively access and market to employee commuters. While this channel has historically proven to be efficient over the years, a majority of employer and commuter employees are now positioned in the small/medium employer space. Additionally, the CAP will phase in more direct end-user engagement to further expand the awareness and consideration of vanpool.
• Improve Multimodal Connections: In addition to ridematching, information services, incentives to facilitate ridesharing, and offering ongoing vanpool subsidies through VanClub, the CAP also provides park & ride facilities to support ridesharing and vanpool efforts. The last Caltrans park & ride facility in the County was built in 1999. The Commission leases park & ride spaces from property owners to supplement the network of park & ride spaces in the County. A continued focus for FY 2021/22 will be increasing the number of leased spaces as needed and coordinating with ridesharers, vanpool groups, transit/rail partners, and Western Riverside County cities to identify areas where the lease program can help support car/vanpool arrangements and facilitate transit connections.
2.4 Vanpool Projected Ridership Growth
As a result of the COVID-19 impacts, the active vanpools that ceased operations from March to July 2020 have not returned to their regular commute patterns. With safety concerns, as well as the economy and workforce in an upheaval, VanClub temporarily ceased outreach activities in FY 2020/21, along with the recruitment of new vanpools. Given the impact the pandemic has had on the workforce and the need to continue social distancing during one’s commute, VanClub continues to relax the minimum program requirements (on occupancy and minimum days each month) to continue subsidy support for the active vanpools as they struggle to retain and recruit passengers. VanClub projections have been adjusted to reflect the continued impacts of the pandemic. Based on conversations with IEC employers, RCTC projects there will be 35 active vanpools by the end of FY 2020/21. Table 2.0 includes projections of the number of vanpools between FY 2022/22 to FY 2025/26. The projections estimate that t will take over two additional fiscal years before VanClub can return to pre-COVID-19 levels. The increase in active vanpools will achieve VanClub’s goals of expanding commuter transportation options, supplementing the bus/rail network, and increasing the number of participating vanpools.

22
Table 2.0: Projected No. of Active Vanpools, FY 2020/21 – 2024/25
Fiscal Year
No. of Vanpools
2020/21 2021/22 2022/23 2023/24 2024/25 2025/26
35* 60 81 93 110 126 *Total pre-COVID-19 was 78.
Based on the above projected growth in active vanpools, the unlinked passenger trips are anticipated to double in two years and increase 4.7 times by FY 2025/26 from FY 2020/21. Figure 6 illustrates the projected growth in vanpool ridership.
Figure 6: Projected Vanpool Ridership, FY 2021/22 – 2025/26
2.5 Vanpool Potential Fare Changes
At the start of FY 2020/21, the program had one private leasing vendor for the traditional employer vanpool market. In FY 2020/21, RCTC released a request for proposal to seek proposals from additional leasing vendors, with the goal to expand leasing options, price ranges, and vehicle options for program participants. An additional vendor proposed, the contract was approved and executed by the Commission, and the vendor has been provided a notice to proceed. The intent with an additional vendor is to provide more vehicle choices (such as hybrid or electric vehicles) and more competitive lease rates, with the hope that passenger out of pocket costs may decrease. Although RCTC procures for the third-party leasing vendors, the procurement is to ensure there is consistency and standard vehicle offerings among the vendors, and not to
62,084
105,103
172,659
215,271
252,729
295,164
0
50,000
100,000
150,000
200,000
250,000
300,000
350,000
FY 2020/21 2021/22 2022/23 2023/24 2024/25 2025/26
Projected Vanpool Ridership FY 2020/21 - 2025/26
23
control vehicle pricing or fares. RCTC has no control over the passengers’ out of pocket fares, only the amount of subsidy provided. In addition, after the lease cost the next highest out of pocket vanpool expense are fuel prices. Should electric or hybrid vehicles be introduced into the vehicle offerings, the lease cost may be higher. However, many employers offer free electricity while charging at work and the in-home electric charging costs can be quite low (depending on the electric provider and the low rates to charge off peak). This may also result in lower fares for certain vanpool groups. The other impact to lowering fares, is to assist the vanpool groups to increase their occupancy. The more passengers that share in the cost of the vanpools, the lower the fares per passengers. Although RCTC requires that vanpools maintain a minimum 50% occupancy (ratio of passengers to the vanpool seats), RCTC works directly with vanpool groups that lose riders, struggle with occupancy or are looking for part time riders so as to increase occupancy and decrease passenger fares. The new regional vanpool platform that RCTC is transitioning to, has additional online tools to assist vanpools with finding additional riders and filling seats in vanpools. Given the continued impact of COVID-19 and the federal directives for social distancing on board all forms of public transportation, it is anticipated that vanpools will continue to have slightly lower occupancy throughout FY 2021/22. In the end, RCTC cannot predict nor determine whether vanpool fares will increase or decrease in the future; however, it is RCTC’s hope that these additional vendors and actions will result in lower fares and an even more cost-effective vanpool service.
2.6 Vanpool Proposed Incentive Program
The Commission’s Commuter Assistance Program’s $2/day Rideshare Incentive is a popular startup incentive designed to encourage commuters to shift to more sustainable transportation options. Eligible Western Riverside County residents that start to car/vanpool, take the bus or rail transit, telecommute, bike, or walk to work can receive $2/day for every day of ridesharing in a three-month period. However, under current guidelines, one cannot participate in this incentive while receiving the VanClub subsidy or any other vanpool subsidy offered by neighboring subsidizing agencies. In 2021, after careful analysis, the Commission staff may be seeking approval to adjust the incentive from $2/day to a more motivating $5/day and establishing a max incentive amount (i.e. $100) for the three month incentive period to manage financial exposure, and lastly, making the incentive eligible for those that are in subsidized vanpools. The rational for this is that under the current structure, the incentive is eligible for traditional transit modes (bus/rail) that are highly subsidized but not for vanpools which are also subsidized but at a much lower rate. Ultimately, the goal of the proposed incentive update is to increase all forms of rideshare, and as part of that, help form new vanpools, regardless of their destination. If approved, this could help jump start vanpool recovery efforts.

24
2.7 Vanpool Capital Investments
The vanpool program does not expend any of its budget on capital outlays, due to the purchased transportation approach to delivering the program. RCTC contracts with leasing vendors, who in turn purchase, own and maintain all vanpool vehicles, along with their administrative and maintenance facilities. The vanpool groups determine their pickup and drop off locations, as well as any interim stops between home and work. Thus, RCTC does not own or maintain any of the vanpool stop locations. As a result, all expenditures of the program are considered operating expenses and RCTC does not budget or expend funds on capital projects for vanpooling.

25
3.0 COACHELLA VALLEY AND WESTERN COUNTY RAIL PROGRAMS
3.1 Coachella Valley Rail
The Commission is involved in two capital planning efforts in the Coachella Valley: the Coachella Valley- San Gorgonio Pass Rail Corridor Study and the Coachella Valley Special Event Train Platform, which are described in the sections below.
3.1.1 Coachella Valley – San Gorgonio Pass Rail Corridor Project
The Commission, in conjunction with CVAG, Caltrans, and FRA have begun the first phase of detailed corridor planning with the initiation of the Service Development Plan (SDP). The SDP will be the first major study that will carefully design a viable service plan with appropriate ridership and service modeling plans. This effort along with completion of a Tier 1 programmatic Environmental Impact Report/Environmental Impact Statement (EIR/EIS) for the corridor will allow it to compete for future federal funding. The
Commission worked closely with Caltrans to complete the Alternatives Analysis (AA). The AA shows promising ridership potential for the new route. The Commission is the lead on the SDP and is using FRA grant funds to complete the project. The administrative draft EIR/EIS was released in May 2021. In addition, CVAG who serves as the primary policy advisor for regional transportation planning in the valley approved the establishment of a 90% bus transit/10% passenger rail service funding allocation split for Coachella Valley STA funds. An MOU was established between the Commission and CVAG to develop a Coachella Valley Rail Fund that will use
both the STA funds and additional state and local funds to conduct station development studies and provide initial capital funding for station development. It has been determined through numerous studies over the years that the Amtrak intercity option is preferred over a Metrolink commuter option, because of the long trip length and added comfort and amenities on the Amtrak trains and Amtrak’s contractual rights to operate over freight railroads. Project Location Figure 7 is a proposed map of the Coachella Valley–San Gorgonio Rail Corridor (Corridor) that runs from Los Angeles to Indio through four Southern California counties: Los Angeles, Orange, Riverside, and San Bernardino. The Corridor refers to the approximately 144-mile long rail corridor between Los Angeles Union Station (LAUS) and the City of

26
Indio. The Corridor consists of two segments: the western 59-mile long segment between LAUS and Riverside/Colton, and the eastern approximately 82-mile segment between Riverside/Colton and Indio.
Market Analysis As of 2019, the Los Angeles Basin has a population of approximately 17.4 million, and approximately 7.7 million jobs. The Coachella Valley has a population of approximately 441,000, and approximately 14.1 million annual visitors. There are currently 160,000 daily trips through the San Gorgonio Pass.
The proposed intercity passenger rail service would provide a conveniently scheduled link to the greater metropolitan areas of Southern California for the communities in the fast-growing Coachella Valley and Banning Pass areas. It will also provide Los Angeles and Orange County residents’ access to the world class Coachella Valley visitor destinations and festivals.
The market analysis performed as part of the Final Alternatives Analysis, July 25, 2016, identified a projected 47% increase in travel over the next 20 years between Los Angeles and Coachella Valley and a projected 23% population increase by 2035 for the four counties comprising the Corridor (Los Angeles, Orange, Riverside, and San Bernardino). Coachella Valley is expected to double its population and the population of the San Gorgonio Pass Area is projected to increase by 134% by 2035.
Numerous disadvantaged communities exist within the Corridor that could benefit from a significant improvement in regional mobility and a health benefit from reduced vehicle emissions from an intercity passenger rail service.
Proposed Service The service would operate over tracks owned by Metro (5 miles starting at LAUS), BNSF Railway (64 miles from Los Angeles to Colton), and UP (72-76 miles from Colton to Indio or Coachella). Needed new rail infrastructure to achieve the project’s on-time performance goal without adding delay to freight service in the Corridor is anticipated to include a new third main track and associated improvements to be constructed primarily within the UP right-of-way from Colton to Indio or Coachella. Two daily roundtrips are proposed for initial service. The running time between Los Angeles and Indio is 3 – 3.5 hours, with a proposed maximum speed of the service is 79 miles per hour (mph). Connections would be provided to The Pacific Surfliner daily intercity service at the Fullerton Station, and Metrolink’s IEOC Line at the Riverside – Downtown Station. Connections to Metrolink’s San Bernardino Line could also be made at the Riverside – Downtown Station with rail or bus transfers.

27
Potential Facilities The proposed Coachella Valley Corridor intercity service would stop at three existing Metrolink/Amtrak stations: LAUS, Fullerton, and Riverside – Downtown. Five or six additional existing or new stations are proposed between Riverside and Indio. Options include:
• Redlands/Loma Linda (new station)
• Banning/Beaumont/Cabazon (new station)
• Palm Springs (existing Amtrak station)
• Mid Valley (new station)
• Indio (existing bus station and planned intermodal station)
• Coachella (possible extension in the Environmental Document) The maximum speed of passenger trains in the corridor is 79 miles per hour, and the one-way travel time between Los Angeles and Indio or Coachella would be approximately 180 to 200 minutes. Project Status: Service Development Plan and Tier 1 Environmental Project Cost Estimate: $6 million for Planning and Environmental Project Funding: FRA, Prop 1B, STA Funds Project Completion: Late 2021 for EIR/EIS

28
Figure 7: Map of Proposed Coachella Valley – San Gorgonio Pass Rail Corridor

29
3.2 Western County Rail - Metrolink
3.2.1 Metrolink Service Profile
As mentioned previously, the Commission is one of the five member agencies that comprise the SCRRA JPA. The other member agencies are SBCTA; Metro; OCTA; and VCTC. RCTC holds two voting positions on the 11-member board. Metrolink provides service to the various counties with seven commuter lines, three of which serve Riverside County including the IEOC Line, Riverside Line, and 91/PVL Line. Figure 8 depicts the Metrolink Commuter Rail System Map.
Figure 8: Metrolink Commuter Rail System

30
IEOC Line This first of its kind in the country suburb-to-suburb line runs 100.1 miles from San Bernardino Transit Center to Oceanside in North San Diego County with stops in the cities of Irvine and San Juan Capistrano, in Orange County, and was started in October 1995. The alignment roughly follows the Riverside Freeway, SR-91, along the Burlington Northern Santa Fe (BNSF) San Bernardino Subdivision in Riverside and Orange County. A map of the IEOC is provided in Figure 9. This commuter rail service to Orange County provides a transportation alternative in one of the busiest corridors in Southern California. The line is a jointly funded by the Commission, SBCTA, and OCTA. As of July 2016, the line operates 16 trains Monday through Friday, including five peak period roundtrips. Each train travels between the Riverside – Downtown Station and the Irvine Station, with a few trains originating and/or terminating at the San Bernardino – Downtown Station, the Laguna Niguel/Mission Viejo Station, or the Oceanside Station. Weekend service began on July 15, 2006. This year-round weekend service was modeled after the successful RCTC-funded Beach Trains. The weekend service includes two roundtrips leaving from San Bernardino to Oceanside in the morning and returning in the afternoon on Saturday and Sunday. The trains make all IEOC stops, plus the San Clemente Pier on weekends. The current running time between Riverside – Downtown and Irvine is approximately 74 minutes. RTA, Corona Cruiser, and Amtrak provide connecting transit service. The average trip length is 33.8 miles.
Figure 9: Map of Metrolink IEOC Line

31
Riverside Line This line extends 59.1 miles between the City of Riverside and LAUS along the UP Railroad alignment and was started in June 1993. The route roughly follows the Pomona Freeway corridor (SR-60) through the cities and communities of Jurupa Valley, Ontario, Pomona, Walnut, Industry, La Puente, Montebello, and Commerce. Existing stations include Riverside – Downtown, Jurupa Valley/Pedley, Ontario – East, Pomona – Downtown, Industry, Montebello/Commerce, and LAUS. A map of the Riverside Line is provided in Figure 10. The Commission, SBCTA, and Metro jointly fund the line. The Riverside Line offers 12 weekday trains between the Riverside – Downtown Station and LAUS, travelling westbound in the AM and eastbound in the PM and one roundtrip during the off-peak hours. RTA, and Amtrak provide connecting transit service in Riverside County. The scheduled peak-direction trip time between Riverside – Downtown and LAUS is approximately 85 minutes, including dwell time at intermediate stations. The average trip length is about 39.3 miles.
Figure 10: Map of Metrolink Riverside Line

32
91/PVL Line This line extends 85.6 miles between the Perris – South Station and LAUS. This route officially began operating peak period service in May 2002 when it was called the 91 Line. The alignment roughly follows the Riverside Freeways (SR-215 and SR-91) along the San Jacinto Branch Line and BNSF San Bernardino subdivision from Riverside County to Fullerton in Orange County where it continues northwest to Downtown Los Angeles, and has a total of 12 stations, as depicted in Figure 11 below. The Commission, OCTA, and Metro jointly fund the Line. In June 2016, service began on the 24-mile extension of the Metrolink 91-Line from the Riverside – Downtown Station, through the Perris Valley to the City of Perris in Western Riverside County, which is now rebranded as the “91/Perris Valley Line”. With the Perris Valley extension, four new stations were added at Perris – South, Perris – Downtown, Moreno Valley/March Field, and Riverside – Hunter Park/UCR. The 91/PVL Line offers 13 weekday trains between the Perris – South Station and LAUS. This service provides four roundtrips between Perris – South and LAUS during peak hours in the peak direction. The 91/PVL Line began weekend service in October 2019 with two roundtrip trains that operate between LAUS and the Perris- South Station, traveling westbound in the AM and eastbound in the PM. Previously, these weekend trains only operated between Riverside and LAUS. The peak period running time between Perris – South, Riverside – Downtown, and LAUS is approximately 127 minutes. RTA, Corona Cruiser, and Amtrak provide connecting service in Riverside County. The average trip length is 36.6 miles.
Figure 11: Map of Metrolink 91/PVL Line

33
Metrolink Days of Operation Metrolink regularly operates Monday through Friday. Weekend service operates on a reduced schedule on the IEOC and 91/PVL lines. Metrolink operates on a Sunday schedule on the following holidays: New Year’s Day, Independence Day, Memorial Day, Labor Day, Thanksgiving Day, and Christmas Day.
3.2.2 Metrolink Fare Structure On the weekdays, Metrolink’s ticket prices are distance-based and calculated on the shortest driving miles between stations. The Metrolink ticket price consists of three elements: a base boarding charge, an additional increment related to the number of miles traveled, and finally a modest increment to permit Metrolink passengers to transfer to bus and light rail transit providers without requiring an additional fare on selected connecting transit operators and a reduced rate on others. Each station combination is uniquely priced, based on driving miles from one station to the other. A ride from Downtown Riverside to LAUS is a 59-mile one-way trip; a ride from Downtown Riverside to Irvine is a 40-mile trip. The distance charge is currently capped at 80 miles. Metrolink is reviewing possible changes to the current fare structure which could be implemented in the next couple of years.
Ticket Types Metrolink offers a variety of ticket types for different types of travelers. Ticket types are either single-day use or multiday use.
Single Day Use
• One-Way – A single one-way trip from origin station to destination station specified on the ticket. The trip must begin on the date and prior to the expiration date printed. Mobile and Print at Home tickets expire at 3 am the following date of purchase
• Round-Trip – Valid for two trips between origin station and destination station specified on the ticket. The first leg of the trip is valid for three hours from time of purchase while the return is valid anytime one the same day or until 3 am the following day.
• $10 Weekend Day Pass – Valid for unlimited systemwide travel on either Saturday or Sunday and expires at 3 am the following day. The Weekend Day Pass is accepted for free transfers to connecting transit, expect Amtrak.
• $10 Holiday Promotion – Similar to the $10 Weekend Pass, this ticket is valid on six federal recognized holidays including, New Year’s Day, Independence Day, Memorial Day, Labor Day, Thanksgiving, and Christmas Day
• 5-Day Flex Pass – Valid for five one-day passes valid for travel within 30 days.

34
• 7-Day Pass – Valid for unlimited travel during a consecutive seven-day period between origin station and destination
• Monthly Pass – Valid for unlimited travel between origin station and destination during the calendar month printed on the pass.
Multi-Line Option Some Metrolink tickets can be used on more than one line. Tickets for the Riverside Line are valid for travel between stations of equal or lesser distance on San Bernardino or 91/PVL Lines. Tickets on the 91/PVL Line are valid on the Riverside Line between stations of equal or lesser distance. Tickets for the IEOC Line are valid on the 91/PVL Line between stations of equal or lesser distance with an origin and destination between Corona and Riverside.
Ticket Purchase Options
• Ticket Machine Devices (TVDs) – Metrolink began transition to TVDs in spring 2020 with one of the first TVDs installed at the Riverside – Downtown station. Metrolink has completed installation of TVDs at all the stations. The TVDs dispense new paper tickets that contain a watermark and holographic security image to prevent duplication. The TVDs currently accept cash, card payments, and contactless payment including Apple Pay, Samsung Pay, and Google.
• Mobile App – Metrolink Just Ride mobile app is available on both Apple App Store and Google Play. The app accepts payment cards, Apple Pay and Corporate Quickcards. Tickets are scanned directly from the app via a QR code.
• Print at Home – One-way ticket can be purchased via Metrolink’s ticket portal. Users can buy tickets and push the tickets to the Metrolink mobile app wallet.
• Pass by Mail and Outlets – Metrolink provides forms to purchase tickets by mail. Forms must be received by the 15th of the month to receive the tickets by the 1st of the following month. Two ticket outlets are available for Riverside County line riders at LAUS. Tickets are available for purchase with personal checks at the outlets
Advance Purchase Ticket Paper One-Way or Round-Trip tickets for a future date can be purchased up to one year in advance from a TVD. The Advance Purchase Ticket will not have an expiration time printed on it and can be used at any time on the day you chose to travel. Discounted Fares

35
Everyday Discounts
• Student/Youth - 25% off Monthly Pass, 7-Day Pass, One-Way and Round-Trip tickets. Youths are ages 6 to 18. Students must present valid Student ID to the fare inspector upon request.
• Child - Three children (ages 5 and under) ride free with an adult using a valid ticket - each additional child pays youth fare.
• Senior / Disabled / Medicare - 25% off Monthly Pass and 7-Day Pass. 50% off One-Way and Round-Trip tickets. Seniors qualify for discount is age is 65 or over. Disabled or Medicare discount applies if you have the appropriate identification.
• Active Military - 10% off One-Way and Round-Trip tickets.
91/PVL Line Discount The Metrolink Board approved a new set of 91/PVL Line discounts, which began in May 2017, to encourage ridership from the new stations. The two separate discounts were for trips connecting to stations outside of Riverside County and another within Riverside County. This discount is now recognized as the regular fare for the line.
Fares connecting the 91/PVL Line Extension stations to stations outside of Riverside County will be sold as though Riverside – Downtown is the origin or destination. For example, a trip between Perris – South and LAUS will be the same price as a trip between Riverside – Downtown and LAUS. Fares connecting the 91/PVL Line Extension stations to stations within Riverside County are discounted 25%.
Loyalty Program A new Loyalty Program was initiated in 2020. This program includes:
• Cashback rewards that are accumulated and paid at regular intervals and points that can be redeemed for services
• Tiered benefits at different levels of the program
• Points that can be redeemed for products and services from third parties
• Other rewards for being a member, e.g. member-only sales, first notice of new products, extra discounts
Existing Transfer Agreements

36
The Commission has actively supported transit connections by establishing agreements with SCRRA and the regional transit providers to provide free transfers for all connecting transit services at Riverside County stations. With the agreement, Metrolink ticket holders can ride both fixed route and Dial-A-Ride services for free as they travel to and from a station in Riverside County. The Commission subsidizes half the fare while Metrolink subsidizes the other half. Transfer agreements are currently in place with RTA, Omnitrans, and the Corona Cruiser.
3.2.3 Metrolink Revenue Fleet
Metrolink has 39 revenue train sets in operation1. The Metrolink fleet is composed of 62 locomotives (including 3 expansion locomotives) and 258 passenger cars (73 cab cars and 185 coach cars)2. Metrolink has upgraded its fleet of locomotives to operate new Tier 4 clean technology locomotives In March 2020, Metrolink announced that it has removed all first-generation Tier 0 locomotives from its fleet.
3.2.4 Metrolink Rider Profile
In 2018, Metrolink completed an Origin-Destination Study which presented results from onboard surveys to profile and update current customer profiles, travel characteristics, and perceptions of service quality. The results were critical to guide Metrolink’s planning, marketing, and financial decisions. The following data represents the three lines that operate in Riverside County. It should be noted that the information in Table 3.0 reflects survey results from all riders coming from Riverside, Orange, San Bernardino, and Los Angeles counties.
1 Source: Metrolink 10-Year Strategic Plan 2015-2025 Technical Appendix 2 Source: Metrolink Transit Asset Management Plan (May 2016)

37
Table 3.0: Metrolink Rider Profile
Riverside Line IEOC Line 91/PVL Line
Ethnicity: Black/African American Hispanic Asian Caucasian (non-Hispanic) Other
9%
29% 35% 22% 5%
7%
33% 15% 40% 6%
14% 26% 21% 31% 7%
Median Household Income $96,310 $89,641 $90,860
Automobile Availability 90% 93% 89%
Employment Status Not Employed/Retired Part-Time Self-Employed Student Only Full-Time
1% 3% 2% 8%
86%
1% 4% 2% 4%
89%
1% 3% 4% 7%
86%
Languages Spoken at Home Other Cantonese Mandarin Tagalog Spanish English
9% 5% 9% 6%
23% 47%
9% 1% 1% 1%
27% 59%
13% 1% 2% 5%
20% 57%
English Proficiency Not Well Well Not Well
3%
13% 84%
3%
11% 86%
3%
14% 83%
Ridership Frequency (Rides 3 Days or More per Week)
90% 89% 85%
Average Ridership Frequency (Days per Weekday)
4.4 4.5 4.2
Average Trip Length (miles) (Weekday) 38.8 32.9 38.6
Source: Metrolink Origin-Destination Study, 2018
3.2.5 Metrolink Existing Performance
In FY 2018/19, Metrolink recorded its highest systemwide annual ridership at almost 12 million passengers. FY 2018/19 marked the 4th consecutive year of systemwide ridership growth despite regional and national ridership declines experienced by other transit operators during the same time period, as shown in Figure 12. Metrolink attributed the increased ridership to favorable economic conditions and several initiatives that targeted new riders. A strong element of the growth was weekend ridership, which grew from about 67%, systemwide from FY 2008/09 to FY 2018/19. In FY 2019/20, Metrolink year-to-date (YTD) ridership was steadily increasing over the prior year until COVID-19 restrictions were issued causing ridership to decline a drastic 90% in less than one month. Ridership levels remain low for the duration of the pandemic lock down and there is hope for recovery as the restrictions are lifted and people return to work.

38
3,076,4613,219,101 3,310,791 3,265,614 3,170,251
2,453,579
603,163
1711142
100,000
600,000
1,100,000
1,600,000
2,100,000
2,600,000
3,100,000
3,600,000
FY15 FY16 FY17 FY18 FY19 FY20 FY21* FY22*
Total Ridership for Riverside County Lines, FY 2014/15 - 2025/26
Figure 12: Metrolink Systemwide Annual Ridership, FY 2014/15 – 2021/22
*Metrolink Projected Ridership
Combined ridership on the Riverside County Lines (IEOC, Riverside, and 91/PVL) in the last five years remained relatively stable between FY 2014/15 through FY 2018/19 with growth of about 3%, as reflected in Figure 13. Local factors that contributed to this was the commencement of the 91/PVL Line in June 2016 and new weekend service that was added in October 2019.
Figure 13: Total Ridership Riverside County Metrolink Lines, FY 2014/15 – 2021/22
*Metrolink Projected Ridership
11,719,987 11,504,399 11,640,268 11,688,607 11,935,321
9,357,019
2,431,085
6514775
300,000
2,300,000
4,300,000
6,300,000
8,300,000
10,300,000
12,300,000
14,300,000
FY15 FY16 FY17 FY18 FY19 FY20 FY21* FY22*
Metrolink Systemwide Annual Ridership, FY 2014/15 - 2021/22

39
Figure 14 illustrates that the majority (51%) of passengers in the County take the IEOC, followed by one-third (33%) who take the 91/PVL. The data also indicates that about half of the riders are headed towards Orange County and the other half to Los Angeles. Based on passenger station data in Figure 15, stations located along the SR-91 have the largest percentage of riders while PVL stations are continuing to make strides in attracting riders from their respective communities and adjacent cities.
Figure 14: Riverside County Average Weekday Passenger Distribution by Line
Source: 2020 Year-to-date Metrolink Boarding Reports
Figure 15: RCTC Stations Passenger Distribution
Source: 2020 Year-to-date Metrolink Boarding Reports
Riverside Line16%
Inland Empire - Orange County51%
91/Perris Valley Line33%
Riverside County Average Weekday Passenger Distribution by Line, 2020
Riverside -Downtown, 323,
26%
Corona - North Main, 302, 25%
Riverside - La Sierra, 258, 21%
Corona - West, 169, 14%
Jurupa Valley/Pedley, 44,
4%
Perris -South, 39, 3%
Moreno Valley -March Field, 36,
3%
Perris -Downtown, 35,
3%
Riverside Hunter Park, 12, 1%
RCTC Stations Passenger Distribution, 2020

40
3.2.6 Metrolink Key Performance Indicator
A key performance indicator is on-time performance. On-time performance and reliability are important metrics that relate directly to customer experiences and the ability to retain existing and attract new riders. Metrolink’s targeted on-time performance is 95%. A train is considered on-time if it reaches its destination within five minutes of the scheduled arrival time. Various factors that impact on-time performance are freight delays, incidents and accidents on the tracks, and other operational and mechanical problems. Figure 16 below shows that on-time performance has improved in FY 2019/20, particularly for the Riverside and IEOC Lines which reported on-time performance below 85% and 90%, respectively, in the last couple of years.
Figure 16: Riverside County Served Lines On-Time Performance
Source: Metrolink OTP reports
75.0%
80.0%
85.0%
90.0%
95.0%
100.0%
FY15 FY16 FY17 FY18 FY19 FY20 FY21 YTD
Riverside County Lines On-Time Performance
91/PVL IE/OC Riverside Line Target OTP

41
3.2.7 Metrolink Productivity Improvement Efforts
Due to COVID-19 impacts, productivity improvement efforts will focus on safety and regaining ridership for the near-term. In April 2020, Metrolink conducted an online survey with mobile app account holders and email list subscribers and received an overwhelming 11,069 responses (about 98% from email recipients). The objectives of the survey were to learn:
✓ Who is still riding Metrolink? ✓ What changes do riders expect to their commute post COVID-19? ✓ How likely are riders to return to riding Metrolink? ✓ What strategies are effective in motivating riders to return?
Preliminary findings determined that:
• Low-income riders are more likely to continue to rely on Metrolink during the pandemic;
• 1 in 3 current riders who still ride Metrolink have no car available;
• 71% of current riders describe themselves as essential workers, with healthcare as the primary essential industry at 39% followed by transportation and logistics at 14%;
• 81% of riders indicated that they are likely to ride again;
• 13% of riders are unlikely to ride again with concerns about social distancing and cleanliness as the main barriers;
• Riders are likely to return in phases over the summer, fall, or winter as stay-at-home orders are lifted, schools are reopened, and when treatment or vaccine exists;
• Riders were highly satisfied with how Metrolink was keeping them informed;
• Ridership strategies suggests phased implementation with improvements to cleaning, social distancing, fare discounts, security, and amenities; and
• The top 5 improvements that would motivate riders to return, ride again, or ride more are: 1) Hospital grade cleaning and disinfecting; 2) Hand sanitizers available on every train car; 3) Social distancing markers at the station; 4) Cleaning crews onboard the train at all times; and 5) One blocked-off seat next to each rider for social distancing.
Survey results clearly indicate that enhanced safety and sanitization measures are critical to gaining riders back.
3.2.8 Metrolink Recent Service Changes
In October 2019, the following changes were made to the 91/PVL and Riverside Lines.
• 91/PVL - Weekend service was expanded in Perris as a result of customer requests and interests. Two morning trains and two afternoon/evening trains now serve the Perris Valley area on both Saturday and Sundays. On the weekdays, the 91 PVL

42
Line eliminated the bounce back trains from Perris – South and Riverside – Downtown and extended a morning train to Los Angeles providing four morning trains to Los Angeles, and a new afternoon was added from Los Angeles to Perris.
• Riverside Line - The first morning train was adjusted to depart 12 minutes earlier at 4:35 am to allow commuters to arrive at LAUS by 6:00 am while the second train was adjusted to depart seven minutes earlier at 5:35 am to allow for a 7:00 am arrival. These adjustments were made in response to a Metrolink survey to gauge customers’ preferred arrival times.
For the Spring 2020 schedule change, a mid-day reverse train on the 91/PVL Line was proposed from Los Angeles to Perris; however, is postponed due to the COVID-19 pandemic. This train would have provided an option for Riverside County residents who work in Los Angeles to have a return trip in case they need to return home early or have appointments. It also provides travelers who need to spend only half the day in Los Angeles to have a return trip. In the afternoon, a train that originated in Riverside would also be extended to depart from the Perris – South Station.
3.2.9 Metrolink Major Trip Generators
Feeder services to stations are vital to the success of commuter rail in Western Riverside County. Coordination and consultation with transit providers and local agencies is an ongoing process. RTA, RCTC, and Metrolink continue to work together to increase awareness of the RTA bus connections at Commission Metrolink stations. Ads regularly appear in the RTA Ride Guide promoting free RTA transfers from Metrolink stations. The RTA Ride Guide includes the Metrolink stations in its route directory listing. Additionally, Metrolink occasionally helps promote the RTA CommuterLink service in materials at the stations. The Commission will be monitoring the Corona Cruiser COA study to identify opportunities in which bus and trains schedules can be more closely aligned to allow more transfer opportunities for commuters.
3.2.10 RCTC Proposed Metrolink Service Plan
The 5-year Metrolink Service Plan is based on recent ridership trends and Commission goals. These goals are consistent with the broad objectives of Metrolink SCORE program for increased regional train service to be implemented by the 2028 Olympics. Table 3.2 below outlines a 5-year service growth scenario that will be initiated upon full-service recovery from the pandemic. The specific implementation of this service will be subject to several factors including funding, availability of equipment, availability of train crews, and renegotiations of shared-use agreements with railroads.

43
Table: 3.2: Proposed Riverside County Metrolink Service Improvements
Fiscal Year Recovered Year 1 Year 2 Year 3 Year 4 Year 5 Oct Apr Oct Apr Oct Apr Oct Apr Oct Apr Oct Apr
Line Proposed
91/PVL
AM Peak1 4 4 5 5 5 6 6 7 7 8 8 8
Reverse Peak* 1 1 1 1 1 2 2 2 2 2 2 3
Off-Peak 2 2 2 2 2 2 2 2 2 2
Reverse Peak* 1 1 1 1 1 2 2 2 2 2 2 3
PM Peak1 5 5 6 6 6 7 7 8 8 9 9 9
Total 11 11 15 15 15 19 19 21 21 23 23 25
Total trains to Perris
8 8 *12
Weekends Total 4 4 4 4 6 6 6 6 8 8 8 8
IEOC Line
AM Peak 5 5 5 5 6 6 6 7 7 7 8 8
Reverse Peak 1 1 1 2 2 2 2 2 2 2 2 2
Off-Peak 5 5 5 5 5 5 5 5 5 5 5 5
Reverse Peak 1 1 1 1 1 1 1 1 1
PM Peak 5 5 5 5 6 6 6 7 7 7 8 8
Total 16 16 16 18 20 20 20 22 22 22 24 24
Weekends Total 4 4 4 4 6 6 6 6 8 8 8 8
Riverside Line
AM Peak 5 5 5 5 5 5 6 6 6 6 6 6
Reverse Peak 1 1
Off-Peak 2 2 2 2 2 2 2 2 2 2 2 2
Reverse Peak 1 1
PM Peak 5 5 5 5 5 5 6 6 6 6 6 6
Total 12 12 12 12 12 12 14 14 14 14 16 16
Total Trains Through Riverside
39 39 43 45 47 51 53 57 57 59 63 65
(weekdays)
BNSF FUL-RIV Totals
27 27 31 33 35 39 39 43 43 45 47 49
Projected Subsidy (Millions)
$21 $24 $26 $28 $30 $32
* FTA Minimum Requirement of 12 per SSGA in PVL 1 Current weekday AM peak is approximately 4:00 am to 8:30 am and weekday PM peak is 3:30 pm to 6:55 pm.
Immediate Strategies after Recovery for Year 1:
• Reinstate 12 train moves 91/PVL to Perris
• Add new IEOC reverse commute trip

44
• Add new weekend IEOC - currently only two roundtrips (4 trains) since 2006 (AVL has 12 weekend trains)
• Add 91/PVL weekend roundtrip from LA-Riverside-Perris expand IE as a destination Goals by Line:
• 91/PVL o Year 1 - Add 91/PVL weekday peak and reverse peak trips to Perris o Year 2 - Add 91/PVL weekday peak trip o Year 3 - Add 91/PVL weekday peak trip o Year 3 - Add 91/PVL weekend service o Year 4 - Add 91/PVL weekday reverse peak trip
• IEOC o Year 1 - Add IEOC weekday peak trip o Year 2 - Add IEOC weekday peak trip o Year 3 - Add IEOC weekend service o Year 4 - Add IEOC weekday peak trip
• Riverside o Year 3 - Add Riverside weekday peak trip
COVID-19 Impacts on Service Plan In 2020, Metrolink implemented a service adjustment to address the dramatic reduction in
ridership due to COVID-19 impacts. The plan is for this to continue until demand increases
such that reinstating pre-COVID-19 service levels are justified. The approach highlights are
below.
Metrolink level of service with a 30% scheduled train service reduction, Monday- Friday
• 115 trains will operate Monday- Friday
• 52 trains will be removed from service Monday-Thursday
• 54 trains will be removed from service Fridays
• 48 trains on Saturday, no change
• 42 trains on Sunday, no change
• Total miles operated, 7,761 Monday- Friday Key Strategies
• Maintain higher performing schedules
• Provides customers peak service during the morning and evening commutes
• Four train sets held out of the current 40 set rotation
• Reduces total daily mileage by about 2,235 miles for a fuel cost savings of about $14,591 daily
• Reduces crew utilization by 5 for crew cost savings of about $3,140 daily
• Reduces footprint on foreign railroads for cost savings of about $2,862 daily
• Ability to restore full service on short notice

45
Riverside County Impacts
• Riverside Line reduction of trains: 402, 404, 405, 411, 412
• 91/PVL reduction of trains: 711
• IEOC reduction of trains: 804, 813
• Future service additions will be reviewed and implemented based on needs and passenger demand
3.2.11 Metrolink and RCTC Marketing Plans and Outreach
Metrolink and RCTC work collaboratively to promote and market Metrolink services. Metrolink focuses on systemwide promotions and campaigns and RCTC supplements these efforts with more targeted outreach in the County. Following is a summary of these efforts.
Metrolink Initiated Promotions and Marketing Campaigns Metrolink will continue line and destination-specific marketing to attract, retain, and recapture riders by developing customized marketing tactics. Loyalty Program Campaign Metrolink has initiated a loyalty program to reward riders for their continued engagement with Metrolink. The Loyalty Program will offer:
• Cashback rewards that are accumulated and paid at regular intervals
• Points that can be redeemed for services
• Tiered benefits at different levels of the program
• Points that can be redeemed for products and services from third parties Other rewards for being a member, e.g. member-only sales, first notice of new products, extra discounts. Corporate Partnerships Program (CPP) Metrolink has incorporated the CPP into the Mobile App and has allowed the TVDs to redeem the QuickCards. Metrolink is also proposing a business-to-business marketing campaign to gain more corporate accounts. Line Awareness Marketing Campaign Metrolink conducts marketing campaigns to attract new ridership with various marketing strategies, such as billboards, bus shelter advertising, radio spots, social media advertising, digital and mobile app advertising, and print advertising. Creative direct mailers for the IEOC Line, internet ads for the 91/PVL Line, and social media ads for the Riverside Line have offered promotional codes for free or discounted rides.

46
In addition to the regular train services and after the pandemic recovery, the Commission will once again pursue partnerships with other agencies to provide access to sporting and holiday events with special services such as the Angels Express Train and Festival of Lights Train. These types of promotional services have been highly successful in increasing ridership and introducing new riders to commuter rail. Angels Express Train (Future) The Commission typically partners with OCTA to fund special trains to Los Angeles Angels of Anaheim baseball games. An “Angels Express” promotional service is offered for Friday night Angel baseball games for $7 roundtrip for adults, $6 for seniors and persons with disabilities, $4 for youths, and free for kids under 5 who are accompanied by a paying adult. Fans from Riverside County can take the train directly to the Anaheim Regional Transportation Intermodal Center and stay for the “Big Bang Fridays” fireworks show before departing. Festival of Lights Train (Future) Through the growing success and interest of the City of Riverside’s month-long Festival of Lights (FOL), the Commission typically partners with the City, Mission Inn Hotel & Spa, OCTA, Metro, RTA, and Metrolink to provide special train service on Friday and Saturday for four weekends of the FOL event. The special service helps to alleviate local traffic congestion and provides transportation to one of the most well know events in Riverside County. The service plan includes trains from Perris as well as Los Angeles and Orange County. The promotional fare for train riders is $7 roundtrip and includes a free transfer to RTA’s FOL shuttle bus service that transports passengers from the Riverside – Downtown Station to the event center.
RCTC Outreach Program (Using appropriate social distance) The Commission has supplemented Metrolink’s marketing efforts by developing a grassroots outreach program that focuses on reaching communities that may not be aware of how Metrolink can be incorporated in their lives. The goal is to increase ridership on all Metrolink lines that service Riverside County. The program key elements include:
• University and college campaign
• Train excursion programs for seniors and community groups
• Community events presence
• Digital marketing targeted to Riverside County
• Support for Special Events Trains such as Festival of Lights and Angels Express The Commission has also continued to increase Rail Safety awareness. Key elements of rail safety program include:
• Comprehensive outreach to UCR community

47
• Ongoing Operation Lifesaver presentations to K-12 schools and community groups
• Community events information booths
• Initiate Suicide Prevention Lifeline messaging near rail right-of-way
3.2.12 Metrolink Projected Ridership Growth
Due to COVID-19 impacts, Metrolink ridership projections are based on a moderate growth pattern that has been impacted by the several waves of COVID peaks. Metrolink is also analyzing customer survey findings to develop strategies and priorities to regain riders. Public health orders will also be a determining factor on when services might begin to return to pre-COVID-19 levels. Current projections indicate it may take several years to fully recover to previous ridership levels.
3.2.13 Metrolink and RCTC Capital Improvement Plans
There are three main capital improvement planning efforts that are used to assess rail capital needs in the County: Metrolink’s Capital Rehabilitation Plan; RCTC Station Rehabilitation Program; and RCTC Rail Capital Infrastructure Plan. The establishment of these capital plans provides the opportunity to more strategically program formula funds and seek competitive grants to delivery and prioritize projects. The 5-year strategies and priority projects for each capital improvement plan are described below. Metrolink Capital Rehabilitation Plan The 2017 Metrolink Infrastructure Rehabilitation Plan identified major capital improvements for the next ten years. The focus of the plan for the next five years, includes the following:
• Continual Improvements for Positive Train Control (PTC);
• LAUS Improvements and New Maintenance and Layover Facilities;
• Station Maintenance;
• Replacement of Ticket Vending Machines; and
• Rehab/Renovation of passenger cars. Metrolink’s Rehabilitation Plan is funded by member agencies through annual capital subsidies.
Continual Improvements of Positive Train Control PTC has been a major technical undertaking and operating elements are currently available on multiple lines. PTC will continue to be a priority for Metrolink and the Commission to ensure the safety of the traveling public. The $215 million capital project was jointly funded by the member agencies and major components were in place prior to the initial federal deadline of 2015, this was later extended. Metrolink is making strides

48
on this project and has implemented PTC into revenue service on lines it owns. Although full implementation has occurred, and continual improvements of the system will continue to be a high priority. Locomotives and Passenger Cars Metrolink’s aging fleet is undergoing a revamp of its locomotive fleet to improve daily operation of the system. Tier 4 locomotives are compliant with the latest U.S. Environmental Protection Agency (EPA) emissions standards and will reduce particulate matter and nitrogen oxide emissions by up to 85%, resulting in cleaner air for the region. Performance concerns have delayed the delivery of the new locomotives. Metrolink ordered and has received 40 Tier 4 locomotives. Metrolink's existing fleet of Bombardier passenger rail cars need to be rebuilt to comply with current standards and regulations, as well as to improve their reliability and appearance. Metrolink has started shipping the rail cars to a vendor to start the overhauls. Metrolink investigated purchasing new cars as opposed to overhauling the existing fleet, but the estimated cost of replacement was more than double the cost of the overhauling the existing fleet. Metrolink is continuing its overhaul program with the intent to have all cars upgraded in the next several years.
RCTC Station Rehabilitation Program The Commission fully funds and maintains all the commuter rail stations in Riverside County. Since Metrolink service began along the Riverside Line in 1993, the Commission has been maintaining the Riverside – Downtown and Jurupa Valley/Pedley stations. When the IEOC Line began in 1995, the Riverside – La Sierra and Corona – West stations were added. Due to increasing demand, the Corona – North Main Station was added in 2002. In 2016, four new stations were added along the Perris Valley Line including Hunter Park/UCR, Moreno Valley/March Field, Perris – Downtown and Perris South. Over the years, the stations show their age and require preventative maintenance. The Commission takes pride in the commuter rail stations and intends to continue to invest significant resources to maintain a state of good repair which is vital for rest of the public transportation network. A 5-year Station Rehabilitation Program is updated annually to maintain and upgrade stations in a state of good repair and ultimately reduce costs for operations and maintenance (O&M) long term. Recently completed projects include:
• Construction of a covered passenger waiting and concession area at the Riverside – Downtown Metrolink Station
• Security and station surveillance expansion, including closed-circuit television (CCTV) infrastructure for all stations
• Parking lot and bus transfer expansion at the Riverside – La Sierra Metrolink station

49
• Elevator Rehabilitation at Corona – North Main and Riverside – Downtown Stations
• Pavement rehabilitation at Riverside-Downtown
• Upgraded ADA drop off/pick up and parking areas at Corona - West
• Comprehensive painting of Pedley, West Corona, La Sierra, and Riverside- Downtown
Planned station improvements for the next five years are categorized into the following areas:
• Comprehensive painting of station structures
• Pavement rehabilitation of station parking lots
• Bike and Pedestrian safety improvements, including signage
• LED Fixtures and Lights
• Station amenities (gates, fences, benches, shelters, bike storage, etc.)
• CCTV camera systems
• Drought tolerant landscaping upgrades
• Elevator rehabilitation or replacement
• Electrical Upgrades
• General building maintenance
• Study of Solar Photo-voltaic panels on parking canopies at two PVL stations. The total five-year program cost for FY 2020/21 – 2024/25 is estimated at $12 million and will be funded with $8 million from FTA 5307 and $4 million from the SB 1 State of Good Repair program. RCTC Rail Capital Infrastructure Projects The Commission’s focus for the next five years is to delivery projects that will improve Metrolink operational reliability and support service growth. The delivery of a capital project can include tasks such as feasibility studies, preliminary engineering, environmental clearance, final design, right of way acquisition, utility relocation, construction, construction management, and design-build in addition to the management of various types of agreements. This section provides a summary of each of the major rail capital projects where the Commission is identified as the lead agency and includes:
1. Riverside-Downtown Layover Facility North Expansion 2. Moreno Valley/March Field Station Upgrade Project 3. Metrolink Station Parking Expansion Analysis 4. Riverside-Downtown Station Track and Platform Project 5. Moreno Valley to Downtown Perris 2nd Track Project 6. Downtown Perris to Perris South 2nd Track and 4th Layover Track Project 7. Moreno Valley/March Field Station Pedestrian Bridge Project

50
Riverside-Downtown Layover Facility North Expansion The Riverside-Downtown Layover Facility project expands the existing layover facility on the northside of SR-91 to accommodate three storage tracks with an overall capacity of three 6-train sets. The project also provides upgraded facilities with the addition of a water services station, sewer dump station, and additional power stations. Project Status: Construction Complete, Project close-out Total Project Cost: $6.3 million Project Funding: FTA 5307 Project Completion: Spring 2021

51
Moreno Valley/March Field Station Upgrade Project The Moreno Valley/March Field Station Upgrade Project is necessary for improved operational reliability and passenger convenience for the 91/PVL Line. This project will upgrade the station with an additional platform and upgrade 2.7 miles of track to passenger rail standards so that trains can pass each other at the mid-point of the PVL line, providing the capacity necessary for additional connectivity from 91/PVL Line trains to other trains in the Metrolink system at the Riverside – Downtown Station. Project Status: Design Estimated Start of Construction: Fall 2021 Project Cost Estimate: $26 million Project Funding: FTA 5307 Project Completion: Early 2024

52
Metrolink Station Parking Expansion Analysis Based on trends in parking usage at Metrolink stations, and anticipated increases in future service levels, expansion of parking facilities will be needed in the near future. The Riverside Downtown station parking lot has the highest level of usage, and that parking lot will be expanded with the Riverside-Downtown Station Track and Platform Project (SCORE Project). The West Corona station is the next highest in usage. As the site is currently fully utilized for surface parking, a preliminary analysis will be performed to look at the feasibility of a parking structure at this station.

53
Metrolink SCORE Program Metrolink’s SCORE Program is a $10 billion initiative to upgrade the regional rail system to meet the current and future needs of the traveling public. The first phase was awarded $876 million from the State’s Transit and Intercity Rail Capital Program (TIRCP) in April 2018, which the Riverside-Downtown Station Track and Platform Project was a recipient of. The first two phases of capital projects are envisioned to support expanded Metrolink service. The first phase focuses on capital projects to be completed by 2023. The second phase focuses on capital projects scheduled for completion by 2028. Riverside-Downtown Station Track and Platform Project (SCORE Project) The Riverside-Downtown Station Track and Platform Project increases connectivity and rail capacity and service reliability, especially for all trains using the southeast tracks on the BNSF mainline, which includes all 91/PVL trains. This project will add a center platform and associated tracks on the southeast side of the station and extend the existing pedestrian bridge with an elevator to the new platform, effectively doubling passenger train capacity of the station. The track and platform project has been funded as part of the first phase of the Metrolink SCORE Program. The environmental phase has begun and will assess the development of an expanded project that includes a large property acquisition and a surface parking lot with approximately 500 spaces. The costs and funding of these project elements are still being determined. Project Status: Environmental Review and Design Project Cost Estimate: $30 million (base without ROW or expanded parking lot) Project Funding: FTA 5307 Grant, TIRCP, STA Project Completion: December 2025

54
Moreno Valley to Downtown Perris 2nd Track Project (SCORE Project) The PVL exists today as a single-track main line, which constrains rail operations and does not offer long-term growth. This project, as proposed, will provide approximately six miles of second main track. Partnered with the Moreno Valley / March Field Station Project, this project will provide the PVL with a continuous double track corridor between Control Point (CP) Eastridge and CP Nuevo, a total of about nine miles. While there is currently a second track within the RCTC-owned right-of-way that runs parallel to the PVL within the project area, it is comprised of jointed rail, older wood ties, and poor ballast conditions. The track is also not currently signalized and is used only for limited freight operations of two to four freight trains per week providing service to the local industries. As proposed, the project will begin at a new CP at approximately Milepost (MP) 72.2, with a new higher speed universal turnout to be constructed as part of the Moreno Valley / March Field Station Project. The project will then continue with the rehabilitation of the second track south to CP Nuevo (MP 81.4), with the replacement of the existing switch with a higher speed turnout. Track rehabilitation will include new concrete cross ties, other track material (OTM), ballast, and continuous welded rail (CWR). Existing turnouts will be removed and replaced as necessary to maintain freight operations. The track will receive a new signal system and be incorporated into the Metrolink PTC network. The double track could potentially continue to the Perris Downtown Station to allow for multiple boarding opportunities. Project Status: Project Definition Report Project Cost Estimate: $22 million Project Funding: TBD Project Completion: 6-7 years

55
Downtown Perris to Perris South 2nd Track and 4th Layover Track Project (SCORE Project) The Perris-South Station is the end of the 91/PVL and serves the City of Perris and communities further south including Temecula, Murrieta, Menifee, Hemet, and San Jacinto. The Perris-South Station is currently along a single-track corridor. This project, as proposed, would add a second track through the station, starting east of the San Jacinto River, at MP 85.2, as well as an additional platform. An in-station pedestrian at-grade crossing would be included at the east end of the station platforms. The project would also include a fourth layover track at the South Perris layover facility at the existing layover facility between CP Mapes at MP 85.4 and MP 85.8. As currently designed, the existing layover facility retained the right-of-way to add an additional layover track to the facility in the future as more capacity was needed. As a result, no additional right-of-way is required to construct the additional layover track at the existing facility. Project Status: Project Definition Report Project Cost Estimate: $19 million Project Funding: TBD Project Completion: 6-7 years

56
Moreno Valley/March Field Station Pedestrian Bridge Project (SCORE Project) The Moreno Valley / March Field Station is one of the new stations along the PVL and exists today as a single-track station with an at-grade pedestrian crossing and a single platform. This project will upgrade the station with an additional platform and a pedestrian overpass. The overpass will use the same circulation, platform amenities, and architectural elements currently in place at the Riverside-Downtown Station. The current station layout requires all passengers to use a staircase or extended ramp to access the platforms which are at a lower elevation than the parking lot. The proposed structure would create easier pedestrian access to the platforms and improve the passenger experience. Project Status: Project Definition Report Project Cost Estimate: $25 million Project Funding: TBD Project Completion: 7-8 years
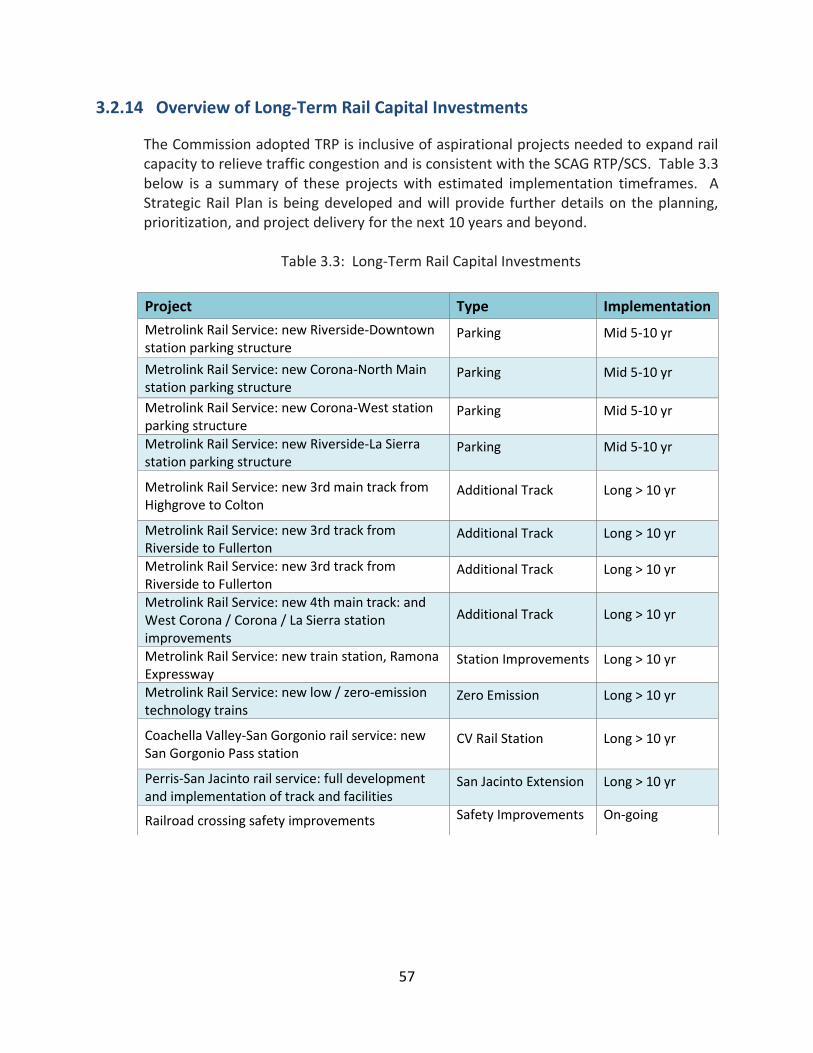
57
3.2.14 Overview of Long-Term Rail Capital Investments
The Commission adopted TRP is inclusive of aspirational projects needed to expand rail capacity to relieve traffic congestion and is consistent with the SCAG RTP/SCS. Table 3.3 below is a summary of these projects with estimated implementation timeframes. A Strategic Rail Plan is being developed and will provide further details on the planning, prioritization, and project delivery for the next 10 years and beyond.
Table 3.3: Long-Term Rail Capital Investments
Project Type Implementation
Metrolink Rail Service: new Riverside-Downtown station parking structure
Parking Mid 5-10 yr
Metrolink Rail Service: new Corona-North Main station parking structure
Parking Mid 5-10 yr
Metrolink Rail Service: new Corona-West station parking structure
Parking Mid 5-10 yr
Metrolink Rail Service: new Riverside-La Sierra station parking structure
Parking Mid 5-10 yr
Metrolink Rail Service: new 3rd main track from Highgrove to Colton
Additional Track Long > 10 yr
Metrolink Rail Service: new 3rd track from Riverside to Fullerton
Additional Track Long > 10 yr
Metrolink Rail Service: new 3rd track from Riverside to Fullerton
Additional Track Long > 10 yr
Metrolink Rail Service: new 4th main track: and West Corona / Corona / La Sierra station improvements
Additional Track Long > 10 yr
Metrolink Rail Service: new train station, Ramona Expressway
Station Improvements Long > 10 yr
Metrolink Rail Service: new low / zero-emission technology trains
Zero Emission Long > 10 yr
Coachella Valley-San Gorgonio rail service: new San Gorgonio Pass station
CV Rail Station Long > 10 yr
Perris-San Jacinto rail service: full development and implementation of track and facilities
San Jacinto Extension Long > 10 yr
Railroad crossing safety improvements Safety Improvements On-going

58
4. FINANCIAL PLANNING
Transit services and capital projects are funded with a variety of federal, state, and local revenue sources. A summary of the formulaic and discretionary funding sources that the vanpool and rail programs are likely to be supported by are as follows: Federal Programs
➢ FTA Section 5307 – Provides formula funding to public transit systems in Urbanized Areas (UZA) for public transportation capital, planning, job access and reverse commute projects, as well as operating expenses in certain circumstances.
➢ FTA Section 5337 – Provides formula funding for capital assistance for maintenance, replacement, and rehabilitation projects of existing high-intensity fixed guideway and high-intensity motorbus systems to maintain a state of good repair.
➢ Congestion Mitigation Air Quality (CMAQ) Program –Funds are distributed to states based on a formula that considers an area’s population by county and the severity of its air quality, and may be used for transit capital expenditures that have an air quality benefit. CMAQ funds are administered by FHWA and when awarded for use on transit projects are flexed to the FTA.
➢ Other Federal Programs may include funds from the FRA or other FTA discretionary grants for planning activities, pilot programs, and major capital investments.
State Programs ➢ Local Transportation Fund – LTF funds are formula based for operating and capital
purposes and are generated from a ¼ cent of the state retail sales tax collected in each county.
➢ State Transit Assistance Fund - STA funds are generated from the statewide sales tax on motor vehicle fuel on diesel. The STA funds are appropriated to the State Controller for allocation by formula to each RTPA. The formula allocates 50 percent of the funds on the basis of the County’s population compared to the state’s population (STA 99313 Funds). The remaining 50 percent is allocated according to the prior year proportion of the County’s transit operator passenger fare and local support revenues (STA 99314 Funds).
➢ State of Good Repair (SGR) – SGR provides formula funding for transit maintenance, rehabilitation, and capital projects.
➢ Low Carbon Transit Operational Program (LCTOP) - LCTOP funds provides transit agencies with operating and capital assistance to reduce greenhouse gas emissions and improve mobility, with a priority on serving disadvantaged communities. LCTOP projects support new or expanded bus or rail services, expanded intermodal transit facilities, and may include equipment acquisition, fueling, maintenance and other costs to operate those services or facilities. LCTOP derives from the Greenhouse Gas Reduction Fund (GGRF) that receives proceeds from cap-and-trade auctions.
➢ Transit and Intercity Rail Capital Program (TIRCP) - TIRCP is intended to fund transformative capital improvements that will modernize California’s intercity, commuter, and urban rail systems, and bus and ferry transit systems to significantly

59
reduce emissions of greenhouse gases, vehicle miles traveled, and congestion. TIRCP is also a cap-and-trade program that is funded through the GGRF.
➢ Other State Programs may include funding from discretionary programs such as the State Rail Assistance, Local Partnership Program, or Solutions for Congested Corridors Program.
Local Programs ➢ Measure A – Administered by RCTC, Measure A is a ½ cent sales tax for transportation
approved by the voters in 2009 for a 30-year period. ➢ Mobile Source Air Pollution Reduction Review Committee (MSRC) – MSRC has provided
discretionary funding first mile/last mile bicycle and pedestrian improvements and for transportation demand management projects such as rideshare and special events to mitigate the impacts caused by mobile source emissions.
➢ Other local sources may include passenger fares, leases, or, local agency or private partnerships.
4.1 Operating and Capital Budget – FY 2021/22
Table 4.0 at the end of this chapter provides a summary of the total operating and capital funding requests by revenue source and project for FY 2021/22. Total operating expenses for FY 2021/22 is estimated at $37.9 million, combined for the vanpool and rail programs, which represents a decrease of 4% from FY 2020/21 primarily due to reduced Metrolink services and reduced ridership on VanClub due to the pandemic. Total capital programming for FY 2021/22 is $17.2 million which is for a combination of Metrolink capital obligation and RCTC station projects. Project descriptions and justifications for each capital project are found in Table 4.0A at the end of this chapter. The FY 2021/22 operating and capital plans are fully funded. State and local revenues typically comprise the largest revenue sources; however, due to the adverse economic impacts that COVID-19 has had on state and local revenues, primarily LTF and Measure A, the Commission prioritized federal Coronavirus Aid, Relief, and Economic Security (CARES) Act funds to preserve local funding and supplement loss revenues. Should revenue projections change significantly throughout the year, service and capital plans will be modified, as needed.
4.2 Funding to Support Future Operating and Capital Plans
Tables 4.1 – 4.4 at the end of this chapter identifies the available funding revenues that can support operating and capital plans for the subsequent four years, FY 2021/22 – 2025/26. These plans include operating costs based on a nominal growth rate and are used for planning purposes only. Table 4.5 summarizes the projected total operating costs for the vanpool and commuter rail programs.

60
Table 4.5: Projected Total Operating Costs (Vanpool and Commuter Rail), FY 2021/22 – 2025/26
Capital projects with committed funding will continue to move forward and staff will continue to seek discretionary funds for new capital projects. The Commission will also prioritize projects based on safety and maintenance to keep stations operating at optimal efficiency levels.
4.3 Regulatory and Compliance Requirements
The Commission is responsible for complying with state and federal regulatory provisions, in addition to undergoing performance reviews and audits. Following is a summary and status of major regulatory and compliance requirements. Americans with Disabilities Act (ADA) To prohibit discrimination on the basis of disability, the U.S. Congress passed the Rehabilitation Act of 1973 and the ADA of 1990. Title II of the ADA pertains to state and local governments and prohibits discrimination or segregation on the basis of race, color, religion or national origin in access to public accommodations. Title II requires that persons with disabilities be provided with an equal opportunity to benefit from government programs, services and activities. In October 2012, the Commission appointed the Deputy Executive Director to serve as the ADA Coordinator and adopted grievance procedures and a discrimination complaint form. Title VI Title VI of the Civil Rights Act of 1964 protects persons in the United States from being excluded from participation in, denied the benefits of, or subjected to discrimination on the basis of race, color, or national origin in any program or activity receiving federal financial assistance. As required by FTA, a Title VI Program is updated every three years. The Commission’s current Title VI program was updated in June 2019 and approved by the FTA in December 2019 and is valid until July 2022. Disadvantaged Business Enterprise (DBE) The DBE Program seeks to ensure nondiscrimination in the award and administration of federally assisted contracts and to create a level playing field on which DBEs can compete fairly for federally assisted contracts. The FTA Office of Civil Rights is responsible for monitoring FTA recipients’ DBE programs and ensuring their compliance with DBE regulations. The Commission’s DBE Program was last submitted and approved by FTA in 2019.
Fiscal Year
Total Operating
2021/22 2022/23 2023/24 2024/25 2025/26
$ 37,994,844 $ 39,127,429 $ 40,543,739 $ 41,977,397 $ 43,461,103

61
Equal Employment Opportunity (EEO) The EEO Program ensures that no person in the United States shall on the grounds of race, color, religion, national origin, sex, age, or disability be excluded from participating in, or denied the benefits of, or be subject to discrimination in employment under any project, program, or activity receiving Federal financial assistance under federal transit laws. FTA recipients are required to develop an abbreviated or full EEO program if the number of employees working on FTA-funded programs is over 50 or 100, respectively. Although the Commission is an equal opportunity employer, it is not required to fulfill this requirement. FTA Triennial Review Pursuant to Chapter 53 of Title 49, United States Code Section 5307, the FTA is required to conduct a review at least every three years for recipients of Urbanized Area Formula Grant funds. The Triennial Review examines grantee performance and adherence to current FTA requirements and policies such as financial management, technical capacity award and program management, DBE, procurement, and facility and safety programs. The last triennial was completed in June 2018 and resulted in no findings. TDA Triennial Audit In accordance with California Public Utilities Code Section 99246, the Commission in its role as the RTPA is required every three years to arrange for performance audits of its activities as well as the activities of the transit operators to which it allocates TDA funds. The Commission’s Rail Program is not included in the audit as it is part of Metrolink’s Triennial Performance Audit review. The Commission’s 2019 TDA Triennial Audit found that it is in compliance with all TDA requirements and in some cases exceeds those requirements. Five recommendations, which staff has implemented and/or is addressing, were provided to improve the Commission’s administration and management of TDA and its organization:
1. A carryover from the prior two performance audits, the Commission should revisit the TDA formula for Western Riverside County bus and commuter rail service;
2. A carryover from the prior performance audit, one requirement for the transit operators Financial Transactions Report is that the transit operator prepares separate reports for general public transit and for specialized services;
3. Update the Commission’s policy on the use of STA funds for operating assistance, which was approved in June 2019, be updated to reflect Senate Bill (SB) 508;
4. Review and update the Commission’s SRTP process to serve more as a planning document that forecasts and provides direction on operating and capital projects and service delivery for the next three to five-year period rather than an annual budgeting document; and
5. Develop a local guidance manual that contains the procedures and protocol for TDA claims and the Commission’s transit policies.

62
4.4 Status of Current Capital Projects
Table 4.6 below is a summary of the current capital projects that have received funding allocations from prior years to highlight the estimated timeline for completion, and the remaining unfunded balance.
Table 4.6: List of Current Capital Projects and Funding Status
Project Name SRTP
Capital Project No.
Project Type Funding Category
Timeline
Begin - End Total Project Cost
Unfunded Balance
Moreno Valley/March Field Rail Upgrade
17-6 Facilities/ Capital Upgrades
Fully Funded 12/2019 – 12/2024 $26,000,000 $0
Riverside Downtown Station Track & Platform
20-3 Facilities/ Capital Upgrades
Partially Funded
11/2020 – 12/2025 $30,000,000 (excludes ROW and parking lot)
$15,000,000 (for ROW and parking lot)
Riverside Downtown Layover Facility
15-2 Facilities/ Capital Upgrades
Fully Funded
08/2019 – 07/2021 $6,332,444 $0
Coachella Valley Rail Tier 1 Environmental Study
20-1 Facilities/ Capital Upgrades
Fully Funded 05/2016 – 12/2021 $6,000,000 $0

ProjectTotal Amount of
Funds5307 RS
5307 RS CARES
OB5337
LCTOP
PUC99313 LTF MA CR OTHR LCL SGR PUC99313 SGR PUC99314 STA PUC99313 Farebox
Western County Rail
Metrolink Operating Subsidy & Preventative Maintenance1 $21,474,584 $10,300,000 $864,540 $10,310,044
Next Generation Rail Study Phase II $400,000 $400,000
Program Management and Support2 $4,923,600 $2,067,700 $2,855,900
San Jacinto Line Right of Way Maintenance $2,336,300 $2,036,300 $300,000
Station Operations and Security $7,711,500 $2,186,400 $5,230,400 $294,700
Transfer Agreements $150,000 $150,000
Vanpool
RCTC VanClub Operating Expenses $1,210,260 $431,600 $74,700 $30,000 $673,960
Sub-total Operating $38,206,244 $0 $12,918,000 $0 $864,540 $12,927,744 $10,197,300 $624,700 $0 $0 $0 $673,960
ProjectTotal Amount of
Funds5307 RS
5307 RS CARES
OB5337
LCTOP
PUC99313 LTF MA CR OTHR LCL SGR PUC99313 SGR PUC99314 STA PUC99313 Farebox
Western County Rail
Rail Stations - Capital Rehabilitation - WC 22-1 $1,500,000 $1,226,421 $273,579
Moreno Valley/March Field Station Ped Bridge - WC - 22-2 $9,300,000 $9,300,000
Riverside Downtown Station Track and Platform3 - WC 22-3 $1,900,000 $1,900,000
RCTC Metrolink Capital Obligation - WC 22-4 $4,292,859 $4,226,859 $66,000
Coachella Valley Rail
CV Rail Environmental/Service Development Plan - CV 22-1 $189,339 $189,339
Sub-total Capital $17,182,198 $9,300,000 $0 $4,226,859 $0 $0 $0 $66,000 $1,226,421 $273,579 $2,089,339 $0
Total Operating & Capital $55,388,442 $9,300,000 $12,918,000 $4,226,859 $864,540 $12,927,744 $10,197,300 $690,700 $1,226,421 $273,579 $2,089,339 $673,960
3 Reflects Western County Rail STA needed for ROW and related consulting.
1 Total reflects an estimated full year subsidy with potential need for increases if 30% service reduction is reinstated.
2 Includes Rail program administration, capital support, marketing, rail safety education, professional services, and special
trains. Allocations for salaries and benefits and professional development are subject to change pending the Commission's
final budget approval.
Table 4.0 - Summary of Funding Request - FY2021/22
RCTC Western County Rail, Coachella Valley Rail, and Vanpool Programs
Operating
Capital

ProjectTotal Amount of
Funds5307 RS 5337
LCTOP
PUC99313 LTF MA CR OTHR LCL SGR PUC99313 SGR PUC99314 STA PUC99313 Farebox
Western County Rail
Metrolink Operating Subsidy & Preventative Maintenance1 $22,118,822 $4,000,000 $1,000,000 $12,000,000 5,118,822
Program Management and Support2 $5,071,308 $2,129,731 $2,941,577
San Jacinto Line Right of Way Maintenance $2,406,389 $2,097,389 $309,000
Station Operations and Security $7,942,845 $7,648,145 $294,700
Transfer Agreements $150,000 $150,000
Vanpool
RCTC VanClub Operating Expenses $1,655,807 $295,838 $343,600 $1,016,369
Sub-total Operating $39,345,171 $0 $4,000,000 $1,000,000 $14,279,731 $12,982,949 $947,300 $0 $0 $5,118,822 $1,016,369
ProjectTotal Amount of
Funds5307 RS 5337
LCTOP
PUC99313 LTF MA CR OTHR LCL SGR PUC99313 SGR PUC99314 STA PUC99313 Farebox
Western County Rail
Rail Stations - Capital Rehabilitation $900,000 $626,421 $273,579
Moreno Valley/March Field Station Ped Bridge $0
Riverside Downtown Station Track and Platform $0
Perris 2nd Track Moreno Valley to Downtown Perris Perris $0
Perris South 2nd Track and 4th Layover Track $0
Station Parking Expansion Analysis $0
RCTC Metrolink Capital Obligation $8,000,000 $8,000,000
Coachella Valley Rail
CV Rail Environmental/Service Development Plan - CV 21-1 $380,000 $380,000
Sub-total Capital $9,280,000 $0 $8,000,000 $0 $0 $0 $0 $626,421 $273,579 $380,000 $0
Total Operating & Capital $48,625,171 $0 $12,000,000 $1,000,000 $14,279,731 $12,982,949 $947,300 $626,421 $273,579 $5,498,822 $1,016,369
Table 4.1 - Summary of Funding Request - FY2022/23
RCTC Western County Rail, Coachella Valley Rail, and Vanpool Programs
Operating
Capital
2 Includes Rail program administration, capital support, marketing, rail safety education, professional services, and
special trains. Allocations for salaries and benefits and professional development are subject to change pending the
Commission's final budget approval.
1 Total reflects an estimated full year subsidy of Metrolink services based on a 3% increase from prior year.

ProjectTotal Amount of
Funds5307 RS 5337
LCTOP
PUC99313 LTF MA CR OTHR LCL SGR PUC99313 SGR PUC99314 STA PUC99313 Farebox
Western County Rail
Metrolink Operating Subsidy & Preventative Maintenance1 $22,782,386 $4,000,000 $1,000,000 $12,000,000 5,782,386
Program Management and Support2 $5,223,447 $2,193,623 $3,029,824
San Jacinto Line Right of Way Maintenance $2,478,581 $2,160,311 $318,270
Station Operations and Security $8,181,130 $7,886,430 $294,700
Transfer Agreements $170,000 $170,000
Vanpool
RCTC VanClub Operating Expenses $1,932,469 $270,109 $420,000 $1,242,360
Sub-total Operating $40,768,013 $0 $4,000,000 $1,000,000 $14,363,623 $13,346,674 $1,032,970 $0 $0 $5,782,386 $1,242,360
ProjectTotal Amount of
Funds5307 RS 5337
LCTOP
PUC99313 LTF MA CR OTHR LCL SGR PUC99313 SGR PUC99314 STA PUC99313 Farebox
Western County Rail
Rail Stations - Capital Rehabilitation $900,000 $626,421 $273,579
Moreno Valley/March Field Station Ped Bridge $5,000,000 $5,000,000
Riverside Downtown Station Track and Platform $0
Perris 2nd Track Moreno Valley to Downtown Perris Perris $5,000,000 $5,000,000
Perris South 2nd Track and 4th Layover Track $5,000,000 $5,000,000
Station Parking Expansion Analysis $0
RCTC Metrolink Capital Obligation $8,000,000 $8,000,000
Coachella Valley Rail
CV Rail Environmental/Service Development Plan - CV 21-1 $390,000 $390,000
Sub-total Capital $24,290,000 $15,000,000 $8,000,000 $0 $0 $0 $0 $626,421 $273,579 $390,000 $0
Total Operating & Capital $65,058,013 $15,000,000 $12,000,000 $1,000,000 $14,363,623 $13,346,674 $1,032,970 $626,421 $273,579 $6,172,386 $1,242,360
Table 4.2 - Summary of Funding Request - FY2023/24
RCTC Western County Rail, Coachella Valley Rail, and Vanpool Programs
Operating
Capital
1 Total reflects an estimated full year subsidy of Metrolink services based on a 3% increase from prior year.
2 Includes Rail program administration, capital support, marketing, rail safety education, professional services, and
special trains. Allocations for salaries and benefits and professional development are subject to change pending the
Commission's final budget approval.

ProjectTotal Amount of
Funds5307 RS 5337
LCTOP
PUC99313 LTF MA CR OTHR LCL SGR PUC99313 SGR PUC99314 STA PUC99313 Farebox
Western County Rail
Metrolink Operating Subsidy & Preventative Maintenance1 $23,465,858 $4,000,000 $1,000,000 $12,000,000 6,465,858
Program Management and Support2 $5,380,151 $2,259,432 $3,120,719
San Jacinto Line Right of Way Maintenance $2,552,938 $2,225,120 $327,818
Station Operations and Security $8,426,564 $8,131,864 $294,700
Transfer Agreements $170,000 $170,000
Vanpool
RCTC VanClub Operating Expenses $2,212,889 $1,430,489 $782,400
Sub-total Operating $42,208,400 $0 $4,000,000 $1,000,000 $14,429,432 $14,908,192 $622,518 $0 $0 $6,465,858 $782,400
ProjectTotal Amount of
Funds5307 RS 5337
LCTOP
PUC99313 LTF MA CR OTHR LCL SGR PUC99313 SGR PUC99314 STA PUC99313 Farebox
Western County Rail
Rail Stations - Capital Rehabilitation $900,000 $626,421 $273,579
Moreno Valley/March Field Station Ped Bridge $0
Riverside Downtown Station Track and Platform $0
Perris 2nd Track Moreno Valley to Downtown Perris Perris $0
Perris South 2nd Track and 4th Layover Track $0
Station Parking Expansion Analysis $1,000,000 $1,000,000
RCTC Metrolink Capital Obligation $8,000,000 $8,000,000
Coachella Valley Rail
CV Rail Environmental/Service Development Plan - CV 21-1 $400,000 $400,000
Sub-total Capital $10,300,000 $0 $8,000,000 $0 $0 $0 $0 $626,421 $273,579 $1,400,000 $0
Total Operating & Capital $52,508,400 $0 $12,000,000 $1,000,000 $14,429,432 $14,908,192 $622,518 $626,421 $273,579 $7,865,858 $782,400
Table 4.3 - Summary of Funding Request - FY2024/25
RCTC Western County Rail, Coachella Valley Rail, and Vanpool Programs
Operating
Capital
1 Total reflects an estimated full year subsidy of Metrolink services based on a 3% increase from prior year.
2 Includes Rail program administration, capital support, marketing, rail safety education, professional services, and
special trains. Allocations for salaries and benefits and professional development are subject to change pending the
Commission's final budget approval.

ProjectTotal Amount of
Funds5307 RS 5337
LCTOP
PUC99313 LTF MA CR OTHR LCL SGR PUC99313 SGR PUC99314 STA PUC99313 Farebox
Western County Rail
Metrolink Operating Subsidy & Preventative Maintenance1 $24,169,833 $4,000,000 $1,000,000 $12,000,000 7,169,833
Program Management and Support2 $5,541,555 $2,327,215 $3,214,341
San Jacinto Line Right of Way Maintenance $2,629,526 $2,291,874 $337,653
Station Operations and Security $8,679,361 $8,384,661 $294,700
Transfer Agreements $170,000 $170,000
Vanpool
RCTC VanClub Operating Expenses $2,508,759 $1,670,678 $838,081
Sub-total Operating $43,699,035 $0 $4,000,000 $1,000,000 $14,497,215 $15,561,553 $632,353 $0 $0 $7,169,833 $838,081
ProjectTotal Amount of
Funds5307 RS 5337
LCTOP
PUC99313 LTF MA CR OTHR LCL SGR PUC99313 SGR PUC99314 STA PUC99313 Farebox
Western County Rail
Rail Stations - Capital Rehabilitation $900,000 $626,421 $273,579
Moreno Valley/March Field Station Ped Bridge $0
Riverside Downtown Station Track and Platform $0
Perris 2nd Track Moreno Valley to Downtown Perris Perris $0
Perris South 2nd Track and 4th Layover Track $0
Station Parking Expansion Analysis $1,000,000 $1,000,000
RCTC Metrolink Capital Obligation $8,000,000 $8,000,000
Coachella Valley Rail
CV Rail Environmental/Service Development Plan - CV 21-1 $400,000 $400,000
Sub-total Capital $10,300,000 $0 $8,000,000 $0 $0 $0 $0 $626,421 $273,579 $1,400,000 $0
Total Operating & Capital $53,999,035 $0 $12,000,000 $1,000,000 $14,497,215 $15,561,553 $632,353 $626,421 $273,579 $8,569,833 $838,081
Table 4.4 - Summary of Funding Request - FY2025/26
RCTC Western County Rail, Coachella Valley Rail, and Vanpool Programs
Operating
Capital
1 Total reflects an estimated full year subsidy of Metrolink services based on a 3% increase from prior year.
2 Includes Rail program administration, capital support, marketing, rail safety education, professional services, and
special trains. Allocations for salaries and benefits and professional development are subject to change pending the
Commission's final budget approval.

FY 2021/22 SRTPRCTC WRC Rail
Table 4.0 A - Capital Project JustificationOriginal
Project Number: WC 22-1 FTIP No: Not Assigned - New Project
Project Name: Rail Stations - Capital Rehabilitation - FY 22
Category: Facilities
Sub-Category: Rehabilitation/Improvement
Fuel Type: N/A
Project Description: Capital rehabilitation and maintenance including CCTV, electric upgrades, solar canopies, painting,
pavement preservation, upgraded concrete sidewalks and ADA improvements, elevator replacements, lighting, landscaping,
and fencing.
Project Justification: Rehabilitation is needed to improve station operational efficiencies and maintain a state of good repair
.
Project Schedule:
Start Date Completion Date
July 2021 June 2026
PROJECT FUNDING SOURCES (REQUESTED):
Fund Type Fiscal Year Amount
SGR PUC99313 FY 2021/22 $1,226,421
SGR PUC99314 FY 2021/22 $273,579
Total $1,500,000
PRIOR YEAR PROJECTS OF A SIMILAR NATURE WITH UNEXPENDED BALANCE INCLUDING PROJECTS
APPROVED BUT NOT YET ORDERED
FTA Grant No. FTIP ID No. RCTC/SRTP
Project No.
Description
TransTrack Manager™ Page 1 of 4
5/13/2021 0:43:02 ET

FY 2021/22 SRTPRCTC WRC Rail
Table 4.0 A - Capital Project JustificationOriginal
Project Number: WC 22-2 FTIP No: Not Assigned - New Project
Project Name: Moreno Valley/March Field Station Ped Bridge - FY 22
Category: Facilities
Sub-Category: Rehabilitation/Improvement
Fuel Type: N/A
Project Description: The Moreno Valley/March Field Station Upgrade Project is necessary for improved operational
reliability and passenger convenience for the 91/PVL Line. This project will upgrade the station with an additional platform
and upgrade 2.7 miles of track to passenger rail standards so that trains can pass each other at the mid- point of the PVL
line, providing the capacity necessary for additional connectivity from 91/ PVL Line trains to other trains in the Metrolink
system at the Riverside – Downtown Station.
Project Justification: Upgrades are needed to expand train service.
Project Schedule:
Start Date Completion Date
July 2021 June 2026
PROJECT FUNDING SOURCES (REQUESTED):
Fund Type Fiscal Year Amount
5307 RS FY 2021/22 $9,300,000
Total $9,300,000
PRIOR YEAR PROJECTS OF A SIMILAR NATURE WITH UNEXPENDED BALANCE INCLUDING PROJECTS
APPROVED BUT NOT YET ORDERED
FTA Grant No. FTIP ID No. RCTC/SRTP
Project No.
Description
TransTrack Manager™ Page 2 of 4
5/13/2021 0:43:02 ET

FY 2021/22 SRTPRCTC WRC Rail
Table 4.0 A - Capital Project JustificationOriginal
Project Number: WC 22-3 FTIP No: Not Assigned - New Project
Project Name: Riverside-Downtown Station Track and Platform Project - FY 22
Category: Facilities
Sub-Category: Rehabilitation/Improvement
Fuel Type: N/A
Project Description: The Riverside-Downtown Station Track and Platform Project increases connectivity and rail capacity
and service reliability, especially for all trains using the southeast tracks on the BNSF mainline, which includes all 91/ PVL
trains. This project will add a center platform and associated tracks on the southeast side of the station and extend the
existing pedestrian bridge with an elevator to the new platform, effectively doubling the passenger train capacity of the
station. The track and platform project has been funded as part of the first phase of the Metrolink SCORE Program. The
environmental phase has begun and will assess the development of an expanded project that includes large property
acquisition and a surface parking lot with approximately 500 spaces.
Project Justification: The upgrade will increase additional trains at the stations.
Project Schedule:
Start Date Completion Date
July 2021 June 2026
PROJECT FUNDING SOURCES (REQUESTED):
Fund Type Fiscal Year Amount
STA PUC99313 FY 2021/22 $1,900,000
Total $1,900,000
PRIOR YEAR PROJECTS OF A SIMILAR NATURE WITH UNEXPENDED BALANCE INCLUDING PROJECTS
APPROVED BUT NOT YET ORDERED
FTA Grant No. FTIP ID No. RCTC/SRTP
Project No.
Description
TransTrack Manager™ Page 3 of 4
5/13/2021 0:43:02 ET
FY 2021/22 SRTPRCTC WRC Rail
Table 4.0 A - Capital Project JustificationOriginal
Project Number: WC 22-4 FTIP No: Not Assigned - New Project
Project Name: RCTC Metrolink Capital Obligation - FY 22
Category: Rail - track
Sub-Category: Rehabilitation/Improvement
Fuel Type: N/A
Project Description: RCTC's annual Metrolink Capital Obligation for maintenance, replacement, rehabilitation, and new
capital improvements.
Project Schedule:
Start Date Completion Date
July 2021 June 2022
PROJECT FUNDING SOURCES (REQUESTED):
Fund Type Fiscal Year Amount
5337 FY 2021/22 $4,226,859
OTHR LCL FY 2021/22 $66,000
Total $4,292,859
PRIOR YEAR PROJECTS OF A SIMILAR NATURE WITH UNEXPENDED BALANCE INCLUDING PROJECTS
APPROVED BUT NOT YET ORDERED
FTA Grant No. FTIP ID No. RCTC/SRTP
Project No.
Description
TransTrack Manager™ Page 4 of 4
5/13/2021 0:43:02 ET

FY 2021/22 SRTPRCTC CV Rail
Table 4.0 A - Capital Project JustificationOriginal
Project Number: 22-1 FTIP No: Not Assigned - New Project
Project Name: CV Rail Environmental/Service Development Plan
Category: Planning/Feasibility
Sub-Category: Study
Project Description: In eastern Riverside County for Caltrans/RCTC/CVAG feasibility study of an intercity passenger rail
service between Indio and Los Angeles (Phase I), and project Service Development Plan and environmental document (PH II)
- PA&ED only (FRA funded project).
Project Justification: This project is funded by local funds subject to the Coachella Valley Rail split and an FRA grant .
Project Schedule:
Start Date Completion Date
May 2016 June 2026
PROJECT FUNDING SOURCES (REQUESTED):
Fund Type Fiscal Year Amount
STA PUC99313 FY 2021/22 $189,339
Total $189,339
PRIOR YEAR PROJECTS OF A SIMILAR NATURE WITH UNEXPENDED BALANCE INCLUDING PROJECTS
APPROVED BUT NOT YET ORDERED
FTA Grant No. FTIP ID No. RCTC/SRTP
Project No.
Description
RIV151002 21-1
TransTrack Manager™ Page 1 of 1
5/5/2021 14:41:59 ET