capitaland limited australia non-deal roadshow · interest rate trends, cost of capital and capital...
TRANSCRIPT

1
3 - 4 December 2018
Australia Non-Deal Roadshow
CapitaLand Limited

2
Disclaimer
This presentation may contain forward-looking statements that involve risks anduncertainties. Actual future performance, outcomes and results may differmaterially from those expressed in forward-looking statements as a result of anumber of risks, uncertainties and assumptions. Representative examples of thesefactors include (without limitation) general industry and economic conditions,interest rate trends, cost of capital and capital availability, availability of real estateproperties, competition from other companies and venues for the sale/distributionof goods and services, shifts in customer demands, customers and partners,changes in operating expenses, including employee wages, benefits and training,governmental and public policy changes and the continued availability offinancing in the amounts and the terms necessary to support future business. Youare cautioned not to place undue reliance on these forward looking statements,which are based on current view of management on future events.

3
Contents
• Overview Of CapitaLand
• Key Highlights- Financial Highlights
- Business Strategy Execution Updates
• Financial Performance
• Business Updates
- CapitaLand Singapore, Malaysia, Indonesia
- CapitaLand China
- CapitaLand Vietnam
- CapitaLand International
- Retail Platform
- Commercial Platform
- Lodging Platform
• Conclusion

4
CapitaLand Presentation May 2013
Capital Tower, Singapore
Overview Of
CapitaLand

5
Strategic FrameworkOverview Of CapitaLand
Funan, Singapore
CapitaSpring, Singapore
Suzhou Center Mall, Suzhou
Raffles City Beijing
Citadines Saint-Germain-des-Prés Paris, France
The Loft, Chengdu
Raffles City Chongqing
CapitaLand Is Asia’s Premier
Diversified Real Estate Player
Our Approach Disciplined and focused in
developing and managing our
trading and investment properties,
underpinned by best-in-class
operating platforms
Our GoalTo build long-term shareholder
value by consistently delivering
returns ahead of cost of equity
6
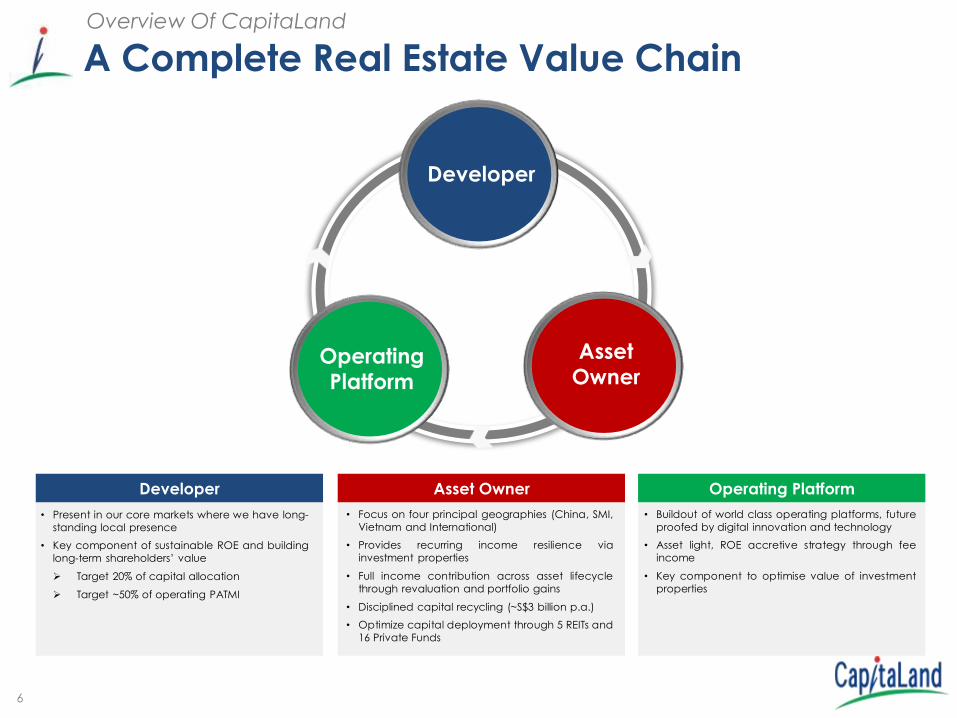
Investor
A Complete Real Estate Value ChainOverview Of CapitaLand
Developer
Developer
• Present in our core markets where we have long-
standing local presence
• Key component of sustainable ROE and building
long-term shareholders’ value
➢ Target 20% of capital allocation
➢ Target ~50% of operating PATMI
Asset Owner
• Focus on four principal geographies (China, SMI,
Vietnam and International)
• Provides recurring income resilience via
investment properties
• Full income contribution across asset lifecycle
through revaluation and portfolio gains
• Disciplined capital recycling (~S$3 billion p.a.)
• Optimize capital deployment through 5 REITs and
16 Private Funds
Operating Platform
• Buildout of world class operating platforms, future
proofed by digital innovation and technology
• Asset light, ROE accretive strategy through fee
income
• Key component to optimise value of investment
properties
OperatingPlatform
Asset Owner

7
Roadmap To Sustainable ReturnsOverview Of CapitaLand
• Combination of operating income from Investment Properties and TradingProperties, disciplined portfolio recycling and growth of fee income
• Calibrated balance across product platforms and geographies
Investment Properties Under Development vs In Operations
15 : 85
Emerging vs Developed Markets
50 : 50
Group managed real estate assets
S$100Billion by Year
2020
Environmental, Social and Governance (ESG) leadership
Trading Properties vs Investment Properties
20% : 80%
Key Target Metrics

8
Staying Relevant With Real Estate Of The FutureOverview Of CapitaLand
Collective Works at Capital Tower C3 at Innov Center, Shanghai
Co
mm
erc
ial
• Provider of integrated core and
flexible workplace solutions across
the Group’s key geographies
Re
tail
• Asia’s best-in-class retail platform
and network, harnessing innovative
digital capabilities and data insights
to provide engaging retail
experiences
Lod
gin
g
• Global platform – Target 160,000 units
by Year 2023, accelerated through
strategic partnerships
• Expand branding and marketing
presence

9
Key Highlights
Artist’s Impression

10
Overview – 3Q 20181Financial
Note:1. 3Q 2017 results restated to take into account the retrospective adjustments relating to SFRS(I)15 Revenue from Contracts with
Customers
S$1,260.0million
Revenue
17% YoY
S$796.3million
0.2% YoY
EBIT
S$362.2million
PATMI
14% YoY
S$233.7million
Operating PATMI
13% YoY
3Q 2018 PATMI Increased Due To Contribution From Newly Acquired / Opened Investment Properties And Gains From Asset Recycling

11
Key Takeaways – 3Q 20181
• PATMI of S$362.2 million (vs. S$318.8 million in 3Q 2017) due to:
- Contribution from newly acquired/opened investment properties
- Higher fair value uplift from divestments of Westgate Mall and 18
malls in China2
Financial
Note:1. 3Q 2017 results restated to take into account the retrospective adjustments relating to SFRS(I)15 Revenue from Contracts with
Customers2. Of the 20 shopping malls in China as announced in January 20183. On a run rate basis
Robust Operating Performance
Resilient Balance Sheet
• Key coverage ratios
- Net debt/equity at 0.51x (vs. 0.49x in FY2017)
- Interest servicing ratio3 at 4.3x (vs. 6.7x in FY2017)
- Interest coverage ratio3 at 7.4x (vs. 8.2x in FY2017)

12
Overview – YTD Sep 20181Financial
Note:1. YTD Sep 2017 results restated to take into account the retrospective adjustments relating to SFRS(I)15 Revenue from Contracts
with Customers2. PATMI 1Q 2017 included a gain of S$160.9 million from the sale of 45 units of The Nassim
S$3,978.0million
Revenue
17% YoY
S$2,867.9million
19% YoY
EBIT
S$1,286.8million
PATMI
0.4% YoY
S$658.4million
Operating PATMI
13% YoY
Excluding The Gain From The Sale Of Nassim In 1Q 2017,• PATMI Would Have Been 14% Higher2
• Operating PATMI Would Have Been 10% Higher2
13
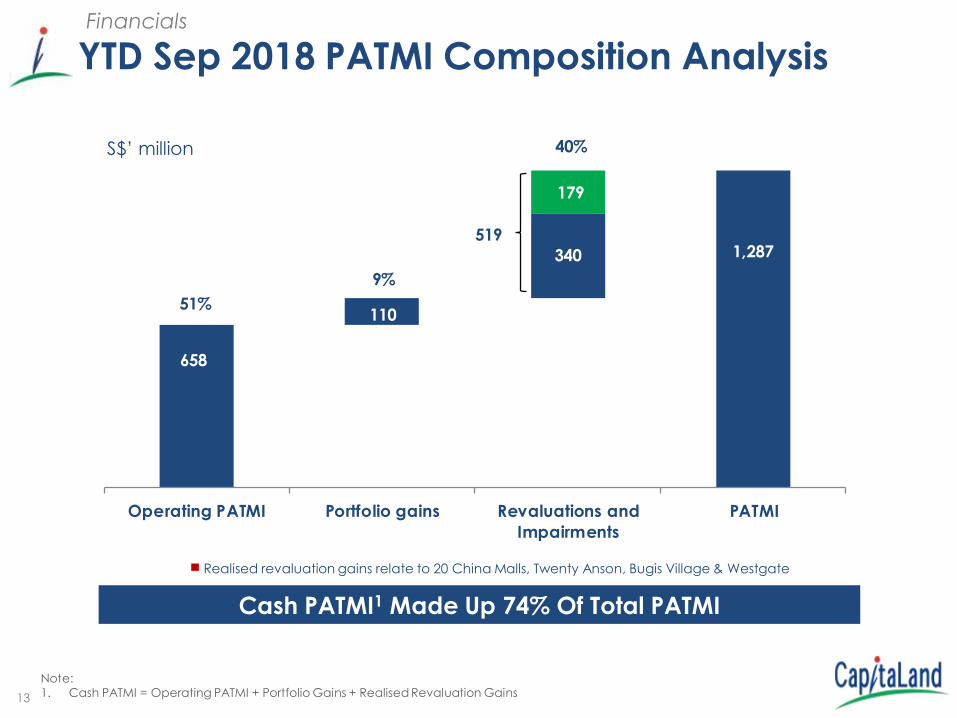
YTD Sep 2018 PATMI Composition AnalysisFinancials
Cash PATMI1 Made Up 74% Of Total PATMI
Note:1. Cash PATMI = Operating PATMI + Portfolio Gains + Realised Revaluation Gains
110
340
179
51%
9%
40%
658
519
0%
20000%
40000%
60000%
80000%
100000%
120000%
140000%
Operating PATMI Portfolio gains Revaluations and
Impairments
PATMI
1,287
Realised revaluation gains relate to 20 China Malls, Twenty Anson, Bugis Village & Westgate
S$’ million

14
Delivering Sustainable Returns To Shareholders
Note:1. Include fair value arising from change in use of development projects of $30.5 million in FY 20162. Include corporate and unallocated cost3. Comparatives have been restated due to adoption of SFRS (I) 15 Revenue from Contracts with Customers
4.9 5.1
3.5
0.5
1.7
1.6
1.2
1.8
1.8
6.6
8.6
6.9
0
2
4
6
8
10
FY 2016 FY 2017 (Restated) YTD Sep 2018
ROE (%)
(1)
Financials
Target To Consistently Achieve Return On Equity In Excess Of Cost Of Equity
Portfolio gains/Realised FV gains
Operating PATMI (2)
Revaluations and Impairments
(3)
15
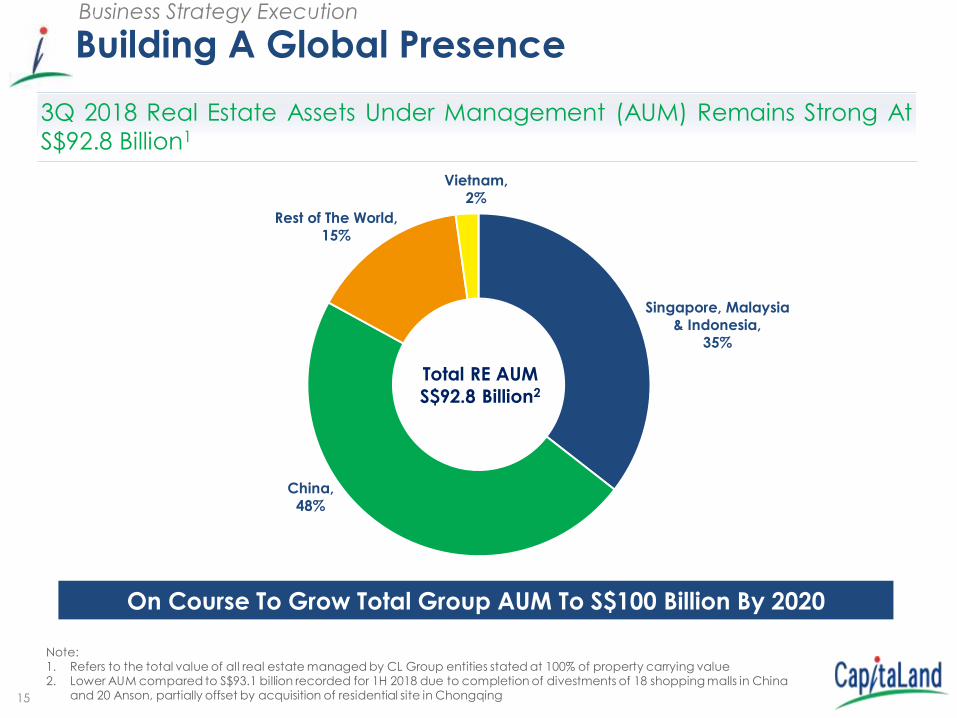
Business Strategy Execution
Building A Global Presence
Note:1. Refers to the total value of all real estate managed by CL Group entities stated at 100% of property carrying value2. Lower AUM compared to S$93.1 billion recorded for 1H 2018 due to completion of divestments of 18 shopping malls in China
and 20 Anson, partially offset by acquisition of residential site in Chongqing
China, 48%
Singapore, Malaysia & Indonesia,
35%
Vietnam, 2%
Rest of The World, 15%
Total RE AUM
S$92.8 Billion2
3Q 2018 Real Estate Assets Under Management (AUM) Remains Strong At
S$92.8 Billion1
On Course To Grow Total Group AUM To S$100 Billion By 2020
16
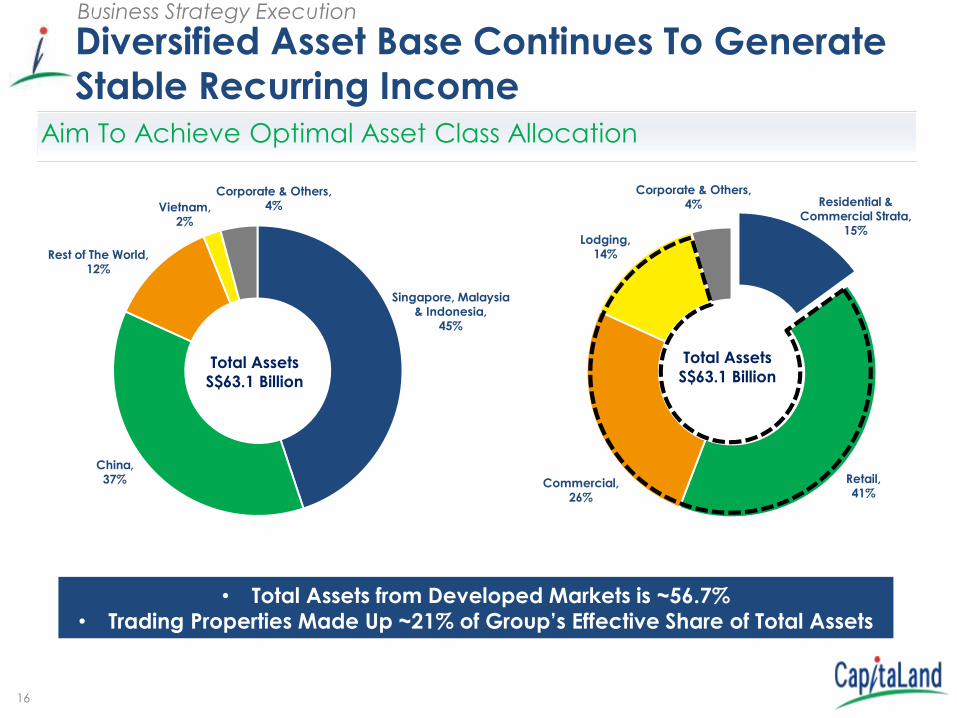
Business Strategy Execution
Diversified Asset Base Continues To Generate Stable Recurring Income
China, 37%
Singapore, Malaysia & Indonesia,
45%
Vietnam, 2%
Rest of The World, 12%
Corporate & Others, 4%
Total Assets
S$63.1 Billion
Aim To Achieve Optimal Asset Class Allocation
Residential & Commercial Strata,
15%
Commercial, 26%
Lodging, 14%
Corporate & Others, 4%
Retail, 41%
Total Assets
S$63.1 Billion
• Total Assets from Developed Markets is ~56.7%• Trading Properties Made Up ~21% of Group’s Effective Share of Total Assets

17
Business Strategy Execution
Efficient Recycling Of Assets To Position Portfolio For Future Growth
S$288.7 Million Gains From S$4.0 Billion Divestments Redeployed Into S$6.1
Billion New Investments
DivestmentsConsideration
S$ million
From 1H 2018 3,108.1
70% stake in Westgate to CMT 789.6
Citadines Harbourview Hong Kong 97.0
Total 3,994.7
Note:• The table includes assets divested to unrelated parties and CapitaLand REITs/ Funds and acquired by CapitaLand/
CapitaLand REITs/ Funds from unrelated parties. Purchase consideration figures are on 100% basis. Gain on divestments arebased on effective stakes.
• Unless specified, transactions were completed.1. Target completion in 4Q 2018
InvestmentsConsideration
S$ million
From 1H 2018 1,796.7
Two residential sites in Guangzhou, China
409.31
Sengkang Central Mixed-Use site, Singapore
388.9
70% stake in Westgate, Singapore 789.6
Residential site in HCMC, Vietnam 81.4
70% stake in TAUZIA 35.4
Multifamily portfolio, U.S. 1,142.0
lyf one-north, Singapore 62.41
50% stake in The Work Project 27.0
Sub Total 4,732.7
75% stake in mixed-use site in Guangzhou
131.31
50% stake in 3rd Raffles City in Shanghai through RCCIP III
1,269.81
Total 6,133.8
lyf one-north Singapore
Sengkang Central,
Singapore
Heronfield in Seattle, USA

18
Acquisition
• Expected completion in 1H
2022 with ~700 units
• Integrated one-stop
community hub with
residential and retail
components
• Land price of S$777.78 million
(S$924 psf)
lyf one-north
Singapore
Sengkang Central
Mixed-Use Site1 Westgate
Divestment
• Divested 70% stake in
Westgate to CMT at agreed
property value of S$1,128.0
million (S$2,746 psf) on a 100%
basis2
Acquisition
• Expected completion in 2020
with ~324 units
• First coliving property in
Singapore’s research and
innovator business hub
• Total projected cost of S$117.0
million (including S$62.4 million
land price (S$850 psf ppr))
Business Strategy Execution
Singapore: Effective Redeployment Of Capital
Artist’s Impression Artist’s Impression
Note:
1. Non-remittable and revised ABSD rate (imposed from 6 July 2018) will not apply for this site acquisition.
2. As the transaction is on a completed basis, CapitaLand would be paying its proportionate 70% share of the agreed improvement works for
Westgate, which amounts to S$6.0 million.
19
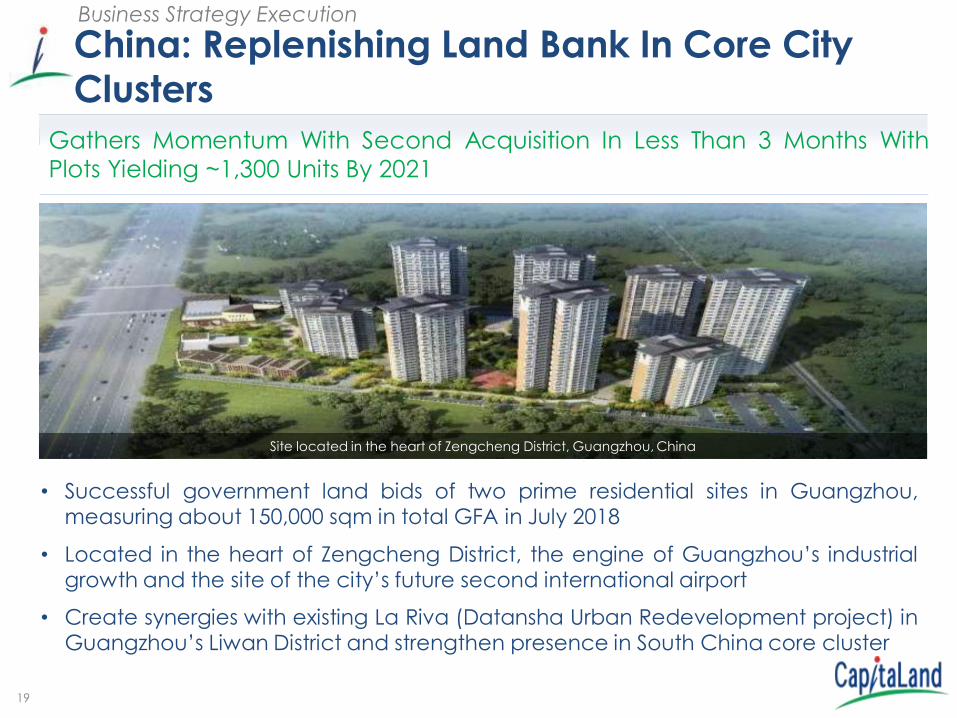
China: Replenishing Land Bank In Core City Clusters
• Successful government land bids of two prime residential sites in Guangzhou,measuring about 150,000 sqm in total GFA in July 2018
• Located in the heart of Zengcheng District, the engine of Guangzhou’s industrialgrowth and the site of the city’s future second international airport
• Create synergies with existing La Riva (Datansha Urban Redevelopment project) inGuangzhou’s Liwan District and strengthen presence in South China core cluster
Gathers Momentum With Second Acquisition In Less Than 3 Months With
Plots Yielding ~1,300 Units By 2021
Business Strategy Execution
Site located in the heart of Zengcheng District, Guangzhou, China

20
China: Acquisition Of 3rd Raffles City Integrated Development In Shanghai1
CapitaLand’s RCCIP III fund in 50:50 JV with GIC to acquire Shanghai’s
tallest twin towers for RMB19.5 billion
Business Strategy Execution
• Acquisition aligned with CapitaLand’sstrategy to focus in dominant assets infive city clusters in China
• An iconic landmark in Shanghai’s NorthBund, the property is set to beCapitaLand’s 3rd Raffles City in Shanghaiand 10th globally
• CapitaLand holds 41.7% stake in RCCIPIII
• Attractive acquisition price belowreplacement cost
• Property construction to be completedby June 2019
• Demonstrates fund managementcapability to grow AUM
Note:1. CapitaLand holds effective stake of 21%2. Acquisition announced on 13 November 2018
Artist’s Impression

21
Vietnam: Increasing Residential Presence To Meet Strong Demand
Business Strategy Execution
Second Acquisition To Drive Future Pipeline in 2018, Expecting To Yield More
Than 100 Landed Residential Units By 2021
CapitaLand landed residential development to be built in Ho Chi Minh City's District 2
Artist’s Impression
• Prime site in Ho Chi Minh City, measuring over 60,000 sqm in total area
• Located in Binh Trung Dong Ward in fast-growing District 2
• Continue momentum in replenishing land bank
• In line with the Group’s strategy to grow our presence in Vietnam

22
Note: 1. Based on exchange rate of US$1 : S$1.36757
Business Strategy Execution
International: Diversifying With Entry Into U.S. Multifamily Asset Class
Deep And Scalable Asset Class With Attractive Risk-Adjusted Returns
Contributing To CapitaLand’s Overall Portfolio Resilience
Heronfield, Seattle
Marquessa Villas, Greater Los Angeles
• In line with CapitaLand’s strategy todiversify outside of core marketsSingapore and China to developedmarkets and to grow new businesses
• Immediate contribution to theGroup’s return
• Value-add opportunities which canallow CapitaLand to further enhancethe value of these properties
• Opportunities to build up a sizeableglobal platform and strengthenexpertise in this asset class
16 Freehold
Multifamily Properties
US$835 Million (S$1.14 Billion1)
3,787Garden-Style
Apartment Units
Operating At Over
90% Average
Occupancy

23
Lodging: Solid Progress In Building Scale To Accelerate Growth
Business Strategy Execution
• Acquired 70% Stake In TAUZIA, Indonesia’s Top 5 Hotel Operator
• Exceeded 2020 Target Of 80,000 Units Well Ahead Of Time
• Expanding beyond serviced residences
and advancing in the business hotel
segment
• New segment targeting Southeast Asia’s
middle-class travellers
• Integrating into Ascott’s network -
synergies in cross selling, operational
efficiencies and customer outreach
• Leveraging on Ascott’s global network
and bringing TAUZIA beyond Indonesia
into markets including Malaysia, the
Philippines, Thailand and VietnamYELLO Hotel Manggaraii, Jakarta
122 Properties
Across Indonesia,
Malaysia And
Vietnam
20,000 units 6 Lifestyle Brands
Préférence
HARRIS VertuHARRIS
FOX HARRISYELLO
POP!
~60% in key cities of
Jakarta, Bali,
Bandung, Surabaya &
Yogyakarta

24
Retail: Strong Retail Leasing Momentum In Singapore
Business Strategy Execution
Funan –Singapore’s First Online-And-
Offline Shopping Mall
Jewel Changi Airport – Singapore’s First Multi-Dimensional Lifestyle
Destination
• Close to 90% pre-leased ahead of opening in
2019
• Integration of Nature, Play and Retail elements
on a large scale
• Unique experiential retail concepts with
established and new-to-market brands such as
Shake Shack, Pokémon, Läderach
• Over 280 shops and eateries, ~60% are new-to-
Changi brands, and over 30% are F&B
operators
Facade of Jewel Changi Airport1
• Topping out on 28 September 2018
• Strong leasing momentum with retail leasing
reached 70%
• Retail and office components slated to open
in 2Q 2019, ahead of schedule
• lyf Funan Singapore, coliving service
residence component, slated to open in 4Q
2019
Mr Ng Kee Choe, Chairman of CapitaLand Limited (far left), Mr Heng Swee Keat,
Singapore Minister for Finance (second from left) and Mr Lee Chee Koon, President &
Group CEO of CapitaLand Group(second from right) testing eCapitaVoucher payment
which is launching in November 2018
Note:
1. Photo credit: Changi Airport Group

25
Commercial: CapitaLand’s ‘Office Of The Future’ Ecosystem
Integrated offering of conventional office space (core) and flexible space
(flex) with community- and tech-enabled workplace solutions
Business Strategy Execution
• Acquired 50% stake in The Work Project, acompany operator known for its design andoperation capability
• Continue to innovate and enlarge ourworkplace offerings with tenant-centricsolutions
• Capital Tower and Asia Square Tower 2 willembrace CapitaLand’s core-flex offeringsfrom 1Q 2019
• Total area of 177,000 square feet1 of flexiblespaces will be initially available
Note: 1. Combining the flexible spaces at Capital Tower and Asia Square Tower 2, as well as The Work Project’s current offerings in
Singapore and Hong Kong
Flex workspaces available from 1Q 2019
S$3 million refurbishment at Level 9 of Capital Tower

26
• Secured First and Largest S$300 Million Sustainability-Linked Loan In Asia’s
Real Estate Sector
• Continued To Be Recognised By Esteemed Sustainability Indices
• The five-year multi-currency facility isthe largest sustainability-linkedbilateral loan in Singapore
• Explicitly linked to CapitaLand’s listingon the Dow Jones Sustainability WorldIndex (DJSI World)
• CapitaLand is the highest rankedSingapore company, and one of onlytwo Singapore companies that arelisted on the 2018 DJSI World
Business Strategy Execution
ESG: Building A Sustainable Future
Dow Jones SustainabilityWorld and Asia PacificIndexes 2018
Top 5% ESG company in real estate industry
A constituent of MSCI ESG Leaders Indexes and MSCI SRI Indexes 2018
A constituent of FTSE4Good Index Series
GRESB 5 Star, 2018
Highest-ranked real estate management and development company, 2018

27
Active Portfolio Reconstitution Bearing FruitsRecap
• Focused and well-calibrated asset recycling continues to drive Group profit forthe long term with $4.0 billion divestments and $6.1 billion new investments as at3Q 2018
• Diversified asset base and proactive capital management offers resilience andstability to the portfolio
• Strategic expansion into new Multifamily asset class in the U.S. strengthensrecurring income and further diversify CapitaLand’s global presence
• Disciplined approach to building Trading Property pipeline, concentrating onlyin core markets of China, Vietnam and Singapore where CapitaLand has strong“local” knowledge
• Best-in-class operating platforms to enhance asset value through scale anddigitalisation
On Track To Deliver Sustainable Returns Above Cost Of Equity To
Shareholders

28
Artist’s Impression Of CapitaSpring, Singapore
Financial
Performance

29
Financial Performance For YTD Sep 2018Financials
Healthy Operating PATMI Growth Underpinned By Newly Acquired / Opened Investment Properties In Singapore, China And Germany
S$' million YTD Sep 2017
(Restated)1
YTD Sep
20182
Change3
(including
gain from
The Nassim)
Change(excluding
gain from
The Nassim)
Revenue 3,405.6 3,978.0 17% 17%
EBIT 2,409.5 2,867.9 19% 28%
PATMI 1,291.7 1,286.8 0% 14%
Operating PATMI 757.6 658.4 -13% 10%
Portfolio Gains 195.0 109.7 -44% -44%
Revaluation Gains4/ Impairments 339.1 518.7 53% 53%
Note:1. YTD 2017 results restated to take into account the retrospective adjustments relating to SFRS(I)15 Revenue from Contracts with Customers
2. CapitaLand consolidated CMT, CRCT and RCST into the Group’s results with effect from August 2017. The consolidation increased the Group’s revenueand EBIT by approximately S$611.1 million and S$458.9 million for YTD Sep respectively. However, PATMI for YTD Sep 2018 were lower by $12 million due to
absence of the remeasurement gain arising from consolidation of the three trusts.3. YTD September 2017 Operating PATMI included a gain of S$160.9 million from the sale of 45 units of The Nassim
4. Includes realised revaluation gains in respect of divestments of Westgate, Singapore, Bugis Village and Twenty Anson in Singapore and 20 retail malls inChina. Realised fair value gains for YTD September 2017 relate to divestments of Golden Shoe Carpark, serviced residence component of Funan,
Citadines Biyun, Shanghai and Citadines Gaoxin, Xi’an, 2 serviced residences in Germany and One George Street in Singapore.

30
Balance Sheet & Liquidity Position Capital Management
Note:1. Total assets excludes cash2. On a run rate basis. Interest Coverage Ratio = EBITDA/ Net Interest Expenses; Interest Service Ratio = Operating Cashflow/
Net Interest Paid. EBITDA includes revaluation gain3. Based on put dates of Convertible Bond holders
Interest coverage ratio2
Net debt/equity
Net debt/total assets1
Interest service ratio2
FY 2017(Restated)
0.28
0.49
8.2
6.7
YTD Sep 2018
0.29
0.51
7.4
4.3
% Fixed rate debt 69% 74%
Balance Sheet Remains Robust
Ave debt maturity3 (Yr) 3.4 3.4
NTA per share ($) 4.20 4.34
Leverage ratios
Coverage ratios
Others

31
1.2
1.3
3.33.7
2.3
4.4
2.72.1
0.91.4
0.0
1.0
2.0
3.0
4.0
5.0
6.0
7.0
8.0
9.0
2018 2019 2020 2021 2022 2023 2024 2025 2026+
S$B
Total
Debt to be repaid or refinanced as planned
REIT Level Debt
0.1
Well-Managed Maturity Profile1 Of 3.4 YearsCapital Management
Well Equipped With ~S$8.0 Billion In Cash And
Available Undrawn Facilities To Capture Investment Opportunities
Note:1. Based on the put dates of the convertible bonds2. Ascott Residence Trust (ART), CapitaLand Commercial Trust (CCT), CapitaLand Mall Trust (CMT), CapitaLand Malaysia Mall
Trust, CapitaLand Retail China Trust and RCS Trust (Raffles City Singapore – directly held by CCT and CMT)3. As of 30 September 2018
On balance sheet debt due in 20183 S$’ billion
To be refinanced 0.6
To be repaid 0.7
Total 1.3
As a % of total on balance sheet debt 6.1%
Total Group cash balances and available undrawn facilities of CL's treasury vehicles = ~S$8.0 billion
2
Plans In Place For Refinancing / Repayment Of Debt Due In 2018
As of 31 Oct 2018, S$600m has been repaid and refinancing of S$500m has been secured
32
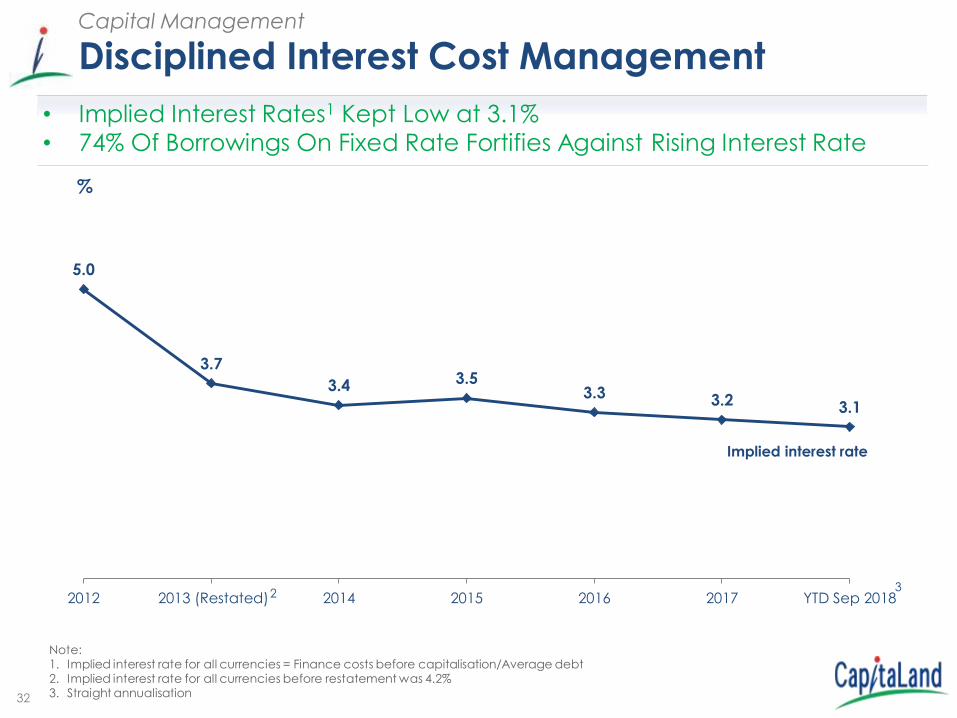
Disciplined Interest Cost Management Capital Management
3
Note:1. Implied interest rate for all currencies = Finance costs before capitalisation/Average debt2. Implied interest rate for all currencies before restatement was 4.2%3. Straight annualisation
5.0
3.7
3.4 3.53.3 3.2 3.1
2012 2013 (Restated) 2014 2015 2016 2017 YTD Sep 201823
%
Implied interest rate
• Implied Interest Rates1 Kept Low at 3.1%
• 74% Of Borrowings On Fixed Rate Fortifies Against Rising Interest Rate

33
CapitaLand Presentation May 2013
ION Orchard, SingaporeION Orchard, Singapore
Business
Updates

34
CapitaLand
Singapore, Malaysia
and Indonesia
Artist’s Impression Of Sengkang Central, Singapore
35
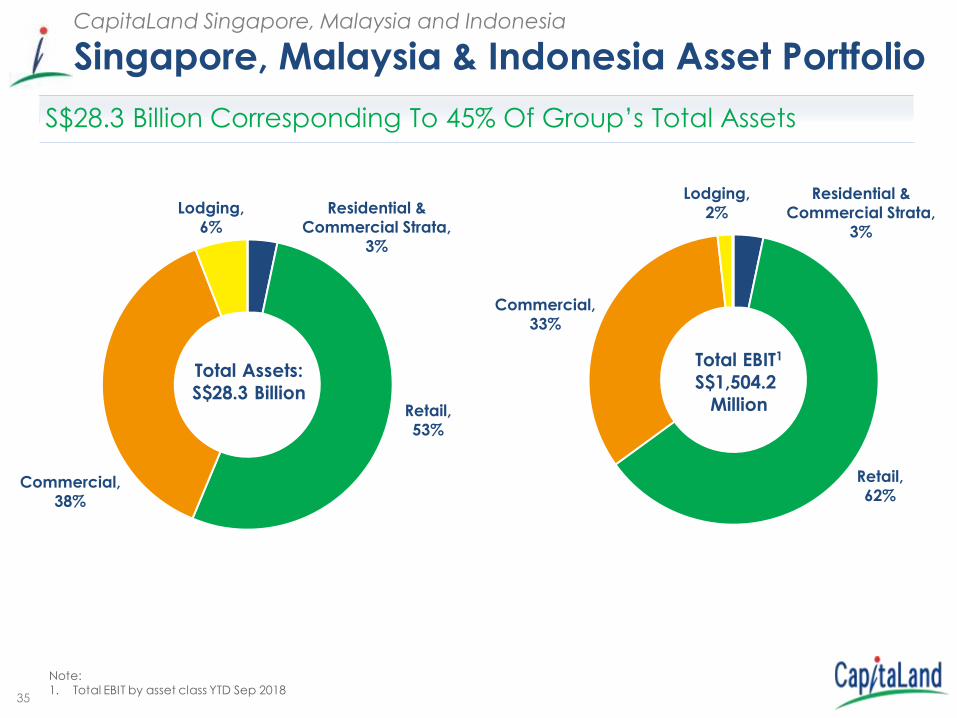
Singapore, Malaysia & Indonesia Asset PortfolioCapitaLand Singapore, Malaysia and Indonesia
S$28.3 Billion Corresponding To 45% Of Group’s Total Assets
Total Assets:
S$28.3 Billion
Residential &
Commercial Strata,
3%
Retail,
53%
Commercial,
38%
Lodging,
6%
Note:1. Total EBIT by asset class YTD Sep 2018
Residential &
Commercial Strata,
3%
Retail,
62%
Commercial,
33%
Lodging,
2%
Total EBIT1
S$1,504.2
Million

36
Singapore Residential Sales
Note:1. Based on options exercised2. 1H 2017 figures include the sale of 45 units in The Nassim (worth ~S$407.2 million)
84 40
103
37
108
14
295
91
0
100
200
300
400
YTD Sep 2017 YTD Sep 2018
Re
sid
en
tia
l U
nits
3Q 2018: ~0.1x y-o-y
YTD Sep 2018: ~0.3x y-o-y
504
150
289
136
373
52
1,166
338
0
200
400
600
800
1,000
1,200
1,400
YTD Sep 2017 YTD Sep 2018
Sa
les
Va
lue
(S$ m
illio
n)
3Q 2018: ~0.1x y-o-y
YTD Sep 2018: ~0.3x y-o-y
Singapore - Residential
Sold 91 Units1 Worth S$338 Million
1Q
2Q
3Q

37
Launched Projects Substantially Sold1
Note: 1. Figures might not correspond with income recognition2. Sales figures of respective projects are based on options issued3. Sell-by date for The Interlace has been extended to 13 March 2019
Singapore - Residential
~99% Of Units Sold As At 30 September 20182
Project Total unitsUnits sold as at 30
Sep 2018% of launched
units sold
d’Leedon 1,715 1,715 100%
Marine Blue 124 113 91%
Sky Habitat 509 504 99%
The Interlace3 1,040 1,037 99%
The Orchard Residences 175 173 99%

38
CapitaLand
China
Raffles City Hangzhou, China

39
Total Assets:
S$23.2 Billion
China Asset PortfolioCapitaLand China
S$23.2 Billion Corresponding To 37% Of Group’s Total Assets
Residential &
Commercial Strata,
34%
Retail,
43%
Commercial,
17%
Lodging,
6%
Total EBIT1
S$1,068.5
Million
Note:1. Total EBIT by asset class YTD Sep 2018
Residential &
Commercial Strata,
27%
Retail,
52%
Commercial,
19%
Lodging,
2%

4040
China - Residential
Strong Residential Presence In Strategic City Clusters In China
Note: Figures are as of 30 September 20181. Excludes approximately 1,300 units from the two sites in Guangzhou (announced on 14 August 2018).2. Excludes area from the above-mentioned acquisition.
>29,000(1)
HomesIncludes units
under development in the pipeline
>4.1(2)
Million sqm in GFAIncludes area under development
in the pipeline
Tianjin
Beijing
ShanghaiHangzhou
Ningbo
Chengdu
Chongqing
Wuhan
Xian
Guangzhou
Shenyang
Kunshan
Focus on 5 City Clusters
2018 Landbank Acquisitions
Integrated Developments
Homes
Raffles City Developments
Shenzhen

41
China Residential SalesChina – Residential
Note: 1. Units sold includes options issued as at 30 September 2018 2. Above data is on a 100% basis. Comparative figures include strata units in integrated development. YTD Sep 2017 figures
include the remaining inventory sold through the divestment of Central Park City Wuxi (108 residential units with a total value RMB192 million) and The Botanica Chengdu (total value RMB105 million).
3. Value includes carpark, commercial and value added tax.
2,149
998
3,159
746
2,163
826
7,471
2,570
0
1,000
2,000
3,000
4,000
5,000
6,000
7,000
8,000
YTD Sep 2017 YTD Sep 2018
3Q 2018: ~0.4x y-o-y
YTD Sep 2018: ~0.3x y-o-y
3,932
1,676
4,748
3,231
4,407
2,608
13,087
7,515
0
1,000
2,000
3,000
4,000
5,000
6,000
7,000
8,000
9,000
10,000
11,000
12,000
13,000
14,000
YTD Sep 2017 YTD Sep 2018
3Q 2018: ~0.6x y-o-y
YTD Sep 2018: ~0.6x y-o-y 1Q
2Q
• 96% Of Launched Units Sold As At 30 September 20181
• Launches Deferred Due To Tighter Government Measures
3Q
Sa
les
Va
lue
(R
MB
mill
ion
)
Re
sid
en
tia
l U
nits

42
High Sell-Through Rate For Launches Post 3Q 2018China – Residential
La Botanica,
Xian
The Metropolis,
Kunshan
The Lakeside,
Wuhan
Parc Botanica,
Chengdu
• Launched 535 units
in October 2018
• Over 90% sold with
ASP ~RMB11.4k psm
• Sales value
~RMB585 million
• Launched 324 units
in October 2018
• Over 90% sold with
ASP ~RMB23.5k psm
• Sales value
~RMB758 million
• Launched 372 units
in October 2018
• About 90% sold with
ASP ~RMB9.0k psm
• Sales value
~RMB322 million
• Launched 388 units
in November 2018
• 100% sold with ASP
~RMB8.8k psm
• Sales value
~RMB332 million
Strong Broad-Based Demand Across CapitaLand’s Key Focused City Clusters

43
Cautiously Optimistic On China Property MarketChina – Residential
Close To 3,500 Units Ready To Be Released In 4Q 2018
City Project Total units
Guangzhou La Riva 200
Xi’an La Botanica 535
Kunshan The Metropolis 460
Shenyang Lake Botanica 981
Wuhan Lakeside 372
ChengduCentury Park (East) 352
Parc Botanica 388
Chongqing Spring 184
Grand Total 3,472
Note: Units will be released for sale subject to regulatory approval.
44
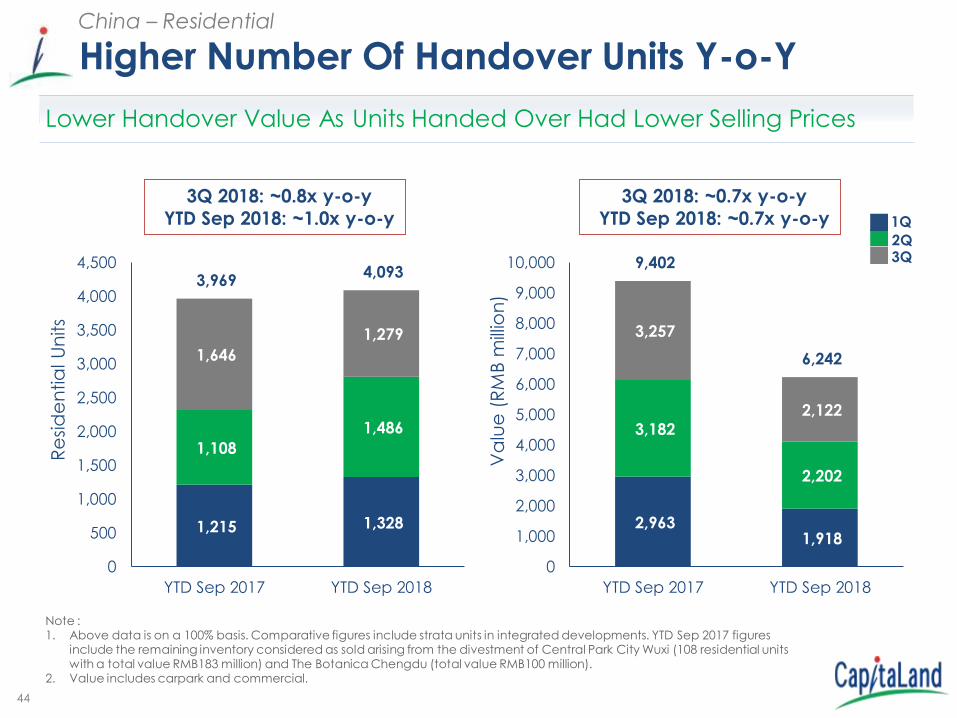
Higher Number Of Handover Units Y-o-YChina – Residential
Note :1. Above data is on a 100% basis. Comparative figures include strata units in integrated developments. YTD Sep 2017 figures
include the remaining inventory considered as sold arising from the divestment of Central Park City Wuxi (108 residential units with a total value RMB183 million) and The Botanica Chengdu (total value RMB100 million).
2. Value includes carpark and commercial.
1,215 1,328
1,108
1,486
1,646
1,279
3,969 4,093
0
500
1,000
1,500
2,000
2,500
3,000
3,500
4,000
4,500
YTD Sep 2017 YTD Sep 2018
3Q 2018: ~0.8x y-o-y
YTD Sep 2018: ~1.0x y-o-y
2,963 1,918
3,182
2,202
3,257
2,122
9,402
6,242
0
1,000
2,000
3,000
4,000
5,000
6,000
7,000
8,000
9,000
10,000
YTD Sep 2017 YTD Sep 2018
3Q 2018: ~0.7x y-o-y
YTD Sep 2018: ~0.7x y-o-y
Lower Handover Value As Units Handed Over Had Lower Selling Prices
1Q
2Q3Q
Re
sid
en
tia
l U
nits
Va
lue
(R
MB
mill
ion
)

45
Healthy Future Revenue Recognition China – Residential
Note: 1. Units sold include options issued as at 30 September 2018. Above data is on a 100% basis, including strata units in integrated
developments2. Value refers to value of residential units sold including value added tax.
Città di Mare, GuangzhouVermont Hills, Beijing La Botanica, Xi’anNew Horizon, Shanghai
• ~7,000 Units Sold1 With A Value Of ~RMB 15.9 Billion2 Expected To Be
Handed Over From 4Q 2018 Onwards
• ~40% Of Value Expected To Be Recognised In 4Q 2018

46
On-Time Completion And HandoverChina – Residential
Skyview,
Raffles City Hangzhou
Note: Sales value includes value added tax.
• Completed 262 units
• 100% sold with
• ASP: RMB18.5k psm
• Sales value: ~RMB516.9m
• Handed over 100% of the
units sold
The Metropolis,
KunshanCitta Di Mare,
Guangzhou
• Completed 316 units
• 100% sold with
• ASP: RMB15.4k psm
• Sales value: ~RMB573.1m
• Handed over 99% of the
units sold
• Completed 45 units
• 100% sold with
• ASP: RMB38.0k psm
• Sales value: ~RMB394.3m
• Handed over 89% of the
units sold

47 Artist’s Impression Of Raffles City Chongqing, China
Raffles City
China Portfolio

48
Raffles City China Portfolio
Robust NPI
Note:1. Relates to Gross Floor Area of leasing components excluding carparks2. Excludes strata/trading components. Comparative NPI adjusted to include government rebates3. NPI yields based on valuations as at 30 June 2018 and on an annualised basis4. Relates mainly to retail and office components, as serviced residence and hotel have yet to commence operations5. Not meaningful as these properties’ main components (retail and office) only commence operations in 2Q 2017
Raffles CityTotal GFA1
(sqm)
CL effective
stake
(%)
Net Property Income2
(RMB million)
(100% basis)NPI
Y-o-Y
growth (%)
NPI yield on
valuation3 (%)
(100% basis)YTD Sep
2018
YTD Sep
2017
Shanghai ~140,000 30.7 451 442 2.0
~4 to 5%Beijing ~111,000 55.0 201 200 0.5
Chengdu ~209,000 55.0 135 124 8.9
Ningbo ~82,000 55.0 75 69 8.7
Changning ~260,000 42.8 281 -5
Not
meaningful~3 to 5%Hangzhou ~158,000 55.0 89
4-5
Shenzhen ~122,000 30.4 125 -5

49
Raffles City China Portfolio
Note:1. Relates to the year of opening of the first component of the Raffles City project.
Strong Committed Occupancy

50
Raffles City Chongqing – Construction On Track
Note: Value is as at 30 September 2018 and includes value added tax.
Raffles City China Portfolio
Overall construction progressing well Second section of conservatory hoisted in June 2018
Raffles City Residences Towers 1, 2 And 6 Achieved ~RMB 3.9 Billion In
Sales, ~70% Of Launched Units Sold

CapitaLand
Vietnam
The Vista, Ho Chi Min City, Vietnam

52
Total Assets:
S$1.3 Billion
Vietnam Asset PortfolioCapitaLand Vietnam
S$1.3 Billion Corresponding To 2% Of Group’s Total Assets
Residential &
Commercial Strata,
55%
Retail,
3%
Commercial,
6%
Lodging,
36%
Total EBIT1
S$84.6 Million
Note:1. Total EBIT by asset class YTD Sep 2018
Residential &
Commercial Strata,
15%
Retail,
1%
Commercial,
50%
Lodging,
34%
53
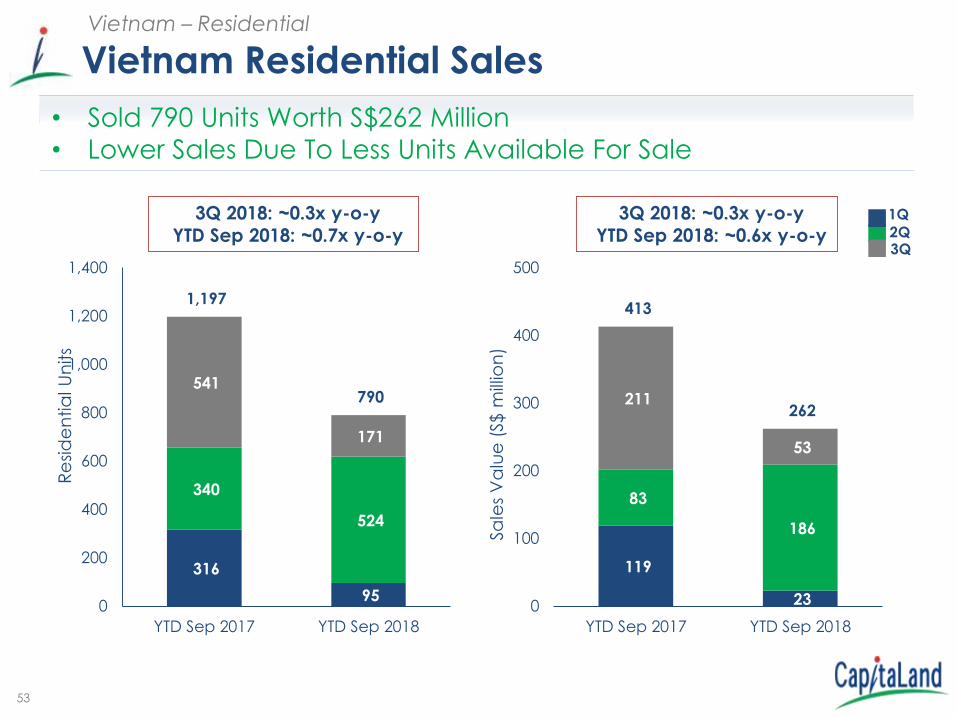
Vietnam Residential SalesVietnam – Residential
316
95
340
524
541
171
1,197
790
0
200
400
600
800
1,000
1,200
1,400
YTD Sep 2017 YTD Sep 2018
Re
sid
en
tia
l U
nits
3Q 2018: ~0.3x y-o-y
YTD Sep 2018: ~0.7x y-o-y
119
23
83
186
211
53
413
262
0
100
200
300
400
500
YTD Sep 2017 YTD Sep 2018
Sa
les
Va
lue
(S$ m
illio
n)
3Q 2018: ~0.3x y-o-y
YTD Sep 2018: ~0.6x y-o-y
• Sold 790 Units Worth S$262 Million
• Lower Sales Due To Less Units Available For Sale
1Q
2Q3Q

54
Strong Demand For Launched ProjectsVietnam – Residential
Note:1. Refers to residential units available for sales
Project Total units1 Total units launched
Units sold as at 30 Sep
2018
% of launched units sold
% Completed
Ho Chi Minh City
d’Edge 273 273 273 100% 17%
D1MENSION 102 102 66 65% 68%
Feliz en Vista 973 973 965 99% 43%
The Vista 750 750 749 99% 100%
Vista Verde 1,152 1,152 1,118 97% 100%
De La Sol 870 482 453 94% 6%
D2eight 28 28 27 96% 75%
Hanoi
Mulberry Lane 1,478 1,478 1,461 99% 100%
Seasons Avenue
1,300 1,300 1,163 89% 100%
96% Of Launched Units Sold As At 30 September 2018
55
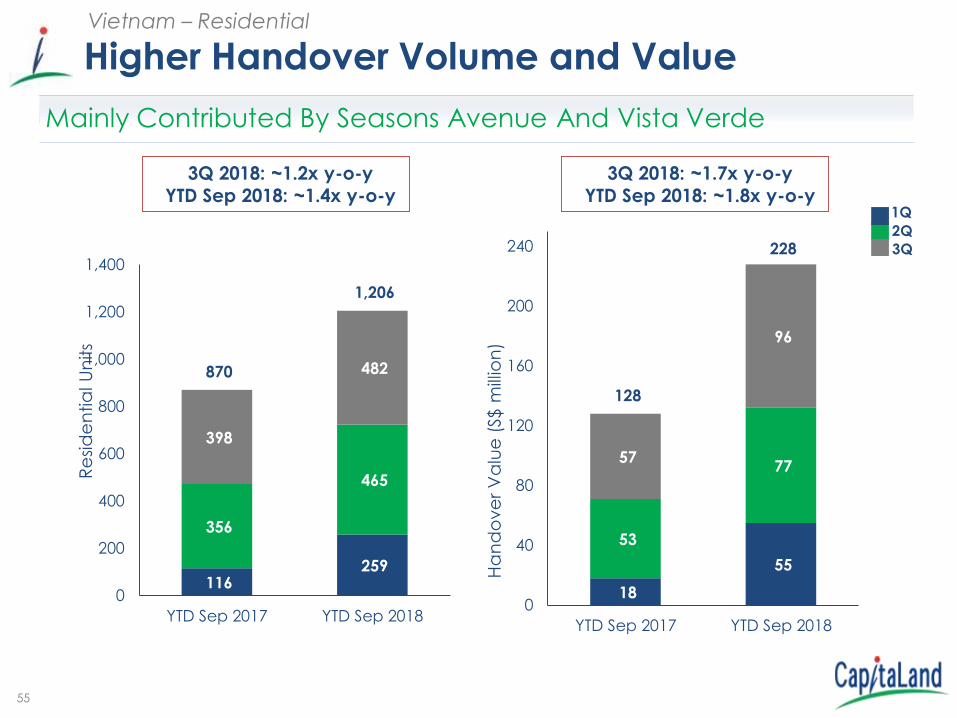
Higher Handover Volume and ValueVietnam – Residential
116 259
356
465
398
482 870
1,206
0
200
400
600
800
1,000
1,200
1,400
YTD Sep 2017 YTD Sep 2018
Re
sid
en
tia
l U
nits
18
55
53
77 57
96
128
228
0
40
80
120
160
200
240
YTD Sep 2017 YTD Sep 2018
Ha
nd
ove
r V
alu
e (
S$ m
illio
n)
1Q
2Q
3Q 2018: ~1.2x y-o-y
YTD Sep 2018: ~1.4x y-o-y
3Q 2018: ~1.7x y-o-y
YTD Sep 2018: ~1.8x y-o-y
Mainly Contributed By Seasons Avenue And Vista Verde
3Q

56
Future Revenue Recognition Vietnam – Residential
Vista Verde, Ho Chi Minh City Seasons Avenue, HanoiKris Vue, Ho Chi Minh City
• 2,369 Units Sold With A Value Of ~S$712 Million Expected To Be Handed
Over From 4Q 2018 Onwards
• More Than 10% Of The Value Is Expected To Be Recognised In 4Q 2018

57Marquessa Villas, The United States of America
CapitaLand International

58
International Asset PortfolioCapitaLand International
S$7.7 Billion Corresponding To 12% Of Group’s Total Assets
Retail, 13%
Commercial, 21%
Lodging2, 66% Total Assets:
S$7.7 BillionBy Asset Class
Europe, 43%
Japan, 31%
U.S., 11%
Australia, 7%
Others, 8%
Total Assets:
S$7.7 BillionBy Geography
Retail, 12%
Lodging, 68%
Commercial, 20%
Note:1. Total EBIT by asset class YTD Sep 20182. Total assets include deposits paid for the acquisition of 16
multifamily assets in the U.S.
Total EBIT1
S$216.6 Million

59
Artist’s Impression Of Funan, Singapore
Retail
Platform

60
Retail
23%
10%
61%
6%
38%
4%
57%
1%
34%
7%
57%
2%
Retail Platform Overview1
Note:1. Operational data includes properties under management contract. Total sales and traffic info are for YTD
September 20182. Includes properties owned/managed by retail platform as at 30 September 2018. Decrease from 102 (as at 31 Mar
2018) to 83 with the divestment of 20 assets in China and Sembawang Shopping Centre in Singapore, offset by theaddition of two management contracts in China
3. Others comprise property in Cambodia
47%
8%
45%
83 Properties2Total property
value of
S$47.8 Billion2
Total sales of
S$8.2 billion1
Total traffic
of
895 million1
Singapore Malaysia China Japan Others3

61
Healthy Tenant Sales Growth Across Core MarketsRetail
Note:1. Portfolio includes properties that are operational as at 30 September 2018. It excludes the 20 properties divested in China2. Same-mall compares the performance of the same set of property components opened/acquired prior to 1 January 20173. NPI Yield on valuation is based on valuations as at 30 June 20184. Committed occupancy rates as at 30 September 2018 for retail components only5. China: Excludes two master-leased malls. Tenants’ sales from supermarkets and department stores are excluded6. Japan: Excludes two master-leased malls
Portfolio1
(YTD Sep 2018 vs YTD Sep 2017) Singapore China
Tenants’ sales growth +2.2% +20.9%
Same-mall1,2
YTD Sep 2018 YTD Sep 2018 vs YTD Sep 2017
NPI yield on
valuation3
Committed
occupancy rate4
Shopper traffic
growth
Tenants’ sales
growth (per sq ft/m)
Singapore 5.7% 98.3% +0.6% +1.2%
China5 5.0% 97.7% +1.3% +4.5%
Malaysia 5.8% 92.8% -1.6% +6.7%
Japan6 5.3% 98.8% +0.1% -2.5%

62
Resilient Same-Mall NPI Growth1 In Core MarketsRetail
Raffles City Singapore
Suzhou Center Mall
Currency Change
(mil) 2018 2017 (%)
Singapore SGD 690 676 +2.1%
China RMB 2,897 2,690 +7.7%
Malaysia MYR 218 233 -6.4%
Japan2 JPY 1,889 1,986 -4.9%
Country YTD Sep
Note:• The above figures are on 100% basis, with the NPI of each property taken in its entirety regardless of CapitaLand’s effective interest. This analysis
compares the performance of the same set of property components opened/acquired prior to 1 January 2017, excluding the 20 divestedproperties as announced in 1Q 2018
1. An integrated development is regarded as a single asset. Above tabulation comprises NPI from all the components present in an integrateddevelopment
2. Excluding Olinas, which is undergoing asset enhancement works, Japan’s same-mall NPI growth would have been +3.6%
63
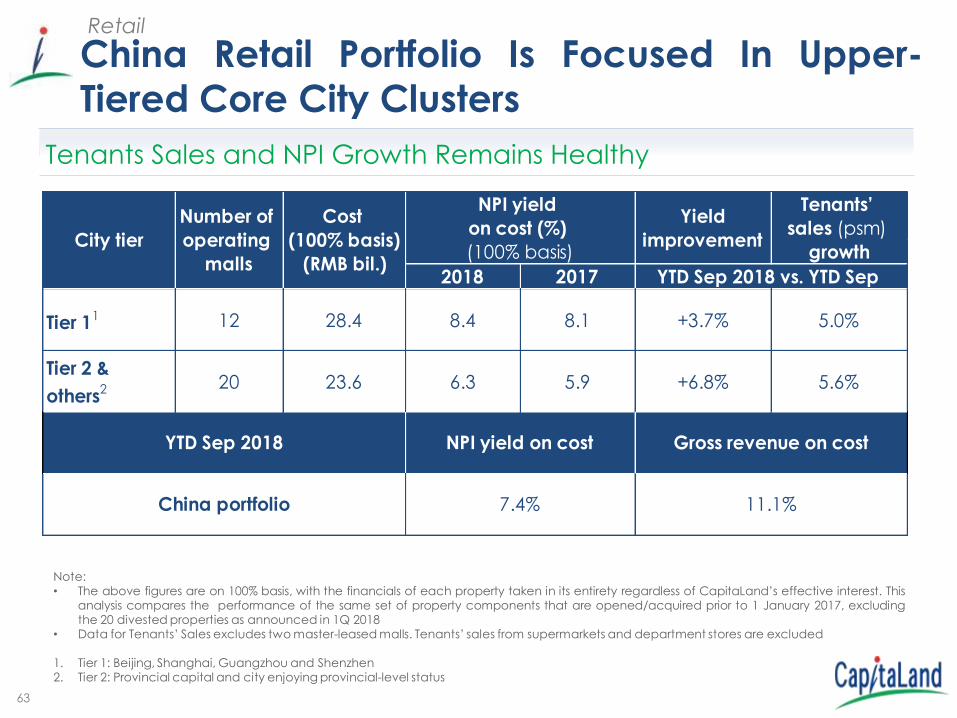
China Retail Portfolio Is Focused In Upper-Tiered Core City Clusters
Retail
Note:• The above figures are on 100% basis, with the financials of each property taken in its entirety regardless of CapitaLand’s effective interest. This
analysis compares the performance of the same set of property components that are opened/acquired prior to 1 January 2017, excludingthe 20 divested properties as announced in 1Q 2018
• Data for Tenants’ Sales excludes two master-leased malls. Tenants’ sales from supermarkets and department stores are excluded
1. Tier 1: Beijing, Shanghai, Guangzhou and Shenzhen2. Tier 2: Provincial capital and city enjoying provincial-level status
Tenants Sales and NPI Growth Remains Healthy
2018 2017
Tier 11 12 28.4 8.4 8.1 +3.7% 5.0%
Tier 2 &
others2 20 23.6 6.3 5.9 +6.8% 5.6%
Gross revenue on costNPI yield on costYTD Sep 2018
11.1%7.4%China portfolio
City tier
NPI yield
on cost (%)
(100% basis)
Tenants’
sales (psm)
growth
Number of
operating
malls
Yield
improvement
Cost
(100% basis)
(RMB bil.)YTD Sep 2018 vs. YTD Sep

64
Pipeline Of Properties Opening Retail
2018 2019 & beyond
Singapore 17 - 2 19
China1 42 1 8 51
Malaysia 7 - - 7
Japan 5 - - 5
Others3 - - 1 1
Total 71 1 11 83
Number of properties
Target2 to be opened in Opened Total
Country
Note: 1. Excludes 20 divested properties as announced in 1Q 2018 and includes two new management contracts in China2. The opening targets relate to the retail components of integrated developments and properties managed by CL Retail3. Others comprise property in Cambodia
65
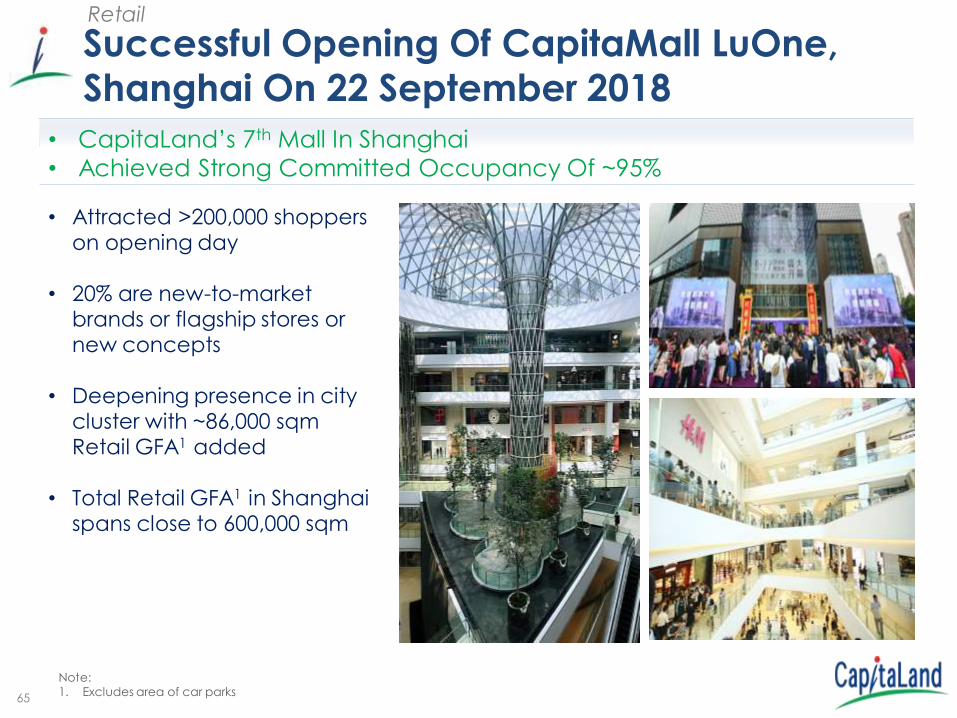
Successful Opening Of CapitaMall LuOne, Shanghai On 22 September 2018
Retail
• CapitaLand’s 7th Mall In Shanghai
• Achieved Strong Committed Occupancy Of ~95%
• Attracted >200,000 shoppers on opening day
• 20% are new-to-market brands or flagship stores or new concepts
• Deepening presence in city cluster with ~86,000 sqm Retail GFA1 added
• Total Retail GFA1 in Shanghai spans close to 600,000 sqm
Note: 1. Excludes area of car parks

66
CapitaMall Tiangongyuan, Beijing Opening In 4Q 2018
Retail
Note: As at 30 September 2018
• CapitaLand’s 8th Mall In Beijing With GFA Of ~199,000 Sqm
• Committed Occupancy ~96%; ~17% Are New-To-Market Or Flagship
Stores
Committed Tenants
Interior fitting-out in progress
External façade of CapitaMall Tiangongyuan

67CapitaGreen, Singapore
Commercial
Platform

68
Singapore Southeast
Asia
China Japan Germany
Commercial
Total 39 properties2
1%
Total property value
of S$35.0 billion2
Total Commercial
Space of 1.9 Mil. sqm3
Total no. of tenants –
1,3604
51%
5%
26%10%
3%
55%
37%
56%
5%
29%
4%
66%
28%
3%
2%
Commercial Platform Overview
8%
5%
6%
1%
1
Note:1. Southeast Asia excludes Singapore
2. Figures as at 30 September 20183. Figures include combination of GFA and NLA of commercial properties as at 30 September 2018.
4. Figure as at 31 December 2017

69
Expanding Commercial Footprint In ChinaCommercial - China
Office Space In Shanghai and Beijing Constitutes ~63% Of Total GFA
• Stabilised projects1 maintained their high
occupancy and rent, with average rental
reversion of +4% in 3Q 2018
• New projects2 continued their leasing
momentum with average committed
occupancy3 improved by 10% quarter-on-
quarter in 3Q 2018
• Leed Platinum awarded to Innov Center in
Shanghai
20 Projects In
11 Cities
17 In Operations
3 Under Development
Average Committed Occupancy For Matured Projects
93.0%Total GFA
Over 1.2
million sqm
Innov Center, Shanghai
Notes:
1. Stabilized projects include offices in Raffles City Shanghai, Hongkou, Minhang, Raffles City Ningbo, Raffles City Beijing, Tianjin International
Trade Centre, Raffles City Shenzhen, Raffles City Chengdu, CapitaMall Tianfu and CapitaMall Xindicheng
2. New projects include offices in Raffles City Changning, Capital Square, Innov Center, Raffles City Hangzhou, Suzhou Center, One iPark and
CapitaMall Westgate
3. As at 30 September 2018

70
Resilient Office PortfolioCommercial - Singapore
CCT Singapore portfolio committed occupancy 1
99.1% Singapore core CBD occupancy1 94.6%
Notes:1. As at 30 September 20182. Excludes Twenty Anson which was divested on 29 August 2018 3. Average gross rent per month for office portfolio (S$ psf) = Actual gross rent for occupied office + Committed gross rent for vacant office
Committed area of office4. Excludes Gallileo in Frankfurt, Germany
Achieved Above Market Committed Occupancy
Average Office Rent2 Of CCT’s Singapore Portfolio Improved By 0.9% QoQ
8.03 8.13 8.22 8.238.42
8.618.78 8.88 8.89 8.90 8.96 8.98
9.22 9.20 9.18 9.18 9.23
9.74 9.70 9.65 9.74
Sep-13 Mar-14 Sep-14 Mar-15 Sep-15 Mar-16 Sep-16 Mar-17 Sep-17 Mar-18 Sep-18
Average gross rent per month for office portfolio (S$ psf)
2
3

71
Lodging
Platform
Artist’s Impression Of lyf one-north Singapore

72
17%
6%
2%
7%5%
7%
8%
35%
33%
7%
12%
45%
27%
63%
8%
6%
Singapore SE Asia & Australia
(Ex-S'pore)
China North Asia
(Ex-China)
Europe Others
9%
Lodging
Total 638
properties1
Total property
value of
S$27.5 billion2
26%
Lodging Platform Overview
Note: Includes operating and pipeline properties owned/managed by the service residence platform1. Figures as at 5 October 2018 2. Figures as at 30 September 2018 and includes estimates of 3rd party owned assets in various stages of development
Total no. of
units1 –
94,62157%
21%
5%
6%
8%
3%

7373
199
93103 106
151
123115
222
89
111 107
170
117 121
Singapore SE Asia &
Australia (ex
S'pore)
China North Asia
(ex China)
Europe Gulf Region
& India
Total
YTD Sep 2017 YTD Sep 2018
Notes: 1. Same store. Include all serviced residences owned, leased and managed. Foreign currencies are converted to SGD at
average rates for the period.2. RevPAU – Revenue per available unit
Resilient Operational Performance
Lodging
Overall YTD Sep 2018 RevPAU Increased 5% YoY On Same Store
Basis
S$
-5%
+13%
-4%
+12%
+7%
+5%+1%
-2% based
on local
currency
No change
based on local
currency

74
Strong And Healthy Pipeline1
Lodging
~39,400 Units Under Development Expected To
Contribute ~S$80.0 Million3 Of Fee Income Annually
Note: 1. Figures as at 5 October 20182. Fee income includes fee based and service fee income3. Fee income on a stablised basis
Operational Units Contributed S$130.9 Million2 Fee Income In YTD Sep 2018
0
20,000
40,000
60,000
Singapore SEA &
Australasia
(ex. SG)
China North Asia
(ex. China)
Europe United States
of America
Others
Operational Under Development
75
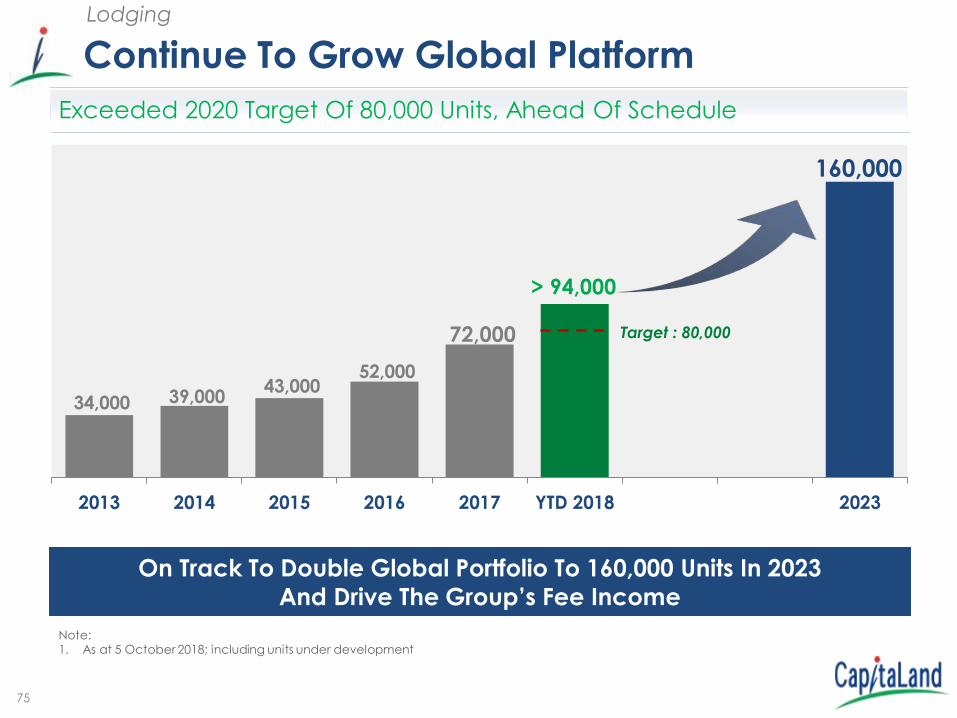
Continue To Grow Global Platform
Lodging
On Track To Double Global Portfolio To 160,000 Units In 2023
And Drive The Group’s Fee Income
Note: 1. As at 5 October 2018; including units under development
Exceeded 2020 Target Of 80,000 Units, Ahead Of Schedule
34,000 39,000 43,000
52,000
72,000
> 94,000
160,000
2013 2014 2015 2016 2017 YTD 2018 2023
Target : 80,000

76
Citadines Brand Debut In The U.S.
Lodging
Enhance engagement in America customers, reinforcing cross selling
across geographies
125 newly refurbished rooms
Centrally located along the prestigious
Fifth Avenue shopping street and near Times
Square
Completed Refurbishment Of Citadines Connect Fifth Avenue In New York

Thank You

78
Raffles City Beijing, China
Supplementary Information

79
Residential / Trading Sales & Completion StatusChina – Residential

80
Residential / Trading Sales & Completion Status (Cont’d)
China – Residential
Note:1. % sold: Units sold (Options issued as of 30 September 2018) against units launched. 2. Average selling price (RMB) per sqm is derived using the area sold and sales value achieved (including options issued) in the latest
transacted quarter.3. Launches from existing projects in 3Q 2018, namely Raffles City Residences (RCCQ): 268 units, Citta Di Mare: 69 units, Lake
Botanica (Shenyang): 78 units and La Botanica (Xian): 528 units.4. Projects/Phases fully completed prior to 3Q 2018.
Projects Units
launched
CL
effective
stake
% of
launched
units sold1
Average
Selling
Price2
Completed
units in
% As at 30 Sep
2018
RMB/Sqm 3Q 2018 4Q 2018 2019 2020
SHENYANG
Lake Botanica - Phase 4 (Plot 4) 401 3 60% 69% 5,513 401 0 0 0
XIAN
La Botanica - Phase 2A (2R8) 432 4 99% 0 0 0 0
La Botanica - Phase 5 (2R6) 612 4 99% 0 0 0 0
La Botanica - Phase 7 (2R4) 1,619 4 99% 0 0 0 0
La Botanica - Phase 8 (3R2) 1,703 100% 0 1,048 655 0
La Botanica - Phase 9 (2R5) 1,914 3 99% 0 1,386 0 528
La Botanica - Total 6,280 38% 99% 11,368 0 2,434 655 528
Sub-total 6,681 98% 401 2,434 655 528
CL China 14,920 96% 1,423 3,606 3,434 796
Expected Completion for launched units

8181
217
94108 115
162
121 121
241
91
114 118
184
122 127
Singapore SE Asia &
Australia
(ex S'pore)
China North Asia
(ex China)
Europe Gulf Region &
India
Total
3Q 2017 3Q 2018
Notes: 1. Same store. Include all serviced residences owned, leased and managed. Foreign currencies are converted to SGD at
average rates for the period.2. RevPAU – Revenue per available unit
Resilient Operational PerformanceLodging
Overall 3Q 2018 RevPAU Increased 5% YoY on a same store basis
S$
+11%
+5%+6% +1%+3%
+14%
-3%
No change
based on local
currency

82
Units Under Management1Lodging
Note: 1. As at 5 October 2018
55,195 Operational Units And 39,426 Pipeline UnitsART ASRGF Owned Minority Owned Franchised 3rd Party Managed Leased Total
Singapore 1,041 279 1,187 83 2,590
Indonesia 407 192 185 380 20,407 21,571
Malaysia 205 221 4,451 4,877
Philippines 495 3,832 4,327
Thailand 651 3,434 4,085
Vietnam 851 132 5,361 6,344
Myanmar 238 238
Laos 116 116
Cambodia 461 461
SEA Total 2,999 471 317 872 380 39,487 83 44,609
China 1,441 464 34 18,078 36 20,053
Japan 2,086 55 427 124 430 3,122
South Korea 1,329 1,329
North Asia Total 3,527 55 891 0 34 19,531 466 24,504
India 456 984 1,440
South Asia Total 0 0 456 0 0 984 0 1,440
Fiji 54 54
New Zealand 1,577 1,577
Australia 777 221 106 34 9,190 157 10,485
Australasia Total 777 221 106 34 10,821 0 157 12,116
United Kingdom 600 108 230 100 1,038
Ireland 136 136
France-Paris 994 70 112 236 516 1,928
France-Outside Paris 678 237 1 309 1,225
Belgium 323 323
Germany 721 721
Spain 131 131
Georgia 66 66
Europe Total 3,447 178 478 0 337 303 825 5,568
U.A.E 307 199 506
Saudi Arabia 1,561 1,561
Bahrain 118 118
Qatar 200 200
Oman 364 364
Turkey 165 165
Gulf Region Total 0 0 0 307 0 2,607 0 2,914
Ghana 260 260
Africa Total 0 0 0 0 0 260 0 260
Brazil 214 214
South America Total 0 0 0 0 214 0 0 214
United States 1,004 261 1,265
North America Total 1,004 0 261 0 0 0 0 1,265
Synergy Total 1,731 1,731
GRAND TOTAL 11,754 925 2,509 1,213 11,786 63,172 3,262 94,621

83
3.6
20.5
5.6
21.5
0.1
0.5
China Singapore Others
AUM by geography (S$ billion)
REITs PE Funds
3
Diversified Portfolio Of Funds
Funds Business
Fund Business
Note:1. Fund size as at respective fund closing date2. Formerly known as Raffles City China Fund3. Others include Malaysia, Vietnam, Other Asia, Europe, United States of America
No. Fund name
1 CapitaLand Mall China Income Fund US$ 900
2 CapitaLand Mall China Income Fund I I US$ 425
3 CapitaLand Mall China Income Fund I I I S$ 900
4 CapitaLand Mall China Development Fund I I I US$ 1,000
5 Ascott Serviced Residence (China) Fund US$ 500
6 Ascott Serviced Residence (Global) Fund US$ 600
7 Raffles City China Income Ventures Limited2 US$ 1,180
8 Raffles City Changning JV S$ 1,026
9 CTM Property Trust S$ 1,120
10 CapitaLand Township Development Fund I US$ 250
11 CapitaLand Township Development Fund I I US$ 200
12 Vietnam Joint Venture Fund US$ 200
13 CapitaLand Mall India Development Fund S$ 880
14 Raffles City China Investment Partners I I I US$ 1,500
15 CapitaLand Vietnam Commercial Fund I US$ 300
16 CapitaLand Vietnam Commercial Value-Added Fund US$ 130
Fund size
(million)1

84
39.2
42.4
46.047.9
51.2 51.8
2013 2014 2015 2016 2017 Sep-18
On Track To Add Another S$10 Billion In AUM By 2020
Total Assets Under Management
S$ billion
Earned S$167.2 Million In REITs/Fund Management Fees In YTD Sep 2018 Through5 REITs And 16 PE Funds
Capital Deployment Optimised Through REITs And Funds
Fund Business
85
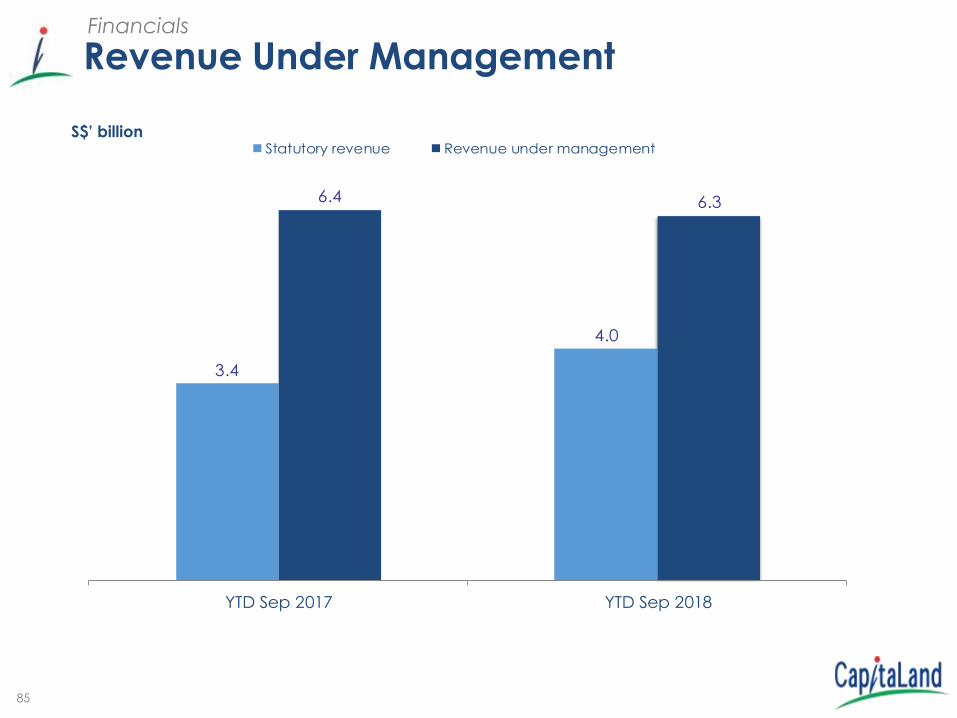
3.4
4.0
6.4 6.3
YTD Sep 2017 YTD Sep 2018
Statutory revenue Revenue under managementS$’ billion
Financials
Revenue Under Management

86
Group Managed Real Estate Assets1Financials
Note:1. Group Managed Real Estate Assets is the value of all real estate managed by CapitaLand Group entities stated at 100% of the
property carrying value2. Others include 100% value of properties under management contracts, franchise and corporate leasing
As at 30 Sep 2018
(S$ billion)
On balance sheet & JVs 19.7
Funds 21.0
REITs 30.8
Others2 21.3
Total 92.8
Group managed real estate assets

87
Financial Performance For 3Q 2018Financials
Healthy Operating PATMI Growth Underpinned By Newly Acquired / Opened Investment Properties In Singapore, China And Germany
S$' million 3Q 2017
(Restated)1
3Q 20182 Change
Revenue 1,515.7 1,260.0 -17%
EBIT 794.7 796.3 0%
PATMI 318.8 362.2 14%
Operating PATMI 206.3 233.7 13%
Portfolio Gains 79.7 27.4 -66%
Revaluation Gains3/ Impairments 32.8 101.1 >100%
Note:1. 3Q 2017 results restated to take into account the retrospective adjustments relating to SFRS(I)15 Revenue from Contracts with Customers
2. CapitaLand consolidated CMT, CRCT and RCST into the Group’s results with effect from August 2017. The consolidation increased the Group’s revenue and EBIT by approximately S$86.9 million and S$44.2 million for 3Q 2018 respectively. However, PATMI for YTD Sep 2018 were lower by $12 million due to
absence of the remeasurement gain arising from consolidation of the three trusts.3. Includes realised revaluation gains in respect of divestments of Westgate, Singapore recognised in 3Q 2018. Realised fair value gains for 3Q 2017 relate to
divestments of Golden Shoe Carpark, serviced residence component of Funan, Citadines Biyun, Shanghai and Citadines Gaoxin, Xi’an recognised in 3Q 2017.

88
EBIT By SBU – 3Q 2018Financials
Singapore And China Contribute 85% Of Total EBIT
S$' million Operating
EBIT
Portfolio
gains
Revaluation
gain/
impairments
Total
CL Singapore, Malaysia and Indonesia 310.8 - 132.3 443.1
CL China 227.7 32.8 (1.9) 258.6
CL Vietnam 12.2 0.3 1.2 13.7
CL International 87.4 - - 87.4
Corporate and others (6.5) - - (6.5)
Total 631.6 33.1 131.6 796.3
Note:1. Includes intercompany elimination
1

89
EBIT By SBU – YTD Sep 2018Financials
Singapore And China Contribute 87% Of Total EBIT
S$' million Operating
EBIT
Portfolio
gains
Revaluation
gain/
impairments
Total
CL Singapore, Malaysia and Indonesia 933.7 121.1 449.4 1,504.2
CL China 681.0 53.3 334.2 1,068.5
CL Vietnam 39.9 31.7 13.0 84.6
CL International 197.9 0.6 18.1 216.6
Corporate and others (6.0) - - (6.0)
Total 1,846.5 206.7 814.7 2,867.9
Note:1. Includes intercompany elimination
1

90
EBIT By Asset Class – 3Q 2018Financials
Investment Properties Contribute 86% Of Total EBIT
S$' million Operating
EBIT
Portfolio
gains
Revaluation
gain/
impairments
Total
Residential & commercial strata 119.8 (4.3) 0.1 115.6
Retail 313.6 36.7 129.7 480.0
Commercial 122.0 0.3 1.8 124.1
Lodging 78.5 0.4 - 78.9
Corporate and others (2.3) - - (2.3)
Total 631.6 33.1 131.6 796.3
1
Note:1. Includes intercompany eliminations and expenses at SBU corporates

91
EBIT By Asset Class – YTD Sep 2018Financials
Investment Properties Contribute 88% Of Total EBIT
S$' million Operating
EBIT
Portfolio
gains
Revaluation
gain/
impairments
Total
Residential & commercial strata 333.6 3.7 13.9 351.2
Retail 952.3 157.8 411.4 1,521.5
Commercial 388.5 31.6 367.3 787.4
Lodging 185.1 13.6 22.1 220.8
Corporate and others (13.0) - - (13.0)
Total 1,846.5 206.7 814.7 2,867.9
1
Note:1. Includes intercompany eliminations and expenses at SBU corporates

9292
Public Disclosure and External Assurance
1st Global Sustainability Report for FY2009, referencing Global Reporting Initiative (GRI) Framework
Entire report is externally assured since FY2010. Since FY2013, the entire report is externally assured to AA10000 Assurance Standard
Current report references GRI Standards, UN Sustainable Development Goals (SDG), International Integrated Reporting Council (IIRC) Framework, ISO 26000 and the Taskforce on Climate related Financial Disclosures (TCFD)
Signatory to the United Nations Global Compact (UNGC) and participates in the Carbon Disclosure Project (CDP)
Sustainability

93
Sustainability
FY 2017 Highlights