can financial work incentives pay for themselves? final results...
TRANSCRIPT

CAN FINANCIAL WORK INCENTIVES
PAY FOR THEMSELVES?
Final results from the Self-Sufficiency Project
for Welfare Applicants
Reuben Ford
David Gyarmati
Kelly Foley
Doug Tattrie
with Liza Jimenez
Social Research and Demonstration Corporation
Paper presented at
Welfare to Work: The Next Generation
A National Forum St. John’s NL
November 16 - 18, 2003

This paper presents final results from the Self-Sufficiency Project (SSP) study of welfare applicants.1 SSP was a Canadian research and demonstration project designed to test a policy innovation intended to make work pay better than welfare. Conceived and funded by Human Resources Development Canada (HRDC), managed by the Social Research and Demonstration Corporation (SRDC), and evaluated by the Manpower Demonstration Research Corporation (MDRC) and SRDC, SSP offered a temporary financial incentive to single parent, long-term income assistance (IA) recipients who left income assistance for full-time work.
The SSP Applicant study recruited single parents who were newly receiving income assistance (referred to in this paper as “Applicants”). These Applicants were told that if they stayed on income assistance for a full year they would become eligible for an earnings supplement. They would start to receive the SSP supplement if they then left income assistance for full-time work within the subsequent 12 months (i.e. their second year on income assistance). SSP offered a supplement paid on top of earnings from employment for up to three years, provided recipients worked 30 or more hours each week and remained off income assistance. The supplement was designed to provide an immediate payoff to those who found full-time employment because it could effectively double pre-tax income received from a minimum wage job. The accompanying text box describes the key features of the supplement offer.
To measure the effects of implementing a new policy, the SSP Applicant study used a rigorous random assignment research design. A sample of 3,315 single parents in British Columbia who had just begun to receive income assistance was drawn at random from provincial IA records. Half of the sample was randomly assigned to a program group who could potentially receive the supplement. The other half of the sample formed a control group that could not receive the supplement but who remained eligible to receive income assistance and any related services and incentives. To determine the effects of the supplement offer, the analysis compares outcomes for members of the program and control groups. Assignment to groups at random ensures that differences between the groups reflect only the effects of the supplement offer, and not participants’ preferences or personal characteristics.
This paper describes the impacts of the supplement offer through six years after random assignment. The key questions are whether the SSP program reduced IA receipt overall, whether it increased full-time employment earnings and income, how much it cost, and how these results compare to the SSP study of long-term welfare recipients (Michalopoulos et al., 2002), which offered the SSP supplement to a sample of Recipient families when they had been on income assistance for considerably longer than Applicants.
1 The results are available in more detail in Ford et al. (2003).

THE FINDINGS IN BRIEF Because the evaluation of SSP assigned people to the program and control groups at
random, the impact or effect of the supplement offer is measured as the difference in employment, earnings, income, and other outcomes between the two groups. These comparisons indicate that SSP increased full-time employment, earnings, and income and reduced poverty through at least three years following each person’s date of random assignment.
Key Features of the Earnings Supplement for Applicants
• Full-time work requirement. Supplement payments were made only to eligible single parents who worked full time (an average of at least 30 hours per week over a four-week or monthly accounting period, whether in one or more jobs) and who were not receiving income assistance.
• Substantial financial incentive. The supplement was calculated as half the difference between a participant’s earnings from employment and an “earnings benchmark” set by SSP at a level designed to make full-time work pay better than income assistance for most IA recipients. During 1994 the benchmark was $37,500 in British Columbia. The benchmark was adjusted over time to reflect changes in the cost of living and generosity of income assistance, and was $37,625 in 1996. The supplement was reduced by 50¢ for every dollar of increased earnings. Unearned income (such as child support), earnings of other family members, and number of children did not affect the amount of the supplement.
• Targeted at long-term recipients. Eligibility for the supplement was limited to single parent, long-term IA recipients (with at least one year of IA receipt). As a result, Applicants were told that they had to stay on income assistance for the first year after entering the study to establish eligibility for the supplement.
• One year to take advantage of the offer. If an Applicant became eligible to receive the supplement at the end of the first year, she* could sign up for the supplement if she found full-time work within the next 12 months (in other words, in the second year). If she did not sign up within 12 months, she could never receive the supplement.
• Three-year time limit on supplement receipt. A person could collect the supplement for up to three calendar years from the time she began receiving it, as long as she was working full time and not receiving income assistance.
• Voluntary alternative to welfare. People could not receive IA payments while receiving the supplement. No one was required to participate in the supplement program, however. After beginning supplement receipt, people could decide at any time to return to income assistance, as long as they gave up supplement receipt and met the eligibility requirements for income assistance. They could also renew their supplement receipt by going back to work full time at any point during the three-year period in which they were eligible to receive the supplement.
__________________________________________ *Feminine pronouns are sometimes used in this paper because more than 90 per cent of single parents
who have received income assistance for at least a year — the target group for SSP — are women.

• Fifty-eight per cent of program group members became eligible for the supplement by remaining on income assistance for a year or more. Twenty-seven per cent of the program group — nearly half of those who became eligible — took up the supplement. Diverse subgroups of program group members were about equally likely to find full-time work in time to receive supplement payments. On average, supplement “takers” received nearly $20,000 in supplement payments. Half the takers received benefits in 29 or more months during their three years of eligibility.
• SSP increased full-time employment and reduced IA receipt for five years. During the first year after random assignment, when program group members had to remain on income assistance to qualify, SSP increased IA receipt by 3.9 percentage points but had no net effect on full-time employment or IA amounts. From the second year onwards, SSP significantly reduced IA receipt and IA payments through to the sixth year of follow-up, while simultaneously increasing full-time employment in each of those years. The impacts were largest in Year 3, when SSP reduced IA receipt by 10.3 percentage points and increased full-time employment by 11.7 percentage points. However, the effects of SSP were not limited to the period that the supplement was available. Impacts on IA receipt and full-time employment persisted for five years. During the last of these years, no program group members received the supplement. For the most part, SSP’s impacts on IA payments in Year 3 and Year 6 were evenly distributed across different subgroups defined using participants’ characteristics at random assignment.
• SSP substantially increased earnings through to the sixth year of the follow-up period. SSP’s impacts on full-time employment translated into substantial gains in earnings for program group members. In the first 71 months after random assignment, on average, program group members each earned $7,859 more than control group members. In Year 3 average earnings for program group members had increased by $2,405 per year. These increases were concentrated among participants who were not working at random assignment.
• SSP increased income and reduced poverty throughout much of the follow-up period. Increased earnings led to significantly higher average incomes for program group members. As a result, SSP substantially reduced the incidence of poverty among families in the program group throughout the follow-up period. Some impacts on poverty were observed at the 72-month interview, well beyond the period of supplement eligibility. The rise in income led to an increase in total expenditures on basic necessities for food, clothing, and housing throughout much of the follow-up and a decrease in the proportion of program group members who reported using a food bank.
• SSP required a very low increase in net cost to government budgets. SSP resulted in substantial financial gains for Applicant program group members and their families throughout the six-year follow-up. These averaged $7,504 per program group member — net of increased taxes on earnings and reduced welfare benefits. The total cost of SSP, including supplement payments and operating costs, was nearly offset by increased tax revenue and decreased welfare benefits.

After accounting for all costs and benefits, there was a small net cost to the government budget of $660 — or $110 per year — per program group member over the full six-year follow-up period.
• SSP produced larger financial gains for welfare applicants than for long-term recipients, and was much more cost effective in doing so. The net financial benefit to Applicant program group members ($7,504) was about 50 per cent higher than that observed for SSP Recipients in British Columbia ($5,007).2 The net cost to government was about 10¢ per $1 in financial gains to program group members in the Applicant study. This was much lower than in the Recipient study, where the net cost to government was approximately 67¢ for $1 in financial gains. In turn, the net costs of the Recipient study are modest compared with other transfer programs.
• If SSP were implemented as a policy, it would be effective initially in reducing the current IA caseload and would be even more effective in the long run. The Recipient study simulated the effect of initiating a program like SSP and showed its effectiveness in the difficult task of reducing welfare receipt among a cross-section of long-term welfare recipients. The Applicant study simulated an ongoing program among clients who were just starting a welfare spell. The Applicant study showed that SSP was even more effective for this population. SSP increased earnings more for Applicants than Recipients while impacts on other economic outcomes like employment, hours of work, and poverty were similar between the studies. However, Applicants achieved these impacts while receiving less overall in supplement payments. As a consequence, the two studies suggest that the effectiveness of SSP would increase over time if it was operated as a program.
OVERVIEW OF SSP SSP studies were designed to inform policy-makers interested in the likely economic
consequences — in terms of employment, earnings, income, and receipt of income assistance — of offering a financial work incentive to long-term IA recipients. The studies were concerned with both the immediate and long-term consequences of implementing new policy. To achieve this, two separate large-scale SSP studies focused on different segments of the IA population — welfare applicants and long-term recipients — while a third, smaller study — called SSP Plus — assessed what would happen if the earnings supplement was augmented by employment services. All three studies used random assignment to assign IA recipients to program and control groups. Because only program group members were offered the SSP program, valid estimates of the impact of SSP over time can be obtained by analyzing the difference between outcomes for program group members and those for the control group.
To receive SSP’s earnings supplement, a program group member had to meet two eligibility requirements. First, she had to remain on income assistance for at least 12 out of
2To ensure comparability between the Applicant and Recipient studies, a small adjustment was made to the figure reported
for the BC Recipient sample in Michalopoulos et al. (2002).

13 consecutive months (the “qualifying year”). This requirement was intended to target SSP benefits on a disadvantaged population who normally experience difficulty in the labour market. At the same time, the requirement to remain on income assistance for a year substantially reduced the incentive for people to enter the IA system to receive the supplement. For IA recipients who stayed on income assistance for at least a year, the second requirement to receive the earnings supplement was then to leave income assistance for full-time employment. The restriction of the supplement to full-time work helped both to ensure that earnings made a substantial contribution to total family income and to reduce the possibility that income from the supplement would be used to cut back on work effort.
IA recipients who met both eligibility requirements could claim the earnings supplement and so became supplement “takers.” They received supplement payments for up to three years starting from the month they first began receiving the supplement, in every month that they worked 30 or more hours per week and remained off income assistance. The program allowed supplement takers to return to income assistance at any time if they met the normal eligibility requirements for income assistance. Takers who later left income assistance for full-time work could return to receiving the supplement at any time within their three-year window, but they could not receive income assistance and the supplement simultaneously.
RESEARCH DESIGN OF THE SSP APPLICANT STUDY Recruitment into the Applicant study began in February 1994 and was completed in
March 1995. Each month Statistics Canada used IA administrative records to identify all adult single parents in selected geographic areas of Lower Mainland British Columbia who were also Applicants. That is, they had to be single parents, 19 years of age or older, who had not received an IA payment in the last six months before the processed IA payment in the current month. Statistics Canada and the BC Ministry of Human Resources then sent letters to a randomly selected sample to invite them to be part of the SSP study. Members of the sample were informed that they had been selected to participate in a study of “options for people on income assistance.” They were told that 50 per cent of those who agreed to join the study would be randomly assigned into a program group that could become eligible to receive a cash supplement in addition to their earnings in 12 months’ time if they found full-time employment. The remainder would form a control group who would not become eligible for the supplement. Around 80 per cent agreed to take part and were interviewed for the baseline survey that recorded their personal characteristics.
Applicants who agreed to participate in the study and who completed a baseline interview were randomly divided into a program group (1,648 members) and a control group (1,667 members). Following random assignment, the program group received a letter and brochure from SRDC informing them that if they remained on income assistance for one year they would become eligible for the SSP supplement. A second letter, sent six to seven months after random assignment, reminded program group members of the supplement offer. Statistics Canada administered a 12-month follow-up survey to all Applicants. Following this survey, Applicant program group members who satisfied the SSP eligibility requirement were informed of their SSP program status by mail in the 12th or 13th month after receiving

their first IA cheque.3 Over 90 per cent of those deemed eligible subsequently attended an information session describing the program’s benefits and requirements. These “eligible Applicants” were given one year in which to find a full-time job, leave income assistance, and thus initiate SSP payments.
Follow-up interview surveys were undertaken approximately 12, 30, 48, and 72 months after random assignment. During the last interview, as in the Recipient study, parents were asked to complete questionnaires to assess the progress of their children. Due to sample attrition, not all of the original sample members completed the subsequent surveys. In this paper, the analysis is usually limited to the 2,371 participants who responded to the 72-month survey: 1,185 control group members and 1,186 program group members. These represented 72 per cent of the original study participants. Administrative records were used to estimate the impacts on IA and supplement receipt. In addition, two focus group interviews were conducted with Applicants who left income assistance within a year of recruitment, before they could take advantage of the SSP offer. A further two group interviews were undertaken with those who remained on income assistance long enough to qualify for the supplement. This paper provides results from the surveys, questionnaires, administrative records, and focus groups.
Baseline Characteristics of the Applicant Study Sample
Applicants were primarily female and nearly one third were immigrants. Almost two thirds of the sample had completed high school, of which just over one third had some additional post-secondary education. There were on average two children under 19 years of age per household. Data from administrative records suggest that participants spent an average of three months in receipt of income assistance in the two years prior to random assignment. Monthly payments of income assistance for participants in the month of recruitment averaged over $900.
The Policy and Economic Context for the Applicant Study
Applicants’ ability to respond to the supplement offer could have been affected by changes over time in the economic and policy environment affecting single parents on income assistance. For this study the relevant period was the mid to late 1990s. During this time, British Columbia independently made a variety of changes to its IA program — to the earnings disregard, benefit payments, sanctions, and application process. Economic conditions also changed: unemployment generally fell, employment of 25- to 44-year-old women in BC remained very stable, employment of younger women fell and then increased from 1998 to 2000, and the minimum wage increased in stages from $5.50 per hour in January 1993 to $7.60 in November 2000. The net effect of these changes is unclear. IA policy changes, reduced unemployment, and the rise in the minimum wage may have increased the attractiveness of work. On the other hand, conventional economic models suggest that raises in the minimum wage would lower demand for lower-skilled workers. One advantage of random assignment is that it limits the extent to which outside influences, such as changes in the policy and economic context, can bias the estimates of the impact of
3Applicants in the program group became eligible for SSP if they received income assistance for 11 of the 12 months
following the initial month of IA receipt. This required them to have spent at least 12 out of a total of 13 months on income assistance.

SSP. Because both program and control group members experienced changes in the economic and policy environment at the same time, the presence or absence of the SSP offer remains the key systematic difference between the research groups.
SUPPLEMENT TAKE-UP
• Fifty-eight per cent of program group members became eligible for the supplement by remaining on income assistance for a year or more. Twenty-seven per cent of the program group received at least one supplement payment.
The central feature of the Self-Sufficiency Project was the earnings supplement payment to program group members. In order to receive the supplement, Applicant program group members had to meet two conditions. They had to spend a year on income assistance to become eligible for the supplement and had to leave income assistance for full-time work within the following year.
More than 40 per cent of program group members left income assistance before becoming eligible for supplement payments. Those with low education levels and barriers to employment were more likely to become eligible than those who had completed high school or who reported no barriers to employment.
About half of the remaining eligible program group members found full-time work in time to receive supplement payments. Most of remaining eligible program group members said that they were interested in SSP but could not find enough work to take up the supplement.
Twenty-seven per cent of the program group took up the supplement. Diverse subgroups of program group members were about equally likely to receive at least one supplement payment.
• Supplement takers usually received generous, virtually uninterrupted benefits over several years.
On average, takers received nearly $20,000 in supplement payments. Half of supplement takers received benefits in 29 months or more during the three-year period for supplement payments. Most often, they received the monthly payments in a single consecutive spell or in two spells with a single break. Only 16 per cent of takers had more than one temporary interruption of supplement payments. Thus, most takers received years of generous, virtually uninterrupted supplement benefits.
SSP gave the most generous benefits to takers who worked the most months full time and to takers who earned the least while they worked. Therefore, SSP was successful in directing most of its benefits to those who left welfare for steady, full-time work. It was also successful in helping to “make work pay” by directing most of its benefits to those with low labour market earnings.
There was considerable concern at the outset of SSP that when supplement payments came to an end after three years, participants might leave full-time employment and return to income assistance, potentially increasing poverty for themselves and their families.

However, there was no noticeable change in the full-time employment rates or the IA receipt rates of supplement takers after their three-year window came to an end.
IMPACTS ON INCOME ASSISTANCE, EMPLOYMENT, AND EARNINGS
• SSP reduced IA receipt and increased full-time employment for five years.
Welfare applicants often require income support for relatively brief periods before they can make successful transitions from income assistance back to self-sufficiency. Although IA applicants would thus be expected to leave income assistance over time, SSP might have helped to accelerate this transition if Applicants left income assistance and took up full-time work sooner than they might have in the absence of the program.
Figure ES.1 shows the proportion of program and control group members in receipt of income assistance over six and a half years following random assignment. The dotted line indicates the difference between these proportions, or the impact, of the supplement offer. Both groups left income assistance quite rapidly initially, and continued to leave income assistance throughout the study period. However, during the first year after random assignment, the incentive to remain on income assistance in order to become eligible for the SSP supplement led to slightly higher IA receipt among program group members compared with control group members. From the second year onwards, SSP significantly reduced IA receipt and IA payments through to the sixth year of follow-up.
SSP’s impacts were largest in Year 3, when SSP reduced IA receipt by 10.3 percentage points and increased full-time employment by 11.7 percentage points. Importantly, SSP’s impacts on IA payments in Year 3 and Year 6 were evenly distributed among members of subgroups defined by participants’ characteristics at random assignment. This implies that SSP was equally effective in helping to reduce the reliance on income assistance of different groups of welfare applicants.
The first panel of Table 1 presents average monthly full-time employment rates for the same groups. These show that SSP had no significant impact on full-time employment over the first year, but increased full-time employment in every subsequent year. It was possible that SSP could have discouraged full-time employment among program group members because members of the program group had to remain on income assistance for at least a year in order to qualify for the supplement. The table suggests that this undesired effect did not occur. Program group members were as likely to work full time as control group members in the first year of the follow-up.
In the following five years SSP had the intended effect on full-time employment — program group members were far more likely to be working full time than their control group counterparts. Year 2 was the first year that program group members could receive the supplement if they left income assistance and took up full-time work. In this year SSP increased full-time employment by 7.7 percentage points. The impact rose in the third year to 11.7 percentage points. In years 4 through 6, the impact on full-time employment fell but remained statistically significant. During the last of these years, no program group members received the supplement.


Fig
ure
1:
Per
cen
tag
e R
ecei
vin
g In
com
e A
ssis
tan
ce, b
y M
on
ths
Fro
m R
and
om
Ass
ign
men
t, in
th
e S
SP
Ap
plic
ant
Stu
dy
-20020406080100
13
57
911
1315
1719
2123
2527
2931
3335
3739
4143
4547
4951
5355
5759
6163
6567
6971
7375
7779
Pro
gram
Gro
up
Con
trol
Gro
up
Impa
ct
Percentage Receiving IA
Mon
ths
Fro
m R
ando
m A
ssig
nmen
t
Sour
ce:
Cal
cula
tion
s fr
om I
A a
dmin
istr
ativ
e re
cord
s.
ES-9

Table 1: SSP Impacts on Employment and Earnings
Outcome Program
Group Control Group
Difference (Impact)
Standard Error
Monthly full-time employment ratea (%) Year 1 20.7 19.3 1.4 (1.4) Year 2 32.6 24.9 7.7*** (1.6) Year 3 42.8 31.1 11.7*** (1.8) Year 4 45.3 35.7 9.6*** (1.8) Year 5 45.1 39.4 5.8*** (1.9) Year 6 47.4 42.5 4.9*** (1.9) Monthly part-time employment rate (%) Year 1 13.7 13.7 -0.1 (1.2) Year 2 14.4 13.9 0.5 (1.2) Year 3 12.4 13.9 -1.5 (1.2) Year 4 11.5 14.7 -3.2*** (1.2) Year 5 12.3 14.6 -2.3* (1.3) Year 6 13.6 15.8 -2.2* (1.3) Monthly employment rate (%) Year 1 34.4 33.0 1.4 (1.6) Year 2 47.1 38.9 8.2*** (1.8) Year 3 55.1 44.9 10.2*** (1.8) Year 4 56.8 50.4 6.4*** (1.8) Year 5 57.4 54.0 3.5* (1.9) Year 6 60.9 58.3 2.6 (1.8) Average earnings ($) Year 1 4,805 4,884 -79 (375) Year 2 7,894 6,489 1,405*** (448) Year 3 10,571 8,166 2,405*** (498) Year 4 11,602 9,776 1,825*** (550) Year 5 12,591 11,241 1,350** (610) Year 6 14,033 12,727 1,305** (647) Sample size (total = 2,371) 1,186 1,185 Sources: Calculations from 12-month, 30-month, 48-month, and 72-month follow-up survey data. Notes: The estimates for each year are calculated by averaging the four quarterly estimates.
Sample sizes vary for individual measures because of missing values. Two-tailed t-tests were applied to differences between the outcomes for the program and control groups. Statistical significance levels are indicated as * = 10 per cent; ** = 5 per cent; *** = 1 per cent.
Rounding may cause slight discrepancies in sums and differences. a“Full-time employment” is defined as working 30 or more hours in at least one week during the month.
The second panel of Table 1 suggests that little of the impact on full-time employment was caused by a shift from part-time to full-time employment. In the third through sixth year of follow-up, SSP reduced part-time work in the range of one to three percentage points. These small impacts on part-time employment imply that the increase in full-time employment results primarily from people newly working full time because of the supplement who would not have worked at all in its absence.

• SSP caused program group members to earn more through the fifth year of the follow-up period.
SSP’s impacts on full-time employment translated into substantial gains in earnings for program group members. In Year 3 average earnings for program group members had increased by $2,405 per year (see Table 1). However, impacts on earnings differed for participants who were working at random assignment. In Year 3, SSP increased earnings only among those participants who were not working at random assignment. After the supplement was no longer available in Year 6, program group members who were working full time at random assignment earned less on average than their counterparts in the control group. SSP was most effective in raising earnings for those who were not combining full-time employment and IA receipt at random assignment.
• SSP encouraged stable, full-time employment of relatively long durations in jobs with wage growth.
SSP significantly increased the proportion of participants who had full-time employment spells that lasted at least three years, but had little impact on less stable employment. Similarly, SSP increased the employment of program group members who had a single full-time employment spell, but had a much smaller impact on the proportion of workers with two or more spells of paid employment. SSP increased the proportion of program group members who worked full time at the end of the second and sixth year after random assignment and experienced wage growth of 20 per cent or more.
• Over the entire follow-up, SSP significantly and substantially increased earnings while reducing IA payments.
SSP’s large and sustained impacts on full-time employment and IA receipt led to considerable impacts on earnings and reductions in IA payments. In the first 71 months after random assignment program group members each earned $7,859 more on average than control group members. Their average IA payments were also $3,362 lower during the same period.
IMPACTS ON INCOME, EXPENDITURES, POVERTY, AND HARDSHIP
• SSP significantly increased the income and reduced transfer receipt among Applicant program group members and their families throughout much of the follow-up period.
Although increasing employment and reducing welfare dependence were primary goals of SSP, equally important were reducing poverty and improving the overall economic circumstances of IA recipients. The first panel of Table 2 provides estimates of individual income by source for the six-month period preceding each key survey interview. SSP encouraged higher earnings through the provision of generous earnings supplements. Thus, even though IA payments were reduced and income taxes increased, the final panel reveals that SSP led to significantly higher average incomes for program group members. SSP increased individual and family income in the six-month periods preceding the 30-month interview and the 48-month interview, during the time that supplement payments were being received. SSP also led to a prolonged though smaller impact on earnings in the six months prior to the 72-

month interview, even though supplement eligibility had ended. This impact was statistically significant but only at the 10 per cent level.
Table 2: SSP Impacts on Monthly Income and Net Transfer Payments in the Six Months Prior to the 30-Month, 48-Month, and 72-Month Follow-Up Interviews
30-Month Interview 48-Month Interview 72-Month Interview
Outcome Control Group
Differencea
(Impact) Control Group
Differencea
(Impact) Control Group
Differencea
(Impact)
Sources of individual income ($/month) Earnings 645 205*** 889 129** 1,116 106* SSP supplement payments 0 167*** 0 136*** 0 0 IA payments 434 -111*** 270 -67*** 180 -27** Other transfer paymentsb 266 -7 328 -16 328 -2 Other unearned incomec 151 -13 166 -18 184 4 Projected taxes and net transfers ($/month) Projected income taxesd 126 72*** 191 49*** 247 36** Net transfer paymentse 597 -28 427 3 277 -65** Total monthly individual and family income Individual income ($) 1,515 229*** 1,677 162*** 1,832 89 Individual income net of taxes ($) 1,389 157*** 1,486 112*** 1,585 52 Family income ($)f 1,753 271*** 2,068 243*** 2,349 191** Income below LICO (%)g 78.4 -14.4*** 66.7 -6.3** 63.1 -1.8
Below 50% of LICO 20.6 -0.6 21.4 -0.4 25.3 0.9 50 to less than 75% of LICO 40.1 -11.7*** 29.8 -5.0** 25.7 -5.5** 75 to less than 100% of LICO 17.3 -2.0 15.5 -0.9 12.1 2.8
Income above LICO (%)g 22.0 14.4*** 33.3 6.3** 36.9 1.8 100 to less than 150 % of LICO 15.7 8.7*** 19.6 4.1* 19.5 -0.8 150 to less than 175% of LICO 2.9 3.4*** 5.7 -0.4 6.5 -0.8 175 to less than 200% of LICO 1.2 0.8 2.8 1.1 3.2 1.0
200% of LICO or more 2.2 1.5* 5.2 1.4 7.7 2.3 Sample size 1,185 2,371 1,185 2,371 1,185 2,371 Sources: Calculations from the 30-month, 48-month, and 72-month survey data, IA administrative records, and payment records from SSP’s
Program Management Information System.
Notes: Sample sizes vary for individual measures because of missing values. This may cause slight discrepancies in sums and differences. All analyses were only for those who responded to the 72-month survey. Two-tailed t-tests were applied to differences in outcomes between the program and control groups. Statistical significance levels are indicated as * = 10 per cent; ** = 5 per cent; *** = 1 per cent.
Rounding may cause slight discrepancies in sums and differences. aThe sample size in this column is the sum of the program and control group sizes. bIncludes the Child Tax Benefit, the Goods and Services Tax Credit, EI, provincial tax credits, and, for the 48- and 72-month sample only, the BC Family Bonus.
cIncludes alimony, child support, income from roomers and boarders, and other reported income. dIncludes projected EI premiums and CPP premiums deducted at payroll and projected income taxes. Payroll deductions and income taxes were projected from federal and provincial tax schedules and data on earned and unearned income and SSP supplement payments; the actual taxes paid by sample members may differ from these projections.
eIncludes public expenditures on SSP, IA payments, and other transfers, net of income tax revenue. fFamily income is measured as the sum of the sample member’s income and the labour earnings of any other members in that person’s family.
gCalculated by comparing annualized family income with the low income cut-off (LICO) defined by Statistics Canada for the sample member’s location and family size.
The middle panel of Table 2 presents the impacts of SSP on taxes and net transfer payments. Projected taxes include both federal and provincial income taxes as well as

Employment Insurance (EI) and Canada Pension Plan premiums (CPP). Transfer payments include the SSP supplement, IA payments, and other federal and provincial transfers (e.g. EI benefits, GST credit, Child Tax Benefit and associated supplements, and other provincial tax credits). “Net transfer payments” thus refers to the difference between the total amount spent by both levels of government on transfers, including the SSP supplement, and revenues received through increased income and payroll taxes.
In the six months prior to both the 30- and 48-month interviews, during which supplement eligibility and payments continued, the SSP supplement paid for itself through reductions in IA payments and increased tax revenues. Net transfer payments did not differ significantly from zero. At the 72-month interview, eligibility for the supplement had ended for all participants and no longer represented a cost for government. Furthermore, the sustained earnings gains for program group members at 72 months resulted in positive impacts on income taxes, which although lower than earlier in the follow-up, were still statistically significant. SSP also led to a prolonged reduction in IA receipt, which along with impacts on income taxes, resulted in a decrease in net transfers that was statistically significant at the 72-month interview.
• SSP significantly reduced poverty among Applicant program group members throughout the follow-up period. SSP also increased expenditures and reduced the use of food banks.
Increases in net family income meant that SSP substantially reduced the incidence of poverty among families in the program group throughout the follow-up period. The last panel of Table 2 presents the proportion of sample members with income below Statistics Canada’s low income cut-offs (LICOs)4 in the six months before each interview. SSP led to significant reductions in proportions with income below LICOs throughout much of the follow-up period. In the six months prior to the 30-month interview, when supplement receipt was at its highest, SSP reduced the proportion of families with incomes below the LICOs by 14.4 percentage points. At 48 months SSP reduced the proportion with incomes below the LICOs by 6.3 percentage points. In the six months prior to the 72-month interview, up to six years after random assignment, SSP did not reduce the proportion with incomes below 100 per cent of LICOs. However, the “severity” of poverty was reduced as the proportion with incomes at 50 to 75 per cent of LICOs decreased while the proportion at 75 to 100 per cent of LICOs increased.
The rise in income also led to an increase in total expenditures on basic necessities for food, clothing, and housing throughout much of the follow-up. When considered in aggregate, total expenditures on rent, groceries, dining out, clothing, and child care were higher for program than control group members at all three follow-up interviews. At the 30- and 48-month interviews there was an impact of approximately $65 on these monthly expenditures. Even at the 72-month interview, long after supplement payments had ended, there was an ongoing impact of $52 per month.
4This was calculated by comparing annualized family income with the low income cut-offs (LICOs) for each family as
defined by Statistics Canada. The LICOs are relative measures of disadvantage or inequality, and should not be interpreted as a strict measure of poverty.

At the 30-month interview, SSP reduced the proportion of program group members who reported using a food bank by three percentage points relative to the control group. SSP appears to have had little effect on housing mobility, neighbourhood quality, or housing arrangements, including the extent of home ownership, renting, the use of group shelters, or other housing arrangements.
SSP led to increased income and reduced poverty for many Applicants with a wide range of characteristics in the program group. However, sample members’ baseline characteristics, such as job readiness, employment status, and family background, accounted for some differences in subgroup impacts. Impacts on income were smaller at various points in the follow-up for those without a high school diploma and those who were already employed at baseline, while potentially disadvantaged subgroups, such as immigrants, experienced little income gain or poverty reduction from SSP.
BENEFITS AND COSTS OF SSP SSP increased employment and earnings of Applicant program group members while
reducing their reliance on income assistance. SSP also led to significant improvements in overall economic well-being and reductions in poverty throughout much of the follow-up period. Table 2 suggests that these impacts were achieved with no net increase in public transfer payments. This suggests that the supplement offer to Applicants may have paid for itself through higher taxes on earnings and reductions in IA payments that were generated by the program. However, analyses of taxes and net transfers in Table 2 were limited to six-month periods in advance of each follow-up interview, and considered only the costs associated with the transfer payments themselves. The benefit-cost analysis expanded considerably on these analyses by comparing a more complete set of benefits and costs of the SSP supplement and program delivery to Applicants over the full six-years of follow-up.
Nonetheless, not all additional benefits and costs can be accounted for in this analysis. While this analysis takes into account the costs of various components of SSP, including the supplement payments and operating expenses for the delivery of program services to applicants, the operating costs reflect those incurred in the SSP demonstration. Such expenditures could differ if SSP were operated as an ongoing earnings supplement program.
Moreover, the analysis did not attempt to place a value on any non-financial benefit from improved outcomes for children or the cost of lost personal and family time as a result of increased employment. Results must be considered only an approximation of SSP’s full effects. And the precision of the estimates must be treated with caution, especially when attempting to generalize to “real world” implementation for different populations, locations, or time periods.
Since costs from one perspective may be benefits from another, the analysis presents benefits and costs from three different perspectives. It considers the net financial benefits or costs from the perspective of individual program group members, from a government budget standpoint (including federal and provincial government shares), and from the perspective of society as a whole.
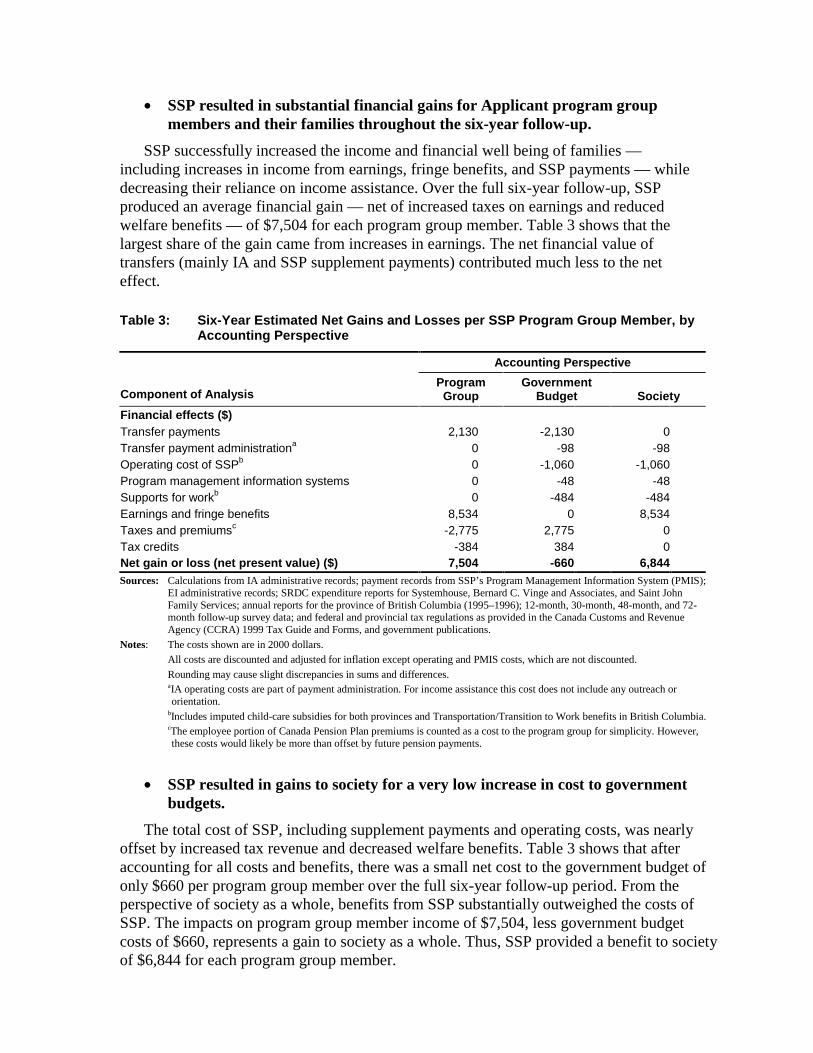
• SSP resulted in substantial financial gains for Applicant program group members and their families throughout the six-year follow-up.
SSP successfully increased the income and financial well being of families — including increases in income from earnings, fringe benefits, and SSP payments — while decreasing their reliance on income assistance. Over the full six-year follow-up, SSP produced an average financial gain — net of increased taxes on earnings and reduced welfare benefits — of $7,504 for each program group member. Table 3 shows that the largest share of the gain came from increases in earnings. The net financial value of transfers (mainly IA and SSP supplement payments) contributed much less to the net effect.
Table 3: Six-Year Estimated Net Gains and Losses per SSP Program Group Member, by Accounting Perspective
Accounting Perspective
Component of Analysis Program
Group Government
Budget Society
Financial effects ($) Transfer payments 2,130 -2,130 0Transfer payment administrationa 0 -98 -98Operating cost of SSPb 0 -1,060 -1,060Program management information systems 0 -48 -48Supports for workb 0 -484 -484Earnings and fringe benefits 8,534 0 8,534Taxes and premiumsc -2,775 2,775 0 Tax credits -384 384 0Net gain or loss (net present value) ($) 7,504 -660 6,844 Sources: Calculations from IA administrative records; payment records from SSP’s Program Management Information System (PMIS);
EI administrative records; SRDC expenditure reports for Systemhouse, Bernard C. Vinge and Associates, and Saint John Family Services; annual reports for the province of British Columbia (1995–1996); 12-month, 30-month, 48-month, and 72-month follow-up survey data; and federal and provincial tax regulations as provided in the Canada Customs and Revenue Agency (CCRA) 1999 Tax Guide and Forms, and government publications.
Notes: The costs shown are in 2000 dollars. All costs are discounted and adjusted for inflation except operating and PMIS costs, which are not discounted.
Rounding may cause slight discrepancies in sums and differences. aIA operating costs are part of payment administration. For income assistance this cost does not include any outreach or orientation.
bIncludes imputed child-care subsidies for both provinces and Transportation/Transition to Work benefits in British Columbia. cThe employee portion of Canada Pension Plan premiums is counted as a cost to the program group for simplicity. However, these costs would likely be more than offset by future pension payments.
• SSP resulted in gains to society for a very low increase in cost to government budgets.
The total cost of SSP, including supplement payments and operating costs, was nearly offset by increased tax revenue and decreased welfare benefits. Table 3 shows that after accounting for all costs and benefits, there was a small net cost to the government budget of only $660 per program group member over the full six-year follow-up period. From the perspective of society as a whole, benefits from SSP substantially outweighed the costs of SSP. The impacts on program group member income of $7,504, less government budget costs of $660, represents a gain to society as a whole. Thus, SSP provided a benefit to society of $6,844 for each program group member.

This suggests that SSP represents an efficient way to transfer income to welfare applicants when compared with other transfer programs. Some estimates suggest that transfer programs may require $1.50 in government expenditure for each $1 in financial gains to families.5 In comparison, the financial gains to SSP Applicants and their families were achieved with virtually no net increase in costs to the government budget. For each $1 in financial gains to families the cost to the government budget was about 10¢.
Government costs and benefits are shared between federal and provincial governments. The financial implications of operating SSP can be estimated for each government’s budget separately. The perspective of the federal government does not include any costs or benefits associated with SSP supplement payments, IA benefits, or the operating costs of the program. Although the federal government funded the SSP demonstration, it is assumed that the provincial government would pay for the operation of SSP in a province as part of its social assistance program. The federal government perspective does not account for transfers to the provincial governments such as the Canadian Health and Social Transfer (CHST). Similarly, the perspective of the provincial government does not include any financial gains from federal government transfers to the provinces. When costs and benefits were divided in this way, the federal government budget experienced a net financial gain of $2,265 per program group member over the six-year follow-up period. This gain was primarily from increased income taxes and decreased tax credits for program group members. The provincial government experienced increased costs as a result of SSP of $2,925 per program group member. This loss was due mainly to higher transfer payments for the program group ($2,031) and the operating costs of the program ($1,060), although increases in provincial taxes ($757) offset these costs to some degree.
• SSP led to significantly larger financial gains for welfare applicants than for recipients and was much more cost-effective in doing so.
The net financial benefit to Applicant program group members ($7,504) was nearly 50 per cent higher than that observed for SSP Recipients in British Columbia ($5,007).6 For every $1 in financial gains to program group members in the Recipient study, the net cost to government was approximately 67¢. While modest compared with other transfer programs, this was still much higher than in the Applicant study.
COMPARING SSP FOR APPLICANTS AND FOR RECIPIENTS
• The results from the Applicant and Recipient studies together enable policy-makers to determine what might change over time as a new program is introduced.
SSP studies were designed to find out what would happen following the introduction of a program offering earnings supplements to single parent, long-term welfare recipients. Initially, the existing stock of long-term welfare recipients would be eligible. The Recipient study offered the supplement to a sample drawn from long-term welfare recipients, who
5See Burtless, 1987, 1994, for a discussion of the efficiency of transfer programs. 6To ensure comparability between the two studies, a small adjustment was made to the figure reported in Michalopoulos et
al. (2002).

would not necessarily know in advance that such a program would be introduced. However, as the program matured, all existing long-term recipients would have received the supplement offer, leaving eligible for the supplement only those entering long-term welfare receipt. Furthermore, these entrants into long-term receipt would know — in advance — that SSP would be an option for them if they stayed on income assistance. The Applicant study sampled from the population newly receiving welfare: people who had the potential to become long-term recipients. They were told that the supplement would be available to them only if they became long-term welfare recipients — by remaining on income assistance for a year. The Recipient study thus tested what would happen as an SSP-type program was introduced, and the Applicant study tested what would happen as the program reached an operational steady state.
• SSP increased earnings more for Applicants than Recipients, using fewer supplement dollars.
Table 4 presents selected economic impacts of SSP for both studies, observed during four and a half years following determination of eligibility for the supplement. This was the 54-month period immediately following random assignment for Recipients, but corresponded to months 13 through 66 following random assignment for Applicants. SSP produced a substantial earnings gain for Applicants over the period, $4,300 more than the earnings gain for Recipients. Impacts on economic outcomes like employment, hours of work, and poverty were similar between the studies, although Applicants achieved these impacts while receiving less overall in supplement payments.
Following completion of the qualifying year, the behavioural impact of the supplement offer on Applicants was likely concentrated among those still eligible to take it up. Thus impacts per eligible program group member provide an alternative and perhaps intuitively more logical basis for comparing how people who have just become long-term IA recipients respond to the availability of a supplement differently from the population of all long-term recipients.
In columns 4 through 6 of Table 4, impacts per eligible program group member in the two studies are compared. For the Recipients, the impacts per eligible program member are the same as impacts for the entire Recipient sample because 100 per cent of program group members in the Recipient study were eligible for the supplement at random assignment. In the Applicant study, only 58.3 per cent of Applicant program group members were eligible for the SSP supplement and, therefore, estimates of impacts per eligible program group member are obtained by dividing full sample impacts by 0.583.
Impacts on employment, hours, and earnings per eligible Applicant program group member were significantly higher than for Recipients, and IA receipt and amounts were generally lower. Average supplement payments per eligible Applicant exceeded those for Recipients. Thus it would seem that single parents who had spent just one year on welfare were much better able to take advantage of the supplement offer than longer-term welfare recipients.

Tab
le 4
: C
om
par
iso
ns
of
Pro
gra
m Im
pac
ts o
n E
mp
loym
ent,
Tra
nsf
er P
aym
ents
, an
d In
com
e B
etw
een
Ap
plic
ant
and
Rec
ipie
nt
Stu
die
s
Ap
plic
ants
vs.
Rec
ipie
nts
E
ligib
le A
pp
lican
ts v
s. R
ecip
ien
ts
Ou
tco
me
Imp
act
per
A
pp
lican
t
(1)
Imp
act
per
R
ecip
ien
t (2
)
Dif
fere
nce
(3
)
Imp
act
per
Elig
ible
A
pp
lican
t a
(4)
Imp
act
per
R
ecip
ien
t
(5)
Dif
fere
nce
(6
) T
ota
l ove
r 54
mo
nth
s fo
llow
ing
su
pp
lem
ent
elig
ibili
ty
M
onth
s of
em
ploy
men
tb 3.
6**
* 2.
6**
* 1.
06.
2**
* 2.
6**
* 3.
6**
* M
onth
s of
full-
time
empl
oym
ent
4.5
***
3.4
***
1.1
7.7
***
3.4
***
4.3
***
Mon
ths
of IA
rec
eipt
-3
.5**
* -2
.9**
* -0
.6-6
.0**
* -2
.9**
* -3
.1**
C
um
ula
tive
to
tal o
ver
54 m
on
ths
follo
win
g s
up
ple
men
t el
igib
ility
Hou
rs w
orke
d 65
6**
* 49
9**
* 15
71,
126
***
499
***
626
***
Ear
ning
s ($
) 7,
370
***
3,07
0**
* 4,
299
**
12,6
50**
* 3,
070
***
9,57
9**
* IA
pay
men
ts (
$)
-3,4
54**
* -2
,835
***
-619
-5
,929
***
-2,8
35**
* -3
,094
**
SS
P p
aym
ents
($)
5,
362
***
6,08
3**
* -7
21*
9,20
3**
* 6,
083
***
3,12
1**
* IA
and
SS
P p
aym
ents
($)
1,
908
**
3,24
8**
* -1
,340
3,
274
**
3,24
8**
* 27
Inco
me
and
net
tra
nsf
ers
in s
ix m
on
ths
pri
or
to t
he
36-m
on
th
inte
rvie
w (
Rec
ipie
nts
) o
r 48
-mo
nth
inte
rvie
w (
Ap
plic
ants
)
M
onth
ly in
com
e ta
x ($
)c 43
***
29**
* 14
74**
* 29
***
45**
* M
onth
ly n
et tr
ansf
ers
($)d
3
45*
-42
5
45*
-40
Mon
thly
net
indi
vidu
al in
com
e ($
)e 11
2**
* 83
***
2919
2**
* 83
***
109
**
Inco
me
belo
w th
e lo
w in
com
e cu
t-of
f (%
)f -6
.3**
-6
.2**
* 0.
1-1
0.8
**
-6.2
***
-4.6
Sam
ple
siz
e 2,
371
2,53
8
2,
371
2,
538
Sour
ce:
Cal
cula
tion
s fr
om A
pplic
ant 1
2-m
onth
, 30-
mon
th, 4
8-m
onth
, 72-
mon
th, a
nd R
ecip
ient
18-
mon
th, 3
6-m
onth
and
54-
mon
th f
ollo
w-u
p su
rvey
dat
a, I
A a
dmin
istr
ativ
e re
cord
s an
d pa
ymen
t rec
ords
fr
om S
SP’s
Pro
gram
Man
agem
ent I
nfor
mat
ion
Syst
em.
Not
es:
Tw
o-ta
iled
t-te
sts
wer
e ap
plie
d to
dif
fere
nces
bet
wee
n th
e ou
tcom
es f
or th
e pr
ogra
m a
nd c
ontr
ol g
roup
s.
A Q
-sta
tist
ic w
as u
sed
to te
st f
or d
iffe
renc
es in
impa
cts
esti
mat
es.
Stat
istic
al s
igni
fica
nce
leve
ls a
re in
dica
ted
as *
= 1
0 pe
r ce
nt; *
* =
5 pe
r ce
nt; *
** =
1 p
er c
ent.
Rou
ndin
g m
ay c
ause
slig
ht d
iscr
epan
cies
in s
ums
and
diff
eren
ces.
“Rec
ipie
nts”
are
Bri
tish
Col
umbi
a sa
mpl
e m
embe
rs f
rom
the
Rec
ipie
nt s
tudy
who
res
pond
ed to
the
54-m
onth
sur
vey.
a “I
mpa
ct p
er e
ligib
le A
pplic
ant”
is th
e im
pact
for
App
lican
ts d
ivid
ed b
y th
e SS
P el
igib
ility
rat
e am
ong
prog
ram
gro
up m
embe
rs (
0.58
3).
b Full-
tim
e em
ploy
men
t is
defi
ned
as w
orki
ng 3
0 ho
urs
or m
ore
in a
t lea
st o
ne w
eek
duri
ng th
e m
onth
. c In
clud
es p
roje
cted
EI p
rem
ium
s an
d C
PP p
rem
ium
s de
duct
ed a
t pay
roll
and
proj
ecte
d in
com
e ta
xes.
Pay
roll
dedu
ctio
ns a
nd in
com
e ta
xes
wer
e pr
ojec
ted
from
fed
eral
and
pro
vinc
ial t
ax s
ched
ules
an
d da
ta o
n ea
rned
and
une
arne
d in
com
e an
d SS
P su
pple
men
t pay
men
ts; t
he a
ctua
l tax
es p
aid
by s
ampl
e m
embe
rs m
ay d
iffe
r fr
om th
ese
proj
ectio
ns.
d Ave
rage
mon
thly
pub
lic e
xpen
ditu
res
on S
SP, I
A p
aym
ents
, and
oth
er tr
ansf
ers
(Chi
ld T
ax B
enef
it, G
oods
and
Ser
vice
s T
ax C
redi
t, E
I ben
efit
, and
pro
vinc
ial t
ax c
redi
ts),
net
of
proj
ecte
d ta
x re
venu
e.
e Net
indi
vidu
al in
com
e in
clud
es e
arni
ngs,
inco
me
assi
stan
ce, a
nd S
SP p
aym
ents
, as
wel
l as
all o
ther
sou
rces
of
indi
vidu
al c
ash
inco
me
(alim
ony
and
child
sup
port
, Chi
ld T
ax B
enef
it, t
he G
oods
and
Se
rvic
es T
ax C
redi
t, E
I, pr
ovin
cial
tax
cred
its,
the
BC
Fam
ily B
onus
, inc
ome
from
roo
mer
s an
d bo
arde
rs, a
nd o
ther
rep
orte
d in
com
e).
f Cal
cula
ted
by c
ompa
ring
ann
ualiz
ed f
amily
inco
me
(ind
ivid
ual p
re-t
ax in
com
e pl
us e
arni
ngs
of o
ther
fam
ily m
embe
rs)
wit
h th
e lo
w in
com
e cu
t-of
f de
fine
d by
Sta
tist
ics
Can
ada
for
the
sam
ple
mem
ber’
s lo
cati
on a
nd f
amily
siz
e.
ES-18


• Differences in the characteristics of Applicants and Recipients likely accounted for SSP being more effective for Applicants, although differences in the timing of the studies and in the design of the program may have played a part.
Applicants may have been better able to take advantage of the SSP offer because they had characteristics associated with a stronger position in the labour market than recipients. They were better educated, more had recent work experience, and fewer reported physical and mental health problems. Eligible Applicants resembled Recipients more closely than the ineligible Applicants who had left income assistance before the end of their 12-month qualifying period, but they were still more likely to report characteristics associated with greater employability than Recipients.
Applicants may also have been better able to respond to the supplement offer because the program notified them a year in advance of their potential eligibility for the supplement, a full two years before their last chance to take it up. Although this advance notice had no impact on the full-time employment of Applicants during the first year, significantly more program group members preserved their future eligibility for the supplement by remaining on income assistance while working full time. By remaining eligible while already having a full-time job, such program group members would have been better able to qualify for the SSP supplement following eligibility determination. Among program group members who were still eligible, 15 per cent were employed full time in Month 12, compared with 9 per cent in the control group. Such anticipatory behaviour could partly account for the fast rate of supplement take-up among eligible Applicants. Following eligibility determination, for example, 47 per cent of eligible Applicants took up the supplement compared with 34 per cent of Recipients. The bulk of this difference arose over the first six months because eligible Applicants took up the supplement very quickly following eligibility determination. Four in every five Applicant program group members (80 per cent) who were employed full time and still eligible for the supplement in Month 12 became takers. They comprised 26 per cent of all takers.
SSP’s recruitment of Recipients began before recruitment of Applicants. It is thus possible that intervening economic and policy changes in BC may have altered the decisions Applicants made about taking up the supplement, compared with Recipients. There was little evidence that inflation or minimum wage changes accounted for major differences between the studies. The experience of the control groups helped to reduce the likelihood of any bias on impacts due to time-varying factors within each study.
• If SSP were implemented as a policy, it would be effective initially in reducing the current IA caseload, and would be even more effective in the long run.
The financial impacts of the SSP program on individuals, government budgets, and society differed between the Recipient study — which simulated the effect of initiating the program — and the Applicant study — which simulated an ongoing program. The Recipient study showed that SSP was highly successful in promoting employment, reducing welfare use, and reducing poverty among long-term welfare recipients, including those who faced considerable employment barriers and who had remained on income assistance for long periods. The Applicant study showed that SSP was even more effective for clients just starting a welfare spell. As a consequence, the two studies suggest that the effectiveness of SSP will increase over time when it is operated as a program.

21
POLICY IMPLICATIONS
• SSP’s rigorous research design has generated reliable evidence about changing policy.
IA recipients leave welfare all the time. By using a rigorous random assignment evaluation, SSP has determined the difference that an earnings supplement program can make over and above what would have happened to IA clients in the absence of the program. The study has produced reliable estimates of a range of benefits and costs resulting from offering the earnings supplement. It has also permitted comparison of the consequences of making the offer at different stages of welfare receipt. The answers to SSP’s research questions can be presented as definitive lessons learned, thanks to the way the SSP study was implemented.
Nonetheless, caution is necessary in applying these findings. A margin for error is common in research that estimates effects based on a random sample. This is reflected in the standard errors and significance levels used in the tables for this paper. Moreover, the data were collected from a program run outside the existing system during a particular period in one geographic area. Care must be taken in extrapolating the findings to current and future provincial policy. Broader “equilibrium” effects cannot be tested directly by an experiment, such as the effect on provincial labour markets, wages, and employment opportunities, when an intervention piloted among a small group becomes widespread.
Within these caveats, the SSP studies have afforded policy-makers a very high level of confidence in answers about what the program can achieve. New policy can be developed with many more certainties than was possible before the SSP studies began.
• The Recipient study showed that SSP was an effective policy for Recipients. The Applicant study results suggest that SSP was even more effective for Applicants.
The Recipient study concluded that SSP accelerated by two to three years welfare recipients’ transition to full-time employment. In doing so, it produced some of the largest employment impacts seen in random assignment program evaluation. Findings from the Applicant study do not alter this basic conclusion. Applicants as a population appear better prepared for the labour market, but SSP still made a dramatic difference to their employment behaviour, earnings, and use of income assistance. Two and a half years into the study, Applicant program group members were reporting a full-time employment rate that control group members did not achieve until three years later. Program group earnings averaged $10,571 in Year 3, a level not reached by control group earnings until two years later.
The Applicant study has shed more light on the effectiveness of incentives. While both the Recipient and Applicant studies show that an incentive to leave welfare conditioned on full-time work can produce dramatic effects, the Applicant study shows that an incentive that requires people to stay on welfare is less effective. When Applicants were offered an incentive to stay on welfare for a year, relatively few (just 3.1 per cent) were tempted to stay on welfare in order to qualify. The findings from focus groups suggest that incentives may not be taken up if they do not resonate closely with the immediate goals and identities of participants.
Like SSP for Recipients, SSP for Applicants has helped a significant proportion of families on welfare, for a year or more, to rely more on employment and less on welfare,

22
without detectably harming family well-being, in a way that also reduced poverty. Compared with Recipients, these impacts lasted up to a year longer and were achieved at less cost to government. SSP acts as a bridge or shortcut to the higher levels of employment, earnings, and total income and the lower levels of welfare receipt that families could not normally have expected to reach within two or three years in the absence of such an offer.
References
Burtless, G. (1987). The work response to guaranteed income: A survey of experimental evidence. In A. Munnell (Ed.), Lessons from the income maintenance experiments (pp. 22–52). Boston and Washington, DC: Federal Reserve Bank of Boston and Brookings Institution. Burtless, G. (1994). Public spending on the poor. In S. H. Danziger, G. D. Sandefur, & D. H. Weinberg (Eds.), Confronting poverty: Prescriptions for change. Cambridge, MA: Harvard University Press. Ford, R., Gyarmati, D., Foley, K. and Tattrie, D. with Jimenez, L. (2003) Can Work Incentives Pay for Themselves? Final Report on the Self-Sufficiency Project for Welfare Applicant. Ottawa: Social Research and Demonstration Corporation. Michalopoulos, C., Tattrie, D., Miller, C., Robins, P. K., Morris, P., Gyarmati, D., Redcross, C., Foley, K., & Ford, R. (2002). Making work pay: Final report on long-term welfare recipients in the self-sufficiency project. Ottawa: Social Research and Demonstration Corporation.