campus dining 101 - farm to institution new england dining 101: benchmark study of farm to college...
TRANSCRIPT

CAMPUS DINING 101: BENCHMARK STUDY OF FARM TO COLLEGE IN NEW ENGLAND
Farm toInstitutionNEW ENGLAND
MARCH 2017
LOCAL FOOD ON CAMPUS: HIGHER EDUCATION’S ROLE IN FARM TO INSTITUTION PAGE 2
ABOUT THE NEW ENGLAND FARM TO INSTITUTION METRICS PROJECT Farm to Institution New England is a six-state network of nonprofit, public, and private entities working collaboratively to achieve a mission of to mobilize the power of New England institutions to transform our food system.
Since its inception, FINE has focused on developing cross-sector connections between K-12 schools, colleges and universities, hospitals, and other institutions. Today, FINE serves those at the forefront of the farm to institution movement in the region, providing a forum to connect and share ideas, models, resources, and support. FINE leads projects related to key issues identified by farm to institution leaders and acts as the backbone organization for farm to institution work in the region: we build the network, convene stakeholders, develop and disseminate tools and resources, and communicate with key external audiences.
Additional information on the New England Farm to Institution Metrics Project can be found online at www.farmtoinstitution.org/metrics.
The New England Farm to Institution Metrics Project is funded by the Henry P. Kendall Foundation and The John Merck Fund.
Cover photo: Students harvest vegetables from the campus farm. Courtesy of the University of Massachusetts Amherst.
ACKNOWLEDGEMENTSADVISORSMolly Anderson, Middlebury CollegeCourtney Bourns, Henry P. Kendall FoundationCris Coffin, Land for GoodJillann Fitzsimmons, UMass AmherstGemma Gorham, Brown UniversityChristine James, John Merck FundDawn King, Brown UniversityJiff Martin, University of Connecticut Extension Riley Neugebauer, Farm to Institution New EnglandJeff Piestrak, Cornell University
PROJECT TEAM Nessa Richman, Metrics Project ManagerThai Ha-Ngoc, Metrics Project Researcher Lydia Oberholtzer, Metrics Project Research ConsultantJennifer Obadia, Metrics Project Special Research AdvisorKaitlin Haskins, FINE Communications ManagerPeter Allison, FINE Network Director
To learn more about Farm to Institution New England, visit www.farmtoinstitution.org
FUNDERS

LOCAL FOOD ON CAMPUS: HIGHER EDUCATION’S ROLE IN FARM TO INSTITUTION PAGE 3
TABLE OF CONTENTS4 EXECUTIVE SUMMARY
5 KEY FINDINGS
6 INTRODUCTION
8 SURVEY METHODS & PROCEDURES
10 NEW ENGLAND COLLEGE DINING SERVICES CHARACTERISTICS
15 DEFINING & TRACKING LOCAL
19 BUYING & SERVING LOCAL FOOD
23 SOURCING LOCAL FOOD PRODUCTS
25 RELATIONSHIPS WITH VENDORS & ON-SITE PRODUCTION
28 BARRIERS TO LOCAL FOOD PROCUREMENT
30 RECOMMENDATIONS FOR INSTITUTIONS OF HIGHER EDUCATION
32 REFERENCES
33 WHERE TO FIND MORE INFORMATION
LOCAL FOOD ON CAMPUS: HIGHER EDUCATION’S ROLE IN FARM TO INSTITUTION PAGE 4
Bringing healthy, locally produced food into institutions has been proposed as an effective strategy to address social, economic, and environmental issues. Institutions, including colleges and universities, purchase and prepare food for many people, including students, employees, and other community members.
Existing research suggests that farm to institution strategies may improve nutrition for institutional eaters, while also supporting local food producers. However, there have been limited efforts to track the progress of farm to institution strategies at local, state, or regional levels.
Farm to Institution New England (FINE) has been involved in farm to college programs since its inception. FINE initiated and houses the New England Farm & Sea to Campus Network. Farm to college (FTC) programs allow college dining services to procure locally grown and processed food products with the intent of fulfilling any number of goals, such as promoting local economic development, serving fresh and healthy meals, responding to customer demand, and meeting
EXECUTIVE SUMMARYsustainability targets. Because most FTC programs are relatively new, there has been little research on their progress and impact.
To address this need, FINE developed a survey of dining services for colleges and universities, including community colleges, across the six New England states. This report summarizes the results of the survey, which was designed to explore perspectives on bringing local food to college campuses and identify the challenges and opportunities colleges face in developing local food programs. At the same time, the report establishes a baseline for New England college procurement of local food in 2014-15, with which comparisons can be made to measure progress over time.
The FTC survey captured data from half (105 out of 209) of the campuses contacted in the region. The results show that an overwhelming percentage of the responding colleges are buying local food, and plan to buy even more in the future. Although colleges have varying definitions of local food, respondents purchased $57 million of local food over the last
fiscal year. The report concludes with recommendations for colleges and universities, government officials, funders, and others to further farm to institution strategies in New England.
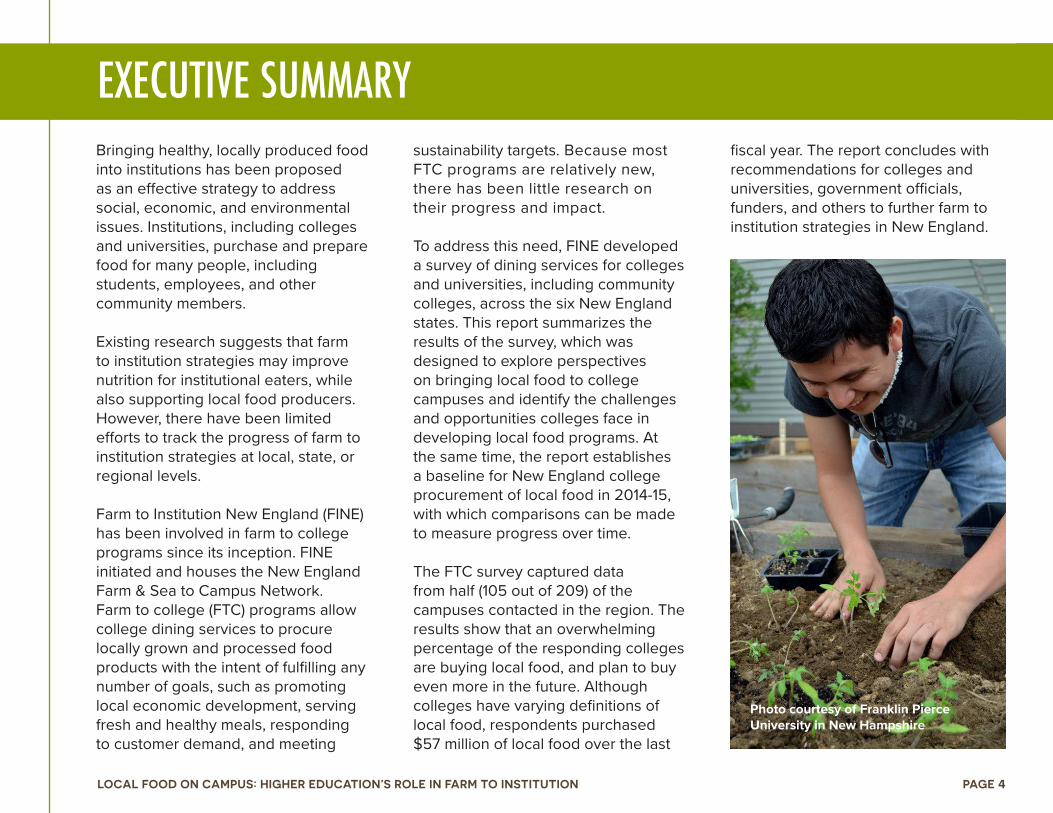
Photo courtesy of Franklin Pierce University in New Hampshire
LOCAL FOOD ON CAMPUS: HIGHER EDUCATION’S ROLE IN FARM TO INSTITUTION PAGE 5
KEY FINDINGS
USE OF LOCAL FOOD BY COLLEGES• Over 95% of colleges reported that
they purchased local food for their dining services program.
• On average, colleges and universities spent over one-fifth (21%) of their annual food budgets on local food.
• Colleges served over 150,000 students each day and over 65 million meals a year, spending $57 million on local food over the last fiscal year.
• Colleges with self-operated dining services spent significantly more of their food budget on local food procurement (averaging 27.5%) than responding colleges using food service management companies (17.9%).
SOURCING LOCAL FOOD• Apples, milk, produce, potatoes,
and bakery products were the top products sourced locally over the last year.
• The products that colleges had the most difficulty sourcing locally were poultry, meat, and eggs. Baked
goods and seafood also posed challenges.
• The vast majority (98%) of respondents reported that, over the course of the next three years, they believe their college will increase procurement of local food.
• Colleges reported procuring directly from an average of approximately three producers, one producer cooperative (which represents multiple producers), and two local processors.
• Self-operated colleges procured directly from significantly more producers and local processors than those operated by food service management companies.
TRACKING LOCAL FOOD• Although definitions vary widely,
the majority of colleges have defined “local” as within the region, either by distance or regional/state boundaries. However, the survey revealed challenges with defining and tracking local.
• The majority either reported not having or not knowing whether
local or regional preferences are in the contracts that govern their institution’s food service, showing that additional awareness opportunities exist in this area.
• Almost a third used distributor reports as a primary tool for tracking their local purchases, and over a third stated that they have no tool to track local purchases. As distributor reports are typically not audited, the accuracy of local purchase data may come into question.
CHALLENGES IN PURCHASING LOCAL FOOD• Most colleges reported that student
and faculty engagement and institutional support were not a barrier to farm to college programs. This means there is likely internal support from many stakeholders for expansion of these programs.
• The greatest challenges to serving local food include distributors offering a sufficient volume and variety of local products on a year-round basis, and the price of these products.
All key findings apply to the colleges and universities that responded to FINE’s 2015 survey

LOCAL FOOD ON CAMPUS: HIGHER EDUCATION’S ROLE IN FARM TO INSTITUTION PAGE 6
Institutions play a central role in the well-being of their communities, providing jobs, promoting learning, and delivering critical health services. K-12 schools, colleges, and hospitals also represent important venues in the discussion of local food systems, as they serve as an aggregation point for many consumers, where students, employees, patients, and other community members purchase and consume food.
Bringing healthy, locally produced food into institutions has been proposed by many as an effective strategy to address the social, economic, and environmental challenges posed by the current food system (Joshi, Azuma, & Feenstra, 2008; Harris et al., 2012; Clinton et al., 2014). Policies and programs supporting the procurement of locally produced food by institutions have grown significantly over the past decade. While the existing research suggests that farm to institution strategies may improve nutrition for students and patients and support local food producers, little work is being done to track the progress of these strategies on local, state, or regional levels.
INTRODUCTIONFarm to college (FTC) programs, as they are generally known, allow college dining services to promote local economic development, serve fresh and healthy meals, respond to customer demand, and meet sustainability goals. FTC programs are often a component of larger campus food sustainability programs, which may include other initiatives such as recycling, composting, and community gardens (Murray, 2005; Ng, Bednar, & Longley, 2010).
FTC programs started to surface in significant numbers in the late 1990s. The number of colleges and universities that currently run FTC programs nationally is unknown, but anecdotally the number seems to have increased rapidly over the last decade. Participation in FTC-related efforts, such as the Association for the Advancement of Sustainability in Higher Education (AASHE) Sustainability Tracking, Assessment & Rating System (STARS) and Real Food Challenge (RFC), have also increased. Institutions of higher education generally face fewer structural and economic barriers to procuring local food than public schools and hospitals.
A number of factors make them a more attractive venue for efforts to increase local food procurement than K-12 schools, including their large buying power, greater menu flexibility (i.e., fewer direct requirements to meet federal nutrition standards, more dollars to allocate to meals), and the fact that colleges are more likely to have in-house kitchen facilities (Murray, 2005). In addition, college students are increasingly interested in knowing the origin of the food they are served in campus dining halls.
Past research has identified several reasons that colleges purchase local food, including support for local producers and the economy, improved public relations, and improved relationships with faculty and students who are supportive of FTC (Ng, Bednar, & Longley, 2010). However, barriers to providing local food on college campuses are multiple, including limited seasonality of local products, high local food prices, and volume needs (Merrigan & Bailey, 2008; Ng, Bednar, & Longley, 2010).

LOCAL FOOD ON CAMPUS: HIGHER EDUCATION’S ROLE IN FARM TO INSTITUTION PAGE 7
Because most farm to college (FTC) programs are relatively new, there has been limited research on their progress and impact. Farm to school (K-12) efforts have been tracked through the USDA Farm to School Census (USDA FNS, n.d.) since 2013. However, no comparable national survey exists for colleges and universities. Some research suggests that the Northeastern region of the United States is the center of many FTC programs (Murray, 2005). Research also shows concentrated intermediated (i.e., non-direct) sales and food hubs, which often service institutional markets, in the New England region (Low et al., 2015).
Based on the need for more information in New England about FTC programs, Farm to Institution New England (FINE) developed a survey of dining services for colleges and universities, including community colleges. The survey was created to explore the nature of colleges’ demand for local products and identify challenges and opportunities they face in sourcing, buying, and serving local food.
The growth of the farm to institution market in New England depends on the hard work of hundreds of dedicated and skilled people affiliated with institutions, businesses, networks,
and organizations. All stakeholders, from policymakers to dining service managers and school teachers, can use information to demonstrate the level and impact of local food procurement by institutions in the region across the supply chain. FINE established the New England Farm to Institution Metrics Project (www.farmtoinstitution.org/metrics) in collaboration with key partners to collect and provide data to stakeholders.
Since its inception, FINE has been working in the college sector. FINE’s Farm & Sea to Campus Project convenes numerous stakeholders at institutions of higher learning, including dining directors, faculty, and students, in an effort to implement positive changes in institutional food purchasing patterns that support healthy and improved eating behaviors among students and encourage a new generation of food activists. Ultimately, this project aims to increase the amount of local food purchased and served in New England colleges.
To find more information as well as a collection of resources and tools, visit the Farm & Sea to Campus Project’s webpage: www.farmtoinstitution.org/new-england-farm-sea-campus-network
This report summarizes the results of the FTC survey. It is the second in a series of reports published by the FINE Metrics Project (the first focusing on distributors). The data and report presented here will help establish a baseline of college procurement of local food for 2014-15 and allow for measurement of progress over time. The report also identifies ways in which practitioners, policymakers, funders, and others can increase FTC efforts in New England.
Photo courtesy of the University of New Hampshire

LOCAL FOOD ON CAMPUS: HIGHER EDUCATION’S ROLE IN FARM TO INSTITUTION PAGE 8
SURVEY METHODS & PROCEDURESEarly drafts of the farm to college (FTC) survey were developed by FINE’s Farm & Sea to Campus Project staff. This survey was revised by the research project team (which included the FINE Farm & Sea to Campus staff), in consultation with other FINE staff and the Metrics Project Advisory Team. The survey’s 25 questions were designed to collect data regarding characteristics of dining services, local food used in dining services, future procurement needs, barriers to purchasing local food, and whether the campus had a farm or garden.
The sample of 209 colleges in the six New England states was developed over several years by FINE’s Farm & Sea to Campus Project staff. The colleges included only those that project staff determined had some type of dining services after researching publicly available information. The vast majority of survey recipients were directors of dining operations at the participating institutions.
The survey was conducted online through SurveyMonkey and was self-administered by the respondents. Potential respondents received two
email invitations to participate. After a few weeks, follow-up calls were made by FINE staff and partner organizations. As an incentive, all respondents were entered into a drawing for one of two gift cards worth $50.
The 2015 survey of New England colleges and universities captured half of the campuses known to have some type of food services in the region. Of 209 colleges, 105 responded to the survey (Table 1). Vermont had the highest response rate, followed by Maine. While Massachusetts colleges made up almost 50% of the colleges contacted, only one-third of colleges in the state responded, resulting in the lowest response rate among the states.
All but five of the responding colleges reported that they purchased local food for their dining services program. Of that number, only one respondent reported that his/her college is not interested in doing so and four said they hoped to purchase local food in the future. This report will detail characteristics of all 105 colleges in the section describing college dining services, but will focus on the 100 that purchase local food in the local food purchasing sections.
Photo courtesy of Hampshire College in Massachusetts – photo by Jess Wissemann

LOCAL FOOD ON CAMPUS: HIGHER EDUCATION’S ROLE IN FARM TO INSTITUTION PAGE 9
Regarding survey limitations, respondents were self-selected and, therefore, may have been more likely to be interested in FTC and local food than the group of respondents who did not respond to the survey. While the results may not be representative of all the colleges in the region, they likely characterize the FTC efforts in those colleges that run FTC programs. Although the survey results do not represent the full picture of FTC efforts in New England, it does provide a significant and important baseline of activities underway in 2014-15.
TABLE 1: FARM TO COLLEGE SURVEY RESPONSES BY STATE, 2015
95% OF THE COLLEGES THAT RESPONDED TO OUR SURVEY SAID THEY CURRENTLY PURCHASE LOCAL FOOD. 93% OF THEM PLAN TO BUY MORE LOCAL FOOD IN THE FUTURE.
Photo courtesy of Vermont Technical College

LOCAL FOOD ON CAMPUS: HIGHER EDUCATION’S ROLE IN FARM TO INSTITUTION PAGE 10
NEW ENGLAND COLLEGE DINING SERVICES CHARACTERISTICSColleges may decide to operate their own dining service program or hire a food service management company (FSMC) to operate it for them. Self-operation allows more control and customization over food procurement and menu design (Leib et al., 2015). However, FSMCs have the ability to develop programs that they can apply to multiple accounts across a state or region, allowing for the potential of a large impact. They also often have greater purchasing power given the number of accounts they manage across the region.
Both self-operated institutions and those operated by FSMCs typically utilize large or broadline food distributors to provide the majority of their food. These distributors are able to provide consistent, year-round access to multiple food products because they purchase food from national and international sources. Utilizing large or broadline distributors simplifies the procurement process for food service staff, who often have limited time. However, it can also make it more difficult for them to procure consistent and adequate supplies of seasonally available food from local farms and processors.
Although distributor contracts usually require that the college purchase most of the food outlined in the contract through that distributor, such arrangements do not necessarily preclude purchasing some food from local farms. College dining services can insist on procuring a certain percentage of local food through their contracted vendor or on their own outside the contract. The size of a university’s account gives it substantial leverage with these vendors (Leib et al., 2015).
University and college dining operations may include one or more of the following:
• Dining halls are typically all-you-can-eat facilities that are open to all students who participate in a meal plan, as well as to staff and faculty purchasing food through other payment methods. Dining hall offerings vary from campus to campus, but many include salad bars, buffet lines, and made-to-order selections.
• Catering services provide food for special meetings and events
of various sizes to the campus community. Typically, these services are paid for by the administration, a department, or a student group. The food is usually ordered from a set menu, but may also be customized.
• Retail/Cash operations often serve a limited a la carte menu, including beverages, and convenience items (pre-packaged foods, snacks, etc.). They may accept student meal plan “dollars,” and take other forms of payment, making them accessible to employees and visitors. These facilities can include custom recipes developed by the institution or the FSMC.
• Franchises or national or regional brand concepts can also be a part of college food service offerings. These can be fast food or other themed items that have high brand recognition amongst students. While the food service staff manages the operations, and prepares and serves the food, there is typically a commission or fee associated with the use of the brand or concept that must be paid by the institution.

LOCAL FOOD ON CAMPUS: HIGHER EDUCATION’S ROLE IN FARM TO INSTITUTION PAGE 11
Of the respondents who reported their college’s total food budget over the last fiscal year, the average food budget was $3.1 million, with a range from $23,000 to $25 million (Figure 2). Looking at aggregate food budgets across states (Table 2), Massachusetts has the largest total food budget, in part because it had the largest number of respondents.
Of the 105 universities and colleges that responded to the survey, most had dining halls and catering services, and almost three-quarters had at least one retail store (Figure 1). Only about a fifth had franchise operations.
N=105
FIGURE 1: FOODSERVICE OPTIONS AT PARTICIPATING NEW ENGLAND COLLEGES, 2015
Photo courtesy of the University of New Hampshire

LOCAL FOOD ON CAMPUS: HIGHER EDUCATION’S ROLE IN FARM TO INSTITUTION PAGE 12
FIGURE 2: PARTICIPATING NEW ENGLAND COLLEGES BY FOOD BUDGET CATEGORY
Note: Since colleges may have different fiscal years (e.g., July through June or January through December), colleges were asked to respond to this question using their last fiscal year and not a specific time frame.
N=93
Photo courtesy of Colby College in Maine

LOCAL FOOD ON CAMPUS: HIGHER EDUCATION’S ROLE IN FARM TO INSTITUTION PAGE 13
TABLE 2: AGGREGATE FOOD BUDGETS OF PARTICIPATING NEW ENGLAND COLLEGES, LAST FISCAL YEAR OVER THE LAST FISCAL
YEAR, THE COLLEGES THAT RESPONDED TO FINE’S SURVEY SERVED A TOTAL OF OVER 65.3 MILLION MEALS
PHOTO
Photo courtesy of Mass Farm to School and Holyoke Community College

LOCAL FOOD ON CAMPUS: HIGHER EDUCATION’S ROLE IN FARM TO INSTITUTION PAGE 14
When asked about the primary operating structure of their college dining services (Figure 3), 27% reported that they were self-operated. The remaining 73% said they were operated by FSMCs, with 34% using Sodexo, 21% using Chartwells, and 18% using other FSMCs.
FIGURE 3: PRIMARY OPERATING STRUCTURES OF DINING SERVICES, PARTICIPATING NEW ENGLAND COLLEGES, 2015
N=97
Fitz-Vogt2%
Metz Culinary3%
Bon Appetit5%
Aramark8%
Chartwells21%
Self-Operated27%
Sodexo34%

LOCAL FOOD ON CAMPUS: HIGHER EDUCATION’S ROLE IN FARM TO INSTITUTION PAGE 15
Over the last fiscal year, the colleges that responded to the survey served a total of over 65.3 million meals. Colleges served an average of 7,466 meals per day. Although many (27%) served fewer than 150,000 meals over the year (Figure 4), about a fifth (21%) served 1 million or more meals over the last fiscal year. Almost three-quarters (73%) of the students attending these colleges were on a meal plan, representing over 151,000 students (Table 3).
FIGURE 4: NUMBER OF MEALS SERVED BY DINING SERVICES AT PARTICIPATING NEW ENGLAND COLLEGES OVER LAST FISCAL YEAR
N=74
TABLE 3: STUDENTS ON MEAL PLAN IN PARTICIPATING COLLEGES OVER LAST FISCAL YEAR
Photo courtesy of the University of New Hampshire
Less than 150,000 meals
(27%)
150,000 - 299,999 meals
(20%)300,000 -599,999 meals
(18%)
600,000 - 999,999 meals
(14%)
1 million or more meals
(21%)

LOCAL FOOD ON CAMPUS: HIGHER EDUCATION’S ROLE IN FARM TO INSTITUTION PAGE 16
DEFINING & TRACKING LOCALIn order for campuses to understand the amount of local food they are purchasing, they must first define what they mean by “local.” Although some campuses create their own definition, many colleges choose to align with existing sustainability metrics such as the Association for the Advancement of Sustainability in Higher Educations’ (AASHE) Sustainability Tracking, Assessment & Rating System (STARS) (https://stars.aashe.org) or the Real Food Challenge Calculator (www.realfoodchallenge.org/calculator) criteria. Both of these tools use a 250-mile radius for foods grown, caught, and/or processed as part of their definition of local.
Although some colleges use these metrics, the greatest difficulty in measuring local procurement across the region is that there is not one common definition of local, resulting in a large amount of variability across colleges.
Campuses must determine how they will track these purchases. Tracking purchases using dollars spent on local products is the primary method of tracking and auditing
local food because purchases are already tracked through invoices and accounting. Tracking volume, on the other hand, can be difficult (e.g., deciding whether to count cases, pounds, or pieces of various products).
Because it is time-consuming to track local purchasing, many campuses conduct an audit of all products purchased during a portion of the year, comparing each product to the local food criteria. This approach is often used by those reporting for the Real Food Calculator, with students analyzing individual invoices, researching products, and entering data into spreadsheets. Other campuses develop customized systems and rely on reporting from their distributors or other vendors. Once a campus has agreed upon a definition for “local” and a method for tracking purchases, it typically conducts an initial baseline assessment to determine their current levels of local food purchasing.
Photo by Chris Manzella
LOCAL FOOD ON CAMPUS: HIGHER EDUCATION’S ROLE IN FARM TO INSTITUTION PAGE 17
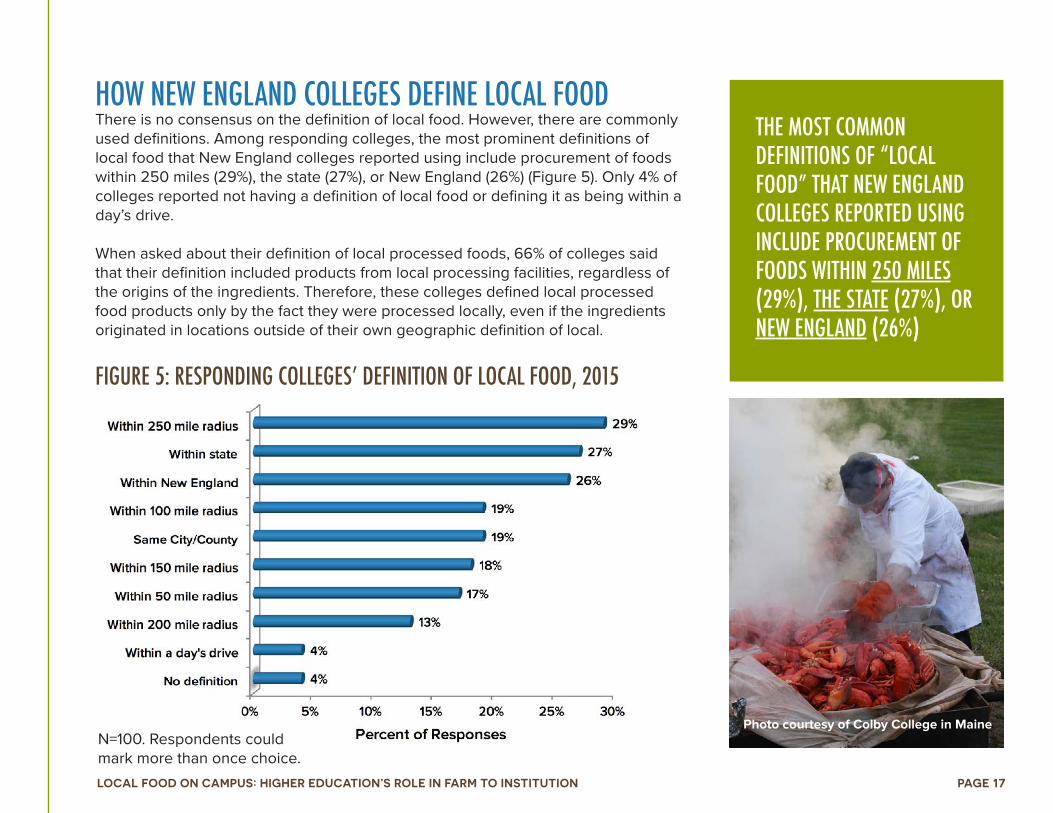
FIGURE 5: RESPONDING COLLEGES’ DEFINITION OF LOCAL FOOD, 2015
HOW NEW ENGLAND COLLEGES DEFINE LOCAL FOODThere is no consensus on the definition of local food. However, there are commonly used definitions. Among responding colleges, the most prominent definitions of local food that New England colleges reported using include procurement of foods within 250 miles (29%), the state (27%), or New England (26%) (Figure 5). Only 4% of colleges reported not having a definition of local food or defining it as being within a day’s drive.
When asked about their definition of local processed foods, 66% of colleges said that their definition included products from local processing facilities, regardless of the origins of the ingredients. Therefore, these colleges defined local processed food products only by the fact they were processed locally, even if the ingredients originated in locations outside of their own geographic definition of local.
N=100. Respondents could mark more than once choice.
THE MOST COMMON DEFINITIONS OF “LOCAL FOOD” THAT NEW ENGLAND COLLEGES REPORTED USING INCLUDE PROCUREMENT OF FOODS WITHIN 250 MILES (29%), THE STATE (27%), OR NEW ENGLAND (26%)
Photo courtesy of Colby College in Maine

LOCAL FOOD ON CAMPUS: HIGHER EDUCATION’S ROLE IN FARM TO INSTITUTION PAGE 18
CONTRACT LANGUAGE SUPPORTING LOCAL FOOD PROCUREMENT Colleges were also asked whether the contracts that govern their institution’s food service contained language that held preferences for local or regional foods. Almost a third (30%) of respondents reported that local or regional preference was in their FSMC contract, 19% in their distributor contract, while 31% said it was not in any contract. Over a fifth (22%) reported that they did not know if there was any local or regional preference language in their contracts.
TRACKING LOCAL BY NEW ENGLAND COLLEGESThe colleges that were surveyed use a variety of tools to track their local food purchases (Figure 6). Almost a third (32%) used distributor reports and a fifth (21%) use customized tools to track local food purchases. About a third (35%) of the responding colleges used none of the tools (or any other tool) to track their local purchases.
FIGURE 6: TOOLS USED TO TRACK LOCAL PURCHASES BY PARTICIPATING NEW ENGLAND COLLEGES
N=100. Respondents could choose more than one answer. Other companies have tracking tools, but the survey did not ask about other proprietary tracking tools.
ABOUT A THIRD (35%) OF THE RESPONDING COLLEGES DON’T USE ANY TOOLS TO TRACK PURCHASES OF LOCAL FOOD

LOCAL FOOD ON CAMPUS: HIGHER EDUCATION’S ROLE IN FARM TO INSTITUTION PAGE 19
BUYING & SERVING LOCAL FOOD
FOR THE 84 COLLEGES THAT REPORTED BOTH THEIR TOTAL FOOD BUDGET AND THE PERCENT OF THE BUDGET SPENT ON LOCAL FOOD, A TOTAL OF $56.8 MILLION WAS SPENT ON LOCAL FOOD OVER THE LAST FISCAL YEAR
TABLE 4: SIZE OF COLLEGE FOOD BUDGET & LOCAL FOOD PURCHASES OF PARTICIPATING NEW ENGLAND COLLEGES, LAST FISCAL YEAR
Note: Sixteen colleges either did not report their total food budget or the percentage of food purchases made up by local sources.
ON AVERAGE, COLLEGES SPEND 21.1% OF THEIR TOTAL FOOD BUDGET
ON LOCAL FOOD
All but five of the universities and colleges surveyed reported that they purchased local food for their food services. For the 84 colleges that reported both their total food budget and the percent of the budget spent on local food, a total of $56.8 million was spent on local food over the last fiscal year, with colleges averaging 21.1% of their total food budget spent on local food. Local food purchases ranged from $250 for one college to $7.4 million for another, and 0.05% of the total budget for one college, to 85% for another.
A correlation analysis showed no association between the percentage of food purchased from local sources and the size of the food budget, suggesting that the size of the food budget does not influence the proportion of foods purchased from local sources. Given that the average percent spent on local food was similar across budget size categories (Table 4), it is not surprising that colleges with larger budgets ($5 million or more) make up the majority (66.2%) of all local food purchases made by the participating colleges.

LOCAL FOOD ON CAMPUS: HIGHER EDUCATION’S ROLE IN FARM TO INSTITUTION PAGE 20
FIGURE 7: AVERAGE PERCENT OF BUDGET SPENT ON LOCAL FOOD BY TYPE OF OPERATION, LAST FISCAL YEAR
N=88. There was a significant difference in the percent of budget used for local food at self-operated colleges (M=27.5, SD=17.9) and those operated by food management companies (M=17.9, SD=14.3); t(86)=2.515), p = 0.014.
FIGURE 8: TYPE OF DINING OPERATIONS AT PARTICIPATING NEW ENGLAND COLLEGES, LAST FISCAL YEAR
Although the size of the food budget does not influence the share spent on local food, there was a statistically significant difference between the percent of the total food budget spent on local food by colleges with self-operated dining services (which purchase an average of 27.5% of their budget on local food) versus those run by food management service companies (averaging 17.9%) (Figure 7). This translated into 21 self-operated colleges purchasing more than half (55%) of the $57 million spent on local food in the region over the last fiscal year, whereas the 67 colleges run by FSMCs accounted for only 45% of this total (Figure 8).
COLLEGES WITH SELF-OPERATED DINING SERVICES TEND TO SPEND A GREATER SHARE OF THEIR FOOD BUDGET ON LOCAL FOOD THAN THOSE OPERATED BY FOOD MANAGEMENT SERVICE COMPANIES

LOCAL FOOD ON CAMPUS: HIGHER EDUCATION’S ROLE IN FARM TO INSTITUTION PAGE 21
Although Massachusetts colleges and universities spent, on average, a lower proportion of their food budget on local food (Figure 9), they accounted for almost one-thirds of the total local food purchases made by participating New England colleges over the last fiscal year.This is likely a result of the size of food budgets for colleges in these states and the number of colleges reporting. Conversely, Vermont colleges, on average, spent the highest proportion of their food budgets on local food, but did not generate higher levels of spending on local food, most likely due to smaller overall food budgets in the state’s colleges.
FIGURE 9: AMOUNT SPENT ON LOCAL FOOD BY PARTICIPATING NEW ENGLAND COLLEGES BY STATE, 2015
N=84. MA (28), NH (8), CT (15), ME (14), RI (3), VT (16)
Photo courtesy of the University of New Hampshire

LOCAL FOOD ON CAMPUS: HIGHER EDUCATION’S ROLE IN FARM TO INSTITUTION PAGE 22
LOOKING AHEAD: LOCAL PURCHASES IN THE FUTUREResponding colleges were asked to look ahead three years and to predict how the procurement of local food products might change for their college. None of the respondents believed it would decrease and almost all (98%) predicted that it would increase either some or significantly (Figure 10).
N=100
FIGURE 10: OUTLOOK FOR FUTURE PROCUREMENT OF LOCAL PRODUCTS BY PARTICIPATING NEW ENGLAND COLLEGES, 2015
Photo courtesy of Hampshire College in Massachusetts – photo by Jess Wissemann

LOCAL FOOD ON CAMPUS: HIGHER EDUCATION’S ROLE IN FARM TO INSTITUTION PAGE 23
SOURCING LOCAL FOOD PRODUCTSLOCAL PRODUCTS NEW ENGLAND COLLEGES BUYLocal apples, milk, produce, and potatoes were included in the list of top five local food products purchased by more than a fifth of the reporting colleges (Table 5). Unfortunately, the specificity of products listed by respondents varied. For instance, some colleges listed “produce” in their top five products, while others listed specific types of produce (e.g., apples, tomatoes).
TABLE 5: TOP LOCAL PRODUCTS (BY VALUE) PURCHASED BY PARTICIPATING NEW ENGLAND COLLEGES, 2015
N=100. Respondents were asked to rank their top products based on the value of the product.
Photo courtesy of Brown University

LOCAL FOOD ON CAMPUS: HIGHER EDUCATION’S ROLE IN FARM TO INSTITUTION PAGE 24
EXPERIENCE SOURCING LOCAL PRODUCTSTo get a sense of the demand for and difficulty in sourcing local food products, New England colleges were asked to rate their experience with specific categories of products. Figure 11 is sorted by the percent of colleges that reported they had difficulty sourcing their desired products locally. Poultry and meat topped this list, with over a third reporting difficulty sourcing them locally, followed by eggs. Colleges had less difficulty sourcing vegetables, dairy, and fruit, with the majority of colleges reporting that they were able to source many or a few of these desired products.
FIGURE 11: PARTICIPATING NEW ENGLAND COLLEGES’ EXPERIENCE SOURCING LOCAL PRODUCTS, 2015
N=100Photo courtesy of Black River Produce
14% 21% 43% 22%
14% 27% 39% 20%
32% 22% 26% 20%
38% 33% 19% 10%
28% 39% 18% 15%
58% 33% 8% 1%
29% 68% 2% 1%
47% 51% 2%
Percent of Colleges
LOCAL FOOD ON CAMPUS: HIGHER EDUCATION’S ROLE IN FARM TO INSTITUTION PAGE 25
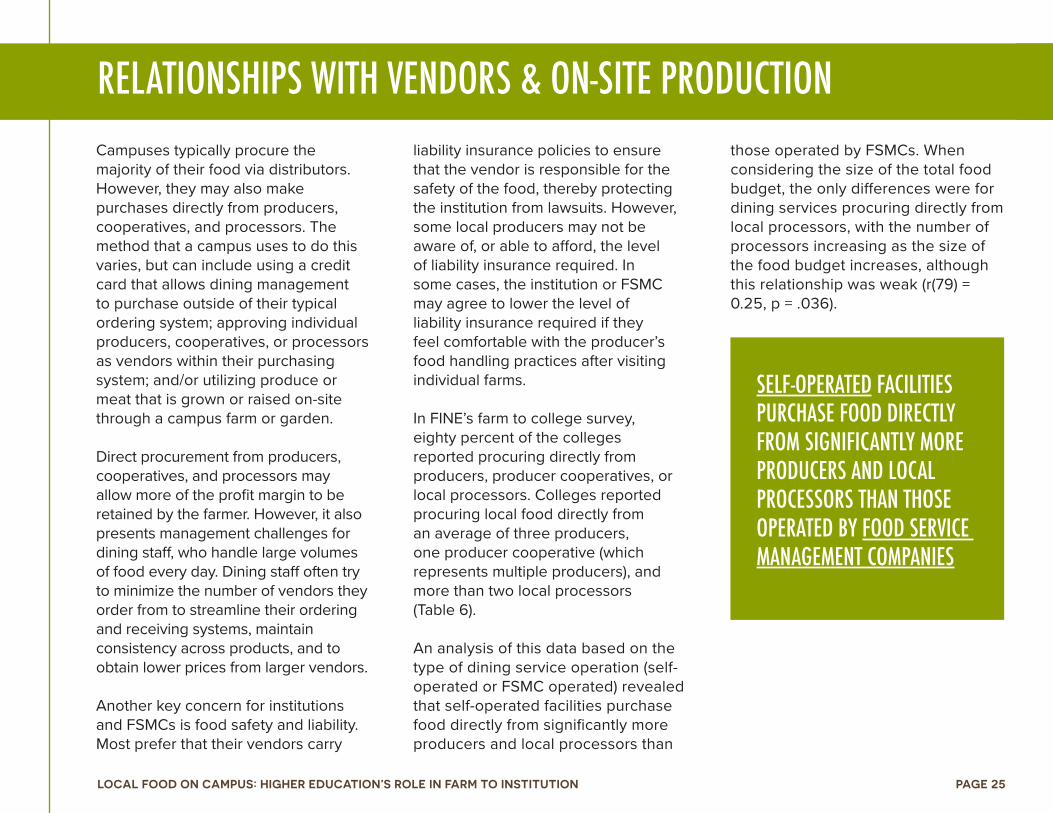
RELATIONSHIPS WITH VENDORS & ON-SITE PRODUCTION Campuses typically procure the majority of their food via distributors. However, they may also make purchases directly from producers, cooperatives, and processors. The method that a campus uses to do this varies, but can include using a credit card that allows dining management to purchase outside of their typical ordering system; approving individual producers, cooperatives, or processors as vendors within their purchasing system; and/or utilizing produce or meat that is grown or raised on-site through a campus farm or garden.
Direct procurement from producers, cooperatives, and processors may allow more of the profit margin to be retained by the farmer. However, it also presents management challenges for dining staff, who handle large volumes of food every day. Dining staff often try to minimize the number of vendors they order from to streamline their ordering and receiving systems, maintain consistency across products, and to obtain lower prices from larger vendors.
Another key concern for institutions and FSMCs is food safety and liability. Most prefer that their vendors carry
liability insurance policies to ensure that the vendor is responsible for the safety of the food, thereby protecting the institution from lawsuits. However, some local producers may not be aware of, or able to afford, the level of liability insurance required. In some cases, the institution or FSMC may agree to lower the level of liability insurance required if they feel comfortable with the producer’s food handling practices after visiting individual farms.
In FINE’s farm to college survey, eighty percent of the colleges reported procuring directly from producers, producer cooperatives, or local processors. Colleges reported procuring local food directly from an average of three producers, one producer cooperative (which represents multiple producers), and more than two local processors (Table 6).
An analysis of this data based on the type of dining service operation (self-operated or FSMC operated) revealed that self-operated facilities purchase food directly from significantly more producers and local processors than
those operated by FSMCs. When considering the size of the total food budget, the only differences were for dining services procuring directly from local processors, with the number of processors increasing as the size of the food budget increases, although this relationship was weak (r(79) = 0.25, p = .036).
SELF-OPERATED FACILITIES PURCHASE FOOD DIRECTLY FROM SIGNIFICANTLY MORE PRODUCERS AND LOCAL PROCESSORS THAN THOSE OPERATED BY FOOD SERVICE MANAGEMENT COMPANIES

LOCAL FOOD ON CAMPUS: HIGHER EDUCATION’S ROLE IN FARM TO INSTITUTION PAGE 26
TABLE 6: NUMBER OF PRODUCERS, PRODUCER COOPERATIVES, AND LOCAL PROCESSORS PROCURED FROM DIRECTLY BY PARTICIPATING NEW ENGLAND COLLEGES, 2015
An independent samples t-test indicated that self-operated colleges (M = 7.2, SD = 6.08) procured directly from more producers than those operated by food management companies (M=1.9, SD = 3.01), t(73) = -5.255, p < 0.004. The same was true for procurement from local processors, whereby those colleges that are self-operated (M = 7.4, SD = 10.96) procured directly from more local processors than those that are run by food management companies (M = 1.1, SD = 1.51) than, t(73) = -6.387, p < 0.034. Photo by Lucy Senesac

LOCAL FOOD ON CAMPUS: HIGHER EDUCATION’S ROLE IN FARM TO INSTITUTION PAGE 27
In addition to sourcing products from producers, distributors, and processors, New England colleges may also source products from campus farms or gardens. Overall, 41% of the participating colleges reported that their campus had an onsite garden or farm (Table 7). These gardens/farms averaged 3.8 acres, ranging from 0.1 to 50 acres. Of those colleges that had a garden or farm, the vast majority of dining services operations (91%) utilized at least some amount of produce from the garden or farm.
TABLE 7: NUMBER OF PARTICIPATING NEW ENGLAND COLLEGES WITH GARDENS/FARMS, 2015
41% OF THE PARTICIPATING COLLEGES REPORTED THAT THEIR CAMPUS HAD AN ON-SITE GARDEN OR FARM
Photo courtesy of the University of Massachusetts Amherst
LOCAL FOOD ON CAMPUS: HIGHER EDUCATION’S ROLE IN FARM TO INSTITUTION PAGE 28
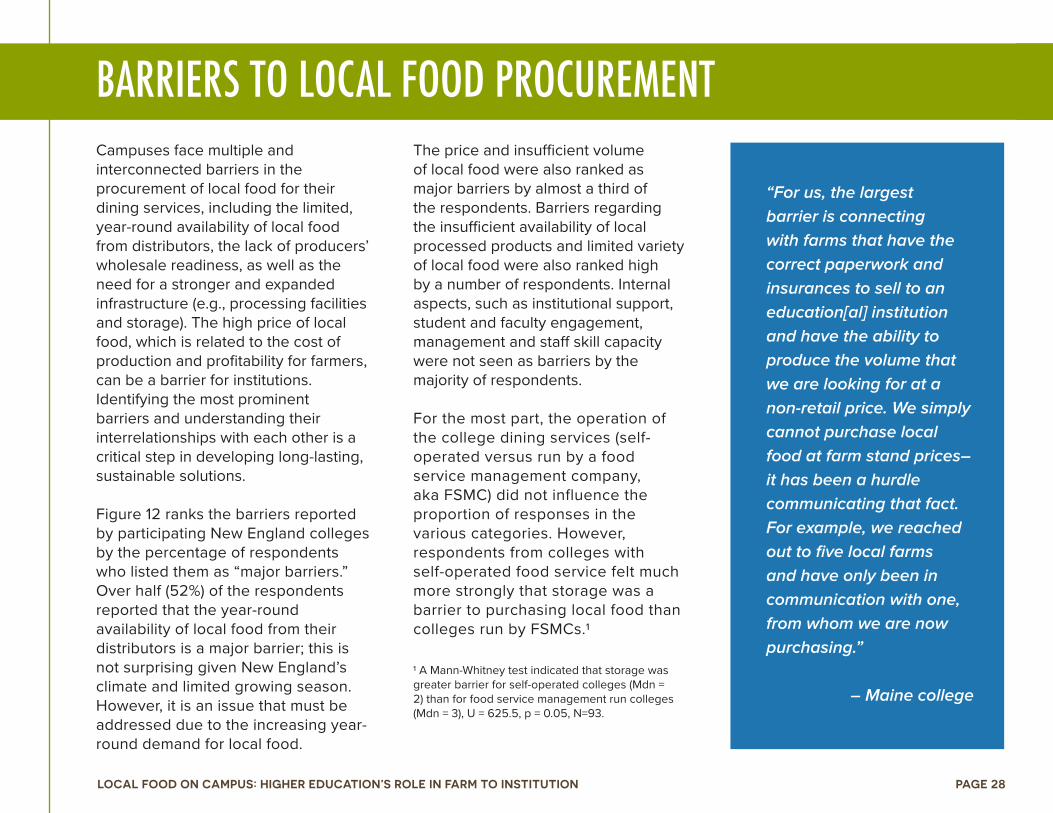
BARRIERS TO LOCAL FOOD PROCUREMENTCampuses face multiple and interconnected barriers in the procurement of local food for their dining services, including the limited, year-round availability of local food from distributors, the lack of producers’ wholesale readiness, as well as the need for a stronger and expanded infrastructure (e.g., processing facilities and storage). The high price of local food, which is related to the cost of production and profitability for farmers, can be a barrier for institutions. Identifying the most prominent barriers and understanding their interrelationships with each other is a critical step in developing long-lasting, sustainable solutions.
Figure 12 ranks the barriers reported by participating New England colleges by the percentage of respondents who listed them as “major barriers.” Over half (52%) of the respondents reported that the year-round availability of local food from their distributors is a major barrier; this is not surprising given New England’s climate and limited growing season. However, it is an issue that must be addressed due to the increasing year-round demand for local food.
The price and insufficient volume of local food were also ranked as major barriers by almost a third of the respondents. Barriers regarding the insufficient availability of local processed products and limited variety of local food were also ranked high by a number of respondents. Internal aspects, such as institutional support, student and faculty engagement, management and staff skill capacity were not seen as barriers by the majority of respondents.
For the most part, the operation of the college dining services (self-operated versus run by a food service management company, aka FSMC) did not influence the proportion of responses in the various categories. However, respondents from colleges with self-operated food service felt much more strongly that storage was a barrier to purchasing local food than colleges run by FSMCs.1
1 A Mann-Whitney test indicated that storage was greater barrier for self-operated colleges (Mdn = 2) than for food service management run colleges (Mdn = 3), U = 625.5, p = 0.05, N=93.
“For us, the largest barrier is connecting with farms that have the correct paperwork and insurances to sell to an education[al] institution and have the ability to produce the volume that we are looking for at a non-retail price. We simply cannot purchase local food at farm stand prices–it has been a hurdle communicating that fact. For example, we reached out to five local farms and have only been in communication with one, from whom we are now purchasing.”
– Maine college

LOCAL FOOD ON CAMPUS: HIGHER EDUCATION’S ROLE IN FARM TO INSTITUTION PAGE 29
FIGURE 12: BARRIERS TO LOCAL PROCUREMENT REPORTED BY PARTICIPATING NEW ENGLAND COLLEGES, 2015
N=100. Some respondents answered “I don’t know,” but these are not included here. Thus, percentages will not add up to 100%.
“Winter presents unique challenges as the local produce and root vegetables run out.”– Vermont college

LOCAL FOOD ON CAMPUS: HIGHER EDUCATION’S ROLE IN FARM TO INSTITUTION PAGE 30
As demonstrated in this report, interest in local food is strong across colleges and universities in New England, and indications are that it will continue to grow. Despite great interest, there are still barriers preventing these institutions from sourcing the amount of local products they desire. The following recommendations were collaboratively developed using the findings of the FTC survey and are designed to strengthen the ability for campuses in New England to access local products.
FINE’s other survey research reports contain additional data-based recommendations. Please read “Getting it There: Understanding the Role of New England Food Distributors in Providing Local Food to Institutions” and sign up for The FINE Print (FINE’s e-newsletter) to be notified when the Metrics Project publishes new material.
COLLEGE PRESIDENTS, SENIOR LEADERSHIP, BOARD OF TRUSTEE MEMBERS, AND SUSTAINABILITY COORDINATORS
RECOMMENDATIONS FOR INSTITUTIONS OF HIGHER EDUCATION1. Support or request the
development of local/sustainable food definitions and goals for the campus as a part of broader sustainability and strategic planning
2. Assist dining services in defining local/sustainable foods as a part of the broader sustainability efforts on campus.
FUNDERS & NONPROFITS 1. Fund work that connects
producers, processors, distributors, and campus food service where there is demonstrated need and interest.
2. Focus resources on understanding how we can improve access to proteins (meats, seafood, plant-based proteins), eggs, and baked goods for campuses in the region.
3. Help producers get “wholesale ready,” so they can serve institutional markets.
4. Promote training and technical assistance for institutional food buyers to effectively develop and use contracts and agreements with producers, distributors, and food service management companies to support their local food goals.
GOVERNMENT OFFICIALS & POLICYMAKERS 1. Prioritize implementation of farm to
institution elements of state food plans and create farm to institution working groups in state food policy councils.
2. Allocate a portion of your public grant programs to farm to institution and season extension projects and research.
3. Invest in a regional tracking system for state agency and institution local/regional food procurement that colleges could use.
4. Set baseline and goals for state agency and institution local/ regional food procurement that state colleges could use.
5. Support producer wholesale readiness workshops, and ensure that workshops are informed by college food service input.
6. Promote increased production of high demand products, and create opportunities for producers and colleges to connect and form business relationships.

LOCAL FOOD ON CAMPUS: HIGHER EDUCATION’S ROLE IN FARM TO INSTITUTION PAGE 31
DINING OPERATORS (DIRECTORS, CHEFS, COOKS, OTHERS) & PROCUREMENT OFFICE STAFF1. Define and track local and sustainable foods• Develop clear definitions for
local/sustainable foods for your institution, considering definitions used by other institutions.
• Track purchases according to your definitions using an effective tracking tool, evaluate whether an existing tool can meet your needs.
2. Use contracts to target local and sustainable foods• If hiring a consultant to assist
in the development of the food service RFP and contract, ask about their experience with local and sustainable foods.
• Determine if existing distributor or vendor contracts include local/sustainable food language and goals.
• Consider inserting language, goals, and definitions in your next Request for Proposals (RFP) and/or food contract.
• Utilize existing tools, such as FINE’s Food Service Project Toolkit (www.farmtoinstitution.org/food-service-toolkit) to view sample language and other resources.
3. Creatively and directly address potential price barriers to local/sustainable sourcing• Evaluate the cost implications of
different products. Prioritize which products to focus on based on your program goals and financial implications.
• Evaluate opportunities to offset any cost increases through menu changes, trayless-dining, smaller portions for plated items, reducing food waste, and energy efficiency.
• Make the case for a larger food budget. If the administration has sustainability as part of its strategic plan or campus-wide initiatives, demonstrate how a larger food budget would support the local economy, improve the quality of the food, boost the health of students and staff, create more satisfied customers, and contribute to a more sustainable food system.
4. Partner with existing and new vendors and producers• Purchase from smaller distributors
and food hubs who, according to FINE’s report on New England food distributors, generally carry a larger percentage of local products.
• Clearly state your institution’s interest in local and its needs to your distributors each year, and in
contract negotiations. Sit down with the sales representative to discuss where local items can be found for your institution’s menus.
• Consider reaching out directly to farmers, fishermen, producer cooperatives, and food hubs to understand if they can meet your institution’s needs via an annual convening or individual meetings.
• To help address issues of seasonal availability, consider featuring seasonal items more regularly on your menu.
• If your college has a campus farm or garden, work with them to purchase more local food produced on-site.
Photo courtesy of Northern Girl

LOCAL FOOD ON CAMPUS: HIGHER EDUCATION’S ROLE IN FARM TO INSTITUTION PAGE 32
REFERENCESClinton, S., Stoddard, J., Perkins, K., Peats, B., & A. Collins. 2014. New England Healthy Food in Health Care: Leading the Charge to a Healthy, Sustainable Food System. Health Care Without Harm.
Harris, D., Lott, M., Lakins, V., Bowden, B., & J. Kimmons. 2012. Farm to Institution: Creating Access to Healthy Local and Regional Foods. Advances in Nutrition: An International Review Journal, 3(3), 343-349.
Joshi, A., Azuma, A., & G. Feenstra. 2008. Do Farm-to-School Programs Make a Difference? Findings and Future Research Needs. Journal of Hunger & Environmental Nutrition, 3(2-3), 229-246.
Leib, A, Abrams, J., Lee, V., Jaffee, A., Foley, C., & E. Schwartz. 2012. Increasing Local Food Procurement by Massachusetts State Colleges & Universities. Cambridge, MA: Harvard Law School Food Law and Policy Clinic.
Low, S., Adalja, A., Beaulieu, E., Key, N., Martinez, S., Melton, A., Perez, A., Ralston, K., Stewart, H., Suttles, S., Vogel, S., & B. Jablonski. 2015. Trends in U.S. Local and Regional Food Systems, AP-068, U.S. Department of Agriculture, Economic Research Service.
Merrigan, K.A. & M.S. Bailey. 2008. The Potential of Farm-to-College Programs. Nutrition and the Environment. 43(4): 160-165.
Murray, S.C. 2005. A survey of farm-to-college programs: history, characteristics and student involvement. Thesis for College of Forest Resources, University of Washington. Available at http://www.farmtocollege.org/Resources/Murraythesis_final_June2005.pdf (downloaded 11/3/2015).
Ng, S., C.M. Bednar, & C. Longley. 2010. Challenges, Benefits, and Strategies of Implementing a Farm to Cafeteria Program in College and University Food Service Operations. Journal of Foodservice Management & Education. 4(1): 22-27.
USDA Food and Nutrition Service (USDA FNS). No date (n.d.). The Farm to School Census. Available online at http://www.fns.usda.gov/farmtoschool/census#/.
Photo courtesy of Vermont Technical College
LOCAL FOOD ON CAMPUS: HIGHER EDUCATION’S ROLE IN FARM TO INSTITUTION PAGE 33
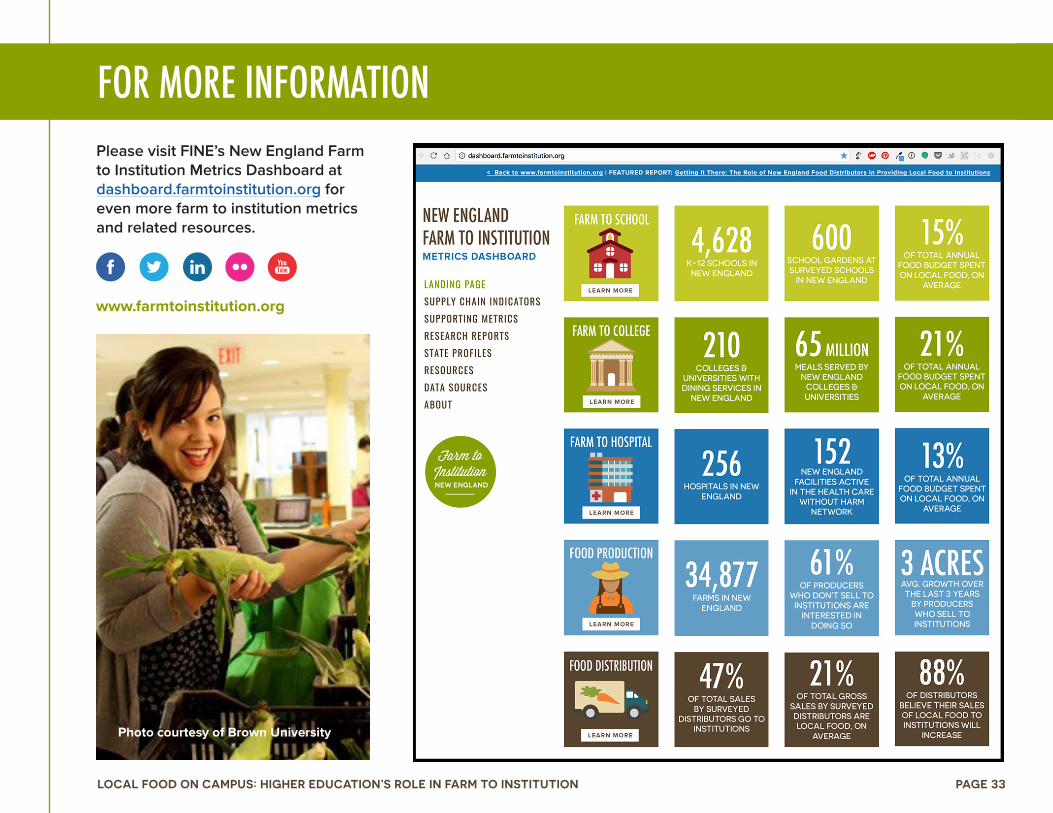
FOR MORE INFORMATIONPlease visit FINE’s New England Farm to Institution Metrics Dashboard at dashboard.farmtoinstitution.org for even more farm to institution metrics and related resources.
www.farmtoinstitution.org
Photo courtesy of Brown University

Farm toInstitutionNEW ENGLAND
www.farmtoinstitution.org
Feel free to email us with any questions or suggestions at [email protected]
THANKS FOR READING!