farm size in england and wales from early victorian … · farm size in england and from early...
TRANSCRIPT

/
Farm Size in England and from Early Victorian Times to
B), DAVID GRIGG
Wales the Present
T HE SIZE of farms cannot be said tO be a dominant theme in the agricultural history of modern England and
Wales; the three essays on agriculture in a recent economic history of modern Britain contain no more than one passing mention of changes in farm size,' whilst the topic does not receive much more notice in agricultural histories of modern England.'- Further, most of the work on farm size in the last half century has been done by agricultural economists rather than agricul- tural historians. There was a time, however, when historians were more concerned with farm size, and much of their interest was aroused by two books published at the beginning of this century. Herman Levy argued that between I75O and r 850 the small farm was largely extinguished by two forces, Parliamentary enclosure and the favourable movement of grain prices rela- tive to livestock prices. J L and Barbara Hammond's book The Villa2e Labourer reinforced the view that enclosure was fatal to the small farmer.3
No one now believes that the small farmer was totally eliminated between I7oo and 185 r. Sir John Clapham, using the Census
' E L Jones, 'Agriculture 17oo-q 8oo', in R Floud and D McCloskey (eds), The Economic Histor), qf Britain since 17oo, vol I, 17oo-186o, Cambridge, 1981, pp 6(:...-86; G Huecke], 'Agriculture during indnstrialisation', op eit, pp 18"-2o3; C O Grfda, 'Agricultural decline 186o-19|4', op eit, vol 2, 186o to the t97os, Cambridge, |981, pp 175-97.
" C S Orwin and E H Wlletham, History of British Agricuhure ~845- 1914, London, 1964, pp "-84-5; P J Perry, British Farmi,g in the Great Depression 187o-1914: an historical lleqeraph},, Newton Abbot, 1974, pp I o I-o4; Edith H Wbetham. The agrarian histar), of England and Wales, vol VIII, 1914-39, Cambridge, 1978, pl z 44-5; B A Holderness, British agricuhure since 1945, Manchester, 1985, pp 127--8. H Levy, Large al~d Small Holdings: a study q[ English agricultural economics, Cambridge, 1911; J L and Barbara Hammond, The Villaf.e Labourer, London, 191 I.
returns, was able to show that small farms, of over 5 acres and less than ~oo acres, were 62.5 per cent of all farms in England and Wales in I85I. 4 Since he wrote there has been comparatively little research on farm size in the eighteenth and early nineteenth centuries, but it seems agreed that there was a decline in the number of small farms and a growth of larger farms; however whilst Parliamentary enclosure may have often caused the demise of small farms, amalga- mation also went on in areas which had long been enclosed.5
Prior to the I85I Census and the com- mencement of the agricultural census in 1866 there were no national statistics on the size of farms in England and Wales. On the period since statistics are available adequate statistics on farm size were first collected by the Board of Agriculture in 1885 ~ there have been two divergent views. Levy, writing in IgltI, argued that the agricultural depression of the 188os and I89OS, with its falling cereal prices and relatively favourable prices for livestock products and vegetables, led to the reversal of the long-term trend towards large farms. 6 Some forty years later a number of writers argued that from the I88OS to the I93OS there had been a slow increase in the number of small farms, and a decline in the larger farms; this trend was then reversed, with the large farm increasing and the small farm
SirJolm Clapham, An economic histo U, of modern Britain:free trade atulstee1185o-1886, Cambridge, 1932, p 264. G E Mingay, 'The size of t;'mns in the eighteenth century', Eeon Hist Ret,,14, ,961-2, pp 469..-88; J R Wordie, 'Social change on the Levenson-Gower estates, 1714-1832' , Econ HistRet,, 2% 1974, pp 569-98;J V Beckctt, 'The debate over farm sizes in eighteenth- and nineteenth-century England', Agrieuhural Histor),, 68, 1983, pp 308-25,
¢' Levy, op eit, 1911,
I79

i8o
declining, v Others, possibly a majority, emphasized the stability of farm size struc- ture from the ~88os to the ~95os. 8 However since I945 there has been universal agree- ment that the large farm has increased at the expense of the small farm, although because of changes in the definition of a farm in the agricultural census since the I96os, it has been difficult to trace the more recent trends. 9
It seems worth reviewing the trends in farm size since I85I on a number of counts. First, there are several ways of measuring trends in farm size, and these can give apparently contradictory results. Thus it will be shown that although the large farm now occupies more of the agricultural area of England and Wales than it did in I 8 5 I ,
the structure of farm size is very little changed. Second, there have been important changes in the way statistics of farm size are collected, and failure to note this may lead to errors of interpretation. Thus some writers have commented on the dramatic decline in the number of small farms in the r96os and I97os without also noting that the Ministry of Agriculture removed more than 50,ooo holdings from the census after I967 .'° Third, it should be recalled that
7 D K Britton, 'Are holdings becoming largcr or smaller?', l:arm Economist, 6, 195o, I-'P 188-97; F W Bateson, 'Farm sizes and layout', in F W Bateson (ed). Tou,ards a Sochllist Agricuhm'e. London. 1946, pp IO&-a3. G P Hirsch, 'The size of farm holdings in England and Wales'. Farnt Econ, 9. 1958, Pp 84-9; M E l~.uthcrtbrd and (; P Hirsch. 'The size oftarm holdings in England and Wales', l:,n'm Econ, 8, 1955, pp 32-41; Sir E J l~,ussen, Agricultlm': today and tomorrow, 1945, p 6; E J Thomas, Introduction to A e.ricuhur.tl Eamonffcs, 1949; Viscount Astor and B Seebohm Rowntrce. British Agrictdturc; the principh's ql]lhmre polio'. Harmondsworfll. 19,19.
'~ 1) K Britton, 'Some explorations in the anah,,sis of king term changes in the structure of agriculture'. Jill A.~Iric l:,'cott. 28, t977, pp ] 97-209; D K Britton, The ch,u(¢i.g structure qfBrit#h agricMtun', Newton Abbot. 1968; 13 K Britton and K A lngcrscnt. 'Trends in concentration in British agriculture', Jill Agric/z'c0ll, 16, t964, pp 26-52; R C Hint, 'Structural policies and British agriculture', J d A qricEco., 24. 1973, pp 321-9; S A Robson. 'Agriculntrv structure in England and Walcs t955-1966; a quantitative analysis', FaiTh Econ, It, t97o, pp 46o-81; F G Sturrock and H J Gtmn, 'The development of large scale farming', llh'stminster Bank ReI,M+,, February, 1968, pp 59-65.
,o R Body, Agriculture: the triullq~h alld the sllame, 1982, p It; l) K Britton, 'Is there a case for titan income support?', in Centre for European Agricultural Studies, Agriclllturc: the triumph atld the shame: an indel~etldellt assessment, Centre tbr Agricultural Strategy, Reading, June, 1983.
THE AGRICULTURAL HISTORY REVIEW
between I885 and I975 there has been a substantial reduction in the area of crops and grass in England and Wales due mainly to urban expansion, and that this in itself would cause a considerable fall in the number of farms even in the absence of amalgamation. ''
I
There are various ways of measuring trends in the size of farms or agricultural holdings. One is to trace the changes in the total number o f holdings over time; unfortunately, for a number of reasons, this gives no necessary indication of changes in the total number of firms. Second, the average size of farms can be calculated by dividing the total area occupied by crops and grass on farms by the total number of farms. Again, this has defects: it conceals trends that there may be in different size classes, and exaggerates the importance of the smallest farms which make up a large proportion of all farms but account for a small proportion of the area occupied. A third method is to trace the absolute numbers in each of the size classes published by the Ministry of Agriculture, viz 5-5o acres, 5o--IOO acres, and so on; and a fourth way is to calculate the area occupied by each size class over time. But because there has been a considerable decline in the total area in crops and grass in England and Wales since the I88OS, due to the expansion of non-agricultural land uses, it is necessary to consider the strl:ctm'e of farm size; this can be done by calculating the percentage of the mlmber of holdings in each size class or the percentage of the area occupied by each size class. This distinction is important, for the structure by mmlbers showed little change from Victorian to recent times. On the other hand, there have been major changes in the structure by area.
By whatever means farm size is measured, the results depend upon the accuracy and
'~ R H Best, Land and living space, 1981.
FARM SIZE IN ENGLAND AND WALES
consistency of the statistical sources, which must now be considered.
II
The only comprehensive survey of the size of farms in England and Wales was taken at the population censuses of I851, I86I and 1871, when householders who returned their main occupation as farmer or grazier were asked to state the size of their farm. They were instructed to exclude upland hill pastures from the area and presumably it was the area in crops and grass only that was returned, although rough grazing in lowland areas may have been included. Some of the returns are those of retired farmers, thus inflating the numbers. J C Morton, however, believed that retired farmers were no more than 2 per cent of the total, although a later study of Huntingdon- shire put the figure nearer I2 per cent.'-" More important, only those who regarded farming as their major source of livelihood returned themselves as farmers. Yet it is certain that many small farms whose occupiers had another and more important form of employment were not included, and thus the smaller farms were under- stated. '3 The farm sizes of those who regarded themselves as farmers are con- tained in the enumerators' schedules for 1 8 5 1 , 1861 and 1871. However, comprehen- sive results at the county and national level were only published for 1851. The General Report printed the number and area for twenty-one size classes in England and Wales as a whole, whilst the number but not the area of farms in these size classes was published for each registration county. '4 The data collected for the 1861 and 187i censuses were not published for England and Wales, but in the 187I census the numbers in each size class for seventeen
': J C Morton, Labour, 1887, p 12; W Ogle, ' The alleged depopulation of the rural districts of England',jRSS, 52, ,889, pp 2o5-32.
'J Clapham, op cit, 1932, p 263. ,4 ,85t Census Great Britain, Age, Civil Condition, Occupations
and Birth Places, Vol I. Accounts and Papers, Vol 88, part I, 1852- 3 .
18i
counties, all .in eastern and southern England, were printed.'s
An agricultural census has been held in England and Wales every year since I866. Among the many items farmers have been required to enter upon a printed census form has been the size of their farm, or more accurately the size o ftheir agricultural holding. Forms have gone not to those on a list of farmers but, until 1892, to all occupiers of more than 1/4 acre of agricultural land and afterwards to occupiers of more than I acre. Until the late I97OS occupiers were asked to return only the acreage in crops and grass on their holding; since then not only crops and grass, but the total area, including woodland, rough grazing and all other land. From I912 tO 1975 data on the number of holdings in the classes I-5, 5-5o, 5O-lOO, IOO--3oo and 30o acres and over are available each year, and indeed for more classes in some years. But before I912 data for these same classes are only available at irregular intervals; I885 is the first year in which data for all these classes are available. Data on the area under crops and grass in each size class are available from the population census of I85I, and from the agricultural
.censuses of 1885, I895, I913, I915, 1924, I944 and more regularly since then. The boundaries of the class limits were changed in 1942; prior to 1942 the class limits were from 'over 5 acres to and including 2o acres' etc; after 1942 they were defined as '5 acres and under 20 acres' etc. The classes are referred to here, for convenience, both before and after 1942, as 5-20 acres, 20-5o acres, and so on. '6 Since I976 the number and area of holdings has been published in size classes measured in hectares, the class limits of which do not cor respond- - except for the small classes - - to the earlier acreage limits, whilst since 1979 data have been published only for total area, not for crops
'~ Census ql" Enqland and Wah,s, 1871. General Report, Vol 4, 1873, xliv-xlviii.
'~' Ministry of Agriculture, A Crntur), of Agricultural Statistics: Great Britain 1866-1966, HMSO, 1967.

I 8 2
and grass. Hence the continuity of the agricultural census data at the national level ends in I975.
The area included in the size of a farm does present problems. Where data are only available for the area of crops and grass on farms - - and this means most years before I979 ~ the size of upland farms in Wales, the Pennines and the North Yorkshire Moors may be understated. J T Coppock has used the census figures for I97O, which include rough grazing, to plot the distribution o ffarm sizes. ,7 There is however a further difficulty. In the I88os, z89os and z92os it is possible that some permanent grass was neglected and would subsequently be returned by the farmer as rough grazing; hence the area returned as crops and grass, and thus the size of the farm, would be reduced. Conversely in the period since r 94o it is possible that farmers have upgraded rough grazing, and thus the size of their farm is inflated as a result of redefinition rather than genuine enlargement. 18
There are however more difficult prob- lems in interpreting the trend in farm size. The population census data refer to farms but the agricultural census to holditLqs of agricultural land and the two are by no means the same. Many of the smaller agricultural holdings consisted of land not used for agricultural production, but accom- modation land for butchers and others, park land, private gardens and other such land. This problem may be partly overcome by eliminating from the analysis all holdings smaller than 5 acres. ''~
Perhaps more seriously many English farms are divided into two or more physi- cally distinct holdings, although run as one farm business. Until I922 occupiers were instructed to return a census form for each holding; thereafter, to return one form for eachJhrm, even if split into several holdings,
T HE A G R I C U L T U R A L HISTORY REVIEW
although to what extent they complied is unknown. It should also be noted that for the first forty years of the agricultural census, forms were collected by officials of the Customs and Excise, which may have encouraged evasion or inaccurate answers. The Ministry of Agriculture believes that the returns are reasonably accurate from the z 89os although occupiers were not required by law to return a form until r927. 2° Even then some holdings remained undetected. The rationing of animals feeds in z942 revealed a large number of hitherto unre- corded holdings, for the most part very small.
A third problem is that many of the agricultural holdings were ~ and a r e - part-time holdings. A number of surveys had indicated that a large proportion of all the holdings in England and Wales was farmed part-time, but it was not until I968 that the Ministry of Agriculture attempted to define full-time holdings and to remove part-time holdings from the published tables of holding size.-" Some 47,000 statistically insignificant holdings were deleted in r968 on the grounds that they occupied less than 4 hectares of agricultural land, had no employed workers and needed less than 26 standard man-days of work per year. The thresholds of full-time were raised in I973, and by I977 a further 9600 holdings had been excluded. In addition, farmers who had continued to return more than one form for what was a single farm business were instructed to return only one form in future. Hence from I968 onwards both the total number of holdings and the numbers in the smaller size classes are not directly comparable with the preceding years. The
,v j T Coppock, An A IMcuhural Atlas qfEnt, land and Wah's, 1976. ,x B E Cracknell, in discussion of Brittou and Ingersent, op tit, 1964. ,9 Ministry of Agriculture, The Agricultural Output qf l:,'nl!land and
Wales 19z5, HMSO, 1927, Cmd 2815.
:° E Thomas, 'Changes in the size of agricultural holdings in England aud Wales dr, ring the past ~oo years with particular attention to small holdings and the problem of small holdings', Proceedin~,s ~!1" the First hlternational Conference qf Agrictdmral Economists, 1929, pp 139-56.
2t Ministry of Agriculture, National Farnl Snrvey ofEn~land and Wah's (1041-43), a sunmtar), report, HMSO, 1946; J Ashton and B E Cracknell, 'Agricultural holdings and farm business structure in England and Wales',.Jnl Aj!ric Econ, 14, 1961,472-500.

FARM SIZE IN ENGLAND AND WALES
population census data for I85I in contrast only included occupiers of land for whom farming was their main source of liveli- hood. '-" Date
Hence there are dearly considerable prob- lems in interpreting the trend in the size of
1870 farms; indeed for most of the period it is i885 only holdings that can be traced. But, as 1895 already noted, the way in which trends are I915
measured can lead to differing interpre- I925
tations of change. These arenow considered. 1935 ~944
III I95r I96o
The total number of holdings of over 5 acres i966 rose slightly from I87o to r915 (Table I) 1975' and then declined by 27 per cent to I966, I983 by 46 per cent to I975; but much of the decline between r966 and r975 was due to the exclusion of holdings - - 47, ooo - - which were defined as statistically insignificant in I968. Three-quarters of the fall in the total number of holdings was accounted for by holdings of 5-50 acres. Some of the decline may be attributed to the return, after I922, of one form for several holdings, rather than a form for each holding. More important, the total area in crops and grass fell by over 21/2 million acres between i915 and I966 due largely to the conversion of farmland to urban uses. As much of this conversion was near towns, where farms are smaller than the national average, :3 some of the decline in numbers can be attributed to the elimin- ation of holdings rather than the amalga- mation of small holdings into larger units.
The mean size of agricultural holdings over 5 acres was remarkably constant from I885 tO I95I, with a slight decline to I925 and increase thereafter (Table I). After I95I there was an undoubted increase, although between I966 and I983 much of this was due to the exclusion of statistically insignificant holdings from the published data and the inclusion of rough grazing in
I83
TABLE i Total number of holdings over 5 acres,'
England and Wales, I87o-x983
Number Area" Average size (ooo acres) (acres)
336,497 338,715 342,649 342,7IO 330,425 312,5o3 295,247 296,332 273,I35 248,636 I86, I I6
I73,336
27,378 81 27,382 80 26,773 78 25,636 78 24,757 (79) 3 24, r36 82 24,25I 82 24,254 88 24, I54 97 23,536 I26 26,9215 155
' From I942 'o f 5 acres and over'. -" Crops and gi'ass on holdings of 5 acres and over. J There are no figt, rcs for the area on holdings over 5 acres
for 1935. An estimate for the arca of holdings of l to 5 acres has bccn deducted from the total area in crops and grass. Statistically insignificant holdings wcrc excluded from the tables after I968. Total farm area on all statistically significant holdings.
Sources: Ministry of Agriculture and Fisheries, The Agriodtural Output q/'En~/and and Wales 1925, HMSO 1927, Cmd 2815; Ministry of Agriculture, Fisheries and Food, A Cent,lr}, qf Agrictdtural Statistics, Great Britain, 1866-1966, HMSO, 7968; Agricultural Statistics, Great Britain, 1866-1966, HMSO, I968; Agricldttwal Statistics, England and H/ah's 1975, HMSO, 1976; Agricldttwal Statistics, United Kingdom, 1983, HMSO, 1984.
the area in holdings in the figure for I983. In addition it should be noted that Acts of I957 and I967 attempted to accelerate the demise of small, uneconomic holdings by paying part of the costs of amalgamation and offering annuities to farmers who retired. They do not seem to have had a marked impact. 24 The figures for mean size of holding confirm the impression of stability from the late nineteenth century
"" Ministry of Agriculture, The dlanging structure qf ai!riculture 1968- 1975, x977; Agricultural Statistics 1978-9 Emlland. HMSO, t981.
'~ P G Craigie, 'The size and distribution of agricultural holdings in England and abroad',JRSS. 5o. 1987, pp 8(v-149. :4 Robson, op tit, 197o.

z84
until z95I which has been noted by many writers.
From the z88os the number of holdings of 5-).o acres has been in continuous decline (Fig z). But of the classes over 2o acres,
t26,000
¢ I00,000
'~ 75,000
!-
50.000-
5000"
1870
THE AGRICULTURAL HISTORY REVIEW
5-201c,e~
20-5Oac,es lO0-300acfel
- acre
~.. ore1 3 o o ac,es /
ore, 500 a tie ~_~...~..---~
FIGURE I
Changes in the number of holdings in each size class, z87o--I975
those beneath 300 acres increased from the z88os until the I92os and then declined, whilst in contrast the number of holdings over 3o0 acres declined until the I92os and thereafter increased. It is possible that some of this latter change is due to changes in the definition of rough grazing by farmers. But it must also be recalled that there was a marked fall in the area of crops and grass over this period (Table 2A). Hence the percentage of the number of holdings in each size class may be a better indicator of change (Table 213). The relative importance of small, medium and large holdings, by numbers, changed little between I885 and I96o; it is possible to extend this comparison to z85I and I975. Part-time farms were not included in the population census data of I85T; between r968 and I975 the Ministry
of Agriculture excluded a large number of small and part-time holdings, and exhorted farmers with separate holdings to return one form. By z975 a holding must have been near to being the same as a farm and the two years can thus be compared. In r 85 r the proportion of the number of farms in each size class under 3oo acres except that of 50--roo acres was slightly less than in I975 (Table 3a). Each size class over 300 acres was slightly more. But the differences are small and it is possible to claim that there was little change in the Mative importance of each size class by numbers between 185 I and z975 (Table 3a).
Large changes in the number of small holdings may have little effect on the area occupied by the size classes. Conversely, comparatively small changes in the number of large holdings may influence the area in that class very substantially. Hence trends in farm size may be usefully analysed by considering the area occupied by each size class. In Fig 2 the major changes are the slow increase in the area occupied by medium-sized farms (IOO--3oo acres) until
12.000" 11500" I t.O O0 - 10.500" ? tO000' 95O0"
o 8500 80OO 75O0 70O0 65O0 ore, 300 ac,e~. ~ooo ~ 5 5 0 0 ~ 5000 o
4000 a500 or*, 5OO ~,~
3000 20-50=¢res . . . .
2 O 0 0
tSo0 5 - 2O m c , e ~
~o~ over *000 oc,el
5O0
0 ,
,875,aBo ,8'90 ,;oo ,o',o ,~?o ,9'3o , ; ,o ,;5o ,,;Go ,o'~o i~eo
FIGURE 2
Changes in the area in crops and grass occupied by holdings in each size class
1875-I 975

iil
Date
FARM SIZE IN ENGLAND AND WALES
TABLE 2 Eng land and Wales 1851-1983
A: Area ql'crops and grass occupied by small, medium and laa~e holdings Crops and grass' Small Medium Large
(ooo acres) (5-Ioo acres) Ooo-3oo acres) (over 3oo acres)
I85I 24,660 21.6 44.7 33.7 1885 27,379 28.9 42. I 29.0 I895 27,382 29.5 42.6 27.8 1915 26,773 3I.I 44. I 24.7 1924 25,636 32.6 44.3 23.1 I944 24, I36 3I.O 44.8 24.2 I95I 24,25I 30.8 44.o 25.2 I96O 24,254 28.7 42.9 28.4 I966 24, I54 25.6 40.5 33.4 I975 23,537 I9.8 37.5 42.7 I983 = 26,954 I4.4 31.8 54.3
B: Number qf small, medimn and Im:¢e Total tmntbers ' %
(ooos)
holdings
185
I851 215,615 62.5 29.7 7.8 1 8 7 o 336,497 76.6 23.4 I885 338,715 75.3 19.8 4.9 I895 342,649 75-3 i9.9 4.8 I915 324,71o 75.5 2o.3 4.2 I925 33o,425 75.7 2o.4 3.8 t944 295,247 73.7 22.2 4.1 I951 296,332 73.9 2x.8 4.3 I 9 6 O 273,135 72.0 22.9 5.0 I966 248,636 7o.I 23.5 ~.4 I975 I86,116 62. 5 28.0 9.5 I983: I85,993 59.6 26.7 I3.7
' Area and ,mmbers of holdings of 5 acres and over. -' Includes all statistically significant holdings and is of total area; figures for over 3oo
acres are an estimate.
Sources: 18.551 Cellsus, Great Britain. Age, civil condition, occupations, and birth places, Vol I, Accounts and Papers, Vol 88, pt 1, I852-3; Ministry of Agricuhure and Fisheries, The Agricldmral Ontput of England and Wah's 1925, HMSO, 1927, Cmd 2815; Ministry of Agriculture, Fisheries and Food, A Cemury qfA,~ricuhural Statistics, Great Britain, 1866"-1966 , HMSO, t968; Agricultural Statistics, England mid Wales, 197.5, HMSO, 1976; Agricldmral Statistics, United Ki,k, dom, 1o83, HMSO, x984.
the First World War and the steady decline thereafter, and the dramatic decline of the larger farms (over 300 acres) from the I88OS to the I92Os and the equally dramatic rise since 1944. The trends in the area occupied by the other smaller classes have been less marked but they have declined since the
I92OS. It should be recalled that there was a considerable decline in the total area of crops and grass from the I88OS onward. Hence the relative importance of each size group must be examined (Table 2A). From 1885 until 1924 the percentage of the area occupied by small- and medium-sized farms
"c
I86 THE AGRICULTURAL HISTORY REVIEW
TABLE 3 Eng l and and Wales I85I and I975
Size (a) Number of holdings (acres)
1851 % 1975 % 1851
(b) Area of crops and grass
% 1975 %
5-2o 42,315 I9.8 36,595 20-50 47,829 21.9 38,883 5o-Ioo 44,558 20.7 40,780 I00--15 ° 29,020 I3.5 23,453 I50-3oo 35, I33 I6.3 28,671 3oo-50o 11,646 5.4 m,646 50o-70o 3,076 1.4 3,560 7oo--Iooo 1,267 0.6 2,031 Iooo & 77t 0.4 1,497 o v e r
I9.7 523,905 20.9 t,598,945 21.9 3,2o6,45I I2.6 3,627,500 I5.4 7,388,275 5.7 4,360,925 1.9 1,8o2,3oo 1.~ 1,o38,75o 0.8 t,123,3oo
215,615 IOO 186, I16 IOO 24,66o,35t
2. I 423,973 1.8 6.5 1,29o,919 5.5
I3.o 2,945,38I x2.5 t4. 7 2,857, II2 I2.2 3o.0 5,974,435 25.4 1 7 . 7 4,o29,221 17.1 7.3 2,o72,o2i 8.8 4.2 1,669,514 7.0 4.5 2,273,678 9.7
~oo 23,536,253 ioo
Soui'ces: t851 Census, Great Britain. Age, civil condition, occupations and birth places, Vol l, pt I, ~852-3; Ministry of Agriculture. Fisheries and Food, Agricultural Statistics, Englamt amt Wah's,
Accounts and Papers, Vol 88,
1975, HM80, 1976.
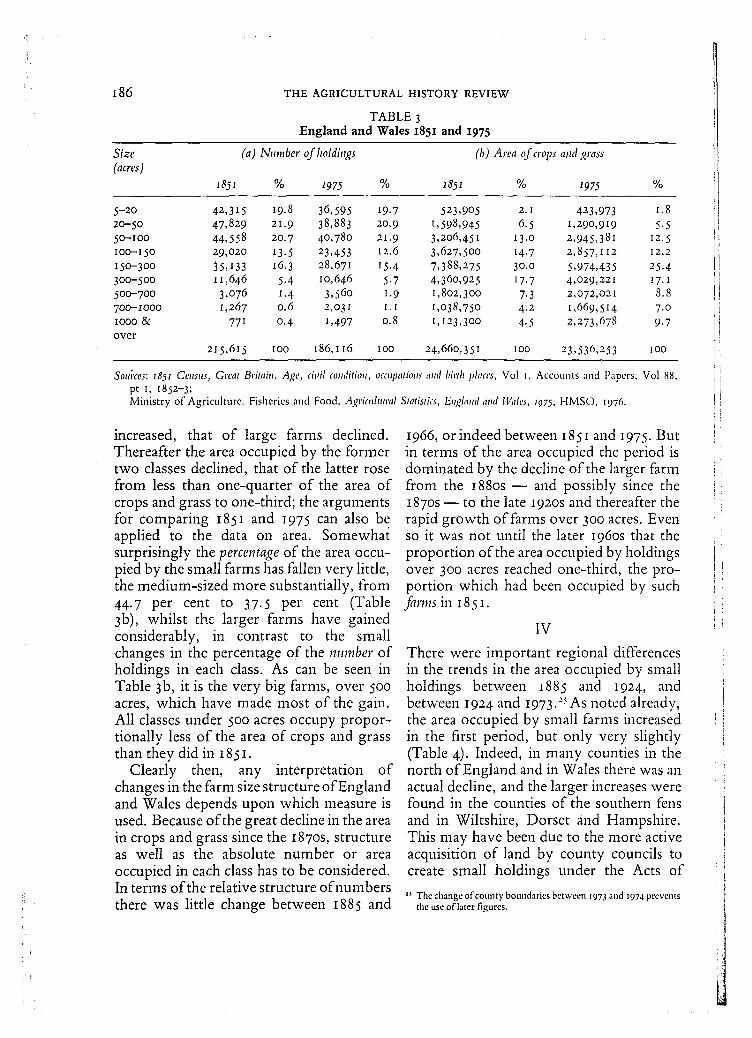
increased, that of large farms declined. Thereafter the area occupied by the former two classes declined, that of the latter rose from less than one-quarter of the area of crops and grass to one-third; the arguments for comparing 1851 and 1975 can also be applied to the data on area. Somewhat surprisingly the percentage of the area occu- pied by the small farms has fallen very little, the medium-sized more substantially, from 44.7 per cent to 37.5 per cent (Table 3b), whilst the larger farms have gained considerably, in contrast to the small changes in the percentage of the number of holdings in each class. As can be seen in Table 3b, it is the very big farms, over 500 acres, which have made most of the gain. All classes under 50o acres occupy propor- tionally less of the area of crops and grass than they did in I851.
Clearly then, any interpretation of changes in the farm size structure of England and Wales depends upon which measure is used. Because of the great decline in the area in crops and grass since the 187os, structure as well as the absolute number or area occupied in each class has to be considered. In terms of the relative structure of numbers there was little change between 1885 and
1966, or indeed between 1851 and 1975. But in terms of the area occupied the period is dominated by the decline of the larger farm from the I88OS - - and possibly since the I87OS - - to the late I92OS and thereafter the rapid growth of farms over 3oo acres. Even so it was not until the later I96OS that the proportion of the area occupied by holdings over 3oo acres reached one-third, the pro- portion which had been occupied by such farms in 1851.
IV
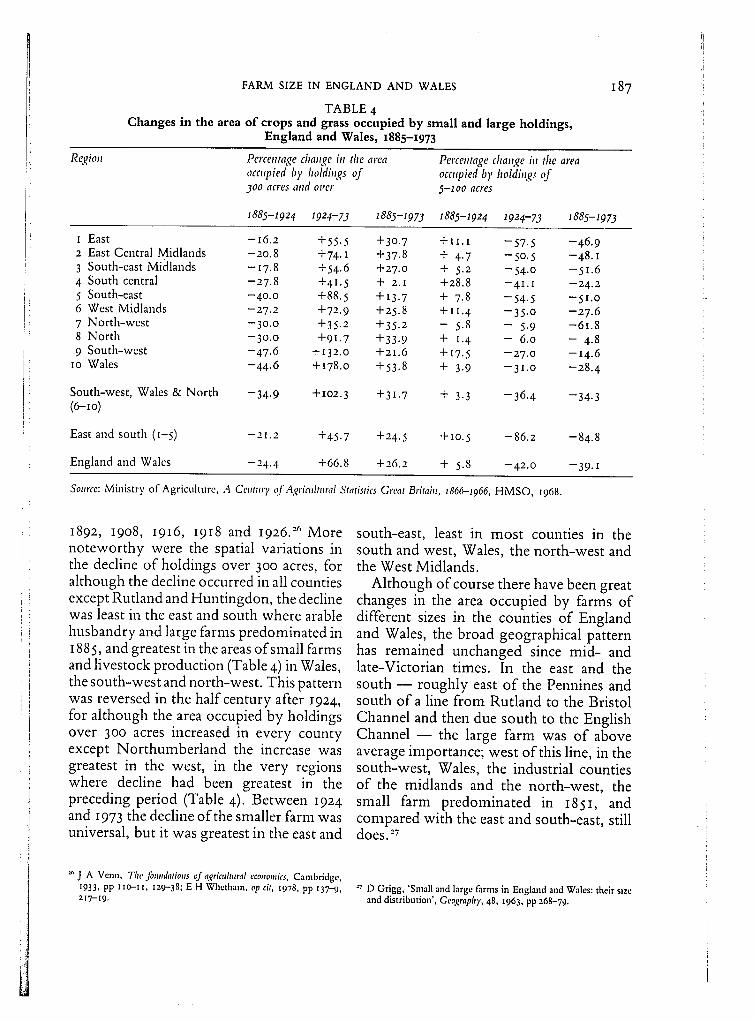
There were important regional differences in the trends in the area occupied by small holdings between 1885 and I924, and between 1924 and I973. "s As noted already, the area occupied by small farms increased in the first period, but only very slightly (Table 4). Indeed, in many counties in the north of England and in Wales there was an actual decline, and the larger increases were found in the counties of the southern fens and in Wiltshire, Dorset and Hampshire. This may have been due to the more active acquisition of land by county councils to create small holdings under the Acts of
:s The change o f county boundaries be tween 1973 and 1974 prevents the use o f later f igures.
i , i I
FARM SIZE IN ENGLAND AND WALES
Changes in the area TABLE 4
o f crops and grass occupied by small and large holdings, E n g l a n d and Wales, 1885-1973
187
Region Percentage change in the area occnpied by holdings of 3oo acres attd over
Percentage change in the area occupied b), holdings of 5-1oo acres
1885-1924 1924-73 1885-1973 1885-1924 1924-73 1885-1973
I East - I 6 . 2 +55.5 +30.7 +I I .1 --57.5 -46 .9 2 East Central Midlands -20 .8 +74. I +37.8 + 4.7 -50 .5 - 4 8 . I 3 South-east Midlands - I 7 . 8 +54.6 +27.0 + 5.2 -54 .o -51 .6 4 South central -27 .8 +41.5 + 2. I +28.8 - 4 I . I -24 .2 5 South-east -4o .o +88.5 +13.7 + 7.8 -54 .5 -51 .o 6 West Midlands -27 .2 +72.9 +25.8 +11. 4 -35 .0 -27 .6 7 North-west -30 .0 +35.2 +35.2 - 5.8 - 5.9 -61 .8 8 North -3o .o +91.7 +33.9 + 1.4 - 6.0 - 4.8 9 South-west -47 .6 +132.o +21.6 +I7.5 -27 .o - I 4 . 6
lO Wales -44 .6 +I78.o +53.8 + 3.9 -31 .o -28 .4
South-west, Wales & North -34 .9 +1o2.3 +31.7 + 3.3 -36 .4 -34.3 (6-io)
East and south (I-5) -21 .2 +45.7 +24.5 +IO.5 -86 .2 -84 .8
England and Wales -24 .4 +66.8 +26.2 + 5.8 -42 .0 - 3 9 . I
Source: Ministry of Agriculture, A Cemury of Agricuhural Statistics Great Britain, 1866-1966, HMSO, I968.
1892 , 19o8, 1916, 1918 and 1926. -'6 More noteworthy were the spatial variations in the decline of holdings over 300 acres, for although the decline occurred in all counties except Rutland and Huntingdon, the decline was least in the east and south where arable husbandry and large farms predominated in 1885, and greatest in the areas of small farms and livestock production (Table 4) in Wales, the south-west and north-west. This pattern was reversed in the half century after I924, for although the area occupied by holdings over 300 acres increased in every county except Northumberland the increase was greatest in the west, in the very regions where decline had been greatest in the preceding period (Table 4). Between 1924 and 1973 the decline of the smaller farm was universal, but it was greatest in the east and
south-east, least in most counties in the south and west, Wales, the north-west and the West Midlands.
Although of course there have been great changes in the area occupied by farms of different sizes in the counties of England and Wales, the broad geographical pattern has remained unchanged since mid- and late-Victorian times. In the east and the south - - roughly east of the Pennines and south of a line from Rutland to the Bristol Channel and then due south to the English Channel - - the large farm was of above average importance; west of this line, in the south-west, Wales, the industrial counties of the midlands and the north-west, the small farm predominated in 1851, and compared with the east and south-east, still does. ~7
~J A Venn, The foundations of agricuhural ecom, mics, Cambridge, I933, pp IIO--II, b'-9--38; E H Whetham, op cit, 19'78, pp H7-9, 217-x9.
:v D Grigg, 'Small and large farms in England and Wales: their size and distribution', Geography, 48, I963, pp 268-79.
I88
V
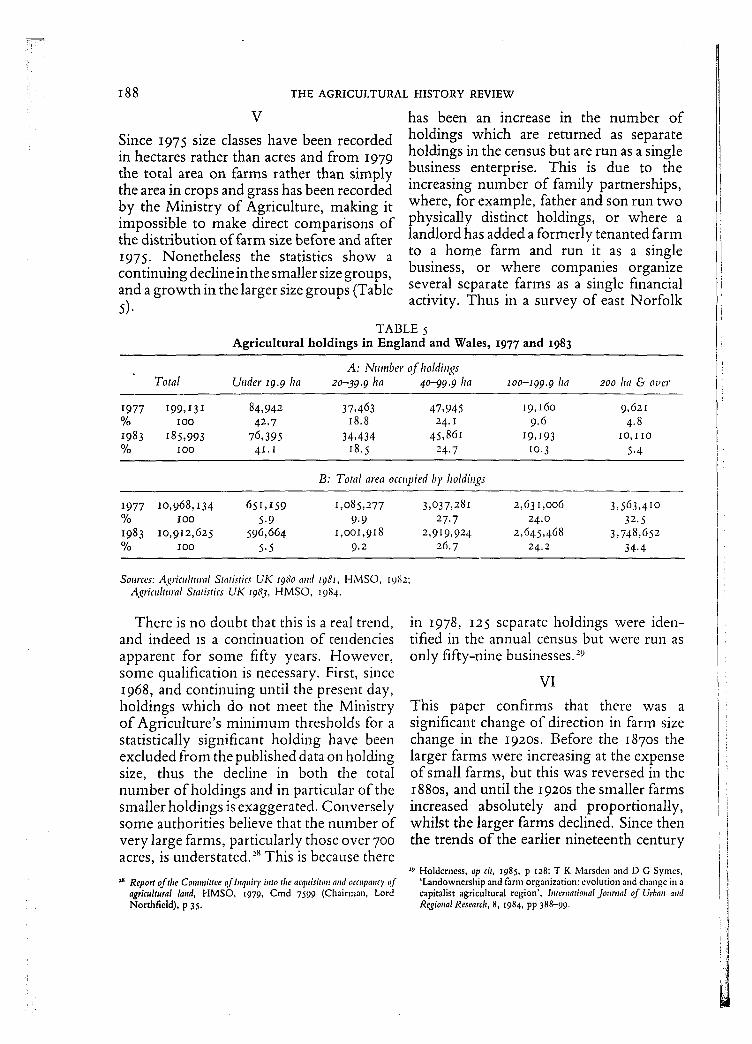
Since 1975 size classes have been recorded in hectares rather than acres and from 1979 the total area on farms rather than simply the area in crops and grass has been recorded by the Ministry of Agriculture, making it impossible to make direct comparisons of the distribution of farm size before and after r975. Nonetheless the statistics show a continuing decline in the smaller size groups, and a growth in the larger size groups (Table 5).
THE AGRICULTURAL HISTORY REVIEW
has been an increase in the number of holdings which are returned as separate holdings in the census but are run as a single business enterprise. This is due to the increasing number of family partnerships, where, for example, father and son run two physically distinct holdings, or where a landlord has added a formerly tenanted farm to a home farm and run it as a single business, or where companies orgamze several separate farms as a single financial activity. Thus in a survey of east Norfolk
TABLE 5 Agricultural holdings in England and Wales, 1977 and 1983
A: Number qf holdings Total Under 19. 9 ha 2o-39. 9 ha 40-99.9 ha 1o0-199. 9 ha 2oo ha & over
I977 I99,I31 84,942 37,463 47,945 I9,16o 9,62i % Ioo 42.7 18.8 24. I 9.6 4.8 I983 I85,993 76,395 34,434 45,86I I9,193 IO, I Io % IOO 4I . I 18.5 24.7 10.3 5.4
B: Total area occupied by holdings
I977 Io,968, I34 65I , I59 I,O85,277 3,o37,28I 2,63 I,oo6 3,563,4io % Ioo 5.9 9-9 27.7 24.o 32.5 I983 Io,912,625 596,664 I,OOI,918 2,919,924 2,645,468 3,748,65z % Ioo 5.5 9.2 26.7 24.2 34.4
i ~ i i
Sources: Agriculttlral Statistics UK t98o and 198t, HMSO, 1982; Agricldtural Statistics UK 1983, HMSO, 1984.
There is no doubt that this is a real trend, and indeed is a continuation of tendencies apparent for some fifty years. However, some qualification is necessary. First, since r968, and continuing until the present day, holdings which do not meet the Ministry of Agriculture's minimum thresholds for a statistically significant holding have been excluded from the published data on holding size, thus the decline in both the total number of holdings and in particular of the smaller holdings is exaggerated. Conversely some authorities believe that the number of very large farms, particularly those over 700 acres, is understated. "-~ This is because there
~ Report of the Committee of lnquiry into the acquisiton and occupancy o]" agricultural land, HMSO, x979, Cmd 7599 (Chairman, Lord Northfield), p 35.
in I978, I25 separate holdings were iden- tiffed in the annual census but were run as only fifty-nine businesses.-'9
VI
This paper confirms that there was a significant change of direction in farm size change in the I92os. Before the I87OS the larger farms were increasing at the expense of small farms, but this was reversed in the r88os, and until the I92os the smaller farms increased absolutely and proportionally, whilst the larger farms declined. Since then the trends of the earlier nineteenth century
a9 Holderness, op tit, I985, p 128; T K Marsden and D G Symes, 'Landownership and farm organization: evolution and change in a capitalist agricultural region', haternational Journal of Urban and Regional Research, 8, 1984, pp 388-99.
FARM SIZE IN ENGLAND AND WALES 189
have re-established themselves, although it was not until the mid-I96os that farms over 300 acres occupied the same proportion of crops and grass as they had in I85I, whilst as late as I975 the numerical structure of English farming showed little difference from I85I. Changes in the measurement of farm size and the deletion from the census of statistically insignificant and minor holdings since I968 makes it difficult to continue the analysis on a consistent basis but there seems
little doubt that. the growth of the large farm at the expense of both small- and medium-sized farms continues. In I983 I3 per cent of the holdings accounted for over half the total land occupied by statistically significant holdings in England and Wales. But just as the agricultural holding has never been synonymous with the farm, so it would seem that changing patterns of farm business may soon require yet further changes in definition.
J

: i
i i
Subscriptions: $15.00 for individuals; $25.00 for institutions; $8.00 for students. Back issues available for $7.50. Add $2.00 for foreign orders.
University of California Press Periodicals, 2120 Berkeley Way, Berkeley, CA 94720