california region regional composite regional data report jan – jun 2015 vs. 2014
TRANSCRIPT

CALIFORNIA Region
Regional Composite
REGIONALDATA REPORT
JAN – JUN2015 vs. 2014

2
Methodology
• IRI gathers chain-wide sales across all RMAs (Retail Market Areas)– Regional Composite Reports reflect multi-outlet retail data. Multi-outlet reporting
includes an aggregation of the following channels: grocery, mass, club, drug, dollar and military
• Average Selling Price (ASP) is not Advertised Retail Price– Average selling price is the average of all prices including coupons, promotional
pricing, club/loyalty card deals that are given at the register at the time of purchase
• Categories:– Avocados– Total Produce: Includes avocados
• Timeframe: YTD Q2 (January – June) 2015
• Retail data provided by IRI / FreshLook Marketing– *HAB's calculation based in part on data reported by Information Resources, Inc. through its Freshlook
Service for the Avocado category for Multi-Outlet (MULO). The information is believed to be reliable at the time supplied by IRI but is neither all-inclusive nor guaranteed by IRI. Without limiting the generality of the foregoing, specific data points may vary considerably from other information sources.
• Important Note: IRI / FreshLook Marketing periodically restates retail data, therefore this review cannot be compared or used in conjunction with prior reviews

3
California Region: Highlights - YTD Q2
• Overview based on the following geography:– The California Region captures the Markets of Los Angeles, Sacramento, San Diego
and San Francisco, plus additional cities not included in Markets
• 2015 vs. 2014, avocado dollars in California grew +13%, on par with the Total U.S. growth rate– Avocado dollars outpaced total produce (+5%) by +7 points– Category units increased +20%– Category average selling price (ASP) decreased -7% to $1.00/unit– X-Large Hass avocados (PLU 4770) drove dollar growth in CA, adding nearly $6MM to
the category– Small Hass avocados (PLU 4046) drove category volume adding over +15MM units
– Small Hass avocado ASP decreased -10% to $0.75/unit
• California posted the second highest dollars and units per store per week– California averaged $813 and 816 units per store per week through Q2 2015
4
California: YTD Q2 - Avocados vs. Total Produce
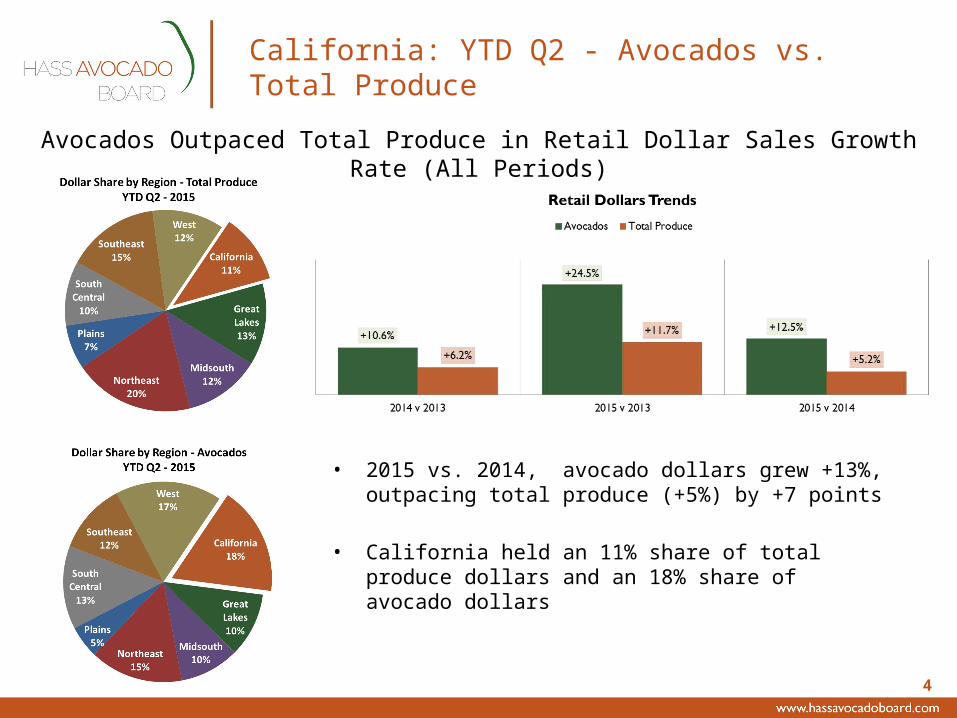
• 2015 vs. 2014, avocado dollars grew +13%, outpacing total produce (+5%) by +7 points
• California held an 11% share of total produce dollars and an 18% share of avocado dollars
Avocados Outpaced Total Produce in Retail Dollar Sales Growth Rate (All Periods)

5
California: YTD Q2 Avocado Retail Overview
• 2015 vs. 2014, Category dollars grew +13%– Units grew +20%
• 2015 vs. 2014, Category average selling price (ASP) decreased -7% to $1.00/unit
California Avocado Sales Posted Double-Digit Growth in Dollars and Units (2015 vs. 2014)

6
RETAIL DOLLARS
PLU Description 2014 2015 Variance 2014 2015 Variance
4046 Small Hass #60 sizes & smaller 56,582,326$ 62,257,543$ +10.0% 253,434,027$ 285,990,209$ +12.8%
4225 Large Hass #40 & #48 sizes 68,949,029$ 69,692,157$ +1.1% 389,686,532$ 413,086,630$ +6.0%
4770 X-Large Hass #36 sizes & larger 4,853,391$ 10,845,058$ +123.5% 31,826,619$ 44,757,598$ +40.6%
Other Greenskins, Pinkertons, non-Hass PLUs 18,509$ 1,295,955$ +6901.9% 21,396,246$ 21,987,911$ +2.8%
Organic All Organic PLUs 4,200,355$ 5,174,432$ +23.2% 19,462,786$ 22,988,428$ +18.1%
Bags All bagged PLUs 11,453,373$ 15,098,704$ +31.8% 113,017,948$ 143,651,329$ +27.1%
146,056,982$ 164,363,849$ +12.5% 828,824,158$ 932,462,106$ +12.5%
RETAIL UNITS
PLU Description 2014 2015 Variance 2014 2015 Variance
4046 Small Hass #60 sizes & smaller 67,824,166 83,224,159 +22.7% 297,106,683 368,944,679 +24.2%
4225 Large Hass #40 & #48 sizes 50,768,088 53,086,605 +4.6% 289,296,532 322,478,032 +11.5%
4770 X-Large Hass #36 sizes & larger 2,106,908 4,729,922 +124.5% 16,754,415 24,798,131 +48.0%
Other Greenskins, Pinkertons, non-Hass PLUs 14,978 3,227,483 +21448.8% 11,776,080 14,847,801 +26.1%
Organic All Organic PLUs 2,714,432 3,588,328 +32.2% 11,568,789 14,659,214 +26.7%
Bags All bagged PLUs 13,628,108 17,199,774 +26.2% 121,245,656 157,177,068 +29.6%
137,056,680 165,056,271 +20.4% 747,748,154 902,904,926 +20.7%
AVERAGE SELLING PRICE (ASP) / UNIT
PLU Description 2014 2015 Variance 2014 2015 Variance
4046 Small Hass #60 sizes & smaller $0.83 $0.75 -10.3% $0.85 $0.78 -9.1%
4225 Large Hass #40 & #48 sizes $1.36 $1.31 -3.3% $1.35 $1.28 -4.9%
4770 X-Large Hass #36 sizes & larger $2.30 $2.29 -0.5% $1.90 $1.80 -5.0%
Other Greenskins, Pinkertons, non-Hass PLUs $1.24 $0.40 -67.5% $1.82 $1.48 -18.5%
Organic All Organic PLUs $1.55 $1.44 -6.8% $1.68 $1.57 -6.8%
Bags All bagged PLUs $0.84 $0.88 +4.5% $0.93 $0.91 -2.0%
$1.07 $1.00 -6.6% $1.11 $1.03 -6.8%
TOTAL CATEGORY UNITS
Total U.S.California
JAN
UA
RY -
JUN
E: 2
014
vs 2
015
CATEGORY ASP ($/Unit)
Total U.S.California
TOTAL CATEGORY DOLLARS
Total U.S.California
California vs. Total U.S. - YTD Q2 PLU Comparisons
• Avocado dollar sales in CA increased +13% on par with the Total U.S. growth rate
– Volume increased +20%, also on par with the Total U.S. growth rate
• X-Large Hass avocados (PLU 4770) drove dollar growth in CA, adding nearly $6MM to the category
– Small Hass avocados (PLU 4046) drove category volume adding over +15MM units
– Small Hass avocado ASP decreased -10% to $0.75/unit
California on Par with Total U.S. in Volume Sales Growth Rate
7
California: YTD Q2 Category Per Store Per Week Averages
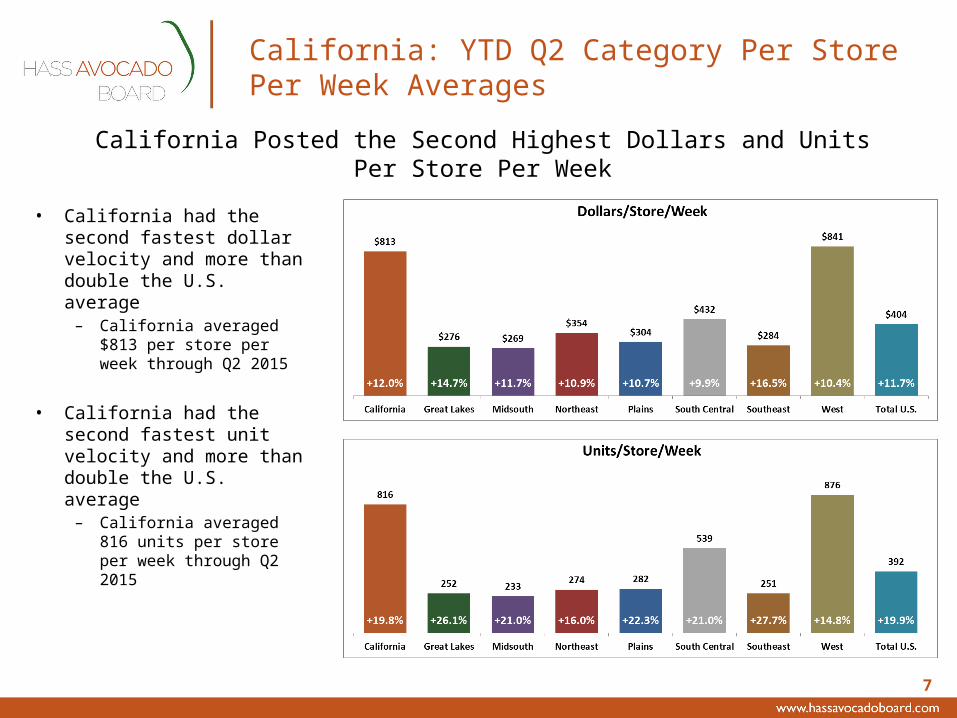
• California had the second fastest dollar velocity and more than double the U.S. average– California averaged
$813 per store per week through Q2 2015
• California had the second fastest unit velocity and more than double the U.S. average– California averaged 816
units per store per week through Q2 2015
California Posted the Second Highest Dollars and Units Per Store Per Week

8
California: 2013-Q1 through 2015-Q2Units vs. ASP
• Retail Units– The peak quarter was 2015-Q2 at 85MM units when ASP was $1.02/unit– The lowest quarter was 2013-Q4 at 58MM units when ASP was at $1.05/unit
• ASP– Lowest ASP to date occurred during 2013-Q1, $0.88/unit– Highest ASP to date occurred during 2014-Q3 at $1.19/unit