west region regional composite regional data report jan – mar 2013 vs. 2012
TRANSCRIPT
WEST Region
Regional Composite
REGIONALDATA REPORT
JAN – MAR2013 vs. 2012

2
Methodology
• Sales and Market Data is obtained using CAST (Category Avocado Sales Trend)– IRI gathers chain-wide sales across all RMAs (Retail Market Areas)
• Starting in 2013, the IRI Regions reflect an expanded retail data set which includes sales and volume from Walmart, Sam’s Club, Target and BJ’s, in addition to traditional grocery retailers
– Data is entered into CAST system– Using CAST, data is queried and reported approximately every 4 weeks
• Average Selling Price (ASP) is not Advertised Retail Price– Average selling price is the average of all prices including coupons, promotional
pricing, club/loyalty card deals that are given at the register at the time of purchase
• Categories: Total Avocados, Fruit = Total Fruit excluding Avocados, Produce = Total Produce including Avocados
• Timeframe: YTD Q1 (January – March) 2013
• Retail data provided by IRI / FreshLook Marketing
• Important Note: IRI / FreshLook Marketing periodically restates retail data, therefore this review cannot be compared or used in conjunction with prior reviews

3
West: Region Highlights - YTD Q1
• Overview based on the following geography:– The West Region captures the Markets of Denver, Phoenix, Portland, Salt Lake City,
Seattle and West Texas/New Mexico, plus additional cities not captured in Markets
• West Overview– Avocado retail dollar average trends through Q1 outpaced Fruit and Produce retail
dollar trends – Category dollars grew +5% in 2012 and +13% in 2013 for a net growth of +19%
over 2011– Category units grew +15% in 2012 and +18% in 2013 for a net growth +36% over
2011– Category average selling price (ASP) declined -9% in 2012 and -4% in 2013 to
$0.84/unit
• West Per Store Averages– 2013 Average dollars of $10,262 per store were +19% higher than 2012 and +24%
higher than 2011– 2013 Average units of 12,268 per store were +24% higher than 2012 and +42%
higher than 2011
• West versus Total U.S. trends– WE category unit growth of +18% was on par with the national average– WE category dollar trend of +13% was -1 point lower than the national average– WE 2013 category ASP of $0.84/unit was -12% lower than the national average of
$0.95/unit

4
West: YTD Q1 Retail Dollar Trend ComparisonsAvocados vs. Fruit vs. Produce
• Avocado retail dollar trends through Q1 outpaced Fruit and Produce retail dollar trends
– 2012 versus 2011, Avocados outpaced Fruit by +7 points and Produce by +5 points
– 2013 versus 2012, Avocados outpaced Fruit by +6 points and Produce by +6 points
– 2013 versus 2011, Avocados dollars grew +19%, which outpaced Fruit by +13 points and Produce by +12 points

5
West: YTD Q1 Avocado Retail Overview
• Category dollars grew +5% in 2012 and +13% in 2013 for a net growth of +19% over 2011
• Category units grew +15% in 2012 and +18% in 2013 for a net growth +36% over 2011
• Category average selling price (ASP) declined -9% in 2012 and -4% in 2013 to $0.84/unit

6
West vs. Total U.S.YTD Q1 PLU Comparisons
• WE category unit growth of +18% was on par with the national average
– WE growth was primarily driven by PLU 4225, which grew +14 million units
• WE category dollar trend of +13% was -1 point lower than the national average
– WE lower trend was primarily driven by PLU 4046, which declined -$11 million
• WE 2013 category ASP of $0.84/unit was -12% lower than the national average of $0.95/unit
RETAIL UNITS
PLU Description 2012 2013 Variance 2012 2013 Variance
4046 Small Hass #60 sizes & smaller 36,701,845 29,540,598 -19.5% 133,247,079 119,044,419 -10.7%
4225 Large Hass #40 & #48 sizes 15,942,516 29,712,354 +86.4% 119,026,672 158,354,709 +33.0%
4770 X-Large Hass #36 sizes & larger 210,594 1,161,010 +451.3% 5,502,382 16,917,549 +207.5%
Other Greenskins, Pinkertons, non-Hass PLUs 376,431 210,746 -44.0% 6,335,471 7,492,536 +18.3%
Organic All Organic PLUs 1,038,530 1,444,453 +39.1% 3,199,068 3,853,907 +20.5%
Bags All bagged PLUs 4,177,641 6,799,880 +62.8% 32,373,348 46,763,688 +44.5%
58,447,557 68,869,041 +17.8% 299,684,020 352,426,808 +17.6%
RETAIL DOLLARS
PLU Description 2012 2013 Variance 2012 2013 Variance
4046 Small Hass #60 sizes & smaller 27,652,635$ 17,112,970$ -38.1% 100,148,136$ 84,147,417$ -16.0%
4225 Large Hass #40 & #48 sizes 17,508,264$ 31,287,076$ +78.7% 138,952,815$ 173,721,214$ +25.0%
4770 X-Large Hass #36 sizes & larger 573,664$ 1,878,181$ +227.4% 9,620,950$ 20,100,889$ +108.9%
Other Greenskins, Pinkertons, non-Hass PLUs 230,071$ 164,870$ -28.3% 11,775,767$ 12,547,258$ +6.6%
Organic All Organic PLUs 1,582,224$ 2,068,667$ +30.7% 5,099,018$ 6,034,480$ +18.3%
Bags All bagged PLUs 3,459,863$ 5,100,271$ +47.4% 26,768,770$ 36,808,118$ +37.5%
51,006,721$ 57,612,034$ +12.9% 292,365,456$ 333,359,376$ +14.0%
AVERAGE SELLING PRICE (ASP) / UNIT
PLU Description 2012 2013 Variance 2012 2013 Variance
4046 Small Hass #60 sizes & smaller $0.75 $0.58 -23.1% $0.75 $0.71 -6.0%
4225 Large Hass #40 & #48 sizes $1.10 $1.05 -4.1% $1.17 $1.10 -6.0%
4770 X-Large Hass #36 sizes & larger $2.72 $1.62 -40.6% $1.75 $1.19 -32.0%
Other Greenskins, Pinkertons, non-Hass PLUs $0.61 $0.78 +28.0% $1.86 $1.67 -9.9%
Organic All Organic PLUs $1.52 $1.43 -6.0% $1.59 $1.57 -1.8%
Bags All bagged PLUs $0.83 $0.75 -9.4% $0.83 $0.79 -4.8%
$0.87 $0.84 -4.1% $0.98 $0.95 -3.0%
JANUARY -
MARCH: 2
012
vs 2
013
West Total U.S.
TOTAL CATEGORY UNITS
West Total U.S.
TOTAL CATEGORY DOLLARS
West Total U.S.
CATEGORY ASP ($/Unit)

7
West: YTD Q1 Category Per Store Averages
• In 2013, per store dollar and unit averages exhibited growth over the prior years
– 2013 Average dollars of $10,262 per store were +19% higher than 2012 and +24% higher than 2011
– 2013 Average units of 12,268 per store were +24% higher than 2012 and +42% higher than 2011
$8,253 $8,646$10,262
+4.8% +18.7%
Avg Retail Dollars Per Store
2011 2012 2013
8,651 9,907
12,268
+14.5% +23.8%
Avg Retail Units Per Store
2011 2012 2013
8
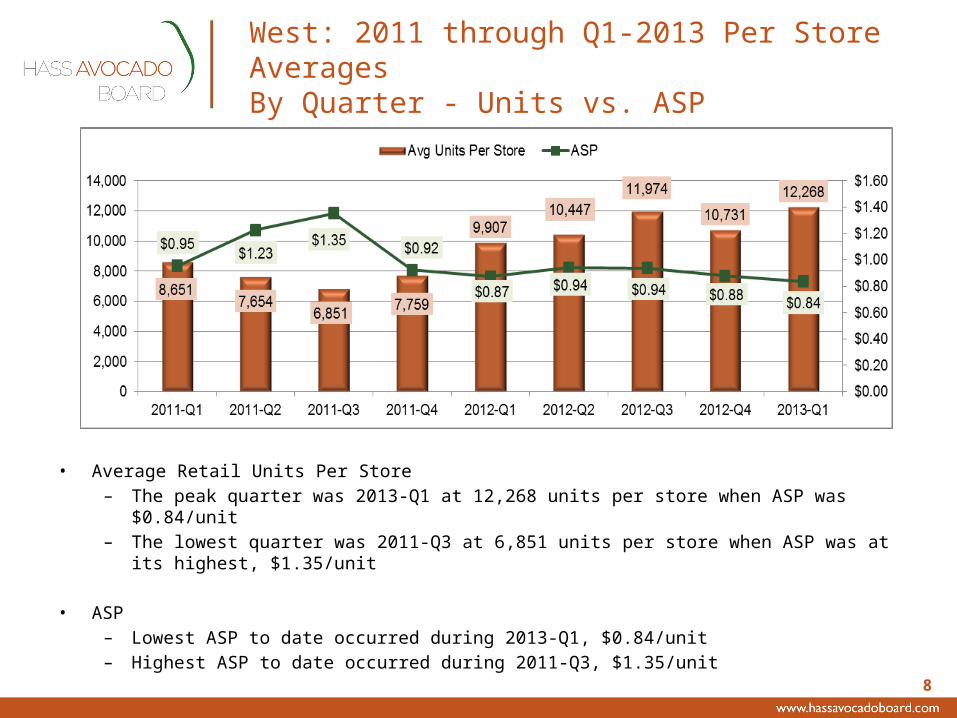
West: 2011 through Q1-2013 Per Store AveragesBy Quarter - Units vs. ASP
• Average Retail Units Per Store– The peak quarter was 2013-Q1 at 12,268 units per store when ASP was $0.84/unit– The lowest quarter was 2011-Q3 at 6,851 units per store when ASP was at its
highest, $1.35/unit
• ASP– Lowest ASP to date occurred during 2013-Q1, $0.84/unit– Highest ASP to date occurred during 2011-Q3, $1.35/unit
9
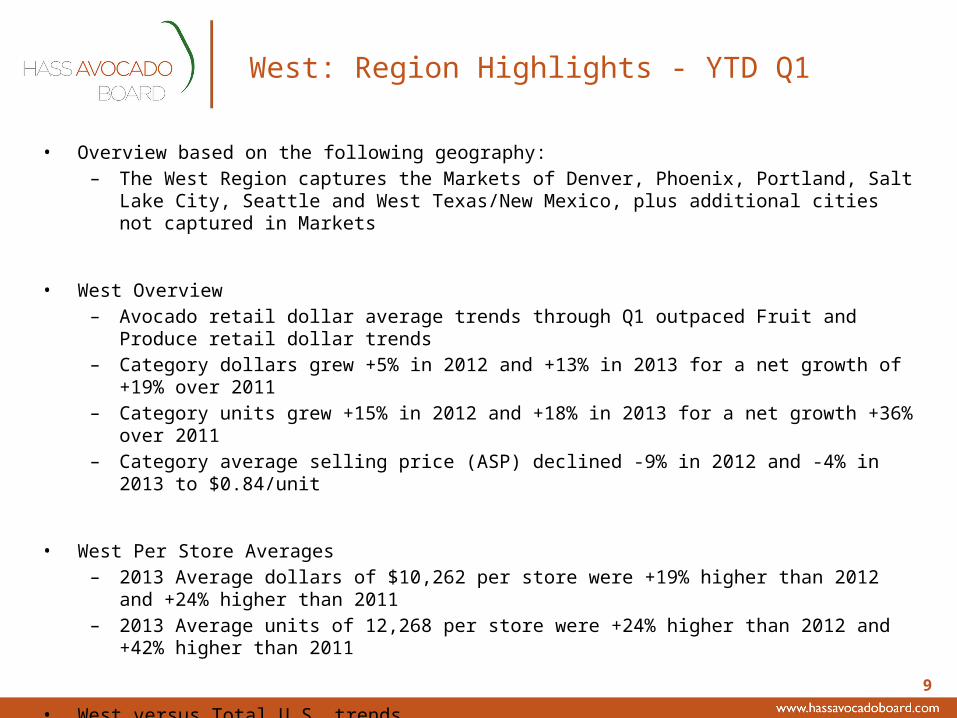
West: Region Highlights - YTD Q1
• Overview based on the following geography:– The West Region captures the Markets of Denver, Phoenix, Portland, Salt Lake City,
Seattle and West Texas/New Mexico, plus additional cities not captured in Markets
• West Overview– Avocado retail dollar average trends through Q1 outpaced Fruit and Produce retail
dollar trends – Category dollars grew +5% in 2012 and +13% in 2013 for a net growth of +19%
over 2011– Category units grew +15% in 2012 and +18% in 2013 for a net growth +36% over
2011– Category average selling price (ASP) declined -9% in 2012 and -4% in 2013 to
$0.84/unit
• West Per Store Averages– 2013 Average dollars of $10,262 per store were +19% higher than 2012 and +24%
higher than 2011– 2013 Average units of 12,268 per store were +24% higher than 2012 and +42%
higher than 2011
• West versus Total U.S. trends– WE category unit growth of +18% was on par with the national average– WE category dollar trend of +13% was -1 point lower than the national average– WE 2013 category ASP of $0.84/unit was -12% lower than the national average of
$0.95/unit