california - child and family services revie · nia -ch w introduction ... california - child and...
TRANSCRIPT

Rev. 11/2013
California - Child and Family Services Review
C-CFSR Report Examples
County Children’s Services

1
Ca
lifo
rnia
- C
hild
an
d F
am
ily
Se
rvic
es R
evie
w
Introduction
The following are examples of how information/data is used throughout the C-CFSR process for continuous quality improvement. The examples include the types of analysis CDSS is requesting from counties in the C-CFSR Reports. These examples are not inclusive of every section of each report; however, several different sections of the CSA, SIP, and SIP Progress Reports are included. CSOAB and OCAP staff are available to provide technical assistance to counties when completing their analyses. The data that was provided in these examples was derived from an actual county, but modified to mask the identity of the county. Some of the analyses presented were from that county and other counties in previous CSA’s and SIPs. These examples are merely for the sole purpose of providing a comprehensive example analysis.

Rev. 11/2013
California - Child and Family Services Review
County Self-Assessment
[OCTOBER 3, 2008 – OCTOBER 2, 2013]
County Human Services

1
Ca
lifo
rnia
- C
hild
an
d F
am
ily
Se
rvic
es R
evie
w
Demographic Profile
CHILD WELFARE AND PROBATION POPULATION
In ABC County’s ongoing efforts to meet the needs of the families it serves, the county reviewed data regarding the Child Welfare population. Significant factors/differences between populations/changes over the past five years and trends were identified and are presented throughout this section of the CSA. Unless otherwise noted, all data provided throughout this Section comes from the Center for Social Services Research (CSSR) Child Welfare Dynamic Report System.1
Table 1. ABC County Child Population (0-17) Allegations: Incidence per 1,000 Children Stratified by Ethnic Group
Ethnic
Group
JAN2007-
DEC2007
JAN2008-
DEC2008
JAN2009-
DEC2009
JAN2010-
DEC2010
JAN2011-
DEC2011
JAN2012-
DEC2012
Per 1,000 Per 1,000 Per 1,000 Per 1,000 Per 1,000 Per 1,000
1 http://cssr.berkley.edu/cwscmsreports
The following is an example of data and analysis of significant factors/changes or
trends a County Child Welfare Department would include for the Child Welfare and
Probation Placement Population section of the Demographic Profile. Although not
discussed in this example, a Probation Placement Agency would include the same
information/type of analysis, specific to the probation population.
Counties should consider all data elements described in the Instruction Manual to
identify what is significant regarding their population. Counties then only
present/discuss the data that best describes the counties’ current status and
resulting needs.
2
Ca
lifo
rnia
- C
hild
an
d F
am
ily
Se
rvic
es R
evie
w
Latino 108 107.4 103 104.2 95.7 94.1
White 33.2 31.7 31.3 30.3 29 29.5
Black 34.6 36.7 35.9 34.3 31.5 31.9
Asian/P.I. 12.8 12.7 10.6 10.8 10 11.3
Nat Amer 80.8 95.4 98.6 78.9 89.3 94.2
Multi-Race 0 0 0 0 0 0
Missing . . . . . .
Total 37.5 37.5 35.9 35 32.2 32.8
Source: Needell, B., Webster, D., Armijo, M., Lee, S., Dawson, W., Magruder, J., Exel, M., Cuccaro-Alamin, S., Putnam-Hornstein, E., Williams, D., Yee, H., Hightower, L., Lou, C., Peng, C., King, B., Henry, C.,& Lawson, J. (2013). Child Welfare Services Reports for California. Retrieved 8/30/2013, from University of California at Berkeley Center for Social Services Research website. URL: <http://cssr.berkeley.edu/ucb_childwelfare>
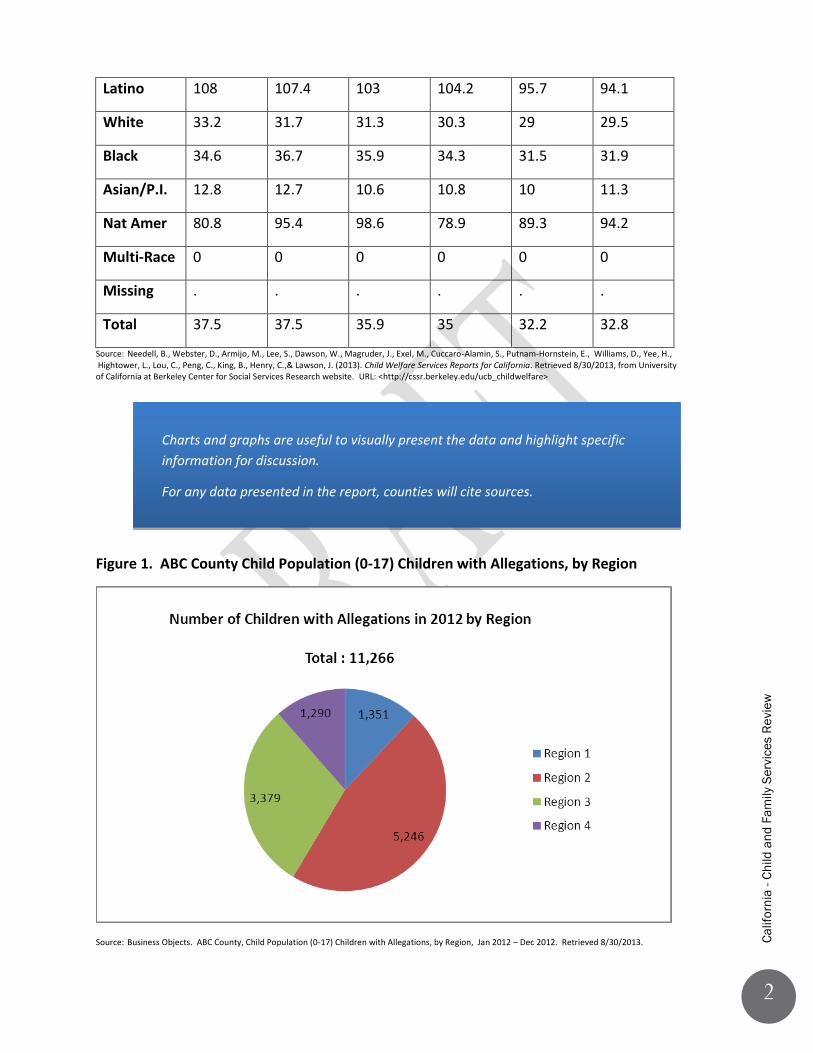
Figure 1. ABC County Child Population (0-17) Children with Allegations, by Region
Source: Business Objects. ABC County, Child Population (0-17) Children with Allegations, by Region, Jan 2012 – Dec 2012. Retrieved 8/30/2013.
Charts and graphs are useful to visually present the data and highlight specific
information for discussion.
For any data presented in the report, counties will cite sources.

3
Ca
lifo
rnia
- C
hild
an
d F
am
ily
Se
rvic
es R
evie
w
Table 2. Child Population (0-17), Allegations, Incidence per 1,000 Children Stratified by Region
Regions JAN2012-DEC2012
Per 1,000
Region 1 19.0
Region 2 40.2
Region 3 24.2
Region 4 29.0 Source: Business Objects. ABC County, Child Population (0-17) Allegations, Incidence per 1,000 Children Stratified by Region by Region, Jan 2012 – Dec 2012. Retrieved 8/30/2013.
In analyzing the number and rates of allegations for ABC County, several significant factors
were identified. Table 1 shows that in 2012, the Latino and Native American populations had
the highest rates of allegations (per 1,000) at 94.1 and 94.2, whereas the Asian/Pacific Islander
population has the lowest rate at 11.3. White and Black populations had rates of 29.5 and 31.9.
When looking at the number of children with allegations, the Latino population had the highest
number, with 3,846, of the 11,266 total children. With regard to regions, Region 2, which
includes zip codes 99999 and 88888, had a significantly higher number of children with
allegations (5,246) than other regions, accounting for almost 47% of the total number of
children with allegations (Figure 1). In addition, Region 2 had the highest incidence rate at 40.2
(Table 2).
Table 3. ABC County Child Population (0-17) Substantiations: Incidence per 1,000 Children
Stratified by Age Group
Age
Group
JAN2007-
DEC2007
JAN2008-
DEC2008
JAN2009-
DEC2009
JAN2010-
DEC2010
JAN2011-
DEC2011
JAN2012-
DEC2012
Per 1,000 Per 1,000 Per 1,000 Per 1,000 Per 1,000 Per 1,000
Under 1 15.3 13.7 10.7 9.1 8.7 6.2
1-2 5.1 4.5 4.2 2.2 2.1 2.2
3-5 4.1 4.3 3.4 2.4 2.2 2.3
6-10 4.2 4.5 3.3 2.3 2.1 2
11-15 5 5.1 4.4 3.1 2.4 2.3

4
Ca
lifo
rnia
- C
hild
an
d F
am
ily
Se
rvic
es R
evie
w
16-17 4.4 4.5 4.5 3 2.2 2.6
Total 5.2 5.2 4.3 3 2.6 2.5
Needell, B., Webster, D., Armijo, M., Lee, S., Dawson, W., Magruder, J., Exel, M., Cuccaro-Alamin, S., Putnam-Hornstein, E., Williams, D., Yee, H., Hightower, L., Lou,
C., Peng, C., King, B., Henry, C.,& Lawson, J. (2013). Child Welfare Services Reports for California. Retrieved 8/30/2013, from University of California at Berkeley
Center for Social Services Research website. URL: <http://cssr.berkeley.edu/ucb_childwelfare>
When reviewing and analyzing ABC County’s Referral Substantiation numbers and rates, it was
noted that the substantiation rate per 1,000 children in 2012 has gone down by more than half,
down from 5.2 to 2.5, since the last CSA five years ago. The total number of children with
substantiated referrals was 1,814 in 2007 and was 851 in 2012. The highest substantiation rate
in 2012 was for children under the age of one, with a rate of 6.2 (Table 3). When stratifying
substantiation rates by ethnicity for 2012, Native American children had the highest incidence
per 1,000 (11.2) and Latino children had the second highest (8.7), while white children had a
rate of 2.4 and black children had a rate of 2.0. Asian/Pacific Islander children had the lowest,
at 0.6.
Table 4. Children with One or More Allegations
Allegation Type JAN2007-
DEC2007
JAN2012-
DEC2012
n n
Sexual Abuse 1,958 1,538
Physical Abuse 4,810 3,987
Severe Neglect 180 256
General Neglect 4,009 3,486
Exploitation 12 10
Emotional Abuse 1,003 1,497
Caretaker Absence/Incapacity 1,093 482
At Risk, Sibling Abused 38 10
Substantial Risk 72 .
Missing . .
Total 13,175 11,266
Needell, B., Webster, D., Armijo, M., Lee, S., Dawson, W., Magruder, J., Exel, M., Cuccaro-Alamin, S., Putnam-Hornstein, E., Williams, D., Yee, H., Hightower, L., Lou,
C., Peng, C., King, B., Henry, C.,& Lawson, J. (2013). Child Welfare Services Reports for California. Retrieved 8/30/2013, from University of California at Berkeley
Center for Social Services Research website. URL: <http://cssr.berkeley.edu/ucb_childwelfare>

5
Ca
lifo
rnia
- C
hild
an
d F
am
ily
Se
rvic
es R
evie
w
The number of children with one or more allegations has also declined over the past five years,
from 13,175 to 11,266 (Table 4). The majority of allegations in 2012 were for Physical Abuse
(3,987) and General Neglect (3,486).
Table 5. Number of Children with First Entries Stratified by Ethnicity
Ethnic
Group
JAN2007-
DEC2007
JAN2008-
DEC2008
JAN2009-
DEC2009
JAN2010-
DEC2010
JAN2011-
DEC2011
JAN2012-
DEC2012
n n n n n n
Latino 327 308 230 190 202 206
White 172 132 108 105 102 94
Black 241 175 124 143 129 98
Asian/P.I. 61 53 47 35 22 25
Nat Amer 14 10 9 1 5 5
Multi-Race 0 0 0 0 0 0
Missing . 2 . 1 2 3
Total 815 680 518 475 462 431
Needell, B., Webster, D., Armijo, M., Lee, S., Dawson, W., Magruder, J., Exel, M., Cuccaro-Alamin, S., Putnam-Hornstein, E., Williams, D., Yee, H., Hightower, L., Lou,
C., Peng, C., King, B., Henry, C.,& Lawson, J. (2013). Child Welfare Services Reports for California. Retrieved 8/30/2013, from University of California at Berkeley
Center for Social Services Research website. URL: <http://cssr.berkeley.edu/ucb_childwelfare>
Table 6. Number of Children with First Entries Stratified by Age
Age
Group
JAN2007-
DEC2007
JAN2008-
DEC2008
JAN2009-
DEC2009
JAN2010-
DEC2010
JAN2011-
DEC2011
JAN2012-
DEC2012
n n n n n n
Under
1
210 174 123 110 126 98
1-2 91 65 71 48 49 53
3-5 103 86 71 63 58 73
6-10 146 127 81 96 94 81
11-15 189 148 117 103 98 87
16-17 76 80 55 55 37 39

6
Ca
lifo
rnia
- C
hild
an
d F
am
ily
Se
rvic
es R
evie
w
Total 815 680 518 475 462 431
Needell, B., Webster, D., Armijo, M., Lee, S., Dawson, W., Magruder, J., Exel, M., Cuccaro-Alamin, S., Putnam-Hornstein, E., Williams, D., Yee, H., Hightower, L., Lou,
C., Peng, C., King, B., Henry, C.,& Lawson, J. (2013). Child Welfare Services Reports for California. Retrieved 8/30/2013, from University of California at Berkeley
Center for Social Services Research website. URL: <http://cssr.berkeley.edu/ucb_childwelfare>
Since 2007, the number of children with first entries has greatly declined from 815, to 431 in
2012 (Tables 5 and 6). More Latino children entered care in 2012, than any other ethnicity (n =
206). The second highest population to enter care was Black children, with 98 entries (Table 5).
Reviewing first entry rates, Latino children had a much higher rate of first entries, than White,
Black, and Asian/P.I. Latino children had a rate of 5, per 1,000, children, whereas White
children had a rate of 1.2; Black children had a rate of 0.9, and Asian/P.I. children had a rate of
0.3, showing that Latino children entered care at a disproportionate rate. When looking at
entries stratified by age group, the age group with the most entries was under one, with 98
entries (Table 6). Children under age one also had the highest rate of first entries, with a rate of
4.7 per 1,000 children. All other age groups averaged a rate of approximately 1 per 1,000.
Table 7. Number of Children with Subsequent Entries Stratified by Ethnicity
Ethnic
Group
JAN2007-
DEC2007
JAN2008-
DEC2008
JAN2009-
DEC2009
JAN2010-
DEC2010
JAN2011-
DEC2011
JAN2012-
DEC2012
n n n n n n
Latino 142 140 127 88 91 80
White 58 43 31 29 27 35
Black 46 51 43 42 31 24
Asian/P.I. 13 17 7 7 8 1
Nat Amer 1 4 7 2 6 3
Multi-Race 0 0 0 0 0 0
Missing . . . . . .
Total 260 255 215 168 163 143
Needell, B., Webster, D., Armijo, M., Lee, S., Dawson, W., Magruder, J., Exel, M., Cuccaro-Alamin, S., Putnam-Hornstein, E., Williams, D., Yee, H., Hightower, L., Lou,
C., Peng, C., King, B., Henry, C.,& Lawson, J. (2013). Child Welfare Services Reports for California. Retrieved 8/30/2013, from University of California at Berkeley
Center for Social Services Research website. URL: <http://cssr.berkeley.edu/ucb_childwelfare>

7
Ca
lifo
rnia
- C
hild
an
d F
am
ily
Se
rvic
es R
evie
w
The number of children with subsequent entries has also decreased from 2007 (n = 260) to
2012 (n = 143). The ethnicity with the highest number of children with subsequent entries is
Latino (Table 7.)
Table 8. Number of Children in Care Stratified by Age Group
Age
Group
Jul
1,2007
Jul
1,2008
Jul
1,2009
Jul
1,2010
Jul
1,2011
Jul
1,2012
n n n n n n
Under 1 124 108 81 73 83 74
1-2 211 213 184 157 135 124
3-5 210 217 208 172 154 133
6-10 386 387 301 285 263 227
11-15 922 805 675 560 445 395
16-17 497 491 420 424 397 341
Total 2,350 2,221 1,869 1,671 1,477 1,294
Needell, B., Webster, D., Armijo, M., Lee, S., Dawson, W., Magruder, J., Exel, M., Cuccaro-Alamin, S., Putnam-Hornstein, E., Williams, D., Yee, H., Hightower, L., Lou,
C., Peng, C., King, B., Henry, C.,& Lawson, J. (2013). Child Welfare Services Reports for California. Retrieved 8/30/2013, from University of California at Berkeley
Center for Social Services Research website. URL: <http://cssr.berkeley.edu/ucb_childwelfare>
Table 9. Number of Children in Care Stratified by Ethnicity
Ethnic
Group
Jul
1,2007
Jul
1,2008
Jul
1,2009
Jul
1,2010
Jul
1,2011
Jul
1,2012
n n n n n n
Latino 1,497 1,371 1,140 1,010 863 742
White 346 320 263 250 253 214
Black 410 424 372 335 282 264
Asian/P.I. 78 91 72 62 62 54
Nat Amer 19 15 22 14 17 20
Multi-
Race
0 0 0 0 0 0
Missing . . . . . .

8
Ca
lifo
rnia
- C
hild
an
d F
am
ily
Se
rvic
es R
evie
w
Total 2,350 2,221 1,869 1,671 1,477 1,294
Needell, B., Webster, D., Armijo, M., Lee, S., Dawson, W., Magruder, J., Exel, M., Cuccaro-Alamin, S., Putnam-Hornstein, E., Williams, D., Yee, H., Hightower, L., Lou,
C., Peng, C., King, B., Henry, C.,& Lawson, J. (2013). Child Welfare Services Reports for California. Retrieved 8/30/2013, from University of California at Berkeley
Center for Social Services Research website. URL: <http://cssr.berkeley.edu/ucb_childwelfare>
Table 10. Number of Children in Care Stratified by Region
Regions Jul 1,2012
n
Region 1 220
Region 2 582
Region 3 302
Region 4 190
Total 1,294
Needell, B., Webster, D., Armijo, M., Lee, S., Dawson, W., Magruder, J., Exel, M., Cuccaro-Alamin, S., Putnam-Hornstein, E., Williams, D., Yee, H., Hightower, L., Lou,
C., Peng, C., King, B., Henry, C.,& Lawson, J. (2013). Child Welfare Services Reports for California. Retrieved 8/30/2013, from University of California at Berkeley
Center for Social Services Research website. URL: <http://cssr.berkeley.edu/ucb_childwelfare>
When looking at the population of children in care, you find that there has been a significant
decline in the overall number of children in care, over the past five years. This is the case for all
age groups and all ethnicities, except the Native American population. ABC County went from
an in care population of 2,350, on July 1, 2007, to 1,294, on July 1, 2012. The majority of
children in care on July 1, 2012, were between the ages of 11 and 17 (Table 8). More than half
of the children in care were Latino (Table 9), and Latino children had a rate of 18.2 children in
care per 1,000, which is significantly higher than White and Black children who had rates of 2.8
and 2.4, respectively. Native American children had the highest rate, of 24.8 per 1,000;
however, they had the lowest number of children in care, with 20 children. Region 2 had the
highest number of children in care on July 1, 2012, with almost half the total children in care, n
= 582 (Table 10). Region 2 had a rate of 16.3 children in care per 1,000, which is significantly
higher than Regions 1, 3, and 4, which had rates of 6.8 and 2.4, and 3.8, respectively.2
Table 11. Caseload by Service Component Type (Percent)
Service Component Type 1-Jul-07 1-Jul-08 1-Jul-09 1-Jul-10 1-Jul-11 1-Jul-12
% % % % % %
Emergency Response 5.6 7.5 4.9 5.2 5.3 6.1
2 Business Objects. ABC County, Children In-Care Number and Incidence per 1,000 Children, Stratified by Region,
July 1, 2012. Retrieved 8/30/2013.
9
Ca
lifo
rnia
- C
hild
an
d F
am
ily
Se
rvic
es R
evie
w
Pre-Placement (FM) 14.2 15.7 16.1 15.7 16.1 15.6
Post-Placement (FM) 6.6 7.8 8.8 9.3 8.5 8.8
Family Reunification 12.5 14.1 13.6 14.5 14.1 13.7
Permanent Placement 61.1 54.9 56.6 55.3 56 51.7
Supportive Transition . . . . 0 4.1
Total 100 100 100 100 100 100
Needell, B., Webster, D., Armijo, M., Lee, S., Dawson, W., Magruder, J., Exel, M., Cuccaro-Alamin, S., Putnam-Hornstein, E., Williams, D., Yee, H., Hightower, L., Lou,
C., Peng, C., King, B., Henry, C.,& Lawson, J. (2013). Child Welfare Services Reports for California. Retrieved 8/30/2013, from University of California at Berkeley
Center for Social Services Research website. URL: <http://cssr.berkeley.edu/ucb_childwelfare>
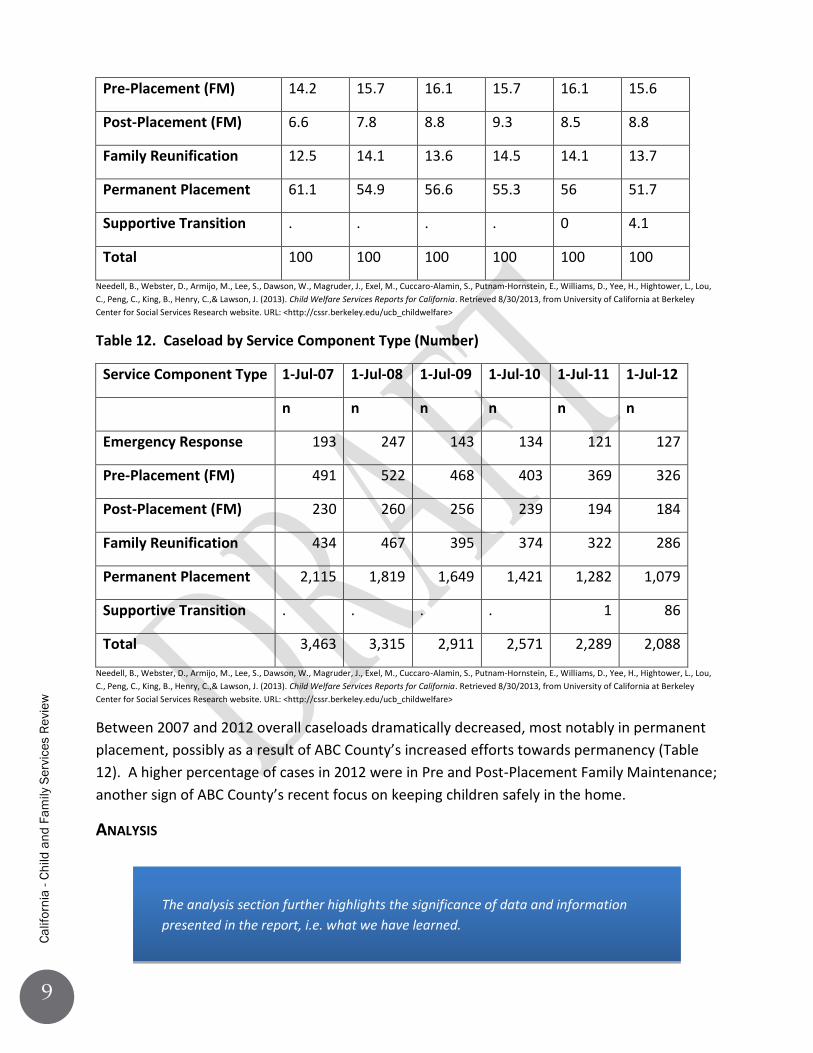
Table 12. Caseload by Service Component Type (Number)
Service Component Type 1-Jul-07 1-Jul-08 1-Jul-09 1-Jul-10 1-Jul-11 1-Jul-12
n n n n n n
Emergency Response 193 247 143 134 121 127
Pre-Placement (FM) 491 522 468 403 369 326
Post-Placement (FM) 230 260 256 239 194 184
Family Reunification 434 467 395 374 322 286
Permanent Placement 2,115 1,819 1,649 1,421 1,282 1,079
Supportive Transition . . . . 1 86
Total 3,463 3,315 2,911 2,571 2,289 2,088
Needell, B., Webster, D., Armijo, M., Lee, S., Dawson, W., Magruder, J., Exel, M., Cuccaro-Alamin, S., Putnam-Hornstein, E., Williams, D., Yee, H., Hightower, L., Lou,
C., Peng, C., King, B., Henry, C.,& Lawson, J. (2013). Child Welfare Services Reports for California. Retrieved 8/30/2013, from University of California at Berkeley
Center for Social Services Research website. URL: <http://cssr.berkeley.edu/ucb_childwelfare>
Between 2007 and 2012 overall caseloads dramatically decreased, most notably in permanent
placement, possibly as a result of ABC County’s increased efforts towards permanency (Table
12). A higher percentage of cases in 2012 were in Pre and Post-Placement Family Maintenance;
another sign of ABC County’s recent focus on keeping children safely in the home.
ANALYSIS
The analysis section further highlights the significance of data and information
presented in the report, i.e. what we have learned.

10
Ca
lifo
rnia
- C
hild
an
d F
am
ily
Se
rvic
es R
evie
w
Although the referral/allegation numbers and rate have only slightly declined over the past five
years, the substantiation, entry, and in-care numbers and rates have greatly declined. This can
likely be attributed to the targeted efforts ABC County has made towards diverting families to
voluntary/in-home supports. Voluntary Family Maintenance Services are utilized more often
than in the past. Over the past five years, ABC County has partnered with outside agencies to
provide services within communities to meet client’s needs. ABC County implemented a
Differential Response Program in 2008, which diverts low risk families to community partners
for prevention services. In addition, Structured Decision Making (SDM) utilization has greatly
increased over the past five years, and ABC County has implemented intake Team Decision
Making (TDM) Meetings. As a result of intake TDM’s, some children who would have previously
been detained, are being safely maintained in their homes or temporarily with family members
on a voluntary basis.
When reviewing Allegation Types (Table 4), it is evident that Physical Abuse and General
Neglect were the most common allegations, consistently for the past five years. By adding a
special project code to CWS/CMS, and running a Business Objects Report, ABC County was able
to identify that approximately 80% of the allegations that were classified as General Neglect
included parental substance abuse, highlighting a need for quality substance abuse treatment
programs throughout the County. The high incidence of Physical Abuse allegations highlights
the need for services that provide early child education, work to improve parenting skills, and
provide parent support. A review of the data also highlighted the increase in Emotional Abuse
allegations over the past five years. In 2007, Emotional Abuse allegations accounted for
approximately 8% of the allegations, but in 2012, they accounted for approximately 13%. By
reviewing all referrals with allegations of Emotional Abuse, ABC County was able to identify that
most of them were associated with Domestic Violence in the home. The increase highlights an
additional need to review and assess the domestic violence services in the county and may
impact service delivery in the future as the County continues to develop a plan for the next five
years.
Latino and Native American children are overrepresented in every area, from
allegations/referrals, to in-care rates. As Table 9 shows, Latino children make up the majority
of the in-care population (n = 742) with almost three times the amount of children in-care as
the next largest ethnic population, which is Black children (n = 264). As discussed in the
General County Demographics Section, a greater percentage of Latino children live in poverty
than other racial groups. In CSA focus groups, Latino parents reported that cultural differences
influence their child rearing practices and that may be a factor when they are being assessed.
This suggests a need for increased cultural sensitivity on behalf of the child welfare
system/workers and any services that may be put in place, such as parenting classes.

11
Ca
lifo
rnia
- C
hild
an
d F
am
ily
Se
rvic
es R
evie
w
As discussed in the General County Demographic Section, Region 2, from which come the
majority of the allegations and in-care children, you will find a predominately Latino population.
The majority of the families that live in this area are primarily Spanish speaking and there is a
large group of indigenous farm workers from the Mexican state of Guerrero. ABC County has
identified that this Region has an increased need for services for children and families,
throughout the continuum of care, and efforts are underway to partner with community
agencies to meet the needs of the families in this Region. This will likely be a focus during the
next 5-Year SIP Cycle, as this need impacts many outcome measures, including Recurrence of
Maltreatment, Timely Reunification, and Re-entry.
Children under the age of one had the highest substantiation and first entry rates. This data is
consistent with children’s risk and safety assessment factors and characteristics, that very
young children are more vulnerable and more likely to experience certain forms of
maltreatment due to their small physical size, early developmental status, and need for
constant care. This shows a continued need for prevention services targeted to parents with
young children.
The total number of CWS cases has decreased dramatically over the past five years. Higher
percentages of cases are in Family Maintenance (Pre and Post), and Family Reunification, and
lower percentage in Permanent Placement. This is likely due to ABC County’s focus in the last
five years on finding permanency for children and youth, through several strategies in our
current SIP, including: reassessing parents, relatives, and other supports for return and/or
placement of children who have been in care for more than 24 months; expansion of family
search and engagement program; and ensuring concurrent plans for all children and youth and
the tracking and monitoring of these plans.

12
Ca
lifo
rnia
- C
hild
an
d F
am
ily
Se
rvic
es R
evie
w
Outcome Data Measures
C1.3 REUNIFICATION WITHIN 12 MONTHS (ENTRY COHORT)
National Standard: >48.4%
Methodology: This measure computes the percentage of children reunified within 12 months
of removal for a cohort of children first entering foster care. The entry cohort is comprised of
children entering foster care for the first time during a 6-month period.3
ABC County’s Current Performance: 28.7% (Q1 2013)
3 http://cssr.berkeley.edu/cwscmsreports/methodologies/default.aspx?report=C1M1
The following is an example of an analysis for the Outcome Data Measures section
of the CSA. The analysis includes information gleaned from both outcome data
measure review and stakeholder feedback. In addition, it incorporates
demographic data, cited earlier in the CSA, to support the analysis regarding the
represented populations.

13
Ca
lifo
rnia
- C
hild
an
d F
am
ily
Se
rvic
es R
evie
w
47.644.4
3329.2
36.5
28.7
52.455.6
6770.8
63.5
71.3
0
10
20
30
40
50
60
70
80P
erc
en
tC1.3 Reunification within 12 Months (Entry Cohort)
Reunified within 12 months Not Reunified in 12 months National Standard
Needell, B., Webster, D., Armijo, M., Lee, S., Dawson, W., Magruder, J., Exel, M., Cuccaro-Alamin, S., Putnam-Hornstein, E., Williams, D., Yee, H.,
Hightower, L., Mason, F., Lou, C., Peng, C., King, B., & Lawson, J. (2013). CCWIP reports. Retrieved 8/30/2013, from University of California at
Berkeley California Child Welfare Indicators Project website. URL: <http://cssr.berkeley.edu/ucb_childwelfare>
According to the Q1 2013 Data Report4, 197 children entered foster care from October 1, 2011
to March 31, 2012. Of those 197 children, 56 of them reunified with a parent within 12 months
(28.7%). The National Standard for this measure is 48.4%, which means that 48.4%, or more, of
all children in ABC County should be reunifying with a parent in less than a 12 month time
period. ABC County is diligent in CWS/CMS data entry and believes that these numbers
accurately reflect the performance of the county.
ANALYSIS
ABC County’s performance in C1.3 at the implementation of the last SIP in 2008 was 47.6%.
Since then, the county has shown a decline in performance in the last five years. Although no
significant difference was found between rates of reunification based on gender, Native
American children were found to have lower rates of reunification than that of all other
ethnicities. Native American children within ABC County comprise about 2% of the entire
foster care population, averaging approximately five Native American children per year that
4 http://www.childsworld.ca.gov/res/CtyReport/July13/SAMPLECounty.pdf

14
Ca
lifo
rnia
- C
hild
an
d F
am
ily
Se
rvic
es R
evie
w
reunified timely. Second to Native American Children, Latino children had overall lower rates of
reunification than White, Black, and Asian children. As previously discussed in this report,
Latino children comprise over half of the entire foster care population in the county. Children
under the age of one had significantly higher rates of reunification within 12 months, than
other children. When looking at Median Time to Reunification, children under the age of 1 had
an average reunification time of 3.4 months whereas other children had an average time of 7.7
months.5
One factor that has likely impacted this measure is that the Community Based Organization
(CBO) which provides Parenting Classes as well as other services had a major funding cut in
2011. That in turn affected how many classes were offered, and resulted in long waiting lists
for parents to receive parenting education.
Secondly, as discussed previously in the Public Agency Characteristics Section, there was a re-
organization within the County Child Welfare Offices in 2010 and a significant turnover in staff
in 2011 compared to previous years. An average of 10 workers per year either retired or
resigned; however, in 2011, 22 workers retired or resigned. The County has an average of 85
case-carrying social workers, which resulted in roughly 25% turnover in 2011. The high
turnover resulted in changes in social workers on family reunification cases, which research
shows, can negatively impact timely reunification.6
As discussed in the Demographics Section, the substantiation, entry, and in-care numbers and
rates have greatly declined over the past five years. This has likely also impacted timely
reunification, as the targeted efforts made to divert families to voluntary/in-home supports
means that the families that do enter out of home care have more serious and/or complex
safety issues, which can take longer to address. This has been reported anecdotally by
stakeholders during the CSA process.
Stakeholders reported that geographic access is a problem for parents who live in Region 2.
Parents who depend on public transportation often have to spend long hours on several buses
to get to and from service providers. This is compounded when some of these families have
multiple younger children who need to accompany the parent to these appointments. Most of
the services and bi-lingual service providers are located in Region 4.
5 Needell, B., Webster, D., Armijo, M., Lee, S., Dawson, W., Magruder, J., Exel, M., Cuccaro-Alamin, S., Putnam-
Hornstein, E., Williams, D., Yee, H., Hightower, L., Mason, F., Lou, C., Peng, C., King, B., & Lawson, J. (2013). CCWIP reports. Retrieved 11/8/2013, from University of California at Berkeley California Child Welfare Indicators Project website. URL: <http://cssr.berkeley.edu/ucb_childwelfare> 6 http://www.childsworld.ca.gov/res/pdf/FactorsCharacteristics.pdf

15
Ca
lifo
rnia
- C
hild
an
d F
am
ily
Se
rvic
es R
evie
w
Prevention/after-care services and public agencies strive to provide services that are culturally
competent for all ethnicities. Child Welfare, Probation and public agency programs all have bi-
lingual and bi-cultural workers and programs; however, there are unfortunately not enough of
these workers and programs to meet the needs of the community.
As indicated in the Service Array section in this document, additional resources such as housing,
childcare, substance abuse treatment, parenting education, early child developmental
screening, education and intervention, youth services, bilingual/bicultural services and normal
community supports are limited and/or not readily available to families in Region 2 where there
is a greater need. This increases safety concerns for children and families. Region 2’s
recurrence/reentry data indicates the need to develop community resources in order to
maintain family supports after CWS closes the referral or the case. It is critical to have services
in this community due to inaccessibility, inadequate public transportation.
We did not note any major policy change at the State or Federal Level that would significantly
impact our rates of reunification; however, stakeholders have noted that families often
experience delays in accessing services, perhaps impacted by continuances of their CWS court
hearings. This may adversely impact the agency’s ability to engage the family quickly, as it has
been reported by stakeholders that many families have been reluctant to engage in services
prior to the Dispositional Hearing. The County strives to have safe, timely and successful
reunifications for children and their families so that they do not reenter foster care at a later
date.
The county has conducted an internal review of sample cases to determine what county-
specific factors result in timely and successful reunification of children. The following factors
were identified: the quality of the initial assessment of the parents’ needs and identification of
individualized services to meet those needs, early parent engagement/participation in services,
involvement of the parents in developing the case plan, and the after-care case plan developed
prior to case closure that involved linking the family to community resources for support.
These factors align well with the Pathways to Mental Health Services Core Practice Model and
efforts are already underway to systemically change social work practice and expand
community resources. Focus group participants identified that they have seen these practice
methods in social worker and the agency’s approach to working with families over the past
eight months and identified them as a strength for creating positive outcomes for children and
families. It is believed that the expansion of these values/practice methods throughout the
agency will positively impact this measure in the future.
According to the most recent quarterly data report (Q1 2013), 16% of children who reunified
with their families returned to the foster care system within 12 months. Unfortunately, this

16
Ca
lifo
rnia
- C
hild
an
d F
am
ily
Se
rvic
es R
evie
w
falls short of the national standard of less than 9.9%. An analysis of current County reentry
data indicates that the most common age for children to re-enter foster care were between 2
and 6 years old (25%), followed by 9-13 year olds (19%). Additionally, a majority of the children
who re-entered were Latino (56%). Out of all the Regions in ABC County, the Region with the
most re-entries is Region 2 (50%). As discussed in the demographics portion of this report, the
majority of the families that live in this area are Latino and are primarily Spanish speaking. This
further highlights the need to target these populations when determining strategies to improve
timely and successful reunification. See C1.4 Reentry section of this report for further analysis
regarding this measure.

Rev. 11/2013
County Human Services
California - Child and Family Services Review
System Improvement Plan
[OCTOBER 3, 2013 – OCTOBER 2, 2018]

1
Ca
lifo
rnia
- C
hild
an
d F
am
ily
Se
rvic
es R
evie
w
SIP Narrative
PRIORITIZATION OF OUTCOME MEASURES/SYSTEMIC FACTORS AND STRATEGY RATIONALE
ABC County has chosen C1.3 Reunification within 12 months (entry cohort) as an Outcome
Measure to focus on for the 2013 – 2018 SIP. According to the Q1 2013 Data Report1, 197
children entered foster care from October 1, 2011 to March 31, 2012. Of those 197 children, 56
of them reunified with a parent within 12 months (28.7%). The National Standard for this
measure is 48.4%, which means that 48.4%, or more, of all children in ABC County should be
reunifying with a parent in less than a 12 month time period.
ABC County chose this measure for a variety of reasons. The county’s performance on this
measure has been declining since implementation of ABC County’s previous SIP in 2008.
Stakeholders agreed that achieving timely reunification must be a priority for the County, as
once children are removed, safely returning children to their homes is the primary goal of Child
Welfare. Additionally, Timely Reunification is a priority for the State of California, as the State
as a whole has not historically met the National Standard for both of the Reunification within 12
month measures (C1.1 and C1.3).
After an extensive analysis of this measure during the CSA process, ABC County developed
strategies specifically targeted to meet the needs of the population(s) identified as most at risk
of not achieving the goal of reunifying within 12 months: Latino families in Region 2.
Additionally, the strategies help to overcome obstacles, identified by stakeholders, as likely
having a negative impact on this measure (ex. Geographic access). Lastly, a thorough review of
Literature, relevant to timely reunification within Child Welfare, was done, in order to ensure
1 http://www.childsworld.ca.gov/res/CtyReport/July13/SAMPLECounty.pdf
The following is an example of the Prioritization of Outcome Measures narrative in
a SIP Report. This excerpt serves only as an example and does not fully cover an
entire SIP Report. For further detail, please refer to the C-CFSR Instruction Manual.

2
Ca
lifo
rnia
- C
hild
an
d F
am
ily
Se
rvic
es R
evie
w
the strategies were rooted in evidence-based and/or evidence informed social work practice.
After full implementation of the four strategies targeted at improving timely reunification, ABC
County expects to achieve its Target Improvement Goal of 48.1%, by October of 2018.
ABC County’s first strategy is to refer parents who are receiving Family Reunification Services
through CWS to Community and Families United (CFU) for parent education and parent support
groups (See Strategy #1 on pg. XX of the SIP Chart). CFU takes a systemic approach to promote
protective factors that strengthen families, lower incidence of child abuse and neglect and
promote positive outcomes. CFU has been serving families through ABC Unified School district
since 2010. Although still in the pilot phase, this program, which initially began serving a few of
the neediest of families in the community, has grown to serve over 100 families during the last
fiscal year.
The program meets the CSA identified need for culturally relevant, community based resources
located in the high need community of Region 2. As discussed on pg. XX of the 2013 CSA, some
of the county CBO’s underwent major funding cuts in 2011. Through the Peer Review and
Stakeholder Focus Groups, we found that due to these funding cuts, many of the CBO’s had to
make cuts to their parent education programs, resulting in long waiting lists for services.
During the CSA process, ABC County found that parents that were engaged/participated in
services early in the case were more likely to reunify at a faster rate than those parents who
had a delay in services. In further analysis, Region 2, where the highest rates of maltreatment
occurred, had also experienced a significant cut in parent education programs for the CBO’s
that were located in the Region. As previously noted in the CSA on pg. XX, Region 2 has the
highest in-care rates, and the most reentries into foster care (50%).
Counties will likely choose several strategies to impact a measure. For the purpose
of providing an example, only one strategy is discussed and presented here and in
the example SIP Chart.
Counties will identify the children represented by the data (identified in the CSA),
for the particular measure and estimate how the strategy will change performance
in the Outcome Data Measure(s).

3
Ca
lifo
rnia
- C
hild
an
d F
am
ily
Se
rvic
es R
evie
w
CFU uses the evidence-based program Triple P – Positive Parenting Program in conjunction with
parent support groups. It is a “parenting and family support system designed to prevent – as
well as treat – behavioral and emotional problems in children and teenagers. It aims to prevent
problems in the family, school and community before they arise and to create family
environments that encourage children to realize their potential.”2
Parents who receive parenting classes where modeling or active participation/practice is part of
the curriculum have better outcomes than parents who receive lecture and/or video courses on
parenting. 3 Triple P includes modeling/demonstration in parenting techniques. Based on
previous studies, this type of curriculum should increase reunification and decrease re-entry of
children into the foster care system.
In collaboration between CFU and ABC County CWS, it was identified that many families (56%)
served in the FY 2011-2012, had at least 1 CWS referral within the same fiscal year. Some of
the allegations varied, but 43% were due to general neglect. Since the majority of the families
that are served through CFU are Latino and many are Spanish-speaking only, the services will
include Spanish-speaking classes and a high proportion of staff will be bi-lingual and/or bi-
cultural.
Beginning in October 2013, the CWS Program Manager and the CFU Site Coordinators will meet
to determine the number of families to be served for the next fiscal year. Based on that
number, that group will also develop criteria guidelines of the families that will be referred to
the program. (See Action Step A on Pg. XX of the SIP Chart).
Once general criteria guidelines are created, the CWS Agency will develop a referral form and a
referral process for CWS SW’s to refer families and parents in need. (See Action Step B on Pg.
XX of the SIP Chart). It is anticipated that one of the criteria is that the children must reside in
ABC Unified School District prior to removal.
The CWS Agency and CFU will develop a training curriculum for the CWS Staff and the ABC
Unified School District staff on the process and procedures for referring families to the
program. (See Action Step C on Pg. XX of the SIP Chart). CFU will track all families that are
receiving services through their organization and CWS will conduct a focus group of the parents
2 http://www.triplep.net/glo-en/find-out-about-triple-p/triple-p-in-a-nutshell/
3 Centers for Disease Control. (2009). Parent Training Programs: Insight for Practitioners. Atlanta, Georgia: Centers
for Disease Control.

4
Ca
lifo
rnia
- C
hild
an
d F
am
ily
Se
rvic
es R
evie
w
at least annually. (See Action Step D & E on Pg. XX of the SIP Chart). CWS will evaluate the
outcomes of these families that are receiving services and modify the program guidelines as
needed. (See Action Step F on Pg. XX of the SIP Chart).

Rev. 11/2013
5 – YEAR SIP CHART
Priority Outcome Measure or Systemic Factor: C1.3 Reunification within 12 months (entry cohort) National Standard: >48.4% CSA Baseline Performance: 28.7% (Q1 2013). According to the Q1 2013 Data Report, 197 children entered foster care from October 1, 2011 to March 31, 2012. Of those 197 children, 56 of them reunified with a parent within 12 months (28.7%).
Target Improvement Goal: Year 3 (October 3, 2015 – October 2, 2016): >34.1% Year 4 (October 3, 2016 – October 2, 2017): >40.4% Year 5 (October 3, 2017 – October 2, 2018): >48.1% (Due to the time it will take to implement the strategies and the methodology for C1.3, the county does not anticipate any significant data changes until Year 3). If the reunification 6-month entry population remains static at 197 children for the next 5 years, ABC County will have to roughly reunify 67 children within 12 months to meet Year 3 Benchmark Goal of 34.1%. By Year 4, ABC County will have to reunify 80 children to reach Year 4 Benchmark Goal of 40.4%. By Year 5, ABC County will have to reunify 95 children to reach Year 5 Benchmark Goal of 48.1%.

2
Ca
lifo
rnia
- C
hild
an
d
Fa
mily
Se
rvic
es R
evie
w
Strategy 1: Refer parents who are receiving Family Reunification Services through CWS to Community and Families United (CFU) for parent education and parent support groups.
CAPIT Applicable Outcome Measure(s) and/or Systemic Factor(s): C1.3 Reunification within 12 months (entry cohort)
CBCAP
PSSF
N/A Title IV-E Child Welfare Waiver Demonstration Capped Allocation Project
Action Steps: Implementation Date:
Completion Date: Person Responsible:
A. Identify the number of CWS parents to receive services through CFU for each fiscal year. Develop a criteria guideline of families to be referred to the program.
October 2013 April 2014 Community and Families United Site Coordinators
CWS Program Manager
B. Create a Referral Form and Referral Process for identified CWS parents that need services. Update the Referral Form and Policies and Procedures when necessary.
January 2014 June 2014 CWS Program Manager and Staff
C. Develop a training process with ABC School District. Train CWS Staff and ABC Unified School Staff on Referral process and procedures.
April 2014 October 2014 CWS Administrative Staff

3
C
alifo
rnia
- C
hild
an
d F
am
ily
Se
rvic
es R
evie
w
D. Refer CWS parents who meet the criteria in Action Step A to the parenting classes that are provided through CFU.
October 2014 October 2014 CWS Social Workers
ABC Unified School District Personnel
E. Capture demographics and data of all CWS families who have been served through the program. Develop a Satisfaction Survey and ask families about satisfaction with the program upon completion of the program.
October 2014 October 2015 Community and Families United
F. Conduct focus group on annual basis of parents who have received parenting services through the program and make adjustments to the program, as needed, based on parents’ feedback.
June 2015 October 2015 CWS Staff
G. Evaluate the outcomes of the parents receiving the services.
October 2015 April 2016 CWS Staff

CAPIT/CBCAP/PSSF Expenditure Workbook
Proposed Expenditures
Worksheet 1
Appendix X
(1) DATE SUBMITTED: 8/2/13 (2) DATES FOR THIS WORKBOOK thru 6/30/18 (3) DATE APPROVED BY OCAP
ABC (5) PERIOD OF SIP: 10/3/13 thru 10/2/18 (6) YEARS: 1-5
CAPIT: CBCAP: $10,000 PSSF:
OTHER
SOURCES
NAME OF
OTHERTOTAL
Dollar am
ount to
be sp
ent o
n
CA
PIT
Pro
gram
s
CA
PIT
is used
for
Adm
inistratio
n
Dollar am
ount to
be sp
ent o
n
CB
CA
P P
rogram
s
CB
CA
P is u
sed fo
r
Adm
inistratio
n
Dollar am
ount to
be sp
ent o
n
Fam
ily P
reservatio
n
Dollar am
ount to
be sp
ent o
n
Fam
ily S
upport
Dollar am
ount to
be sp
ent o
n
Tim
e-Lim
ited R
eunificatio
n
Dollar am
ount to
be sp
ent o
n
Adoptio
n P
rom
otio
n &
Support
Dollar am
ount o
f PS
SF
allocatio
n
to b
e spen
t on P
SS
F activ
ities
(Sum
of co
lum
ns G
1-G
4)
PS
SF
is used
for A
dm
inistratio
nDollar amount
from other
sources
List the name(s)
of the other
funding
source(s)
Total dollar
amount to be
spent on this
Program (Sum of
Columns E, F,
G5)
A B C D1 D2 E1 E2 F1 F2 G1 G2 G3 G4 G5 G6 H1 H2 I
1 Community and Families United Direct ServiceFirst 5 & ABC Unified
School District$40,000 $0 $0 $40,000 $0 $40,000 $125,000
CCTF, First 5,
ABC Unified
School District
$205,000
2 TBD Parent Leadership RFP 7/15/13 $0 $10,000 $0 $0 $0 $0 $0 $0 $10,000
3 Incredible Years Direct ServiceCounty Child Abuse
Prevention Network$0 $0 $20,000 $0 $0 $0 $20,000 $0 $20,000
4 Mental Health Services Direct ServiceVarious Providers & County
Metnal Health Dept.$0 $0 $0 $20,000 $20,000 $40,000 $30,000
County Mental
Health$70,000
5 $0 $0 $0 $0 $0 $0 $0 $0 $0
6 $0 $0 $0 $0 $0 $0 $0 $0 $0
7 $0 $0 $0 $0 $0 $0 $0 $0 $0
8 $0 $0 $0 $0 $0 $0 $0 $0 $0
9 $0 $0 $0 $0 $0 $0 $0 $0 $0
10 $0 $0 $0 $0 $0 $0 $0 $0 $0
11 $0 $0 $0 $0 $0 $0 $0 $0 $0
12 $0 $0 $0 $0 $0 $0 $0 $0 $0
13 $0 $0 $0 $0 $0 $0 $0 $0 $0
14 $0 $0 $0 $0 $0 $0 $0 $0 $0
15 $0 $0 $0 $0 $0 $0 $0 $0 $0
Totals $40,000 $10,000 $20,000 $20,000 $40,000 $20,000 $100,000 $155,000 $305,000
20% 20% 40% 20% 100%
7/1/13
Internal Use Only(4) COUNTY:
Name of Service ProviderApplies to CBCAP
Programs Only
CAPIT CBCAP PSSF
(7) ALLOCATION (Use the latest Fiscal or All County Information Notice for Allocation): 40,000$
Service
Provider is
Unknown,
Date Revised
Workbook to
be Submitted
to OCAP
No. Program Name
$100,000
ProposedExpenditures, page 1 of 1 Rev. 9/2013

CAPIT/CBCAP/PSSF Expenditure Workbook
CBCAP Programs
Worksheet 2
Appendix X
1-5
Pro
gram
Lack
ing
sup
po
rt
(Lev
el 0)
Em
ergin
g &
Ev
iden
ce Info
rmed
Pro
gram
s & P
ractices
(Lev
el 1)
Pro
misin
g P
rog
rams &
Practices
(Lev
el 2)
Su
pp
orted
(Lev
el 3)
Well S
up
po
rted
(Lev
el 4)
Plan
nin
g
Imp
lemen
tation
Ev
aluatio
n
A B C1 C2 C3 D1 D2 D3 D4 D5 D6 E1 E2 E3
2 TBD - Parent Leadership x N/A x x x
Logic Model
Lo
gic M
od
el No
t Ap
plicab
le
(2) YEARS:
Lo
gic M
od
el Ex
ists
Lo
gic M
od
el Will b
e Dev
elop
ed
Program NameNo.
(1) COUNTY:
Parent
Involvement
ActivitiesEBP/EIP Level
As determined by the EBP/EIP Checklist
EBP/EIP Checklist
is on file or N/A
Sample
EBP/EIP ONLY
CBCAP, page 1 of 1

COUNTY: XYZ DATE APPROVED BY OCAP:
Rev. 12/2013 Page 1 of 2 \\cdss\cfsd\central office\users\dthornto\my documents\c-cfsr\capit cbcap pssf program and evaluation description sample 01-2014
.docx
CAPIT/CBCAP/PSSF PROGRAM AND EVALUATION DESCRIPTION
PROGRAM DESCRIPTION
[REFERENCE PAGE 51-53 OF THE INSTRUCTION MANUAL]
PROGRAM NAME
Community and Families United (School-based family support services)
SERVICE PROVIDER COMMUNITY AND FAMILIES UNITED (CFU)
PROGRAM DESCRIPTION Based on the community learning center model, the program offers tutoring, recreation, health and social services, and job-readiness training. Programs follow the school calendar year and are available before and after school hours on two school campuses; services are available for children and adults of all ages. Multi-lingual, multicultural activities/services include:
Public education (about child abuse prevention & the services available via CFU)
Home visiting for families with children 0-5
Parent education classes & support groups
Individual & family counseling
Information & referral FUNDING SOURCES
SOURCE LIST FUNDED ACTIVITIES
CAPIT
CBCAP
PSSF Family Preservation
PSSF Family Support
PSSF Time-Limited Family Reunification Parenting classes and support groups
PSSF Adoption Promotion and Support
OTHER Source(s)(Specify):
First 5 ABC School District Co Children’s Trust Fund
Home visiting, child care for parenting classes Individual & family counseling Public education

Page 2 of 2
IDENTIFY PRIORITY NEED OUTLINED IN CSA
Highest rates of substantiation in the 0-5 age range (CSA, page 3)
52% of entries are 0-5; 47% are Latino (CSA, page 5)
35% of reports are for physical abuse; 31% of reports are for neglect
Highest percent of allegations are in this region (47%, see CSA page 2)
TARGET POPULATION At-risk families and families involved with the CPS system; families with children 0-5; Latino families. TARGET GEOGRAPHIC AREA Region 2 TIMELINE SIP Cycle: 7/1/2013-7/1/2018; subject to change with notice and approval from CDSS/OCAP.
EVALUATION
PROGRAM OUTCOME(S) AND MEASUREMENT & QUALITY ASSURANCE (QA) MONITORING (EXAMPLE* PROVIDED BELOW)
Desired Outcome Indicator Source of Measure Frequency
Parents increase knowledge of child development
80% of Parents show improvement
Paper-based Pre & Post Parent Survey
Completed by participants at program entry & exit
CLIENT SATISFACTION (EXAMPLE* PROVIDED BELOW)
Method or Tool Frequency Utilization Action
Satisfaction Survey Completed by participants after each parenting class & at end of session
Surveys reviewed after each session
Problem areas addressed by staff, as appropriate to resolve issues and ensure continuous quality improvement

Rev. 11/2013
California - Child and Family Services Review
Annual SIP Progress Report
[OCTOBER 3, 2015 – OCTOBER 2, 2016]
County Human Services

1
Ca
lifo
rnia
Ch
ild
an
d F
am
ily
Se
rvic
es R
evi
ew
SIP Progress Report Narrative
STATUS OF STRATEGIES
STRATEGY #1: Refer parents who are receiving Family Reunification Services through CWS to
Community and Families United (CFU) for parent education and parent support groups.
ACTION STEP STATUS:
In Year 1 of implementation, ABC County found that an average of 100 families were being
served by CFU per year, and identified that a minimum of 20 slots would be for CWS-involved
families only. The guidelines for families that would be referred by CWS would be families that
have an open ER referral or CWS case. Also, families must reside in the Region 2 School
Boundaries. Families that met these criteria were then assessed to ensure that the program fit
their individual needs. A referral form was created in June 2014 and training began in August
2014. Families began being referred to CFU in August 2014, earlier than the expected date of
October 2014, due to the immediate need.
During Year 2 of the SIP, ABC County referred over 45 families to the CFU program. In June and
July 2015, various focus groups were held for social workers, CFU staff, parents, and foster
parents to obtain feedback regarding the services. A satisfaction survey was developed, and
beginning in October 2015, the survey was provided to all parents that completed CFU services.
The surveys and focus groups identified the following strengths:
1. Access to services – Parents felt that the services were conveniently located (two school
sites within ABC School District).
The following is an example of the Status of Strategies Section in a SIP Progress
Report Narrative. This excerpt serves only as an example and does not fully cover
an entire SIP Progress Report. For further detail, please refer to the C-CFSR
Instruction Manual.

2
Ca
lifo
rnia
Ch
ild
an
d F
am
ily
Se
rvic
es R
evi
ew
2. Speediness to services – Social workers and parents reported that services were
established quickly once they were referred to the programs. Within 2 weeks of
referral, parents were being engaged to participate in services.
3. Aftercare services – One of the unplanned benefits of referring the families to CFU was
that the services continued once the children were returned home and in some cases
when the case was closed out. Social workers and parents reported that because CFU
stayed involved with the family when children returned home and/or when the case
closed, children were returned to the home sooner than they would have otherwise.
Anecdotally it also appeared to social workers and CFU staff that families that continued
to participate in CFU services were not reentering the system. CFU staff also reported
that they liked having the flexibility to accept former clients back into the program.
4. Engaging Fathers – Parents reported that fathers were being welcomed into the services
and SW’s reported that more kids were being returned to their father’s sole custody.
The surveys and focus groups identified the following barriers:
1. Not enough families being served – Although 20 slots were set aside in the beginning of
the year to serve CWS-only families, the County found that the demand was higher.
Agency Response: Through the past few years, ABC County CWS and CFU have slowly
increased the number of families being served in response to this need.
2. Curriculum not meeting the needs of the parents – Parents reported that the curriculum
for the parent education services was geared towards children under the age of 12.
Parents and social workers stated that the curriculum needed more focus on parenting
teenagers.
Agency Response: ABC County and CFU met to discuss this barrier and decided to add
Teen Triple P for parent of 12 – 16 year olds. Teen Triple P services began in February
2016.
3. Availability of parenting classes – Originally, classes were scheduled in the evenings to
accommodate working parents; however, many parents reported it would be more
convenient to have classes offered during the day. Sometimes childcare was an issue at
night, but less of an issue when the children were in school. Also, some parents
reported that they worked at night and a class during the day worked better for their
schedule.
Agency Response: Two classes during the day were added to accommodate parents’
request.
In Year 3 of the SIP, according to the original SIP Timeline, it was expected that ABC County
would have evaluated the outcomes of the parents receiving the services. However, this
timeline has been adjusted. ABC County is currently in the process of evaluating outcomes, and

3
Ca
lifo
rnia
Ch
ild
an
d F
am
ily
Se
rvic
es R
evi
ew
as a result, the adjusted date for completion is now December 2016 (See Action Step G on Pg.
XX of the SIP PR Chart). Based on the satisfaction survey feedback and feedback from focus
groups in Year 2, adjustments to the services were made, which resulted in the need to push
out the outcome evaluation timeline. The results of the evaluation of outcomes will be
available and provided in ABC County’s next SIP Progress Report.
METHOD OF EVALUATION AND/OR MONITORING:
CFU captured the demographics of the families that were served since the beginning of this SIP
strategy. 72% of the families that were served in FY 2014-2015 were Latino, followed by 19%
White, and 9% Black. This coincided with the demographics of the community. In FY 2015-
2016, ABC County found that the racial demographics of the families were very similar to the
previous year: 74 % Latino, 16% White, 9% Black, 1% Asian or Other.
The majority of families that were served reported they had 3 or more children in the family.
At least one of the children was school-age, but the age varied for the other children in the
home. Most families that were served had two parents in the home and about 20% of the
parents reported as single-parent households.
ABC County is currently evaluating outcomes by tracking families that participate in CFU
services, to determine the percentage of families reunifying within 12 months and also the
percentage of re-entries. The results will be discussed in the next SIP Progress Report.
ANALYSIS
ABC County’s performance in C1.3 on the most recent quarterly report that was published July
2016 (Q1 2016) was 34.5%.1 Out of the 194 children that entered care between October 1,
2014 and March 31, 2015, 67 children reunified with a parent within 12 months. County ABC’s
performance has increased by 5.8% since SIP implementation in 2013, meeting the Target
Improvement Goal for Year 3.
Anecdotally, based on feedback from stakeholder focus groups, it appears the strategy is
positively impacting timely reunification outcomes and may also be positively impacting re-
entry outcomes. Families referred to CFU are engaged in services within two weeks of being
referred. Early engagement in services has previously been linked to positive reunification
outcomes during case reviews completed during the CSA process. As previously discussed, CFU
can continue working with families after children have returned to the home. Because of this,
1 http://www.childsworld.ca.gov/res/CtyReport/July16/SAMPLECounty.pdf

4
Ca
lifo
rnia
Ch
ild
an
d F
am
ily
Se
rvic
es R
evi
ew
and the positive results social workers have seen from these services, social workers reported
that they are able to safely recommend returning children to the home earlier in the case, than
if these services were not in place.
After further reviewing quantitative and qualitative data, ABC County CWS found that of the
children reunifying, more children are reunifying with the father over the past several years.
CFU and social workers have seen an increase in father participation since the CFU referral form
asks for information for both parents. CFU staff reported that they are contacting fathers just
as equally as mothers and fathers are remaining engaged in the services. Although parents are
often beginning services as a couple, by the time the children reunify, sometimes the parents
have split and the children are reunifying with a single parent. At times, the single parent is the
father.
Based on the positive results discussed, ABC County will continue moving forward with this
strategy. In conjunction with the other three SIP strategies targeting Reunification within 12
Months, ABC County continues to believe that the Target Improvement Goal for the end of this
SIP Period of 48.1% is a realistic and attainable goal.
Rev. 11/2013
5 – YEAR SIP PROGRESS REPORT CHART
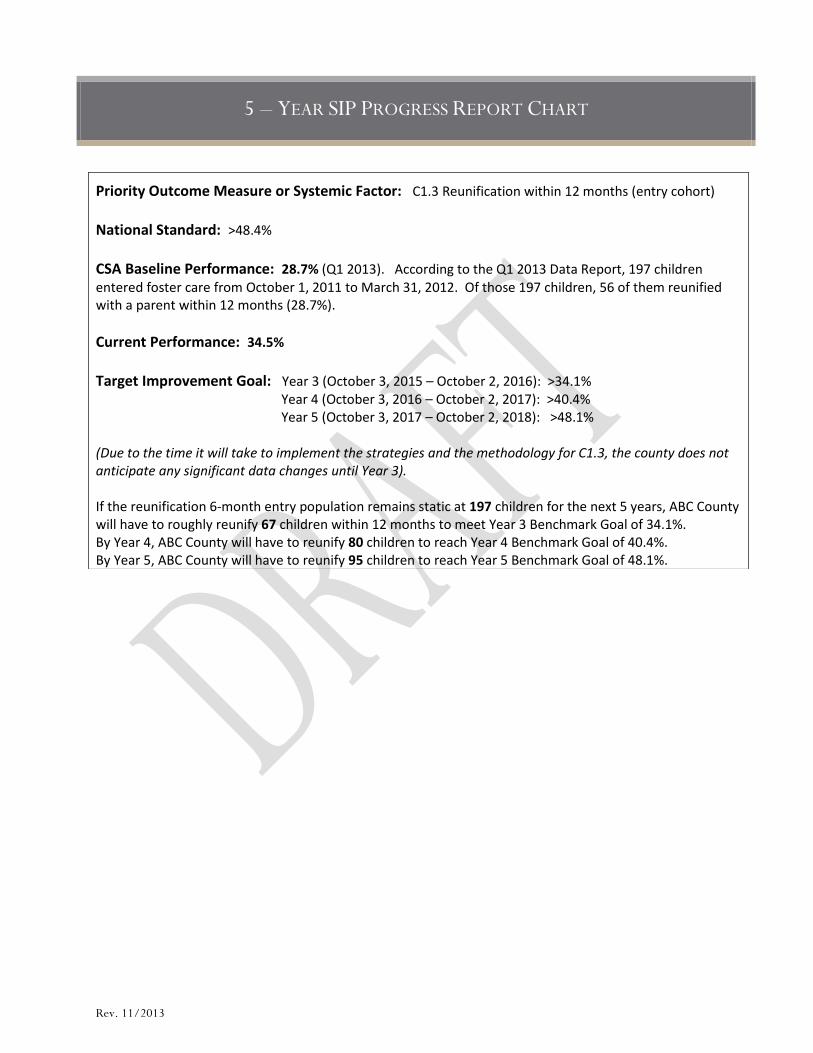
Priority Outcome Measure or Systemic Factor: C1.3 Reunification within 12 months (entry cohort) National Standard: >48.4% CSA Baseline Performance: 28.7% (Q1 2013). According to the Q1 2013 Data Report, 197 children entered foster care from October 1, 2011 to March 31, 2012. Of those 197 children, 56 of them reunified with a parent within 12 months (28.7%).
Current Performance: 34.5% Target Improvement Goal: Year 3 (October 3, 2015 – October 2, 2016): >34.1% Year 4 (October 3, 2016 – October 2, 2017): >40.4% Year 5 (October 3, 2017 – October 2, 2018): >48.1% (Due to the time it will take to implement the strategies and the methodology for C1.3, the county does not anticipate any significant data changes until Year 3). If the reunification 6-month entry population remains static at 197 children for the next 5 years, ABC County will have to roughly reunify 67 children within 12 months to meet Year 3 Benchmark Goal of 34.1%. By Year 4, ABC County will have to reunify 80 children to reach Year 4 Benchmark Goal of 40.4%. By Year 5, ABC County will have to reunify 95 children to reach Year 5 Benchmark Goal of 48.1%.

2
Ca
lifo
rnia
- C
hild
an
d
Fa
mily
Se
rvic
es R
evie
w
Strategy 1: Refer parents who are receiving Family Reunification Services through CWS to Community and Families United (CFU) for parent education and parent support groups.
CAPIT Applicable Outcome Measure(s) and/or Systemic Factor(s): C1.1 Reunification within 12 months (entry cohort) UPDATE: C1.4 Reentry Following Reunification
CBCAP
PSSF
N/A Title IV-E Child Welfare Waiver Demonstration Capped Allocation Project
Action Steps: Implementation Date:
Completion Date: Person Responsible:
A. Identify the number of CWS parents to receive services through CFU for each fiscal year. Develop a criteria guideline of families to be referred to the program.
October 2013 April 2014
UPDATE: Completed November 2013
Community and Families United Site Coordinators
CWS Program Manager
B. Create a Referral Form and Referral Process for identified CWS parents that need services. Update the Referral Form and Policies and Procedures when necessary.
January 2014 June 2014
UPDATE: Completed June 2014
CWS Program Manager and Staff
C. Develop a training process with ABC School District. Train CWS Staff and ABC Unified School Staff on Referral process and procedures.
April 2014 October 2014
UPDATE: Completed October 2014
CWS Administrative Staff

3
C
alifo
rnia
- C
hild
an
d F
am
ily
Se
rvic
es R
evie
w
D. Refer CWS parents who meet the criteria in Action Step A to the parenting classes that are provided through CFU.
October 2014 October 2014
UPDATE: Completed August 2014
CWS Social Workers
ABC Unified School District Personnel
E. Capture demographics and data of all CWS families who have been served through the program. Develop a Satisfaction Survey and ask families about satisfaction with the program upon completion of the program.
October 2014 October 2015
UPDATE: Completed October 2015
Community and Families United
F. Conduct focus group on annual basis of parents who have received parenting services through the program and make adjustments to the program, as needed, based on parents’ feedback.
June 2015 October 2015
UPDATE: Completed July 2015
CWS Staff
G. Evaluate the outcomes of the parents receiving the services. UPDATE: See pg. XX of 2016 SIP Progress Report for complete update.
October 2015
UPDATE: October 2016
April 2016
UPDATE: April 2017
CWS Staff