calculation of tmc threshold in the presence of beam-beam
TRANSCRIPT
SL/ Div Reps
12 October, 1994 OCR Output
Geneva, Switzerland
*on leave of absence from IHEP, Beijing, China
schemes are also discussed.well with experimental results. Chromatic effects and threshold currents in different beam-beamRF copper cavities and the calculation results of the threshold for 4 x4 and 8 x 8 bunches agree quiteThe wake fields induced by the head particles in different bunches are evaluated locally at the 120injection is calculated based on a two particle head-tail model and a linear beam-beam force mode.The effect of the residual beam-beam force on the horizontal mode coupling threshold of LEP at
Abstract
Guangxiao Li*, Karel Comelis
Calculation of TMC Threshold in the Presence of Beam-Beam Force
CERN—SL-94-85
llllllllllllllllllIIIIlllilllllllllilllllll
CERN LIBRARIES, GENEVA
CERN SL/94-85 (AP)
CERN - SL DIVISION
EUROPEAN ORGANIZATION FOR NUCLEAR RESEARCH
contribution of the bellows is small in the horizontal plane. Therefore, the impedance can be OCR Outputresonance frequency of about 2 GHZ. For a bunch length of about 2 cm, the impedancecopper cavities in LEP ring which contribute to a transverse broad—band impedance withThe LEP impedance comes mainly from the RF cavities and bellows[1]. There are 120 5—cell
1.2 Impedance and Wake Field Model
g(T) represents the wake field strength with unit of m‘1. 6,,(s) is the periodical 6 function.
¤¤¥(5)+Kx($)¤¤z = 6p(S)g(—T)¤¤1¤>Y(S) + Kx(S)¤¤1 = 6p(3)y(T)=¤z
oscillators evolve according to:therefore couples with the wake force created by the "head” particle. The two coupledare used to represent the head and the tail of the bunch. The motion of the “tail" particlea bunch circulating in a storage ring, two super particles with opposite synchrotron phaseA simple 2 particle model[4] is applied to calculate transverse head—tail mode coupling. For
1.1 Head—tail Model
so that only the wake fields generated at the RF cavities are taken into account.contribution from RF cavities dominates the impedance, especially in the horizontal plane,the RF cavities and the bellows. However, with a bunch length above one centimeter, thethe beam-beam interaction as a linear force. The impedance of LEP mainly comes froma two particle model is employed for the description of the head-tail coupling. We treatcomputing time when simulating this complex system of many counter-rotating bunches,a more realistic, quantitative explanation of this mechanism. In order to get reasonableon the head—tail threshold have been published [2] However, simulation is needed to give
Some theoretical works and measurements on the influence of residual beam~beam force
injection energy.
it preferable to study the horizontal TMC when counter-rotating beams are presented atbe lower than the vertical one as shown by the pictures in the Appendix. This makesenhanced evidently by the counter-rotating beams. The horizontal TMC threshold can even
Furthermore, we observed the fact from the Q—meter that the horizontal TMC can beRF cavities by the counter-rotating bunches.the residual beam-beam interaction at the crossing points and the wake force created at theless than the single beam bunch intensity. This suggests that the reduction is mainly due to
The bunch intensity obtained with counter-rotating beams in LEP is always found to becase of counter rotating beams, the above situation changes.TMC threshold can never be reached, since its value would be about 0.7 mA. However, infor a Qs:0.08 and a bunch length of 20 mm[l]. Under the same conditions, the horizontalrn:-1 makes the threshold current at injection energy in a single bunch to be about 0.6 mAcurrent especially at injection energy. The vertical head—tail mode coupling of m=0 andln LEP, the transverse head—tail instability is found to be the dominant limit to the bunch
1 Introduction
The equations of motion then become OCR Output
the wake forces and beam-beam forces are evaluated locally.same reason exists for the beam—beam force at different crossing points. Consequently, alltwo localized kicks. Hence the wake fields are evaluated separately in each RF cavity. Thezontal betatron phase varies considerably, the wake force can not be approximated by one orSince the RF cavities are distributed around the ring, occupying a range in which the hori
2 Equation of Motion and Simulation Method
KW, is the beam-beam strength at the crossing point when the bunch m meets bunch n.bunch, and xm (i=1,2) are the horizontal coordinates of the particles in the opposite bunch.
Here xmy (izl,2) are the horizontal coordinates of the two (super) particles in the m-th
i Z 1,2xii,i($) 'l' I{¤v(·S)xn.i = _ 23:1 §Kmn(xn.i " mm,j)6z>($ ' Smn)xiihifsl 'l` K¤¤(5)$m.i 2 _ E§:1§l{m"7·($m»i_ xmjlépis _ Bmw)
be expressed by:they are separated vertically or defocusing if they are separated horizontally, and hence cancrossing point of longitudinal position s=s,,,,,, the horizontal beam—beam force is focusing ifapproximate the beam—beam force by a linear one. When the bunch m meets bunch n at athe oscillation amplitude of the particles is small with respect to the separation, we canthe beams are separated horizontally by the pretzel in the additional crossing points. Ifinteraction points by the electrostatic separators in the 4x4 scheme. In the 8><8 scheme,During injection at 20 GeV, the counter—rotating beams are separated vertically at the 8
1.3 Beam-Beam Model
bunches.
be valid for LEP since the bunch spacing is quite large even in the case of colliding 8><8This kind of wake is hence short range and vanishes behind a single bunch. It should
the wake field, 0*, and ws are the bunch length and synchrotron oscillation frequency.the “tail” particle. A > 0 is the damping constant of the wake field. wz is the frequency of
T : 0, sin(w,t) is the longitudinal position difference between the “head" particle and
WOe"A’sin(w,T) (T > O)_ gh) _
(T S U)
an RF cavity can be represented by a damped oscillator:In the above situation, the transverse wake field produced by a particle passing through
length larger than 1 cm.approximated by a single broad—band impedance representing the RF cavities, for a bunch
gets a kick. Then for the tail particle, OCR OutputIn an RF cavity, we assume the head particle experiences no force while the tail particle
X’at the end of the lattice.(2)
Here xm and x’<1> are the horizontal coordinates of a bunch at the beginning, xand<2>
"2’ = -Xm$m(¢x21)+ x’<1>cO5<¤z»,2i>(6)
(2) = X(1)c0s(¢,21) + X’(1lsin(1b,21)
For a lattice by the phase advance 1/1,21, the transfer matrix is then simply a rotation
BQI/2(<%$($l + 5Iw’(s))(5)6£1"¤¤(5)xw,) Z iX’(w,> Z
f§H;1ds
We calculate the coordinate evolution in the normalized phase space:
their transfer lines turn after turn are then recorded for further analysis.respective transfer lines when they exit. The coordinates of all the particles at the exit oftheir “head” and ‘“tail” particles start their motion simultaneously and will re·enter theirwhich are chosen as the respective beam-beam crossing points. The bunches as well as
All the bunches are then positioned at the beginning of their respective transfer lines,some of them will even circulate in the opposite direction.lines since they may be located at different positions in the ring at the same moment, andof one turn a special “transfer line” for a bunch. Different bunches have different transfercrossing points in the same order turn by turn. Thus, it is reasonable to consider the elements
A bunch circulating in the ring, passes drift spaces, magnets, RF cavities and beam-beamoscillation of the “head” and “tail” particles can be evaluated turn after turn.nal position of each bunch in the ring is the same after each revolution. Then the transverse
The coherent synchrotron oscillation of the bunch center is ignored so that the longitudiRF cavity.the longitudinal position difference of the "head” particle and the “tail” particle at the r-thnumber of RF cavities on the ring and Nb is the total number of bunches per beam. T, isand smh is the position where the m-th bunch meets with the n-th bunch. N, is the total
Here sm, and sm are the positions whore bunch m and bunch n passe the r-th RF cavity,
xQQ_2(s) + Ix'x(s);cn,2 .—; :1 p(S;T);}{m sm TL ( x",2 __ UCAN LJ)ETél 5nT)g =16—T)i§;Z* 2_ _ SmJ(”(xn 1 i _ ITU 1J;v;;_1(s) + I&'x(s)x,,,1 :
(4);;@1 (p g--; Wg ,§fp$ 61Z; P($ _ Smn n xm ,2 — mn _ V)1:Ql_2(s) + Ix’x(s);zm,2 : ;r;T:1 (L 5 sJ(_nT)IMZvbs ’V"1 Z2 .= $(im §’)`Smj€ T5I{( " xm nij
—}- Kx(s);1:m_1 ; Z22 6 ¥P(_ Sm ) r g W
1.e. OCR Output
The Fourier transformation is then applied to the center of mass position of the bunch,
X2 Z(9)
X] = X1(t)
instance, we may get the positions of two particles in the same bunch:change. As a result, we can obtain the positions of all particles varing with time t. Foran RF cavity or a crossing point, only the slope of motion is assumed to have a suddenor beam-beam force. Here, UJ0 is the revolution frequency. When a particle passes throughphase plots will rotate with steady angular speed wB=Q,,w0 as long as there is no wake forceGiven the initial coordinates of all particles in the phase space for different bunches, the
3.1 Fourier transformation
3 Fourier Analysis and Calibration
beam force at different crossing points results in the same amount of tune shift.Furthermore |B;Km,,| = is imposed for each crossing point so that the residual beam
is the betatron function at this crossing point.particle in bunch m. Km, is the residual beam-beam force strength at the crossing and B;
))and Xi? after crossing, Xgg, XLS, Xi}; and Xxare the respective coordinates of the “tail”A Here, Xmh anu Am], are the coordinates of the head particle in bunch m before, Xmh(2)(1) NMV’(1)
?)Xg Xt?) — USR m"(X(1) nt _ £gQ|i_ 2 sz )X(1) ntXY?) nt
’(2)X ><:.<,;»‘ BCH I ( ni.) - §£§Z___ V53? )Xi;) (8 >Xygé
2)X;`XXi? ` Bgk ( mn #2 g ;_g>) .
xg;})X;2
XXLS;) "'· I mi — {gl QLP)Xg; XS;
At a crossing point where bunch m meets bunch n, we have for head and tail particles,passing the RF cavity. B; is the horizontal betatron function at the RF cavity.displacement of the head particle at the RF cavity which is supposed unchanged during
) )RF cavity and X?and XPare the coordinates after the wake kick. Xh is the horizontal
l) )Where Xgand XTare the coordinates of the tail particle before the wake kick at the
7 ( ){ X5?) : XP) XP) = Xi(1)‘l' 5;9(Tr)Xh

2.22222 >< 104] horizontal separationK _ —
(11) OCR Output2.22222 >< 10"2I vertical separationWO = 7.57129 >< 10'4I
have,bunch current of 0.45 mA, which corresponds to the measured coherent tune shifts. We thusadjusted such that it leads to the same beam—beam tune shift of 0.0015 per crossing for athreshold current is 0.7 mA for a single bunch. The beam-beam force strength is also
The parameter WO in the wake function g(r) is adjusted so that the horizontal TMCare: Q:,,:90.27, Q,-:0.08, /\=1.2><101°s`1 and fz=2.0 GHZ.The injection lattice parameters of LEP are used for the calculation. Some main parameters
3.2 Calibration
Couplingfor Single Bunch Horizontal Mode
Figure 1(b) Single Bunch at 0.6rnAFigure 1(¤) Calibration: I,_h=0.’7m.A
rnzquzmcv 0/0,,cunnmur Pm: mmcu (iu)
0.15 0_00 0 0.2 0.4 0.0 0.s 1 0 0.1 0.2 0.:1 0.4 0.5
m=+2
m_+1,,,.-10.20 025
mn,60.25 E¤—¤¤
3 0.:10
E 0.750.:15
m_+11.00
0.40
m- 0-+2 1.25
0.45
if N is large enough, for instance, Nr-3000.position and relative strength indicated by |A(<.o)| will be independent from initial coordinates
The inode spectrum strength at frequency w is It is found that the spectrumWhere N is the number of turns of the bunch and Tg is the revolution period.
dt(0;) zf [ ]€0 2NT X i X i . O¤<¤t
experiences no beam-beam force and is referred as the m=O mode. OCR Outputelectron bunches added to that of the center of mass of all the positron bunches. This mode
The first kind is the “a mode" which represents the motion of the center of mass of allthe strength of the beam-beam force which they experience.be also many oscillation modes. These modes can be classified in three kinds according tobeam-beam forces at the crossing points and the wake fields at the RF cavities, there willbunches, and an equal number of counter-rotating positron bunches, which couple through
HOWCVCI`, b€C8.l1S€ th€I`€ BIC IT1&.1'ly €l€Ci}I`OHmass oscillations of the bunches in simulation.
need only take into account the center ofSince we are interested in coherent effects, we
4.1 Mode Classihcation
4 Coherent Mode Analysis
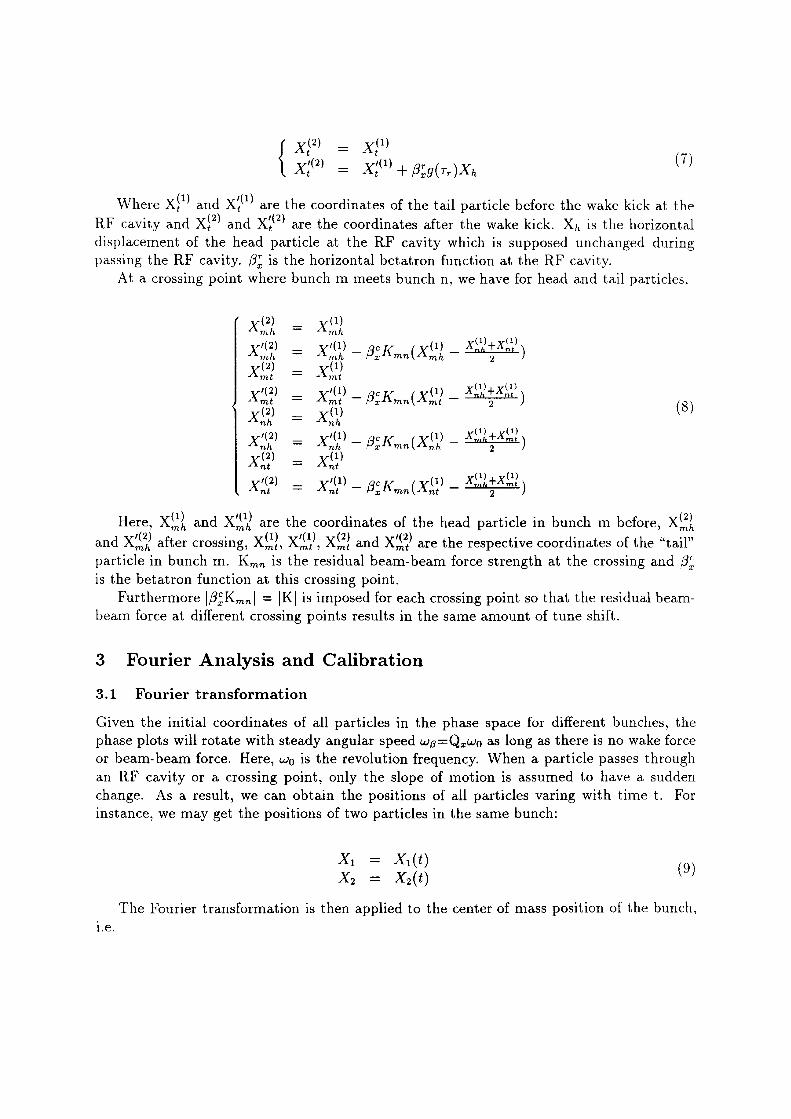
With Single Interaction Point at 0.7 mA/bunch without Wake ForceFigure 2(b) Spectrum of 1 x 1 bunchFigure 2(¤) Be¤m—be¤m Force Calibration
FREQUENCY u/ao,cunnmm Pm ¤UNcH (MA)0 0.1 0.2 0.3 0.4 0.50 0.25 0.5 0.75 1 1.25 1.5
0.00.26a
0.5vmods
@.270
m¤d•1'0
{1.272
1.5
vrmads
2.00.274
0 mods
2(b) shows the 0 and vr modes for the 1 >< 1 bunches for a bunch current of 0.7 rnA.force for a single interaction point. It is linear since the beam-beam force is linear. Figuredependence of the residual beam-beam tune shift on bunch current in the absence of wakecenter of mass of a single bunch oscillation at the current of 0.6 mA. Figure 2(a) shows theand m=—l modes for a single bunch. Figure l(b) is the Fourier analysed spectrum of the
Figure l(a.) shows the effect of calibration to the threshold current of TMC between m:-O

for single bunch, 0.45 mA is far away from the threshold near 0.7mA. OCR Outputwhich makes the beam-beam force calibration ( mentioned in Figure 2(a) ) effective becauseaway from the threshold, the tune shift dependence on the bunch current is rather linear,especially near the mode coupling threshold. Fortunately, when the bunch current is furthertaken into account. The tune shift dependence on bunch current becomes quite nonlinearthe 0 mode ), will no longer depend linearly on the bunch current when the wake forces areThe beam-beam tune shift, ( for simplicity, defined as the shift of the rr mode away from
4.2 Effect of Wake force on Beam-beam Tune Shift
too week to be seen.
the intermediate modes (peak A) can also be found. Other intermediate modes are, however,synchrotron sidebands m=—l mode, m=+l mode and m=+2 mode. The rr mode and one of0.6 mA for each bunch. We can see clearly in this figure the 0 mode(m=0) and their threemode spectrum of the first electron bunch in the case of 4 >< 4 bunches , with current of
These three kinds of modes can be clearly found by simulation. Figure 3 shows thevr mode. These intermediate modes experience less beam—beam force than the rr mode.
The third kind of modes are intermediate modes with frequency between the 0* and theexperiences the strongest beam-beam force.all electron bunches minus that of the center of mass of all the positron bunches. This mode
The second kind is the “·rr mode” which represents the motion of the center of mass of
Figure 3 Mode Classification
FREQUENCY cu / mo
0.50.40.30.1 0.20.0
xn-+1 m-+2
0.5
m--1
1.0
1.5
m=0
2.0
1 - 0.s00 1n, qx- 90,270, qs- 0.¤s0, sms- 2.0 cu, c1·m0_X- 0.0, cR0w.Rn*z= -0.0:; 1/s
HEAD-TA1]. OSCILLATION WITH THE PRESENSE OF BB FORCE: BB= 4 X 4
TM SPECTRUM ANALYSE
are the synchrotron sidebands of the m=O mode, it is assumed that these modes are the OCR Outputthat also some modes split from m=:t1 and m:2 modes. Since m:;l:1 and m=2 modesthe intermediate modes and the vr mode split from the cr mode. It is more surprising to findSimulation of multi—bunch evolution in the presence of residual beam-beam forces shows that
4.4 Synchrotron Sidebands of vr Mode
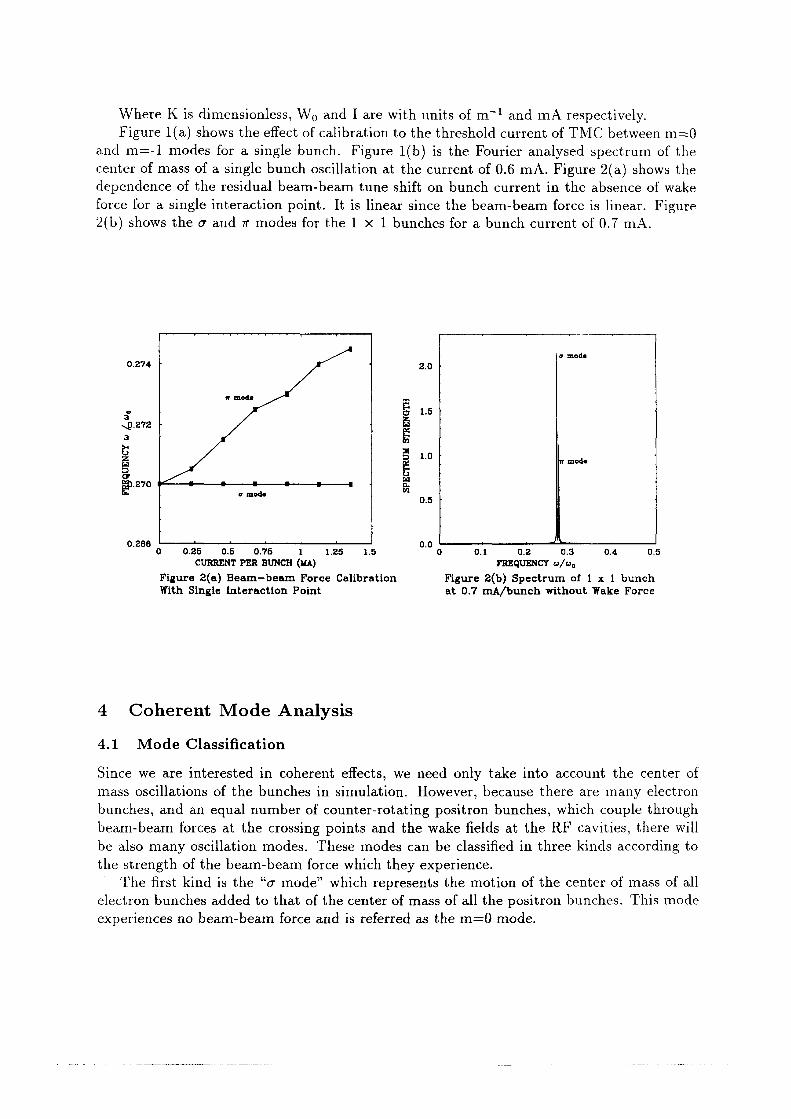
reduces the mode coupling threshold.without the residual beam-beam force. It is quite obvious that the residual beam—beam forcethreshold. Figure 5 compares the mode evolutions in the case of 4 >< 4 bunches with and
This effect is found to be nonlinear even when the bunch current is quite away from thedescribed by an earlier paper[3].However, the beam—beam force does enhance the shift of the m=;l:1 mode for instance, asAs mentioned before, the m=O mode (or 0 mode) is not affected by the beam—beam force.
4.3 Effect of Beam-beam Force on the m=i1 Mode
enhanced by the wake force near mode coupling.threshold is approaching. This indicates that the beam-beam interaction is dramatically4 bunches. It is evident that the rr mode shifts quickly away from the 0 mode when the
Figure 4 shows the nonlinear effect of wake force on the tune shift in the case of 4 ><
with 4 X 4 Buuches
And m=l Mode Due to B-B forceof 4 X 4 BunchesFigure 5 Additional Shift of m=-1Figure 4 Calculated B-B Tuneshift
crmazm pm mmci-1 (in)cunnmm pan auucu (in)0 0.2 0.4 0.0 0.s
0.150.000 0 0.2 0.4 0.s
m--10.20 ¢"·°" "
;’-· *“b.005/ _ _
S 0.25m=0
@.010E; 0.30
scum mu B-a mac
msn; N0 ia-ia 1-*01201-:@015
03,, .e‘i(‘ F
fl F
0400.020
m-2
0.45
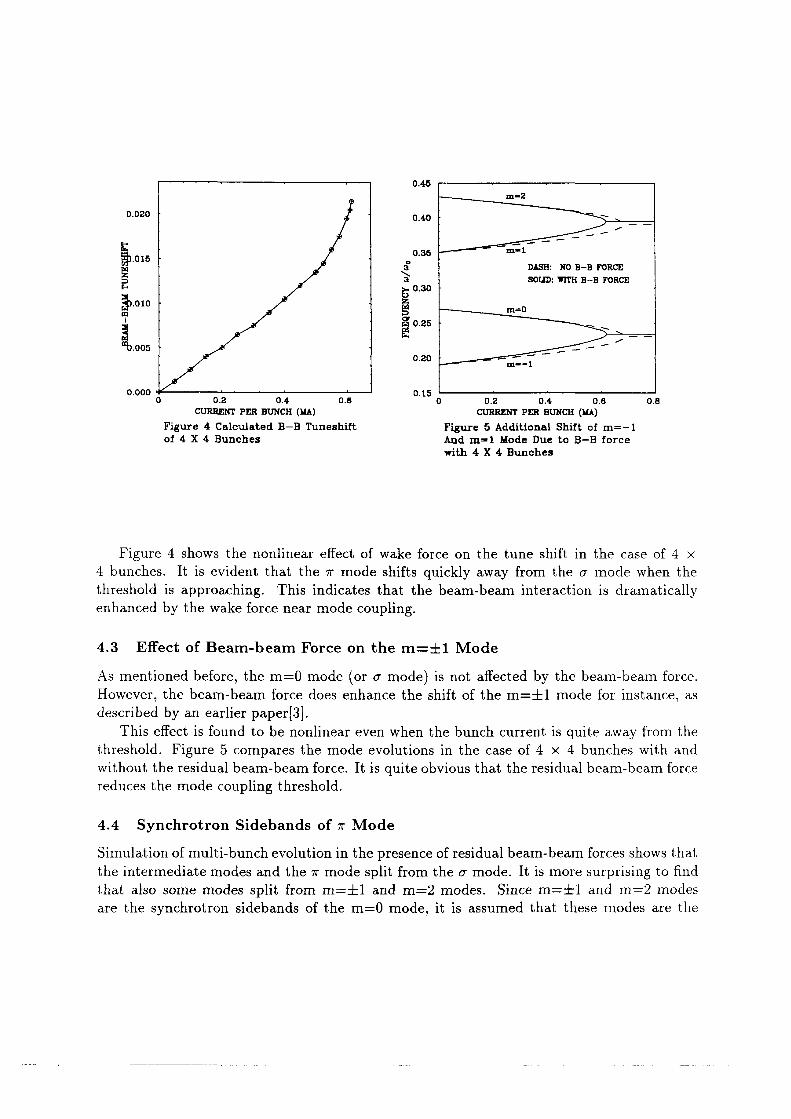
The approach of these two modes leads to a threshold of 0.677 mA, which is 3.3% lower than OCR Outputlt is evident that the TMC instability results from the coupling of m=0 and m=—l modes.
are not well understood.
this motion by the wake force. They correspond to peaks a,b,c and d. Other spectrum peaksB(<.0,,+wS) and C(w,,-+-20;,). The m=0, m=-1, m=+l and m=+2 mode are also coupled toforce, and we see the rr mode and its three synchrotron sidebands with peaks A(w,,—0.>,),three synchrotron sidebands. The XCc—XC,, motion is affected most strongly by beam-beambunch. The XC,,»+Xc,, motion cancels the beam-beam effect and we see m=0 mode and its6(b), respectively, with XC, and Xcp correspond to the center of electron bunch and positronand Xcc—Xcp for bunch current of 0.675 mA (near threshold) are shown in Figures 6(a) andand will shift the vr mode to a higher frequency than that of 0 mode. The spectra of XCE+XC,,separated vertically. The residual beam—beam force is then focusing in the horizontal plane
First, the two bunches are assumed to meet at the lP2 and lP6 of LEP where they areThis make it easier to distinguish the 7T mode and its synchrotron bands from other modes.
Take the simplest l >< 1 bunch case as an example, where no intermediate mode exists.
as shown below.
of its synchrotron sidebands may also lead to bunch instability under certain circumstancesbe paid to it and its synchrotron sidebands. The mode coupling between the rr mode and one
Because the rr mode represents the strongest beam-beam force, special attention shouldsynchrotron sidebands of the correspondent intermediate modes and the wr mode.
Force at 0.675 mA per BunchForce at 0.675 HLA per Bunchfor 1 X 1 Bunch with Focusing B-Bfor 1 X 1 Bunch with Focusing B-B
Figure 6(a) Spectrum of X¤,+XcP Figv.u·e 6(b) Spectrum of Xe,-XB?FREQENCY w/es, FREQUENCY rn/wc
0 0.1 0.2 0.:s 0.4 0.5 0 0.1 0.2 0.:1 0.4. 0.50.00
m-2
m-1
0.01
g 5
g 0.02
Z kl 10E 0.00 o
m=·—1150.04”°'°
for horizontal TMC). OCR Outputits synchrotron sideband w,,—w, (instead of the coupling between m=0 and m=-1 mode asare separated vertically, the threshold will be given by the coupling between the rr mode and
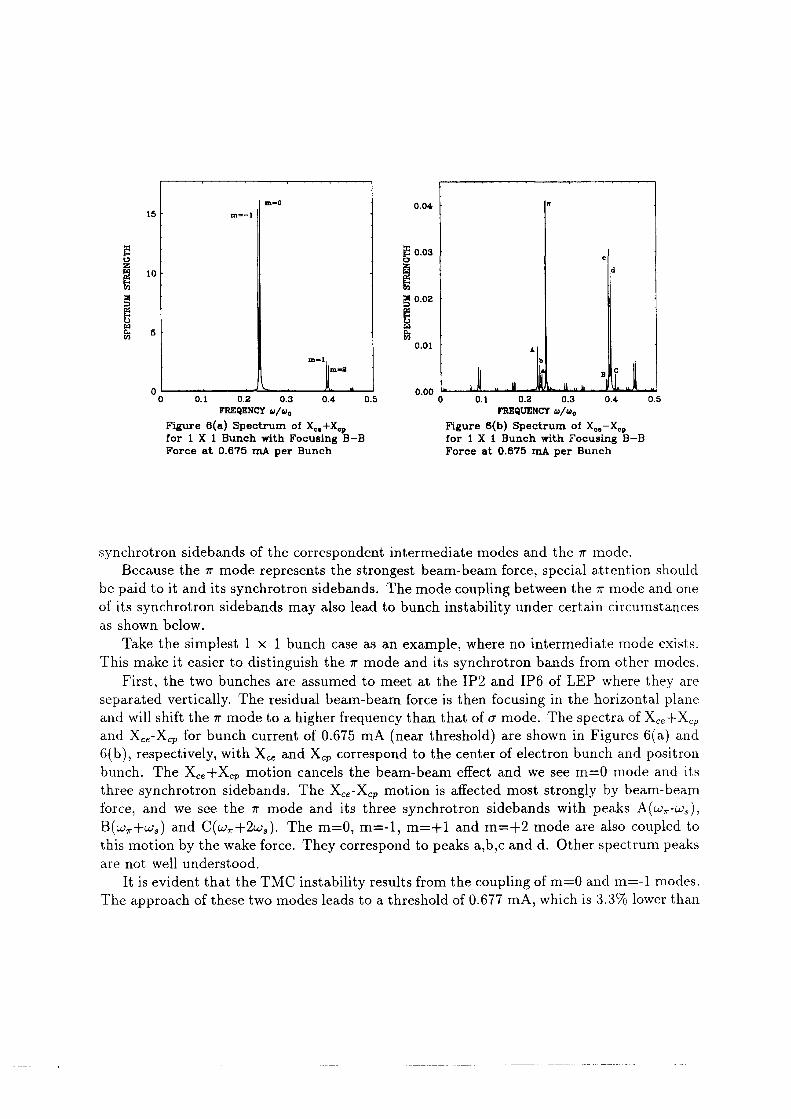
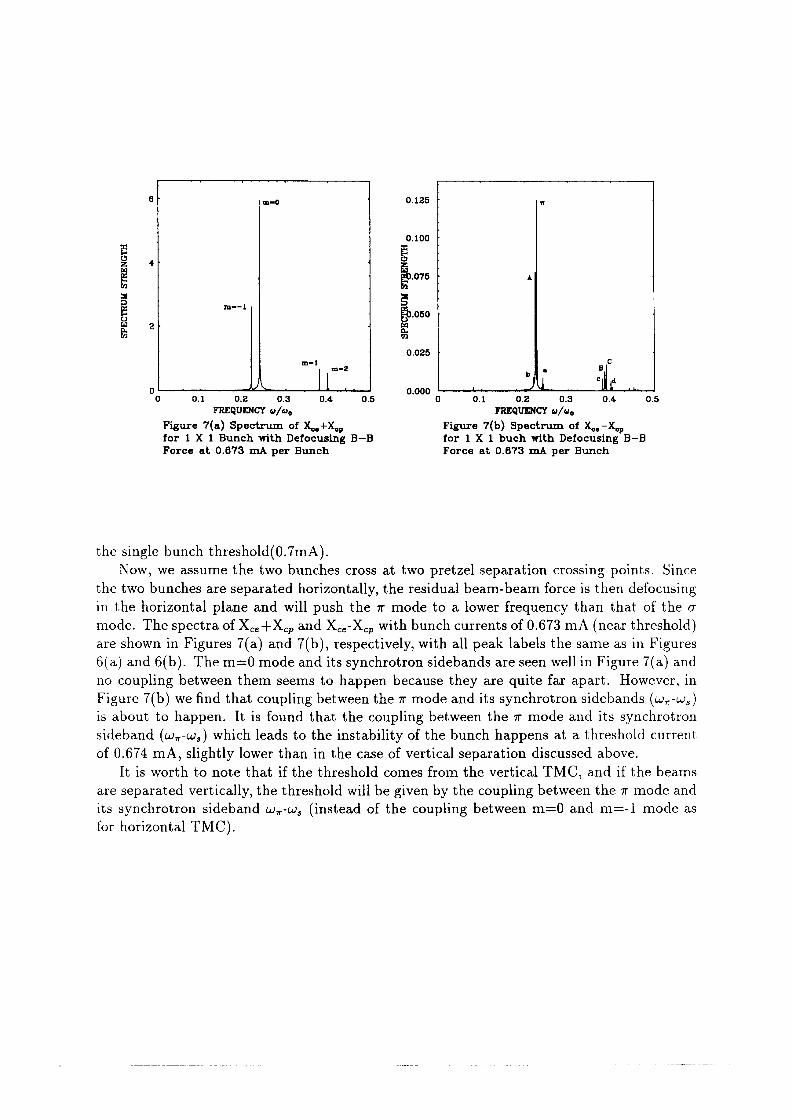
It is worth to note that if the threshold comes from the vertical TMC, and if the beamsof 0.674 mA, slightly lower than in the case of vertical separation discussed above.sideband (ui.,-w,) which leads to the instability of the bunch happens at a threshold currentis about to happen. It is found that the coupling between the vr mode and its synchrotronFigure 7(b) we find that coupling between the rr mode and its synchrotron sidebands (w,,—w,)no coupling between them seems to happen because they are quite far apart. However, in6(a) and 6(b). The m=0 mode and its synchrotron sidebands are seen well in Figure 7(a) andare shown in Figures 7(a) and 7(b), respectively, with all peak labels the same as in Figuresmode. The spectra of Xc..,+Xc,, and XC,-Xcp with bunch currents of 0.673 mA (near threshold)in the horizontal plane and will push the 7T mode to a lower frequency than that of the 0the two bunches are separated horizontally, the residual beam-beam force is then defocusing
Now, we assume the two bunches cross at two pretzel separation crossing points. Sincethe single bunch threshold(0.7mA).
Force at 0.673 mA per Bunch Force at 0.673 mA per Bunchfor 1 X 1 buch with Defocusing B-Bfor 1 X 1 Bunch with Defocusing B—BFigure 7(b) Spectrum of X"—X¤PFigure '7(¤) Spectrum of X“+X,,p
FREQUENCY w/u,FREQUENCY u/no
0 0.1 0.2 0.3 0.4 0.5 0 0.1 0.2 0.3 0.4 0.50.000
h I . Bm-1. m-20.025
@.0som--1.
.075
0.100
m-q 0.].25
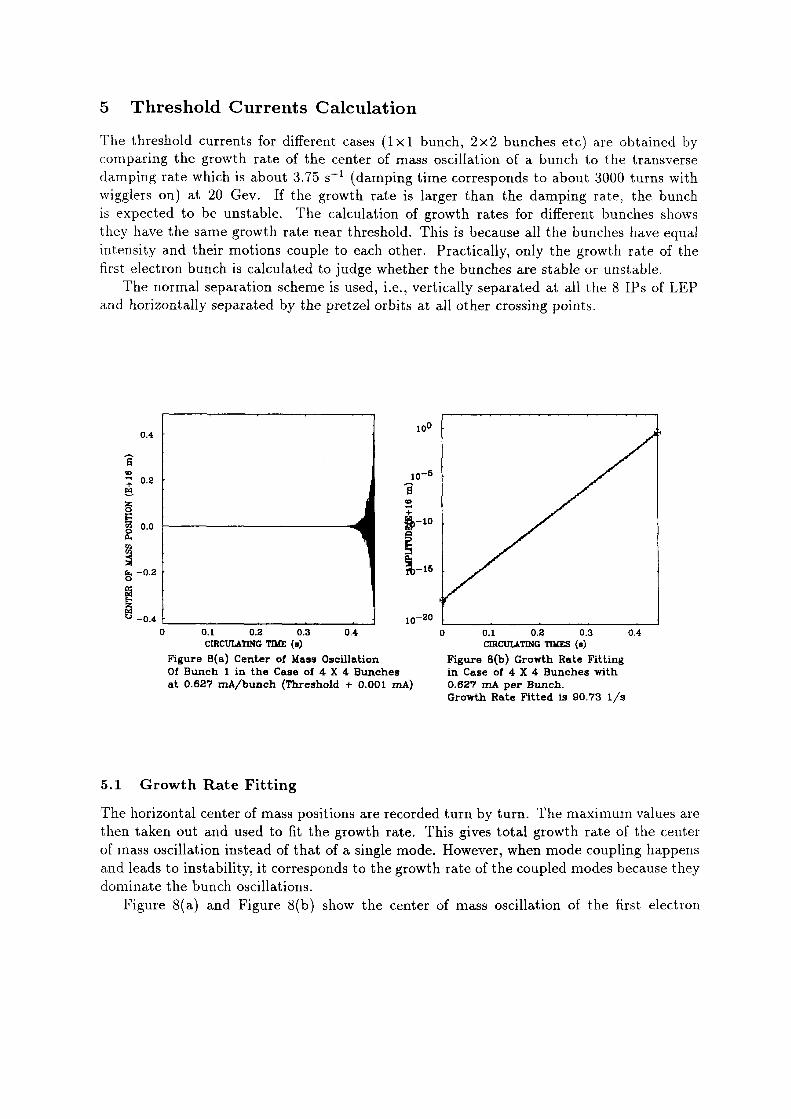
Figure 8(a) and Figure 8(b) show the center of mass oscillation of the first electron OCR Output
dominate the bunch oscillations.
and leads to instability, it corresponds to the growth rate of the coupled modes because theyof mass oscillation instead of that of a single mode. However, when mode coupling happensthen taken out and used to fit the growth rate. This gives total growth rate of the centerThe horizontal center of mass positions are recorded turn by turn. The maximum values are
5.1 Growth Rate Fitting
Growth Rate Fitted is 90.73 1/sat 0.627 mA/bunch (Threshold + 0.001 mA) 0.627 mA per Bunch.Of Bunch 1 in the Case of 4 X 4 Bunches in Case of 4 X 4 Bunches with
Figure B(b) Growth Rate FittingFigure 8(a) Center of Mass Oscillation
CIRCULATING mn: (¤) CIRCULATLNG mats (¤)
0 0.1 0.2 0.3 0.40 0.1 0.2 0.3 0.4
10*20U -0.4
g -0.2%- 15
0.0 @-10
0.2*0-5
*¤°
and horizontally separated by the pretzel orbits at all other crossing points.The normal separation scheme is used, i.e., vertically separated at all the 8 IPs of LEP
first electron bunch is calculated to judge whether the bunches are stable or unstable.intensity and their motions couple to each other. Practically, only the growth rate of thethey have the same growth rate near threshold. This is because all the bunches have equalis expected to be unstable. The calculation of growth rates for different bunches showswigglers on) at 20 Gev. lf the growth rate is larger than the damping rate, the bunchdamping rate which is about 3.75 s"1 (damping time corresponds to about 3000 turns withcomparing the growth rate of the center of mass oscillation of a bunch to the transverseThe threshold currents for different cases (l><1 bunch, 2x2 bunches etc) are obtained by
5 Threshold Currents Calculation
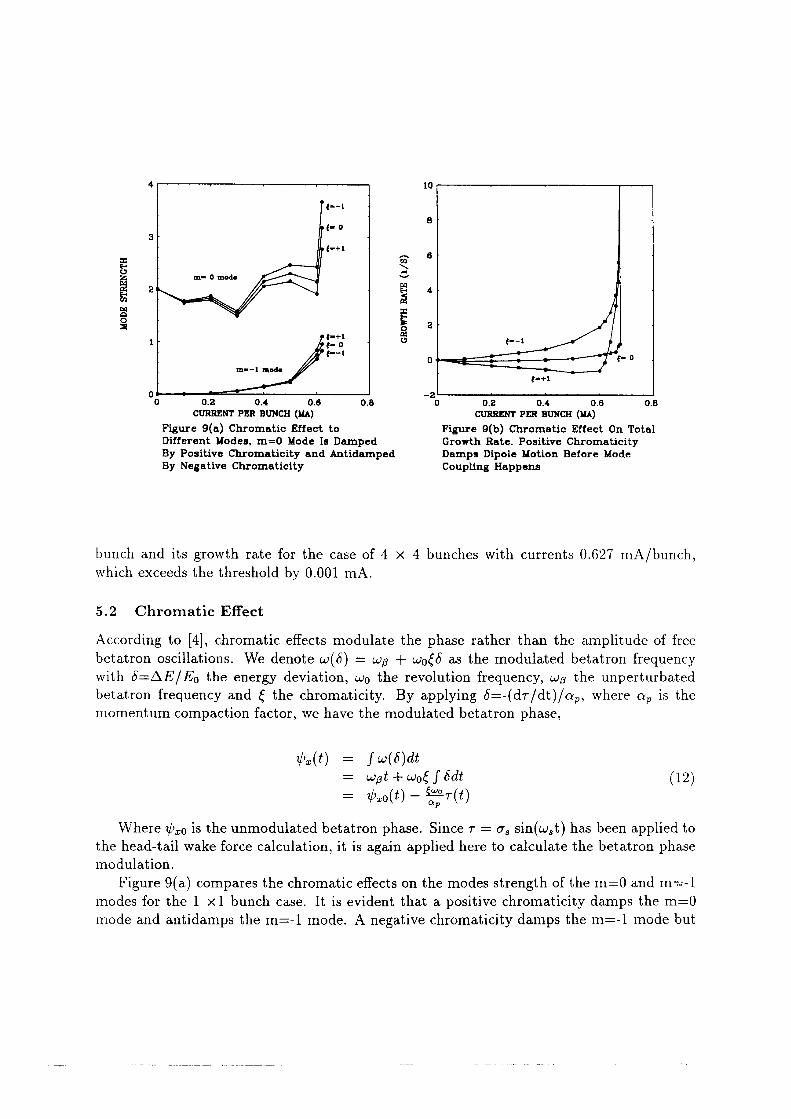
mode and antidamps the rn:-1 mode. A negative chromaticity damps the rn:-l mode but OCR Outputmodes for the 1 ><1 bunch case. It is evident that a positive chromaticity damps the m:0
Figure 9(a) compares the chromatic effects on the modes strength of the rn:0 and m=—l
modulation.
the head-tail wake force calculation, it is again applied here to calculate the betatron phaseWhere 7,01:0 is the unmodulated betatron phase. Since T = 0, sin(w,t) has been applied to
= %¤(**) · SEN)(12)= wat +w0§f6dt
$$0) = fw(6)di
momentum compaction factor, we have the modulated betatron phase,betatron frequency and { the chromaticity. By applying 6=—(dv·/dt)/04,,, where 04,, is thewith 6r-AE/ED the energy deviation, wo the revolution frequency, wp the unperturbatedbetatron oscillations. We denote w(6) : _<.·.>p + w0§6 as the modulated betatron frequencyAccording to [4], chromatic effects modulate the phase rather than the amplitude of free
5.2 Chromatic Eff`ect
which exceeds the threshold by 0.001 mA.bunch and its growth rate for the case of 4 >< 4 bunches with currents 0.627 mA/bunch,
Coupling HappensBy Negative ChromaticityDamps Dipole Motion Before ModeBy Positive Chromaticity and AntidampedGrowth Rate. Positive ChromaticityDifferent Modes, m=0 Mode Is DampcdFigure 9(b) Chrcmntic Effect On TotalFigure 9(¤) Chromntic Effect to
CURRENT PER BUNCH (MA)CURRENT PER BUNCH (MA)0 0.2 0.4 0.6 0.80 0.2 0.4 0.6 0.8
(-+1
m--1 m¤d•
5- 0G--1Q- ¤
e--1(-+1
m- 0 mods
{-+\
6· 0
G--1
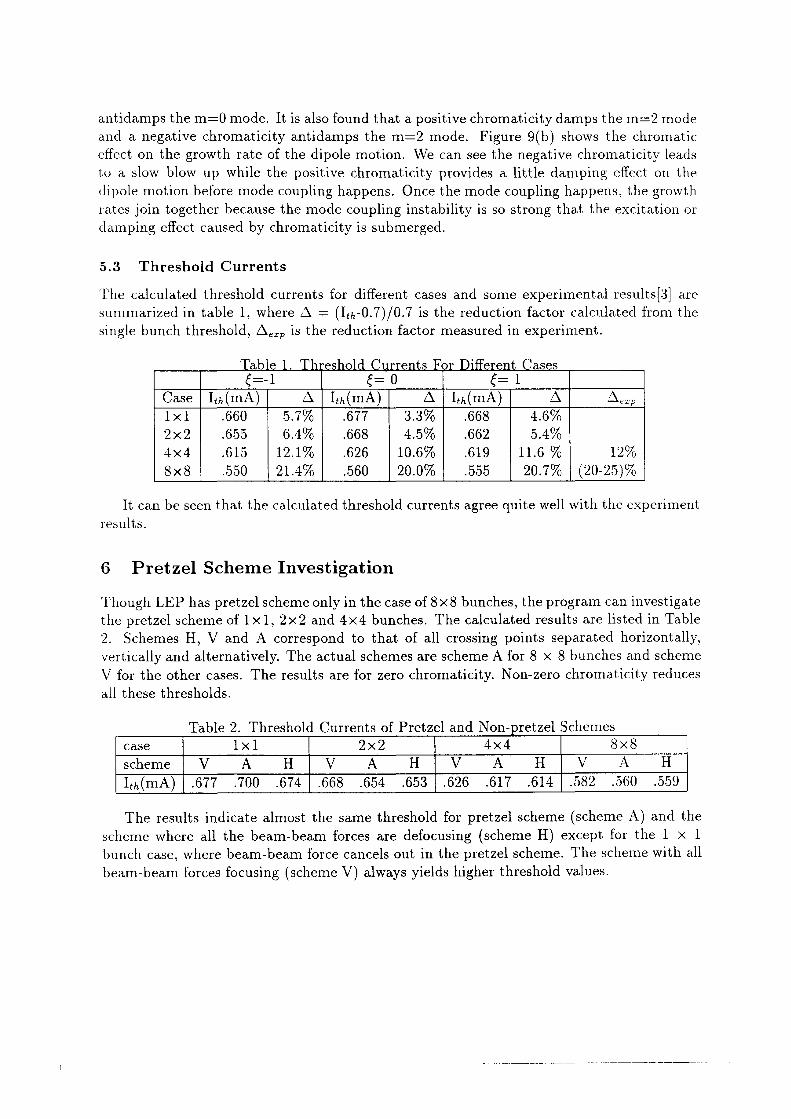
beam-beam forces focusing (scheme V) always yields higher threshold values. OCR Outputbunch case, where beam-beam force cancels out in the pretzel scheme. The scheme with allscheme where all the beam-beam forces are defocusing (scheme H) except for the 1 >< 1
The results indicate almost the same threshold for pretzel scheme (scheme A) and the
l»h(H1A) I .677 .700 .674 I .668 .654 .653 I .626 .617 .614 I .582 .560 .559schemelVAHIVAHIVAHIVAHcase 1><1 2x2 4x4 8x8
Table 2. Threshold Currents of Pretzel and Non—pretzel Schemes
all these thresholds.
V for the other cases. The results are for zero chromaticity. Non—zero chromaticity reducesvertically and alternatively. The actual schemes are scheme A for 8 >< 8 bunches and scheme2. Schemes H, V and A correspond to that of all crossing points separated horizontally,the pretzel scheme of l><l, 2><2 and 4X4 bunches. The calculated results are listed in TableThough LEP has pretzel scheme only in the case of 8><8 bunches, the program can investigate
6 Pretzel Scheme Investigation
results.
lt can be seen that the calculated threshold currents agree quite well with the experiment
sxs I .660 I 21.4% I .560 I 20.0% I .666 | 20.7% I (20-26)%4x4 I .615 I 12.1% I .626 I 10.6% I .619 I 11.6 % I 12%2X2 I .655 I 6.4% I .668 I 4.6% I .662 I 6.4%1X1 I .660 I 5.7% I .677 I 3.3% I .668 I 4.6%Case I Ith(mA) I A I lt;,(mA) I A I lt;,(mA) I A I Amp
§= 0 §= 1§=-1Table 1. Threshold Currents For Different Cases
single bunch threshold, Am, is the reduction factor measured in experiment.summarized in table 1, where A = (lt;,—0.7)/0.7 is the reduction factor calculated from theThe calculated threshold currents for different cases and some experimental resultsI3I are
5.3 Threshold Currents
damping effect caused by chromaticity is submerged.rates join together because the mode coupling instability is so strong that the excitation ordipole motion before mode coupling happens. Once the mode coupling happens, the growthto a slow blow up while the positive chromaticity provides a little damping effect on theeffect on the growth rate of the dipole motion. We can see the negative chromaticity leadsand a negative chromaticity antidamps the m=2 mode. Figure 9(b) shows the chromaticantidamps the m=0 mode. It is also found that a positive chromaticity damps the m=2 mode

School on High Energy Accelerators, Stanford, SLAC, 1982. OCR Outputl4] A. Chao, "Coherent lnstabilities of a Relativistic Bunched Beam", Second Summer
l3] K. Cornelis, Report CERN SL/94-06, P185, 1994.
CERN, 1992.
K. Cornelis etc, “lntensity Lirnit in the Presence of two Bearns”, SL—MD Note 76,l2]
Conference, Page 3429, 1993.ll] D. Brandt et al, “The LEP Impedance Model”, Proceeding of 1993 Particle Accelerator
References
particularly Jacques Gareyte, for their kind hospitality and help.friendship. One of the authors (Li) would like to thank all the members of AP group,
The authors would like to thank Bruno Zotter for his constant advice, discussions and
Ackowledgement
than schemes where the beam-beam force is focusing at all crossing points.of different beam—beam force schemes shows that the pretzel scheme has a lower thresholdpositive chromaticity the m=—1 mode is unstable before TMC is reached. The investigationmaticity leads to a slow blow—up of the dipole motion before mode coupling happens. Forsome damping on the dipole motion before mode coupling happens, while a negative chro
The effect of chromaticity has also been investigated. A positive chromaticity provideswell with the experimental results.reduced by 10.6% and 20.0% for the cases of 4 X 4 and 8 >< 8 bunches. This agrees quitefor a single bunch is 0.7 mA, the threshold currents (with the zero chromaticity), will beof the beam-beam force. If the wake strength WO is adjusted so that the threshold currentlinear beam-beam force model. The head—tail TMC instability is enhanced in the presenceThe TMC threshold values are calculated by using a two particle head-tail model and a
7 Summary
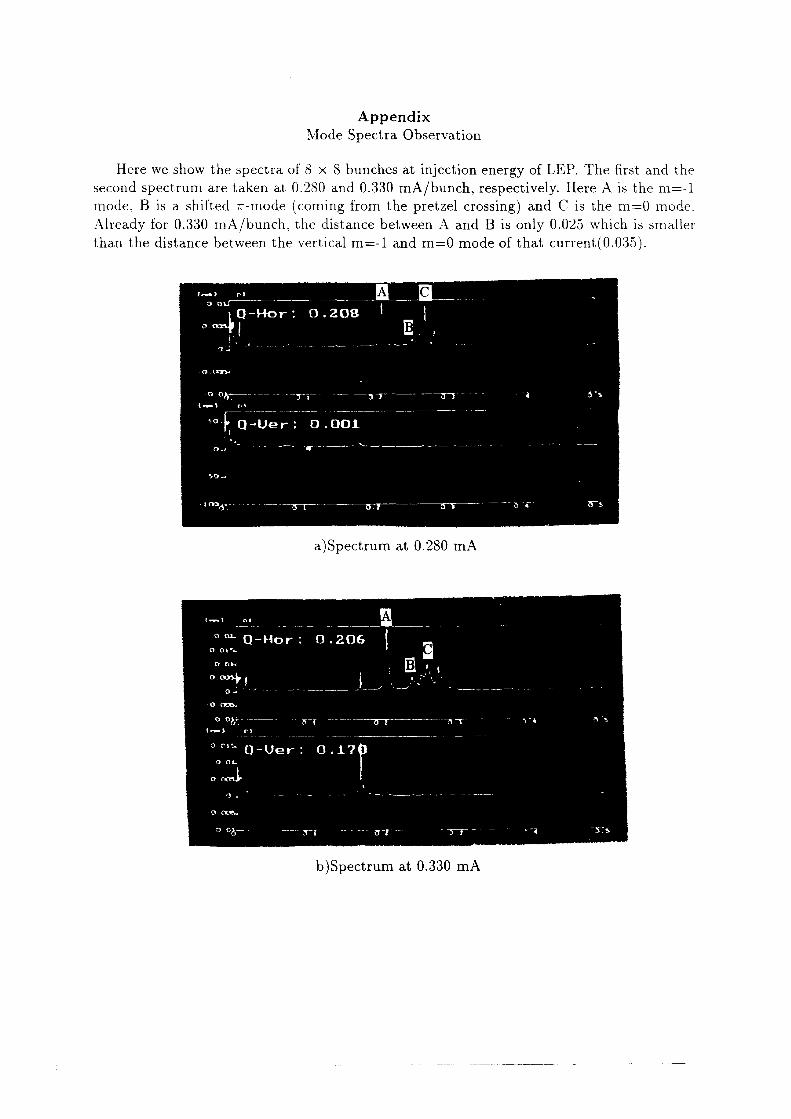
b)Spectrum at 0.330 mA OCR Output
QHJEIHHOKUD
a)Spectrum at 0.280 mA
IILUEIHHIHJD
ile
UHIIHHHQHJIR
A10
than the distance between the vertical m=—l and m=0 mode of that current(0.035).Already for 0.330 mA/bunch, the distance between A and B is only 0.025 which is smallermode, B is a shifted vr-mode (coming from the pretzel crossing) and C is the m:0 mode.second spectrum are taken at 0.280 and 0.330 mA/bunch, respectively. Here A is the m:—l
Here we show the spectra of 8 >< 8 bunches at injection energy of LEP. The first and the
Mode Spectra ObservationAppendix