cabot investors conference 2013 how to pick safe, winning, dividend-paying stocks chloe lutts jensen...
TRANSCRIPT

Cabot Investors Conference 2013 www.cabot.net
How to Pick Safe, Winning, Dividend-
Paying StocksChloe Lutts Jensen
Editor, Dick Davis [email protected]

Cabot Investors Conference 2013 www.cabot.net
What Characteristics should you look for in a Dividend-Paying Stock? • Safety (Capital Preservation)• Dividend Safety• Dividend Growth • Capital Appreciation Potential
Cabot Investors Conference 2013 www.cabot.net
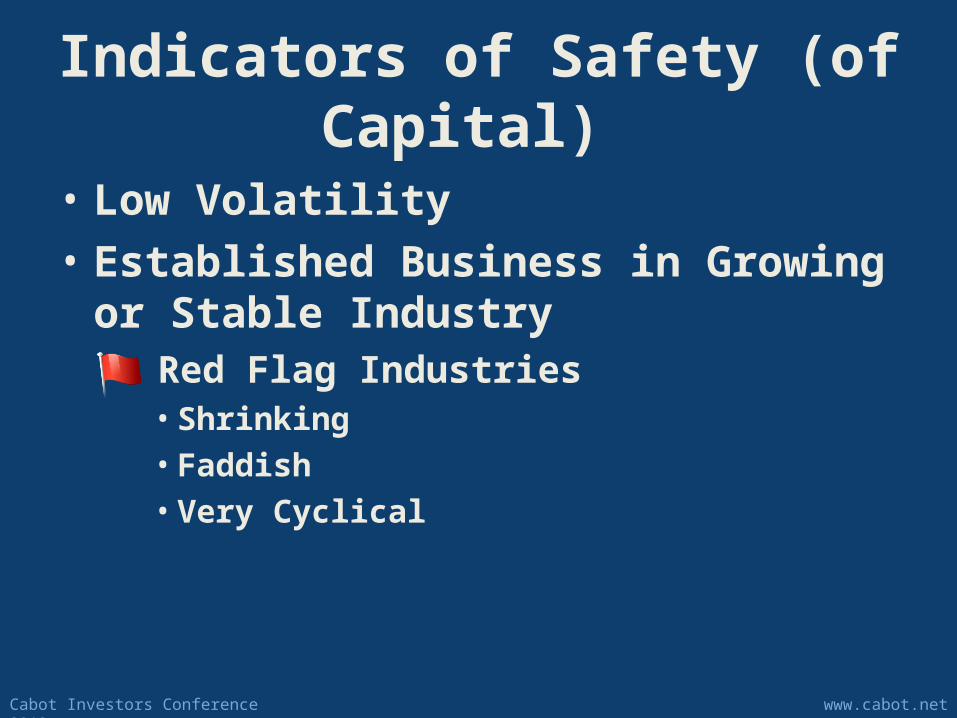
Indicators of Safety (of Capital)
• Low Volatility• Established Business in Growing
or Stable Industry– Red Flag Industries• Shrinking • Faddish • Very Cyclical

Cabot Investors Conference 2013 www.cabot.net
Indicators of Dividend Safety
• Dividend History–Many Years of Dividend Payments–Multiple Dividend Increases a Plus–No Dividend Cuts, Especially
Recently
• Low Payout Ratio– 20% to 50%

Cabot Investors Conference 2013 www.cabot.net
Indicators of Dividend Growth Potential
• History of Dividend Growth• Earnings Growth • Low Payout Ratio
Cabot Investors Conference 2013 www.cabot.net
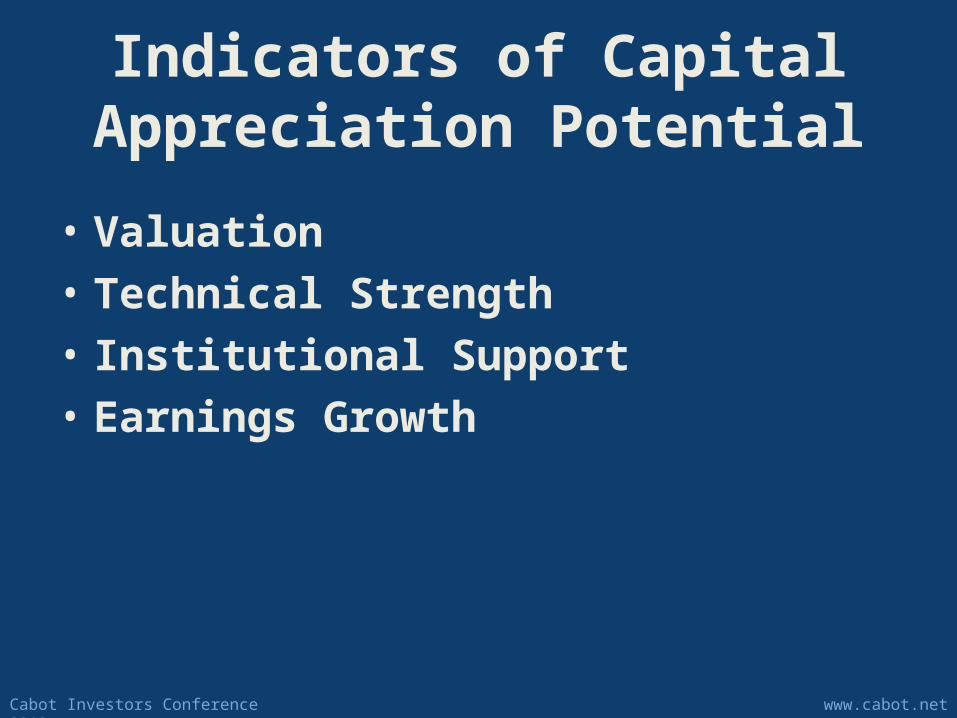
Indicators of Capital Appreciation Potential
• Valuation• Technical Strength• Institutional Support• Earnings Growth

Cabot Investors Conference 2013 www.cabot.net
Cabot Investors Conference 2013 www.cabot.net
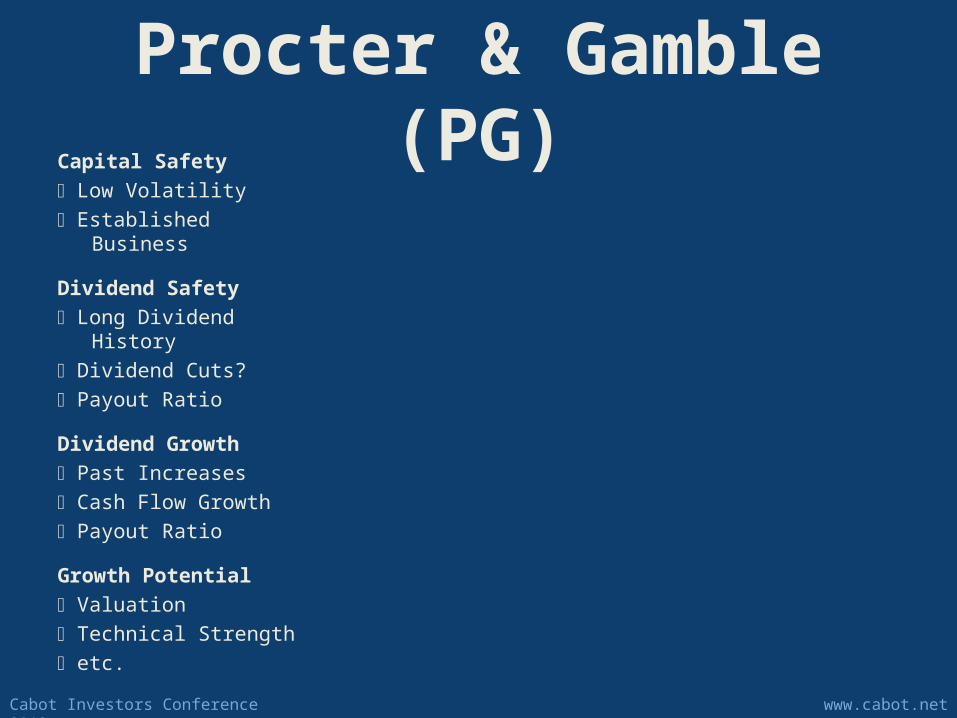
Procter & Gamble (PG)Capital Safety
Low Volatility Established Business
Dividend Safety Long Dividend
History Dividend Cuts? Payout Ratio
Dividend Growth Past Increases Cash Flow Growth Payout Ratio
Growth Potential Valuation Technical Strength etc.
Cabot Investors Conference 2013 www.cabot.net
Procter & Gamble (PG)Capital Safety
Low Volatility Established Business
Dividend Safety Long Dividend
History Dividend Cuts? Payout Ratio
Dividend Growth Past Increases Cash Flow Growth Payout Ratio
Growth Potential Valuation Technical Strength etc.
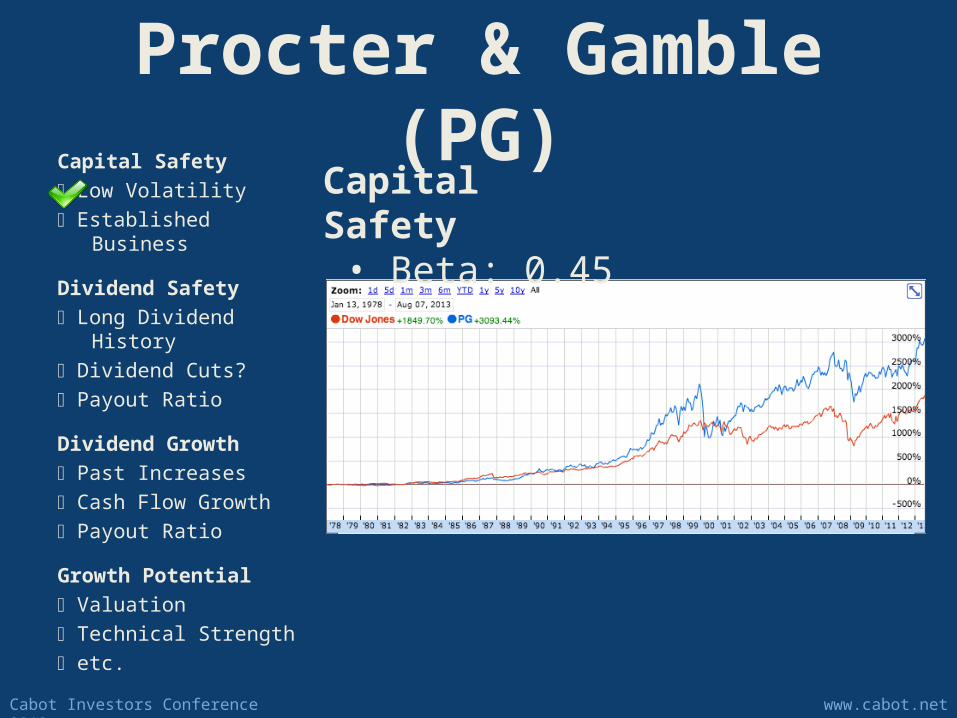
Capital Safety • Beta: 0.45

Cabot Investors Conference 2013 www.cabot.net
Procter & Gamble (PG)Capital Safety
Low Volatility Established Business
Dividend Safety Long Dividend
History Dividend Cuts? Payout Ratio
Dividend Growth Past Increases Cash Flow Growth Payout Ratio
Growth Potential Valuation Technical Strength etc.
Capital Safety • Beta: 0.45
Cabot Investors Conference 2013 www.cabot.net
Procter & Gamble (PG)Capital Safety
Low Volatility Established Business
Dividend Safety Long Dividend
History Dividend Cuts? Payout Ratio
Dividend Growth Past Increases Cash Flow Growth Payout Ratio
Growth Potential Valuation Technical Strength etc.
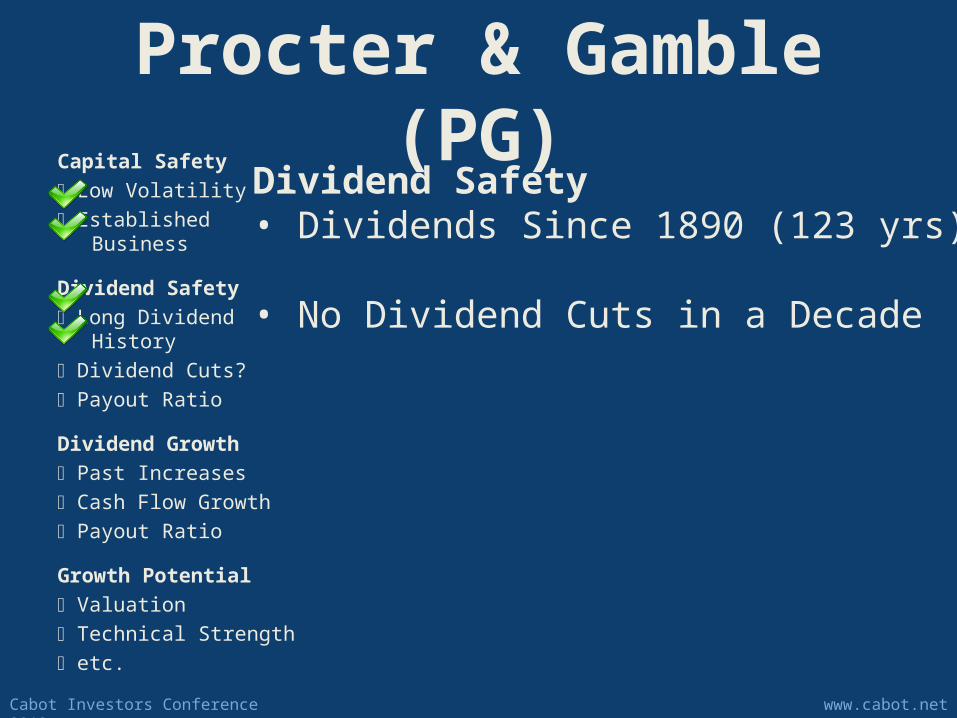
Dividend Safety• Dividends Since 1890 (123 yrs)
• No Dividend Cuts in a Decade

Cabot Investors Conference 2013 www.cabot.net
Procter & Gamble (PG)Capital Safety
Low Volatility Established Business
Dividend Safety Long Dividend
History Dividend Cuts? Payout Ratio
Dividend Growth Past Increases Cash Flow Growth Payout Ratio
Growth Potential Valuation Technical Strength etc.
Dividend Safety• Dividends Since 1890 (123 yrs)• No Dividend Cuts in a Decade
• Payout Ratio: 59%

Cabot Investors Conference 2013 www.cabot.net
Procter & Gamble (PG)Capital Safety
Low Volatility Est. Business
Dividend Safety Long Dividend
History Dividend Cuts? Payout Ratio
Dividend Growth Past Increases Cash Flow Growth Payout Ratio
Growth Potential Valuation Technical Strength etc.
Dividend Safety• Dividends Since 1890 (123 yrs)• No Dividend Cuts in a Decade• Payout Ratio: 59%
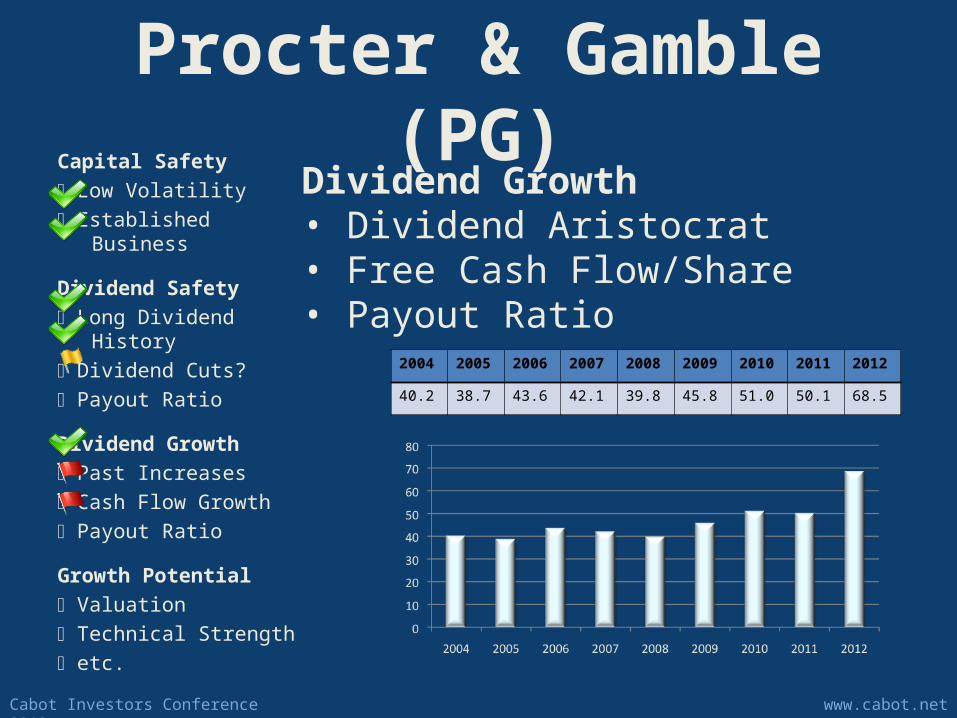
2004 2005 2006 2007 2008 2009 2010 2011 2012
40.2 38.7 43.6 42.1 39.8 45.8 51.0 50.1 68.5

Cabot Investors Conference 2013 www.cabot.net
Procter & Gamble (PG)Capital Safety
Low Volatility Established Business
Dividend Safety Long Dividend
History Dividend Cuts? Payout Ratio
Dividend Growth Past Increases Cash Flow Growth Payout Ratio
Growth Potential Valuation Technical Strength etc.
Dividend Safety• Dividends Since 1890 (123 yrs)• No Dividend Cuts in a Decade• Payout Ratio: 59%
2004 2005 2006 2007 2008 2009 2010 2011 2012
40.2 38.7 43.6 42.1 39.8 45.8 51.0 50.1 68.5

Cabot Investors Conference 2013 www.cabot.net
Procter & Gamble (PG)Capital Safety
Low Volatility Established Business
Dividend Safety Long Dividend
History Dividend Cuts? Payout Ratio
Dividend Growth Past Increases Cash Flow Growth Payout Ratio
Growth Potential Valuation Technical Strength etc.
Dividend Growth• Dividend Aristocrat

Cabot Investors Conference 2013 www.cabot.net
Procter & Gamble (PG)Capital Safety
Low Volatility Established Business
Dividend Safety Long Dividend
History Dividend Cuts? Payout Ratio
Dividend Growth Past Increases Cash Flow Growth Payout Ratio
Growth Potential Valuation Technical Strength etc.
Dividend Growth• Dividend Aristocrat• Free Cash Flow/Share:
2004 2005 2006 2007 2008 2009 2010 2011 2012
2.63 2.40 2.65 3.07 3.85 3.70 4.20 3.31 3.15
Cabot Investors Conference 2013 www.cabot.net
Procter & Gamble (PG)Capital Safety
Low Volatility Established Business
Dividend Safety Long Dividend
History Dividend Cuts? Payout Ratio
Dividend Growth Past Increases Cash Flow Growth Payout Ratio
Growth Potential Valuation Technical Strength etc.
Dividend Growth• Dividend Aristocrat• Free Cash Flow/Share• Payout Ratio
2004 2005 2006 2007 2008 2009 2010 2011 2012
40.2 38.7 43.6 42.1 39.8 45.8 51.0 50.1 68.5

Cabot Investors Conference 2013 www.cabot.net
Procter & Gamble (PG)Capital Safety
Low Volatility Established Business
Dividend Safety Long Dividend
History Dividend Cuts? Payout Ratio
Dividend Growth Past Increases Cash Flow Growth Payout Ratio
Growth Potential Valuation Technical Strength Turnaround
Capital Appreciation (Growth) Potential• P/E: 20 (5-yr avg. = 17, industry avg. = 20)• Technical Situation: Mediocre+ Earnings: 3-yr Trend is Down but Turnaround is Helping YOY Comparisons in 2013
Cabot Investors Conference 2013 www.cabot.net