ca final sfm - raj placementsca final sfm ca mayank kothari analysis & suggested answers - may...
TRANSCRIPT
CA Final SFM CA Mayank Kothari
Analysis & Suggested Answers - May 2017 SFM Paper
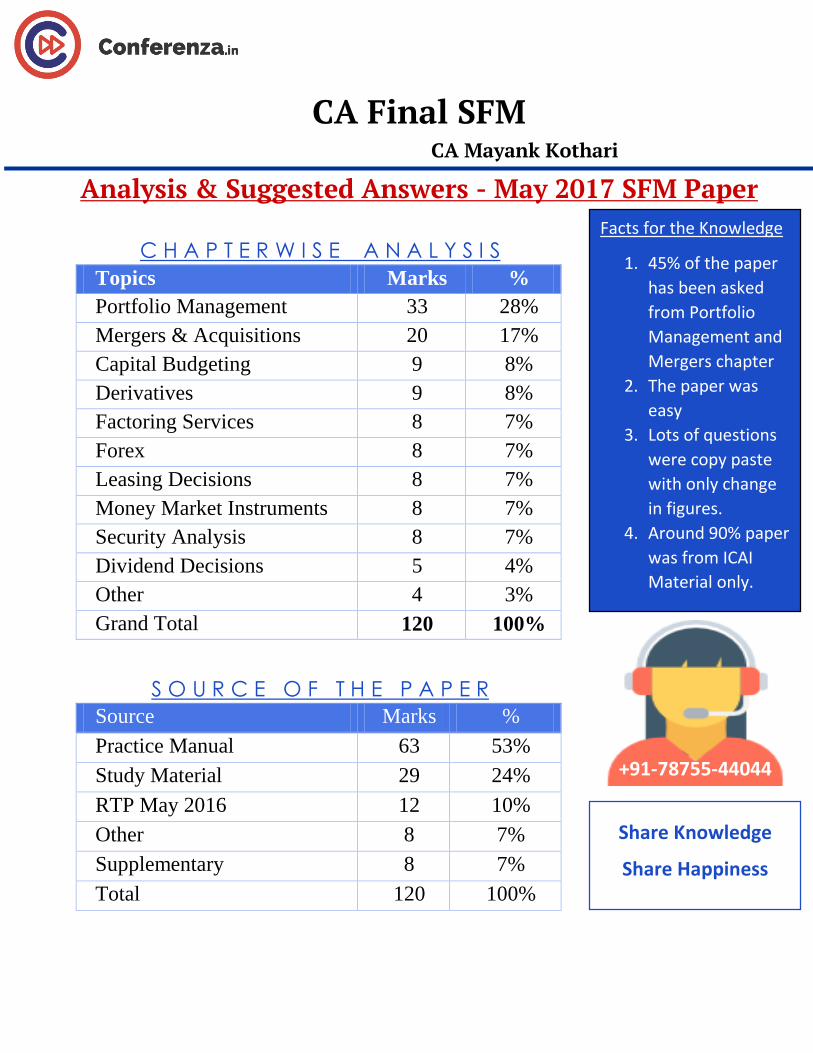
C H A P T E R W I S E A N A L Y S I S
Topics Marks %
Portfolio Management 33 28%
Mergers & Acquisitions 20 17%
Capital Budgeting 9 8%
Derivatives 9 8%
Factoring Services 8 7%
Forex 8 7%
Leasing Decisions 8 7%
Money Market Instruments 8 7%
Security Analysis 8 7%
Dividend Decisions 5 4%
Other 4 3%
Grand Total 120 100%
S O U R C E O F T H E P A P E R
Source Marks %
Practice Manual 63 53%
Study Material 29 24%
RTP May 2016 12 10%
Other 8 7%
Supplementary 8 7%
Total 120 100%
Facts for the Knowledge
1. 45% of the paper
has been asked
from Portfolio
Management and
Mergers chapter
2. The paper was
easy
3. Lots of questions
were copy paste
with only change
in figures.
4. Around 90% paper
was from ICAI
Material only.
Share Knowledge
Share Happiness
+91-78755-44044
Suggested Answers CA Final SFM May 2017 Paper CA Mayank Kothari
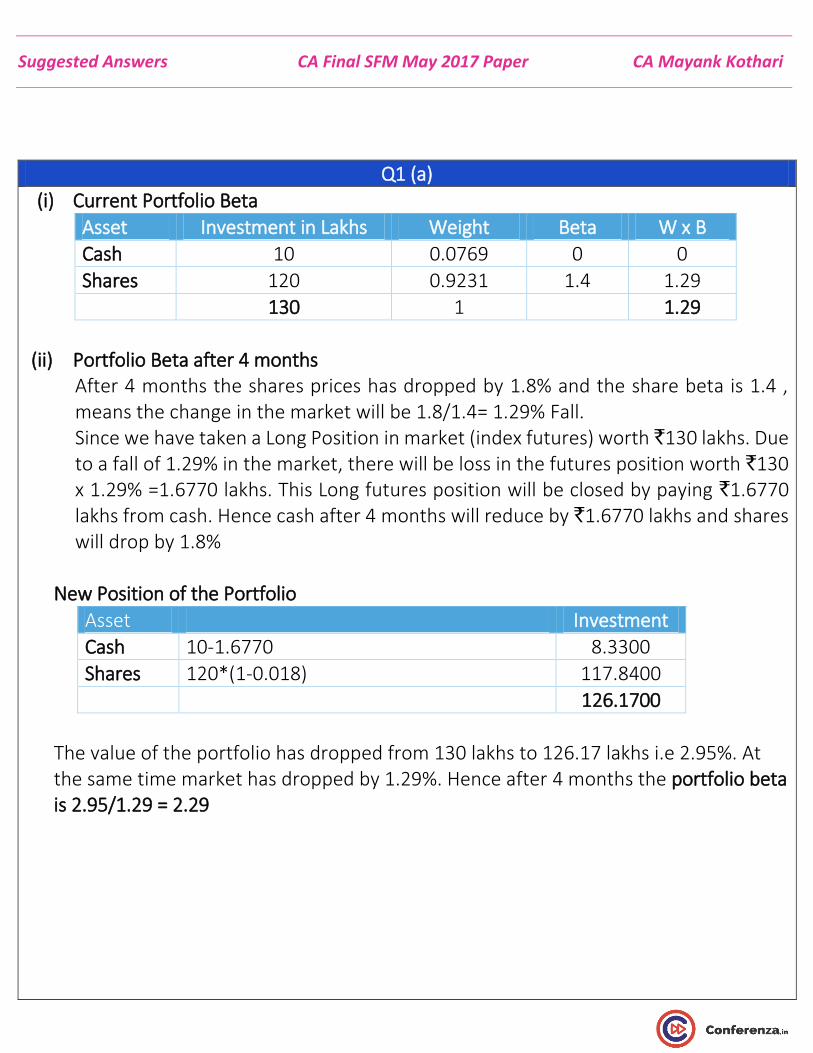
Q1 (a)
(i) Current Portfolio Beta
Asset Investment in Lakhs Weight Beta W x B
Cash 10 0.0769 0 0
Shares 120 0.9231 1.4 1.29
130 1 1.29
(ii) Portfolio Beta after 4 months
After 4 months the shares prices has dropped by 1.8% and the share beta is 1.4 , means the change in the market will be 1.8/1.4= 1.29% Fall. Since we have taken a Long Position in market (index futures) worth `130 lakhs. Due to a fall of 1.29% in the market, there will be loss in the futures position worth `130 x 1.29% =1.6770 lakhs. This Long futures position will be closed by paying `1.6770 lakhs from cash. Hence cash after 4 months will reduce by `1.6770 lakhs and shares will drop by 1.8%
New Position of the Portfolio
Asset Investment
Cash 10-1.6770 8.3300
Shares 120*(1-0.018) 117.8400
126.1700
The value of the portfolio has dropped from 130 lakhs to 126.17 lakhs i.e 2.95%. At the same time market has dropped by 1.29%. Hence after 4 months the portfolio beta is 2.95/1.29 = 2.29
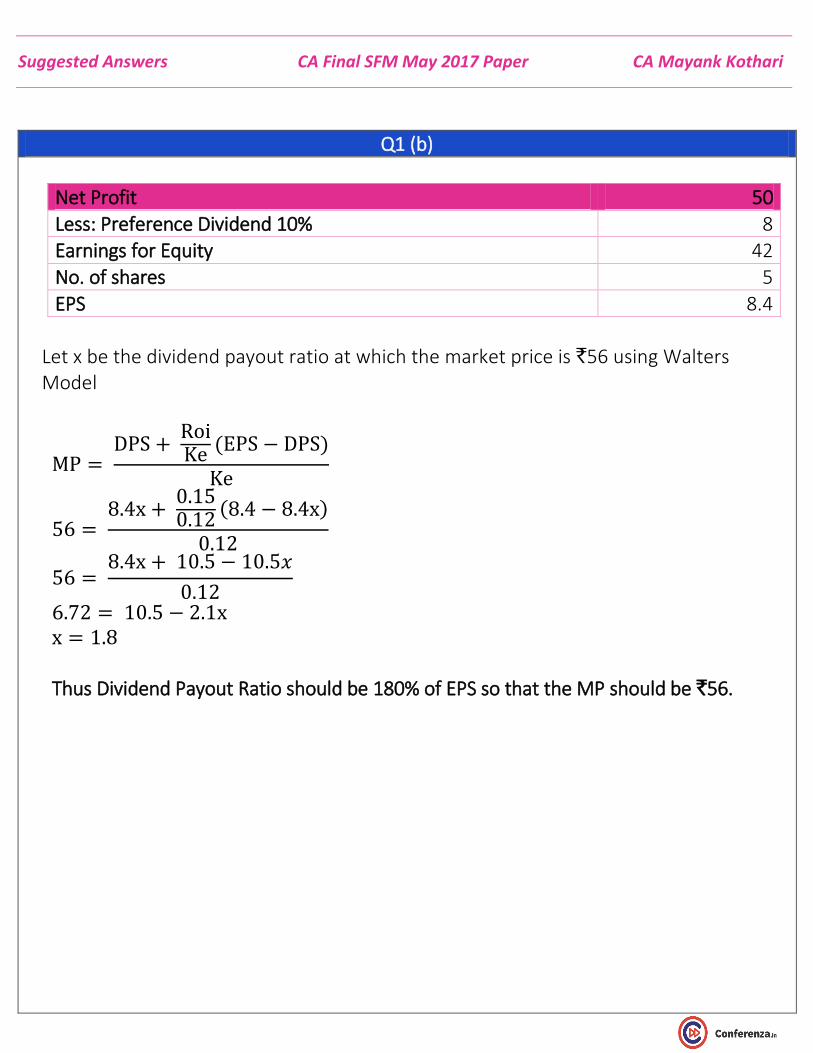
Suggested Answers CA Final SFM May 2017 Paper CA Mayank Kothari
Q1 (b)
Net Profit 50
Less: Preference Dividend 10% 8 Earnings for Equity 42
No. of shares 5
EPS 8.4
Let x be the dividend payout ratio at which the market price is `56 using Walters Model
MP = DPS +
RoiKe
(EPS − DPS)
Ke
56 = 8.4x +
0.150.12
(8.4 − 8.4x)
0.12
56 = 8.4x + 10.5 − 10.5𝑥
0.12
6.72 = 10.5 − 2.1x x = 1.8
Thus Dividend Payout Ratio should be 180% of EPS so that the MP should be `56.
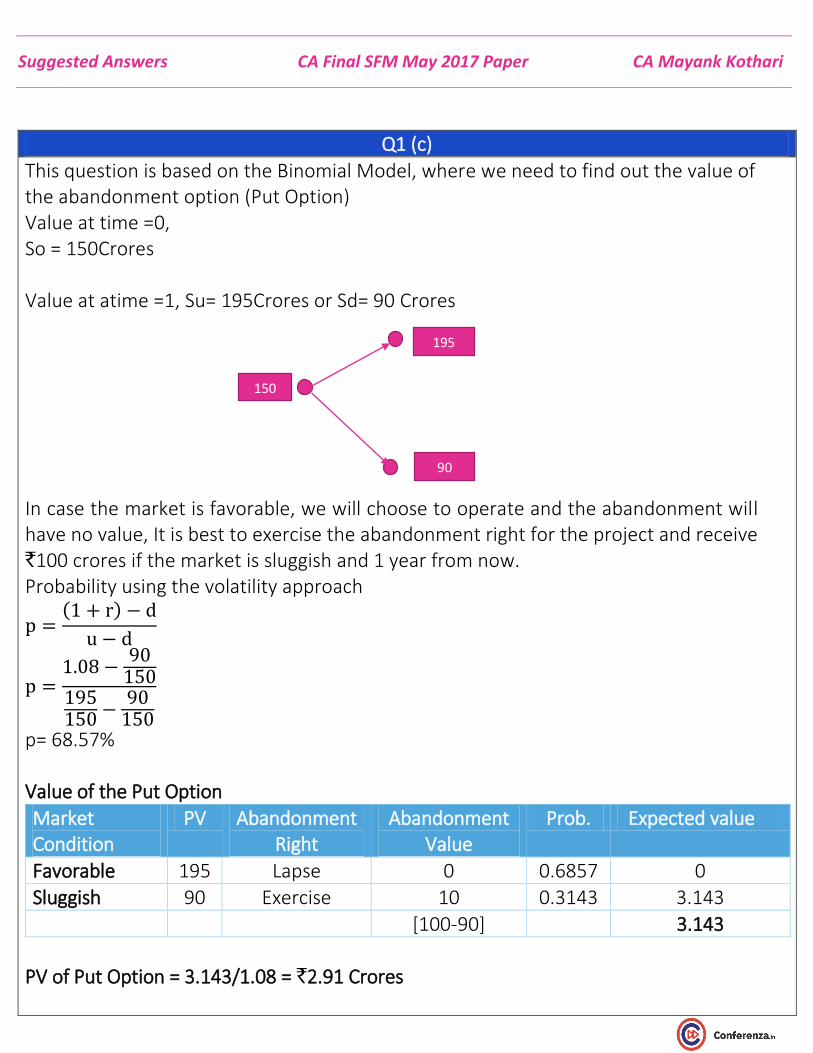
Suggested Answers CA Final SFM May 2017 Paper CA Mayank Kothari
Q1 (c)
This question is based on the Binomial Model, where we need to find out the value of the abandonment option (Put Option) Value at time =0, So = 150Crores Value at atime =1, Su= 195Crores or Sd= 90 Crores In case the market is favorable, we will choose to operate and the abandonment will have no value, It is best to exercise the abandonment right for the project and receive `100 crores if the market is sluggish and 1 year from now. Probability using the volatility approach
p =(1 + r) − d
u − d
p =1.08 −
90150
195150
−90
150
p= 68.57% Value of the Put Option
Market Condition
PV Abandonment Right
Abandonment Value
Prob. Expected value
Favorable 195 Lapse 0 0.6857 0
Sluggish 90 Exercise 10 0.3143 3.143
[100-90] 3.143 PV of Put Option = 3.143/1.08 = `2.91 Crores
150
195
90
Suggested Answers CA Final SFM May 2017 Paper CA Mayank Kothari
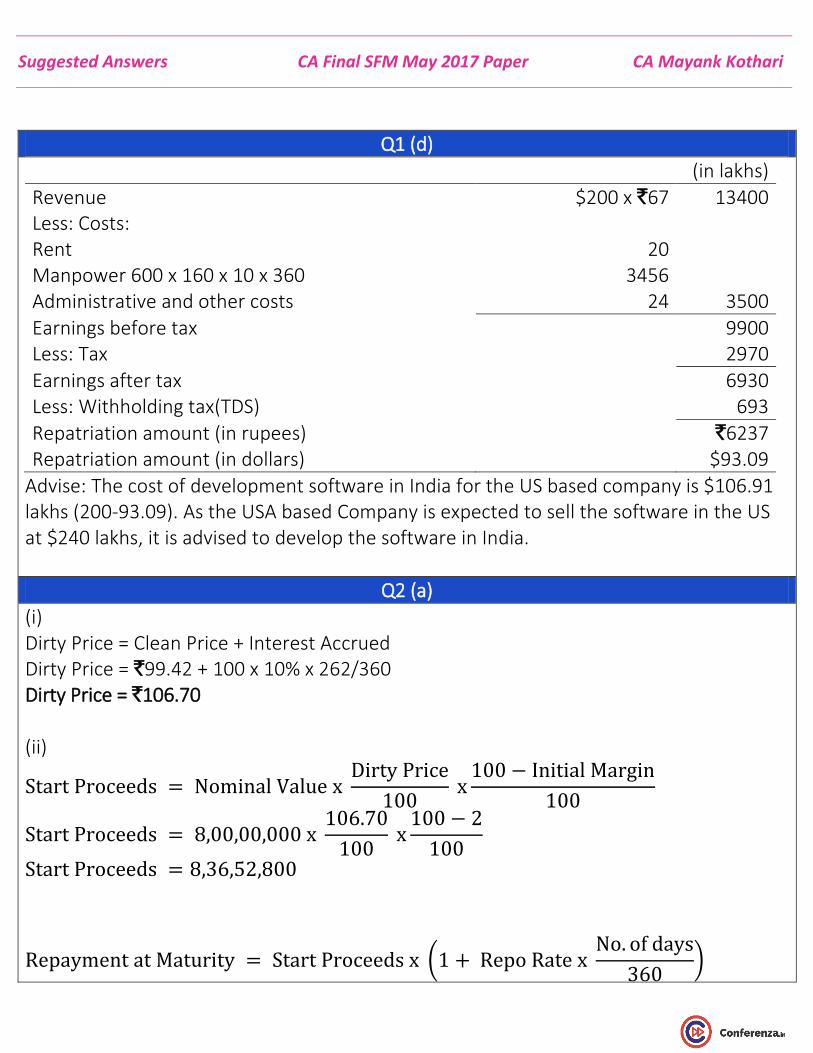
Q1 (d)
(in lakhs)
Revenue $200 x `67 13400 Less: Costs: Rent 20 Manpower 600 x 160 x 10 x 360 3456 Administrative and other costs 24 3500
Earnings before tax 9900 Less: Tax 2970
Earnings after tax 6930 Less: Withholding tax(TDS) 693
Repatriation amount (in rupees) `6237 Repatriation amount (in dollars) $93.09
Advise: The cost of development software in India for the US based company is $106.91 lakhs (200-93.09). As the USA based Company is expected to sell the software in the US at $240 lakhs, it is advised to develop the software in India.
Q2 (a)
(i) Dirty Price = Clean Price + Interest Accrued Dirty Price = `99.42 + 100 x 10% x 262/360 Dirty Price = `106.70 (ii)
Start Proceeds = Nominal Value x Dirty Price
100 x
100 − Initial Margin
100
Start Proceeds = 8,00,00,000 x 106.70
100 x
100 − 2
100
Start Proceeds = 8,36,52,800
Repayment at Maturity = Start Proceeds x (1 + Repo Rate x No. of days
360)
Suggested Answers CA Final SFM May 2017 Paper CA Mayank Kothari
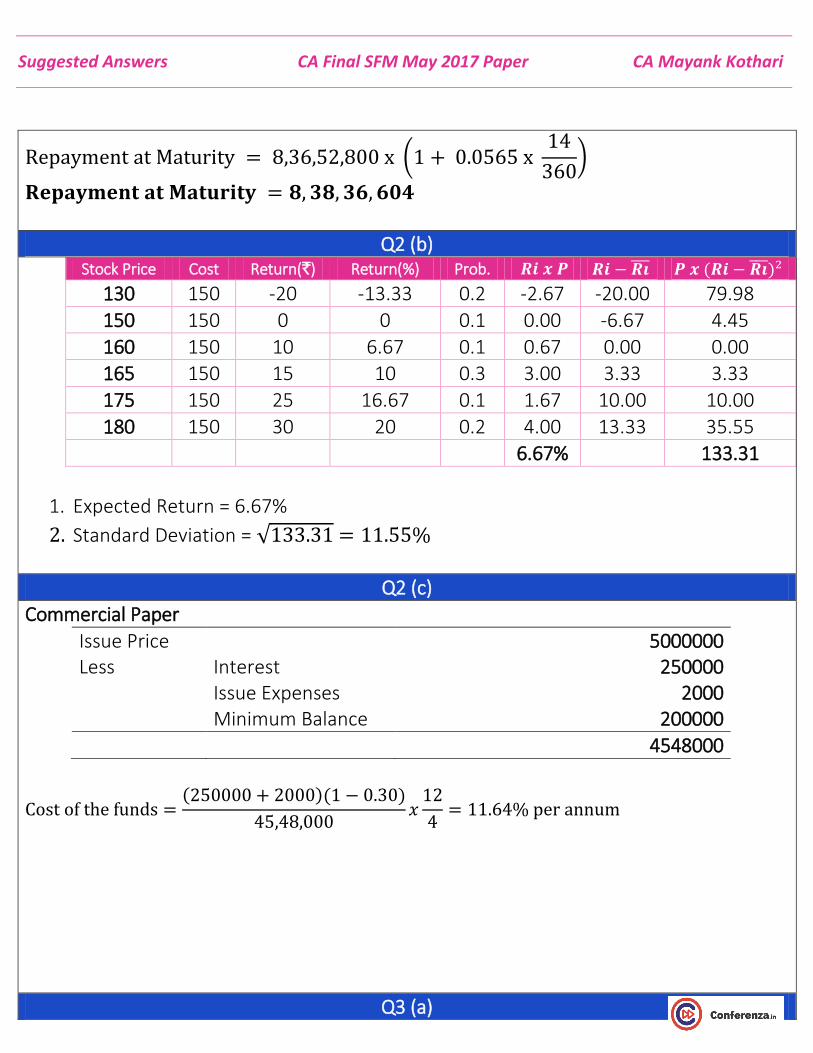
Repayment at Maturity = 8,36,52,800 x (1 + 0.0565 x 14
360)
𝐑𝐞𝐩𝐚𝐲𝐦𝐞𝐧𝐭 𝐚𝐭 𝐌𝐚𝐭𝐮𝐫𝐢𝐭𝐲 = 𝟖, 𝟑𝟖, 𝟑𝟔, 𝟔𝟎𝟒
Q2 (b)
Stock Price Cost Return(`) Return(%) Prob. 𝑹𝒊 𝒙 𝑷 𝑹𝒊 − 𝑹𝒊̅̅ ̅ 𝑷 𝒙 (𝑹𝒊 − 𝑹𝒊̅̅ ̅)2
130 150 -20 -13.33 0.2 -2.67 -20.00 79.98
150 150 0 0 0.1 0.00 -6.67 4.45
160 150 10 6.67 0.1 0.67 0.00 0.00 165 150 15 10 0.3 3.00 3.33 3.33
175 150 25 16.67 0.1 1.67 10.00 10.00
180 150 30 20 0.2 4.00 13.33 35.55
6.67% 133.31
1. Expected Return = 6.67%
2. Standard Deviation = √133.31 = 11.55%
Q2 (c)
Commercial Paper
Issue Price 5000000 Less Interest 250000
Issue Expenses 2000 Minimum Balance 200000
4548000
Cost of the funds =(250000 + 2000)(1 − 0.30)
45,48,000𝑥
12
4= 11.64% per annum
Q3 (a)
Suggested Answers CA Final SFM May 2017 Paper CA Mayank Kothari
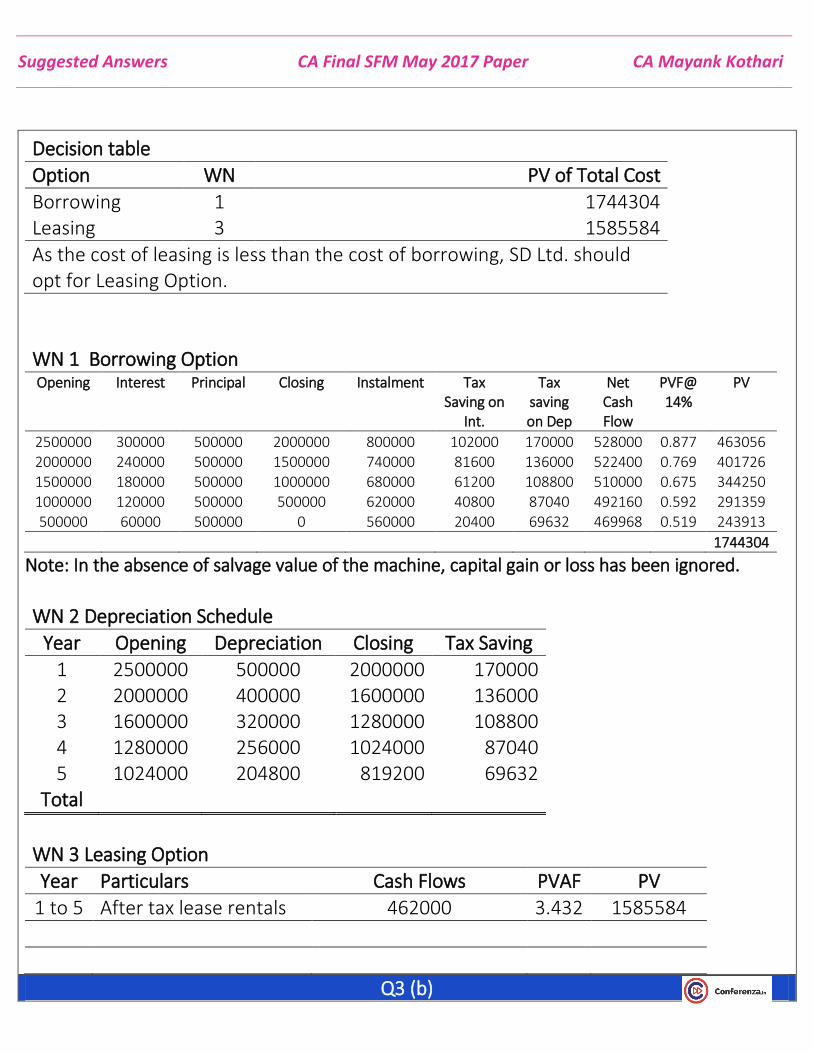
Decision table
Option WN PV of Total Cost
Borrowing 1 1744304 Leasing 3 1585584
As the cost of leasing is less than the cost of borrowing, SD Ltd. should opt for Leasing Option.
WN 1 Borrowing Option Opening Interest Principal Closing Instalment Tax
Saving on Int.
Tax saving on Dep
Net Cash Flow
PVF@ 14%
PV
2500000 300000 500000 2000000 800000 102000 170000 528000 0.877 463056 2000000 240000 500000 1500000 740000 81600 136000 522400 0.769 401726 1500000 180000 500000 1000000 680000 61200 108800 510000 0.675 344250 1000000 120000 500000 500000 620000 40800 87040 492160 0.592 291359 500000 60000 500000 0 560000 20400 69632 469968 0.519 243913
1744304
Note: In the absence of salvage value of the machine, capital gain or loss has been ignored.
WN 2 Depreciation Schedule
Year Opening Depreciation Closing Tax Saving
1 2500000 500000 2000000 170000 2 2000000 400000 1600000 136000 3 1600000 320000 1280000 108800 4 1280000 256000 1024000 87040 5 1024000 204800 819200 69632
Total
WN 3 Leasing Option
Year Particulars Cash Flows PVAF PV
1 to 5 After tax lease rentals 462000 3.432 1585584
Q3 (b)
Suggested Answers CA Final SFM May 2017 Paper CA Mayank Kothari
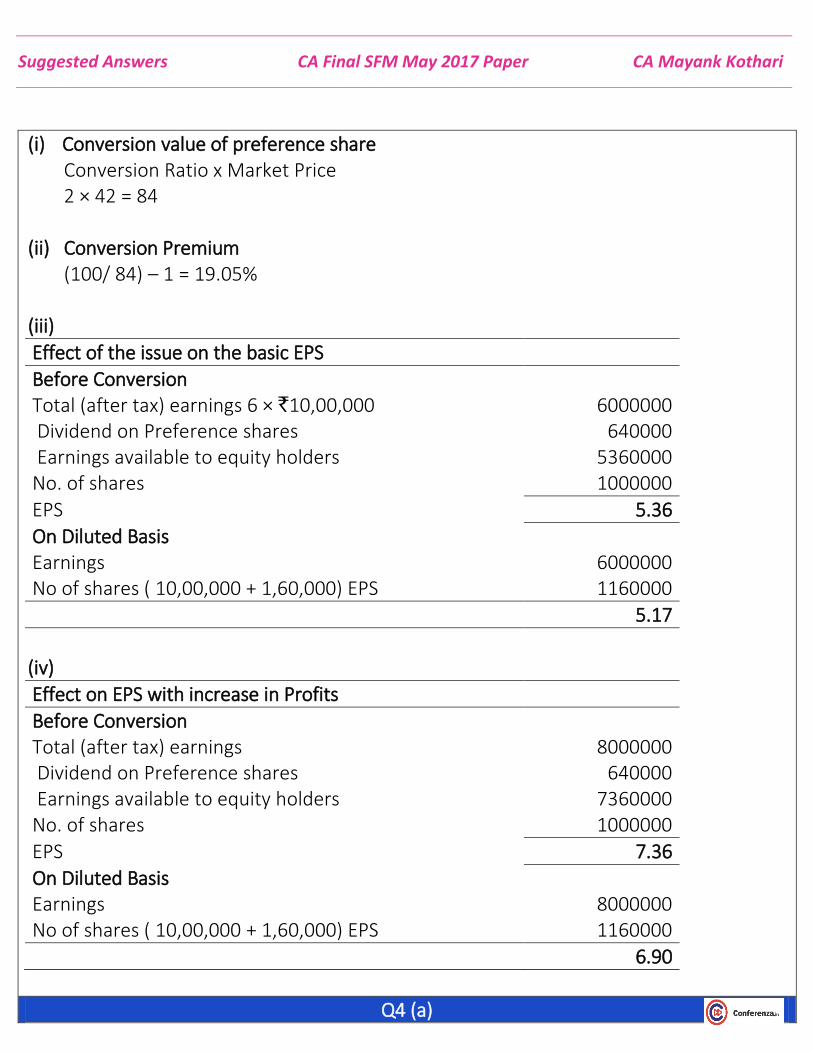
(i) Conversion value of preference share Conversion Ratio x Market Price 2 × 42 = 84
(ii) Conversion Premium
(100/ 84) – 1 = 19.05% (iii)
Effect of the issue on the basic EPS
Before Conversion Total (after tax) earnings 6 × `10,00,000 6000000 Dividend on Preference shares 640000 Earnings available to equity holders 5360000 No. of shares 1000000
EPS 5.36
On Diluted Basis Earnings 6000000 No of shares ( 10,00,000 + 1,60,000) EPS 1160000
5.17
(iv)
Effect on EPS with increase in Profits
Before Conversion Total (after tax) earnings 8000000 Dividend on Preference shares 640000 Earnings available to equity holders 7360000 No. of shares 1000000
EPS 7.36
On Diluted Basis Earnings 8000000 No of shares ( 10,00,000 + 1,60,000) EPS 1160000
6.90
Q4 (a)
Suggested Answers CA Final SFM May 2017 Paper CA Mayank Kothari
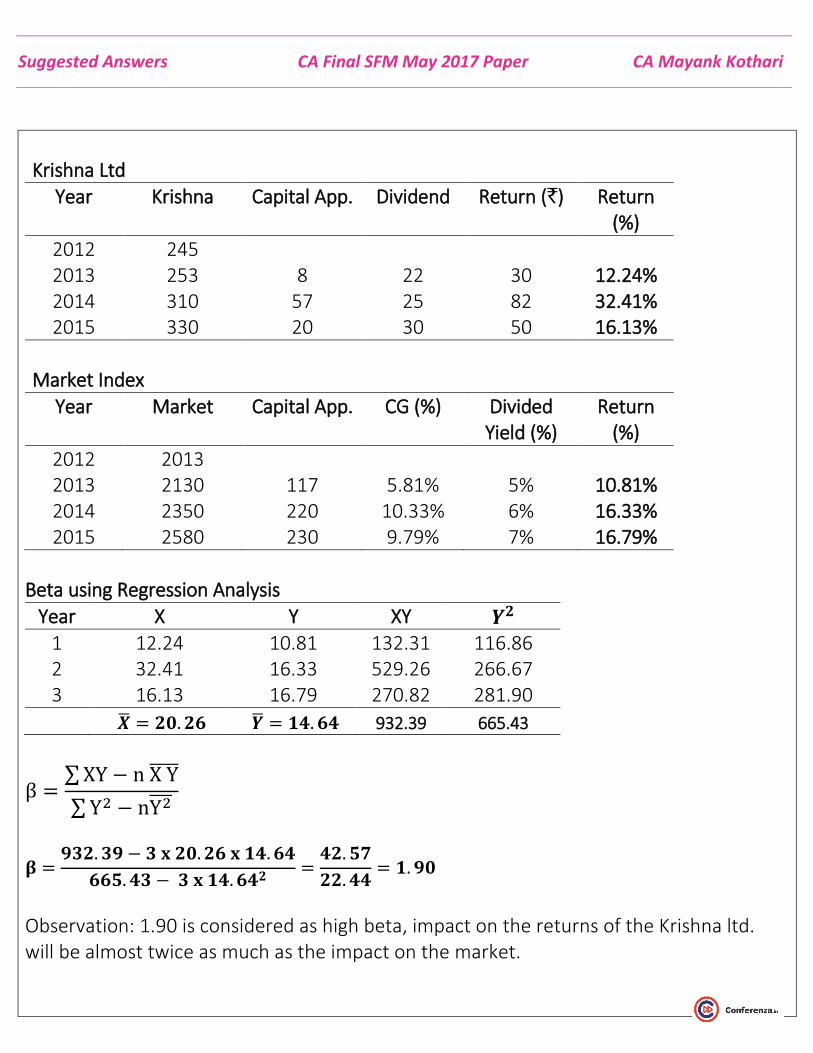
Krishna Ltd
Year Krishna Capital App. Dividend Return (`) Return (%)
2012 245 2013 253 8 22 30 12.24% 2014 310 57 25 82 32.41% 2015 330 20 30 50 16.13%
Market Index
Year Market Capital App. CG (%) Divided Yield (%)
Return (%)
2012 2013 2013 2130 117 5.81% 5% 10.81% 2014 2350 220 10.33% 6% 16.33% 2015 2580 230 9.79% 7% 16.79%
Beta using Regression Analysis
Year X Y XY 𝒀𝟐 1 12.24 10.81 132.31 116.86 2 32.41 16.33 529.26 266.67 3 16.13 16.79 270.82 281.90
�̅� = 𝟐𝟎. 𝟐𝟔 �̅� = 𝟏𝟒. 𝟔𝟒 932.39 665.43
β =∑ XY − n X Y̅̅ ̅̅
∑ Y2 − nY2̅̅ ̅
𝛃 =𝟗𝟑𝟐. 𝟑𝟗 − 𝟑 𝐱 𝟐𝟎. 𝟐𝟔 𝐱 𝟏𝟒. 𝟔𝟒
𝟔𝟔𝟓. 𝟒𝟑 − 𝟑 𝐱 𝟏𝟒. 𝟔𝟒𝟐=
𝟒𝟐. 𝟓𝟕
𝟐𝟐. 𝟒𝟒= 𝟏. 𝟗𝟎
Observation: 1.90 is considered as high beta, impact on the returns of the Krishna ltd. will be almost twice as much as the impact on the market.
Suggested Answers CA Final SFM May 2017 Paper CA Mayank Kothari
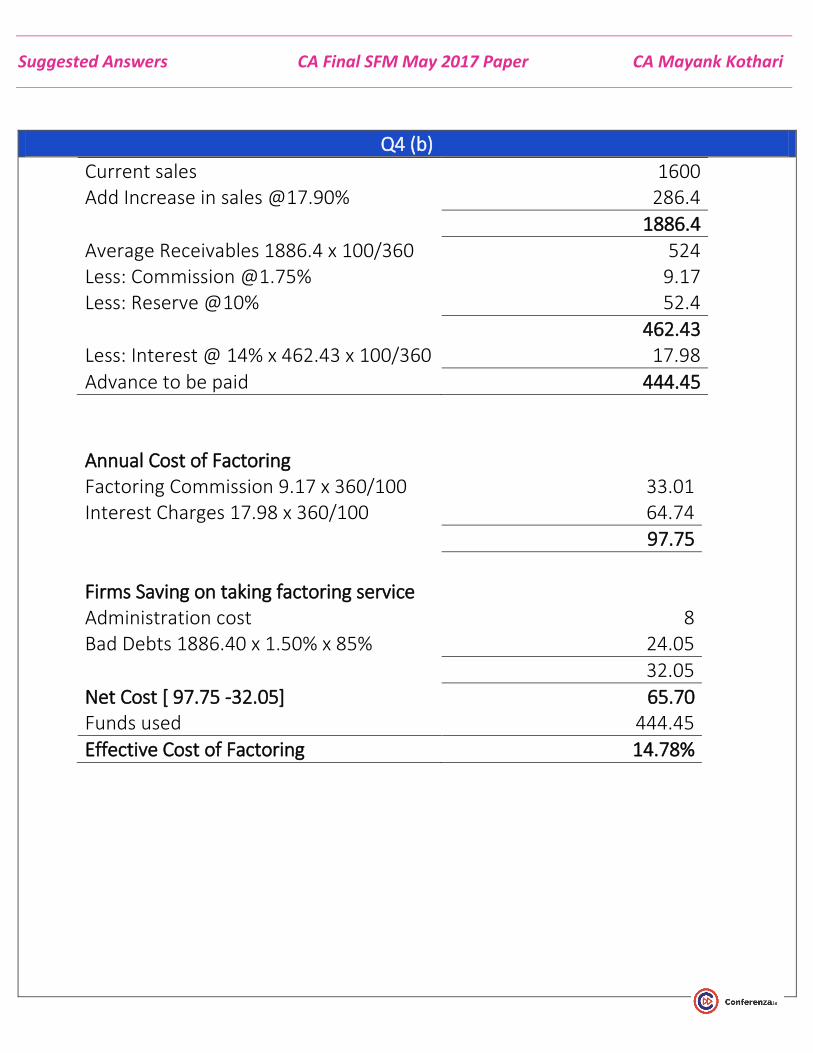
Q4 (b)
Current sales 1600 Add Increase in sales @17.90% 286.4
1886.4 Average Receivables 1886.4 x 100/360 524 Less: Commission @1.75% 9.17 Less: Reserve @10% 52.4
462.43 Less: Interest @ 14% x 462.43 x 100/360 17.98
Advance to be paid 444.45
Annual Cost of Factoring Factoring Commission 9.17 x 360/100 33.01 Interest Charges 17.98 x 360/100 64.74
97.75
Firms Saving on taking factoring service Administration cost 8 Bad Debts 1886.40 x 1.50% x 85% 24.05
32.05
Net Cost [ 97.75 -32.05] 65.70 Funds used 444.45
Effective Cost of Factoring 14.78%
Suggested Answers CA Final SFM May 2017 Paper CA Mayank Kothari
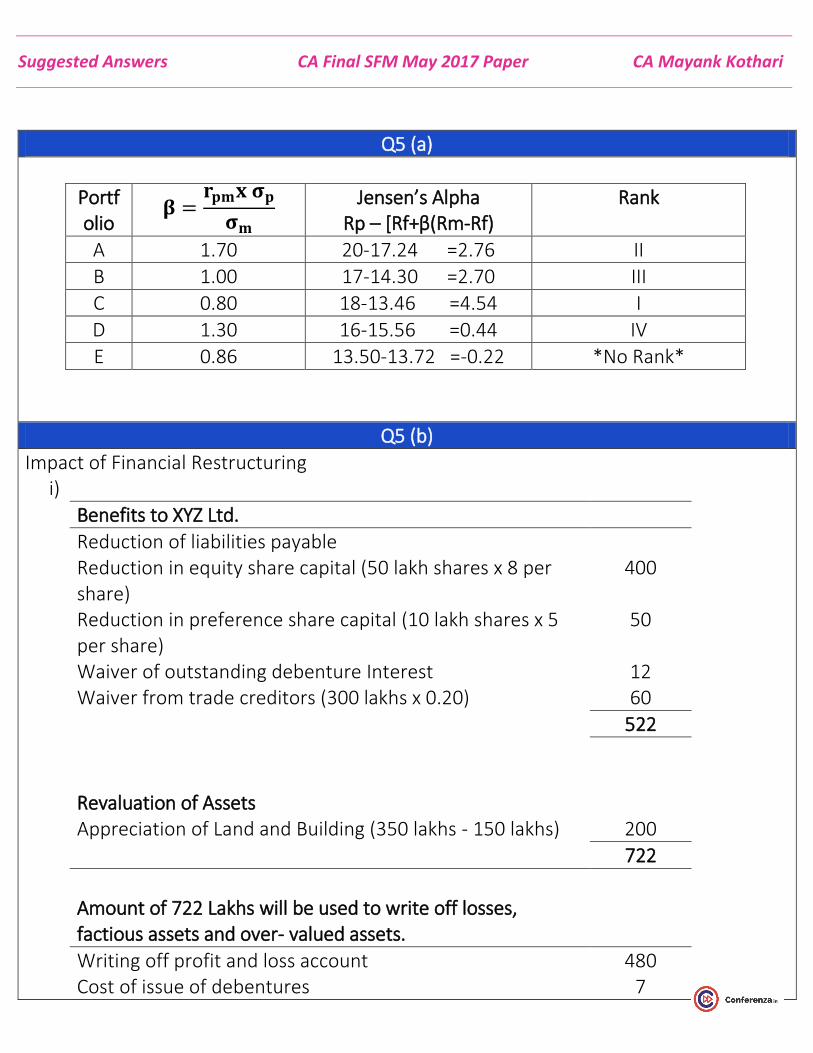
Q5 (a)
Portfolio
𝛃 =𝐫𝐩𝐦𝐱 𝛔𝐩
𝛔𝐦 Jensen’s Alpha
Rp – [Rf+β(Rm-Rf) Rank
A 1.70 20-17.24 =2.76 II
B 1.00 17-14.30 =2.70 III
C 0.80 18-13.46 =4.54 I
D 1.30 16-15.56 =0.44 IV
E 0.86 13.50-13.72 =-0.22 *No Rank*
Q5 (b)
Impact of Financial Restructuring i)
Benefits to XYZ Ltd.
Reduction of liabilities payable Reduction in equity share capital (50 lakh shares x 8 per share)
400
Reduction in preference share capital (10 lakh shares x 5 per share)
50
Waiver of outstanding debenture Interest 12 Waiver from trade creditors (300 lakhs x 0.20) 60
522
Revaluation of Assets Appreciation of Land and Building (350 lakhs - 150 lakhs) 200
722
Amount of 722 Lakhs will be used to write off losses, factious assets and over- valued assets.
Writing off profit and loss account 480 Cost of issue of debentures 7
Suggested Answers CA Final SFM May 2017 Paper CA Mayank Kothari
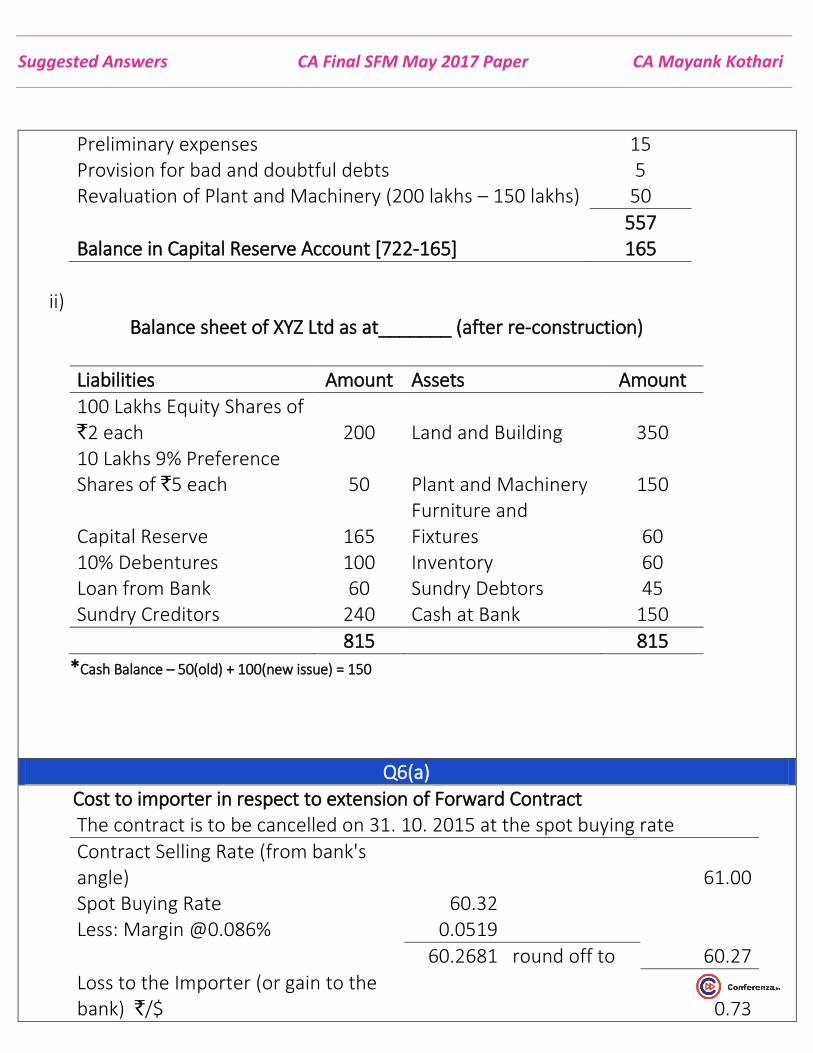
Preliminary expenses 15 Provision for bad and doubtful debts 5 Revaluation of Plant and Machinery (200 lakhs – 150 lakhs) 50
557 Balance in Capital Reserve Account [722-165] 165
ii)
Balance sheet of XYZ Ltd as at_______ (after re-construction)
Liabilities Amount Assets Amount
100 Lakhs Equity Shares of `2 each 200 Land and Building 350 10 Lakhs 9% Preference Shares of `5 each 50 Plant and Machinery 150
Capital Reserve 165 Furniture and Fixtures 60
10% Debentures 100 Inventory 60 Loan from Bank 60 Sundry Debtors 45 Sundry Creditors 240 Cash at Bank 150
815 815
*Cash Balance – 50(old) + 100(new issue) = 150
Q6(a)
Cost to importer in respect to extension of Forward Contract The contract is to be cancelled on 31. 10. 2015 at the spot buying rate
Contract Selling Rate (from bank's angle) 61.00 Spot Buying Rate 60.32 Less: Margin @0.086% 0.0519
60.2681 round off to 60.27
Loss to the Importer (or gain to the bank) `/$ 0.73
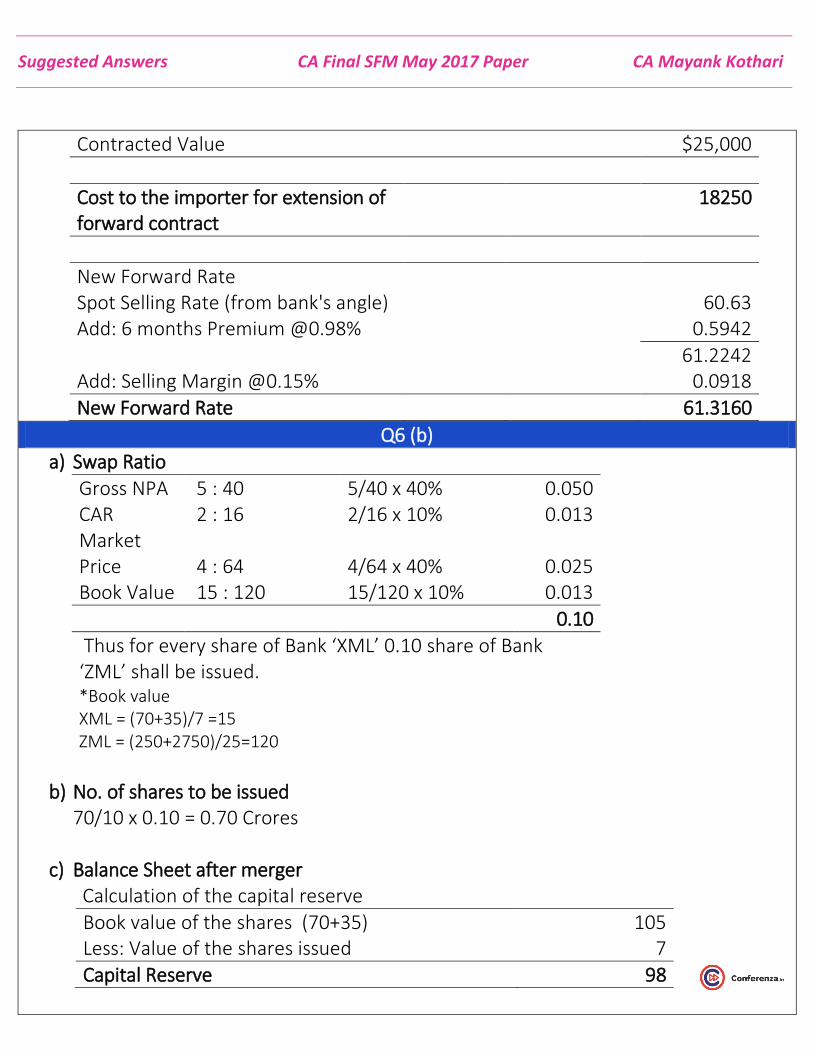
Suggested Answers CA Final SFM May 2017 Paper CA Mayank Kothari
Contracted Value $25,000
Cost to the importer for extension of forward contract
18250
New Forward Rate Spot Selling Rate (from bank's angle) 60.63 Add: 6 months Premium @0.98% 0.5942
61.2242 Add: Selling Margin @0.15% 0.0918
New Forward Rate 61.3160
Q6 (b)
a) Swap Ratio
Gross NPA 5 : 40 5/40 x 40% 0.050 CAR 2 : 16 2/16 x 10% 0.013 Market Price 4 : 64 4/64 x 40% 0.025 Book Value 15 : 120 15/120 x 10% 0.013
0.10
Thus for every share of Bank ‘XML’ 0.10 share of Bank ‘ZML’ shall be issued. *Book value XML = (70+35)/7 =15 ZML = (250+2750)/25=120
b) No. of shares to be issued
70/10 x 0.10 = 0.70 Crores
c) Balance Sheet after merger Calculation of the capital reserve
Book value of the shares (70+35) 105 Less: Value of the shares issued 7
Capital Reserve 98
Suggested Answers CA Final SFM May 2017 Paper CA Mayank Kothari
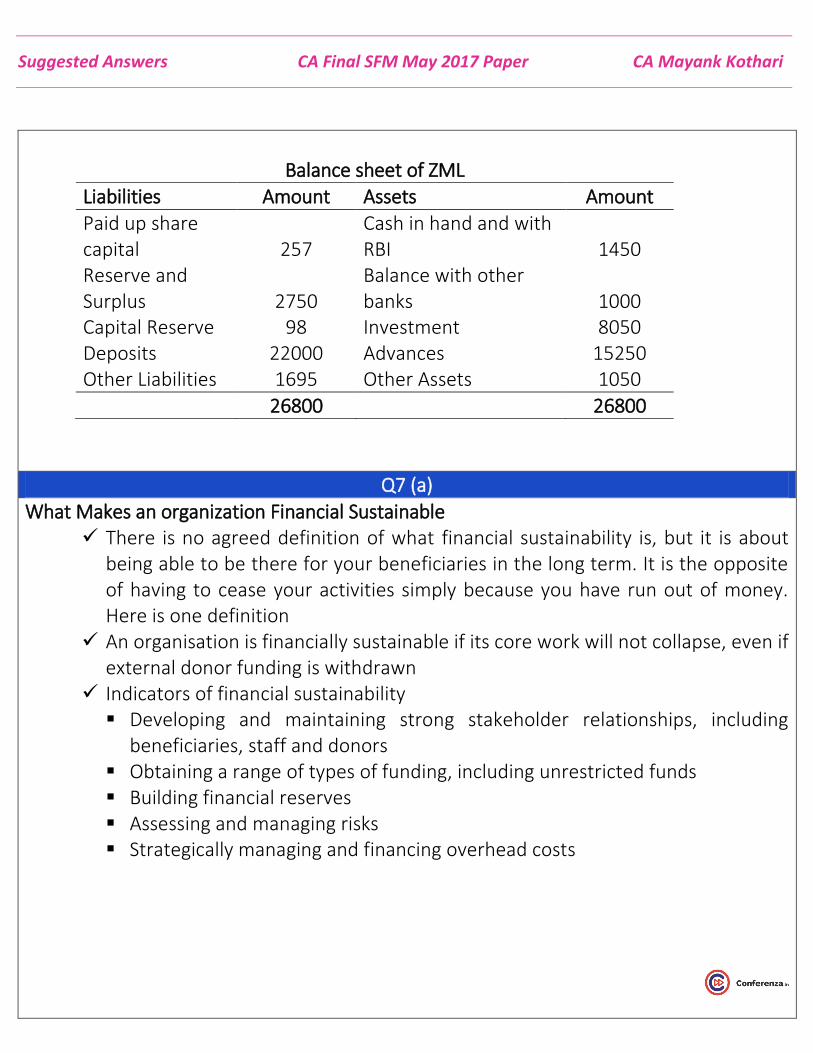
Balance sheet of ZML
Liabilities Amount Assets Amount
Paid up share capital 257
Cash in hand and with RBI 1450
Reserve and Surplus 2750
Balance with other banks 1000
Capital Reserve 98 Investment 8050 Deposits 22000 Advances 15250 Other Liabilities 1695 Other Assets 1050
26800 26800
Q7 (a)
What Makes an organization Financial Sustainable There is no agreed definition of what financial sustainability is, but it is about
being able to be there for your beneficiaries in the long term. It is the opposite of having to cease your activities simply because you have run out of money. Here is one definition
An organisation is financially sustainable if its core work will not collapse, even if external donor funding is withdrawn
Indicators of financial sustainability Developing and maintaining strong stakeholder relationships, including
beneficiaries, staff and donors Obtaining a range of types of funding, including unrestricted funds Building financial reserves Assessing and managing risks Strategically managing and financing overhead costs
Suggested Answers CA Final SFM May 2017 Paper CA Mayank Kothari
Q7 (b)
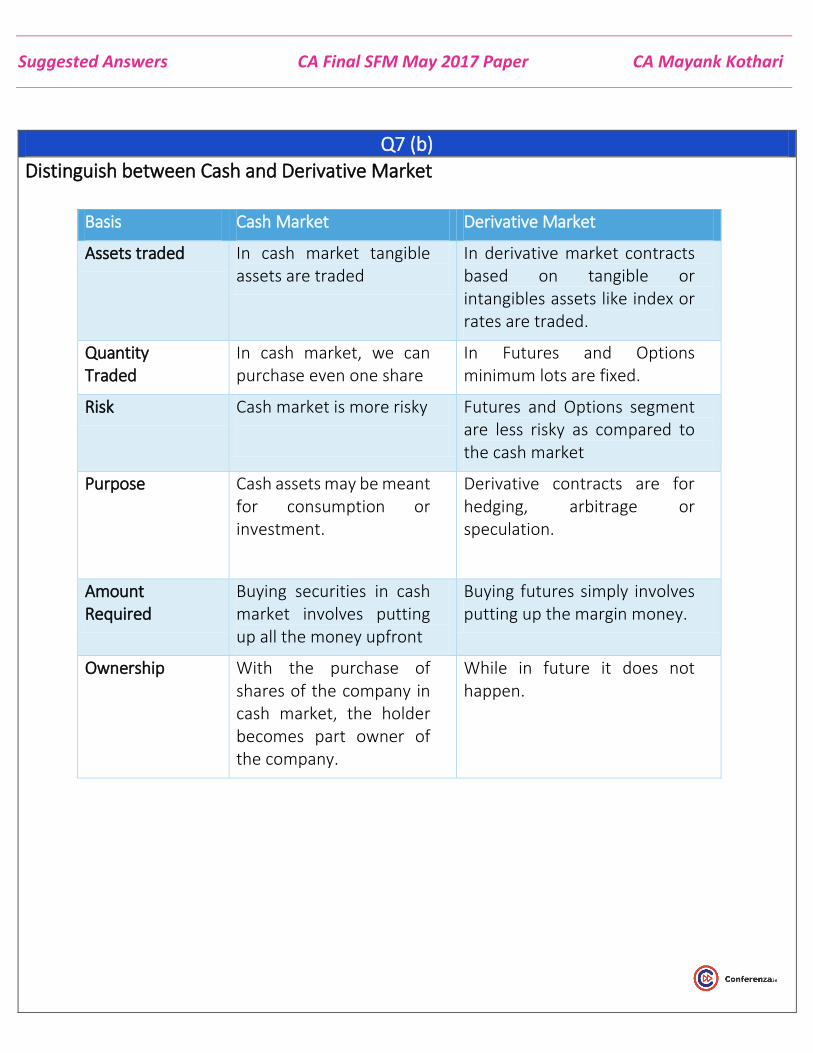
Distinguish between Cash and Derivative Market
Basis Cash Market Derivative Market
Assets traded In cash market tangible assets are traded
In derivative market contracts based on tangible or intangibles assets like index or rates are traded.
Quantity Traded
In cash market, we can purchase even one share
In Futures and Options minimum lots are fixed.
Risk Cash market is more risky
Futures and Options segment are less risky as compared to the cash market
Purpose Cash assets may be meant for consumption or investment.
Derivative contracts are for hedging, arbitrage or speculation.
Amount Required
Buying securities in cash market involves putting up all the money upfront
Buying futures simply involves putting up the margin money.
Ownership With the purchase of shares of the company in cash market, the holder becomes part owner of the company.
While in future it does not happen.
Suggested Answers CA Final SFM May 2017 Paper CA Mayank Kothari
Q7 (c)
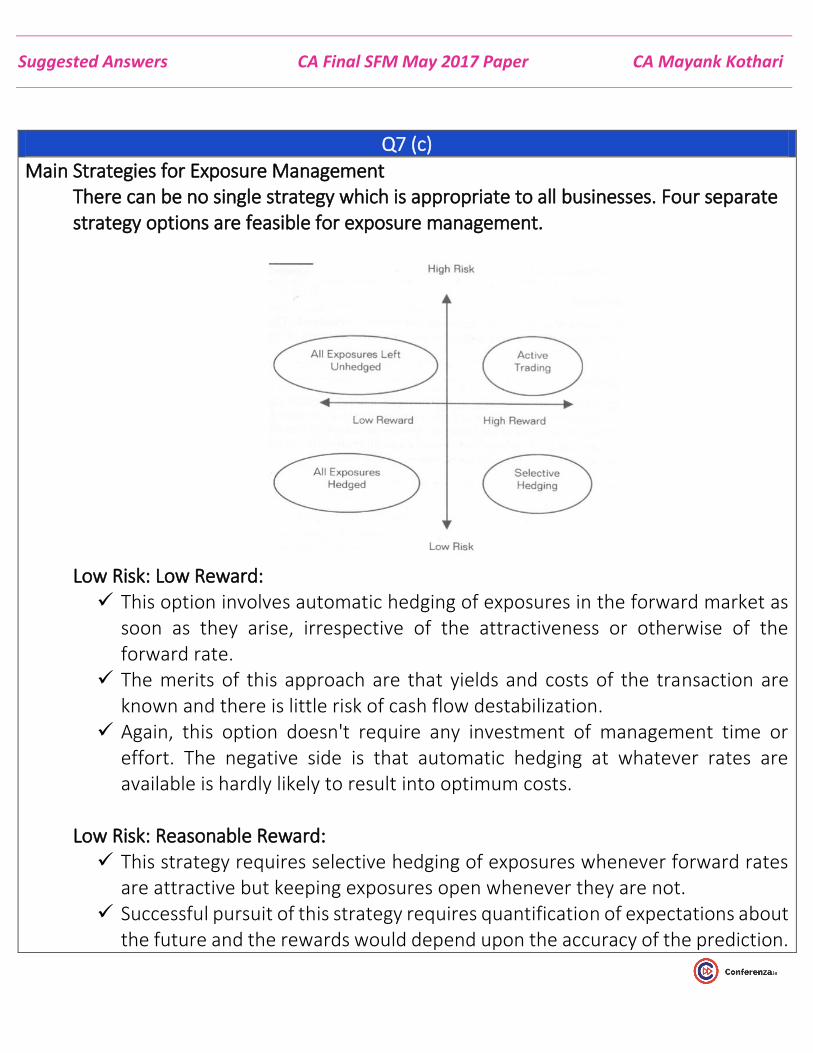
Main Strategies for Exposure Management There can be no single strategy which is appropriate to all businesses. Four separate strategy options are feasible for exposure management.
Low Risk: Low Reward: This option involves automatic hedging of exposures in the forward market as
soon as they arise, irrespective of the attractiveness or otherwise of the forward rate.
The merits of this approach are that yields and costs of the transaction are known and there is little risk of cash flow destabilization.
Again, this option doesn't require any investment of management time or effort. The negative side is that automatic hedging at whatever rates are available is hardly likely to result into optimum costs.
Low Risk: Reasonable Reward: This strategy requires selective hedging of exposures whenever forward rates
are attractive but keeping exposures open whenever they are not. Successful pursuit of this strategy requires quantification of expectations about
the future and the rewards would depend upon the accuracy of the prediction.
Suggested Answers CA Final SFM May 2017 Paper CA Mayank Kothari
This option is similar to an investment strategy of a combination of bonds and equities with the proportion of the two components depending on the attractiveness of prices.
In foreign exchange exposure terms, hedged positions are similar to bonds (known costs or yields) and unhedged ones to equities (uncertain returns).
High Risk: Low Reward: Perhaps the worst strategy is to leave all exposures unhedged. The risk of destabilization of cash flows is very high. The merit is zero investment of managerial time or effort.
High Risk: High Reward: This strategy involves active trading in the currency market through continuous
cancellations and re-bookings of forward contracts. With exchange controls relaxed in India in recent times, a few of the larger
companies are adopting this strategy. In effect, this requires the trading function to become a profit center. This
strategy, if it has to be adopted, should be done in full consciousness of the risks.
Q7 (d)
Simulation Analysis and its benefits A simulation consists of many -- often thousands of -- trials. Each trial is an experiment where we supply numerical values for input variables, evaluate the model to compute numerical values for outcomes of interest, and collect these values for later analysis. Benefits Study the behavior of a system without building it. Results are accurate in general, compared to analytical model. Help to find un-expected phenomenon, behavior of the system. Easy to perform ``What-If'' analysis.
Suggested Answers CA Final SFM May 2017 Paper CA Mayank Kothari
Q7 (e)
Synergy Synergy is the concept that the value and performance of two companies combined
will be greater than the sum of the separate individual parts. Synergy is a term that is most commonly used in the context of mergers and
acquisitions. Synergy, or the potential financial benefit achieved through the combining of
companies, is often a driving force behind a merger. Shareholders will benefit if a company's post-merger share price increases due to
the synergistic effect of the deal. The expected synergy achieved through the merger can be attributed to various factors, such as increased revenues, combined talent and technology, or cost reduction.
Synergy as a tool in mergers and acquisitions Mergers and acquisitions are made with the goal of improving the company's financial performance for the shareholders. Two businesses can merge to form one company that is capable of producing more revenue than either could have been able to independently, or to create one company that is able to eliminate or streamline redundant processes, resulting in significant cost reduction. Because of this principle, the potential synergy is examined during the merger and acquisition process. If two companies can merge to create greater efficiency or scale, the result is what is sometimes referred to as a synergy merge.
For example, when the Proctor & Gamble Company acquired Gillette in 2005, a P&G news release cited that "The increases to the company's growth objectives are driven by the identified synergy opportunities from the P&G/Gillette combination. The company continues to expect cost synergies of approximately $1 to $1.2 billion…and an increase in the annual sales run-rate of about $750 million by 2008." In the same press release, then P&G chairman, president and chief executive A.G. Lafley stated, "…We are both industry leaders on our own, and we will be even stronger and even better together." This is the idea behind synergy - that by combining two companies the financial results are greater than what either could have achieved alone.