c 2018 unnat jain - ideals
TRANSCRIPT

c© 2018 Unnat Jain

VISUAL QUESTIONING AGENTS
BY
UNNAT JAIN
THESIS
Submitted in partial fulfillment of the requirementsfor the degree of Master of Science in Computer Science
in the Graduate College of theUniversity of Illinois at Urbana-Champaign, 2018
Urbana, Illinois
Advisers:
Dr. Alexander SchwingDr. Svetlana Lazebnik

ABSTRACT
Curious questioning or the ability to inquire about surrounding environment or additional con-text, is an important step towards building agents which go beyond learning from a static knowl-edge base. The ability to request feedback is the first step in building intelligent agents which canincorporate this feedback to enhance learning. Visual questioning tasks help model this humanskill of “curiosity.” In this thesis, we focus on two relevant vision based questioning tasks – visualquestion generation and visual dialog. We propose novel approaches and evaluation metrics forthese tasks. For visual question generation, we combined language models with variational au-toencoders to enhance diversity in text generations. We also suggest diversity metrics to quantifythese improvements. For visual dialog, we introduce a reformulated dataset to enable training ofquestioning agents in a dialog setup. We also introduce simpler and more effective baselines forthe task. Our combined results in visual question generation and visual dialog contribute to estab-lishing visual questioning as an important next step for computer vision, and more generally, forartificial intelligence.
ii

To my family, friends and mentors for their love and support.
A tribute to my late grandfather.
iii

ACKNOWLEDGMENTS
I would like to thank NVIDIA for providing the GPUs used for this research. This material isbased upon work supported in part by the National Science Foundation under Grants No. 1563727and 1718221, and Samsung. I wish to thank the Graduate College for supporting me with a Con-ference Travel Grant 2017. I would also like to thank the Thomas and Stacey Siebel Foundation forsupporting me with a Siebel Scholar Award 2018. I also wish to thank the Department of ComputerScience Scholarship Committee for considering me worthy of nomination for the above awards.This thesis is essentially a consolidation of our recent successive papers on visual questioning inCVPR 2017 and CVPR 2018 [1, 2]. Therefore, we are thankful for the efforts of anonymousreviewers and the corresponding organizing committees.
The biggest thanks goes to Dr. Alexander Schwing and Dr. Svetlana Lazebnik, for providingthe perfect environment for this research. Dr. Schwing has nurtured me from day 1 in UIUC,and is still the first person to go when I have a question. They were very friendly and encouragedme to go beyond my comfort zone. Dr. David Forsyth’s support from within classes and throughdiscussions in vision lunches was very helpful. Mentors in early research life - Dr. Erik Learned-Miller, Dr. Subhransu Maji and Dr. Vinay Namboodiri have an important role to play in infusingpassion for research. I owe a special thanks to the CS@Illinois graduate advising team.
Personal support is essential for any happy researcher. Family provided the support in the dayand friends at night. The support from Anand, Anshika, Garima, Ishan, Jayasi, Jyoti, Karan,Manav, Mihika, Shashank, and Vinitha was special. Support from senior students in computervision laid strong foundations for this work. Aditya, Arun, Jason, Tanmay Gangwani, TanmayGupta and Ziyu have advised, guided and inspired me. Thank you.
iv

TABLE OF CONTENTS
CHAPTER 1 INTRODUCTION . . . . . . . . . . . . . . . . . . . . . . . . . . . . . . . 11.1 Visual Question Generation . . . . . . . . . . . . . . . . . . . . . . . . . . . . . . 11.2 Visual Dialog . . . . . . . . . . . . . . . . . . . . . . . . . . . . . . . . . . . . . 2
CHAPTER 2 RELATED WORK . . . . . . . . . . . . . . . . . . . . . . . . . . . . . . . 52.1 Image Captioning . . . . . . . . . . . . . . . . . . . . . . . . . . . . . . . . . . . 52.2 Visual Question Answering . . . . . . . . . . . . . . . . . . . . . . . . . . . . . . 52.3 Visual Question Generation . . . . . . . . . . . . . . . . . . . . . . . . . . . . . . 62.4 Visual Dialog . . . . . . . . . . . . . . . . . . . . . . . . . . . . . . . . . . . . . 62.5 Our Contributions . . . . . . . . . . . . . . . . . . . . . . . . . . . . . . . . . . . 7
CHAPTER 3 DIVERSE VISUAL QUESTION GENERATION USING VARIATIONALAUTOENCODERS . . . . . . . . . . . . . . . . . . . . . . . . . . . . . . . . . . . . . 93.1 Approach . . . . . . . . . . . . . . . . . . . . . . . . . . . . . . . . . . . . . . . 93.2 Experiments . . . . . . . . . . . . . . . . . . . . . . . . . . . . . . . . . . . . . . 14
CHAPTER 4 VISUAL DIALOG WITH DISCRIMINATIVE QUESTION GENERA-TION AND ANSWERING . . . . . . . . . . . . . . . . . . . . . . . . . . . . . . . . . 214.1 Approach . . . . . . . . . . . . . . . . . . . . . . . . . . . . . . . . . . . . . . . 214.2 Experiments . . . . . . . . . . . . . . . . . . . . . . . . . . . . . . . . . . . . . . 28
CHAPTER 5 CONCLUSION . . . . . . . . . . . . . . . . . . . . . . . . . . . . . . . . 33
REFERENCES . . . . . . . . . . . . . . . . . . . . . . . . . . . . . . . . . . . . . . . . . 34
v

CHAPTER 1: INTRODUCTION
One of the first emotions we discover as humans is curiosity. It is curiosity which drives us toexplore the unknown and ask questions about what we do not understand. It plays a critical role inlearning and, hence, in becoming intelligent. But is curiosity important for computers?
Remarkable recent steps to effectively extract representations from data [3, 4] have closed thegap between human-level performance and ‘computer-level’ accuracy on a large variety of taskssuch as object classification [5], speech-based translation [6], and language-modeling [7]. Thereseems no need for computers to be curious. However, curiosity is crucial if existing knowledgestructures fail to yield the desired outcome. We cannot hope to encode all logical rules into algo-rithms, or all observations into features, or all data into representations. Therefore, there is alwaysthe need to learn further, and thereby a need for inquiry. We desire agents to ask questions about in-formation that isn’t clear enough to draw important inferences. Hence, capturing the human abilityto question is the first step towards building agents which evolve intelligence rather than emulatea static pool of training data. The ability to curiously question is also essential to a conversationalagent, so as to participate in a meaningful goal-driven dialog with humans.
Variants of image (and video) based questioning tasks have recently gained attention as the re-search community moves towards visual conversational agents. This thesis describes our novelapproaches to visual questioning and efforts to facilitate its effective evaluation. First, we dis-cuss introrelated language and vision tasks, visual question generation and visual dialog, and ourcontributions in each.
1.1 VISUAL QUESTION GENERATION
First, we will focus on the novel task of visual question generation (VQG) [8] as opposed tovisual question answering. It involves generating relevant and engaging questions about a givenimage.
For the task of VQG, we propose a technique for generating diverse questions that is based ongenerative models. More concretely, we follow the variational autoencoder [9] paradigm ratherthan adversarial nets [10], because training seems oftentimes more stable. We learn to embed agiven question and the features from a corresponding image into a low-dimensional latent space.During inference, i.e., when we are given a new image, we generate a question by sampling fromthe latent space and subsequently decode the sample together with the feature embedding of theimage to obtain a novel question. We illustrate some images and a subset of the generated questionsin Fig. 1.1. We evaluate our approach on the VQG - COCO, Flickr and Bing datasets [8]. Wedemonstrate that the proposed technique is able to ask a series of remarkably diverse questions
1

Figure 1.1: Examples of questions generated by our VQG algorithm on three datasets. Darkercolored boxes contain questions which are more inferential. Our questions include queries aboutnumbers and scanty clouds showing its visual recognition strength. Questions on events, type ofsport and motion demonstrate an ability to understand scenes and actions. Unlike questions oncolors, counts and shapes, the questions in bold box are exemplars of how diverse our modelis. It fuses visual information with context to ask questions which cannot be answered simply bylooking at the image. Its answer requires prior (human-like) understanding of the objects or scene.The questions with bold ticks (4) are generated by our VQG model which never occurred duringtraining (what we refer to as ‘unseen’ questions).
given only an image as input. Note the diversity of the generated questions some of which aremore literal while others are more inferential.
Diversity in VQG is essential to initiate or continue an engaging conversation. This helps AIsystems such as driving assistants, chatbots, etc., to perform better on Turing tests. An AI sys-tem asking the same or very similar questions for a scene isn’t representative of human behavior.Hence, diverse generations help avoid this monotonous ‘behavior’ of AI systems.
In Chap. 3, we will discuss the approach and experimentation in more details.
1.2 VISUAL DIALOG
Second, we broaden our visual questioning understanding by developing vision based dialogagents. A concrete task with an objective evaluation was proposed by Das et al. [11]. It requiresthe AI system to choose the next answer given the image, the question, and a history of question-answer pairs. This is curated from the visual dialog dataset [11] containing short dialogues abouta scene between two people.
We propose an alternate take on visual dialog. We argue that the reverse setup, i.e., predictionof the next question given the image, caption, and a history of question-answer pairs is equally
2

Figure 1.2: Visual dialog as a combination of two complementary tasks: (1) predicting a contextualanswer to a given question (VisDial [11]); (2) predicting a contextual follow-up question to a givenquestion-answer pair (VisDial-Q).
important. We therefore re-purpose the visual dialog dataset to facilitate training of questioningagents for visual dialog. We release this reformulated dataset along with an questioning evaluationprotocol, i.e., VisDial-Q evaluation. The proposed questioning evaluation protocol is congruent tothe existing VisDial evaluation for the answering task. We believe this reconfiguration to be usefulfor researchers that aim at evaluating the visual question generation side of the visual dialog task.
We also develop a symmetric deep net architecture, applicable to both the answering and thequestioning sides of visual dialog without significant adjustments. The proposed approach out-performs existing baselines [11, 12] on the aforementioned answer prediction task. We present acareful assessment of its performance over five metrics. In Fig. 1.2 we illustrate a combinationof our models producing a visual dialog. To obtain this result, our discriminative questioning andanswering modules communicate with each other.
3

In Chap. 4, we will discuss the approach and experimentation in more details.
Visual Questioning Visual Dialog
Visual QuestionGeneration
Answering side of Visual Dialog
(VisDial evaluation)
Questioning side of Visual Dialog
(VisDial-Q evaluation)
Figure 1.3: Terminology structure used in the thesis.
Terminology: Since there are multi-ple tasks in this work, we clarify theterminology using Fig. 1.3. We use‘visual questioning’ as an umbrellaterm for tasks related to asking ques-tions and involving visual cues. ‘Vi-sual question generation’ is the taskof generating questions related to animage. ‘Visual Dialog’ is the task where two agents - questioning and answering, are involved.The answering side of visual dialog involves choosing an answer to a question, given some context(conversation history, caption and image). Similarly, we introduce the questioning side of visualdialog. It entails choosing follow-up/next question to a given question-answer pair, given somecontext (conversation history, caption and image).
The remainder of this thesis has been divided into the following chapters:
• Chap. 2 discusses background of relevant language and vision tasks and briefly sets apartour contributions from existing work.
• Chap. 3 and Chap. 4 are the two major parts of this thesis. They explain our approach andits experimentation (including evaluation) for visual question generation and visual dialog,respectively.
• Finally, we conclude in Chap. 5.
This thesis summarizes our research on visual questioning agents, which has led to the followingpublications:
1. Unnat Jain*, Ziyu Zhang*, Alexander Schwing, “Creativity: Generating Diverse Questionsusing Variational Autoencoders”, CVPR 2017 [1]
2. Unnat Jain, Svetlana Lazebnik, Alexander Schwing, “Two can play this Game: Visual Dia-log with Discriminative Question Generation and Answering”, CVPR 2018 [2]
4

CHAPTER 2: RELATED WORK
Related to communicative AI agents are several areas that have received a considerable amountof attention in the computer vision research community:
I. Image captioning, i.e., the task to describe the main content of an observed scene.
II. Visual question answering, i.e., the task to answer a question about the content of a providedimage.
III. Visual question generation, i.e., the task to generate a question about an observed scene.
IV. Visual dialog, i.e., the task to answer a question about the content of an image as well as theconversation history before the asked question.
Since visual question generation and visual dialog are the center of focus for this thesis, we discussthese in more details.
2.1 IMAGE CAPTIONING
Classical methods formulate image captioning as a template filling operation [13, 14, 15]. Otherpopular methods formulate image captioning as a retrieval problem [16, 17]. The best fittingdescription from a pool of possible captions is found by evaluating the fitness between availabletextual descriptions and images. This metric is learned from a set of available image descriptions.While this permits end-to-end training, matching image descriptors to a sufficiently large poolof captions is computationally expensive. In addition, constructing a database of captions that issufficient for describing a reasonably large fraction of images seems prohibitive.
To address this issue, recurrent neural nets (RNNs) [18] decompose the space of a caption into aproduct space of individual words. They have found widespread use for image captioning becausethey have been shown to produce remarkable results. For instance, Mao et al. [19] train an imageCNN and a language RNN that shares a joint embedding layer. Vinyals et al. [20] jointly trainsa CNN with a language RNN to generate sentences, Xu et al. [21] extends [20] with additionalattention parameters and learns to identify salient objects for caption generation. Karpathy andLi [22] uses a bi-directional RNN along with a structured loss function in a shared vision-languagespace. Diversity was considered, e.g., by Wang et al. [23].
2.2 VISUAL QUESTION ANSWERING
Beyond describing an image, a significant amount of research has been devoted to approacheswhich answer a question about a provided image. This task is often also used as a testbed for
5

reasoning capabilities of deep nets. A variety of datasets, such as VQA, Visual 7W, Clevr, etc. [24,25, 26, 27, 28, 29] were proposed to facilitate research on vision based question answering systems.Using these datasets, models based on multi-modal representation and attention [30, 31, 32, 33,34, 35, 36, 37], deep net architecture developments [38, 39, 40] and dynamic memory nets [41]have been discussed. Despite these efforts, it was hard to assess the visual reasoning capabilitiesof present day deep nets and differentiate them from memorization of language statistics. Totrain more effective computer vision models, VQA 2.0 [42] was recently released. In this datasetcontains a collection of complementary images such that every question is associated with a pairof similar images that result in two different answers to the same question.
2.3 VISUAL QUESTION GENERATION
Visual Question Generation (VQG) is a task that has been proposed very recently and is stillvery much an open-ended topic. Ren et al. [25] proposed a rule-based algorithm to convert a givensentence into a corresponding question that has a single word answer. Mostafazadeh et al. [8]were the first to learn a question generation model using human-authored questions instead ofmachine-generated captions. They focus on creating a ‘natural and engaging’ question. Recently,Vijayakumar et al. [43] have shown preliminary results for this task as well.
We think that visual question generation is an important task for two reasons. First, the task isdual to visual question answering and by addressing both tasks we can close the loop. Second, wethink the task is in spirit similar to ‘future prediction’ in that a reasonable amount of creativity hasto be encoded in the model. Particularly the latter is rarely addressed in the current literature. Forexample, Mostafazadeh et al. [8] obtain best results by generating a single question per image usinga forward pass of image features through a layer of Long Short-Term Memory units (LSTMs) [44]or gated recurrent units [45]. Vijayakumar et al. [43] show early results of question generation byfollowing the same image caption generative model [20] as COCO-QA, but by adding a diversebeam search step to boost diversity.
2.4 VISUAL DIALOG
A combination of the three aforementioned tasks is visual dialog. Strictly speaking it involvesboth generation of questions and corresponding answers. However, in its original form [11], visualdialog required to predict the answer for a given question, a given image and a provided history ofquestion-answer pairs. While this largely resembles the visual question answering task, a varietyof different approaches have been proposed recently.
6

For instance, Das et al. [11] formulate three models based on late fusion, attention based hier-archical LSTM, and memory networks. A baseline for simple models is set using the ‘late fusion’architecture. While late fusion has a simple architecture, the other two complex models obtainbetter performance. Following up, Lu et al. [12] proposed a generator-discriminator architecturewhere the outputs of the generator are improved using a perceptual loss from a pre-trained dis-criminator. The generator consists of an encoder (with two LSTM nets and attention mechanism)and a Gumbel-softmax [46] based LSTM decoder. The discriminator employs a similar encoderand a deep metric learning based loss.
2.5 OUR CONTRIBUTIONS
2.5.1 In Visual Question Generation: Creating diverse questions
Both existing VQG methods [8, 43] yield encouraging results. However in Mostafazadeh et
al. [8] only a single question is generated per image, while the approach discussed by Vijayaku-mar et al. [43] generates diverse questions by sampling from a complicated energy landscape,which is intractable in general [47, 48].
In contrast, in this work, we propose a generative modeling method which samples from adistribution in an encoding space of questions. The encodings are subsequently mapped to a high-dimensional representation using, in our case, LSTM nets. This is then used to generate the finalquestion, which relates to the given image.
2.5.2 In Visual Dialog: Introducing questioner’s side evaluation
Fig. 4.1 summarizes the difference between our Visual Dialog approach and the existing meth-ods. A study of similar type was done by Jabri et al. [49] for VQA. All aforementioned meth-ods [11, 12] first encode the query, image, caption and history into a fused representation. Later,this encoded representation is used to obtain similarity with the 100 options. In contrast, our modeluses the option under evaluation as an early input. We perform both fusion and similarity scoringtogether using a multi-layer perceptron network. This joint optimization improves performancesignificantly compared to even memory networks [11]. We obtain quantitative results slightly bet-ter than the methods in [12]. Also, training of all our models converges within 5 epochs, which issignificantly faster than the techniques proposed in [12] (pretraining of the generator and discrim-inator networks for 20 and 30 epochs respectively).
Despite strong dialog information, the suggested evaluation of the VisDial dataset is stronglyone-sided as mentioned before. To tackle this issue, Das et al. [50] introduced an image guessing
7

game as a proxy to build visual question and answer bots. They adopt reinforcement learningbased methods which they found to outperform maximum likelihood based supervised learning onrespective metrics. Despite training both questioning and answering agents on the VisDial dataset,only answer metrics are reported. This is because at present there isn’t an objective questiongeneration protocol for the VisDial dataset. To bridge this gap, we provide a reconfigurationof the VisDial dataset, i.e., ‘VisDial-Q.’ We introduce VisDial-Q to facilitate an evaluation ofvisual question generation agents. We also provide our baselines for VisDial-Q. We believe thisreconfiguration to be useful for researchers that aim at evaluating the visual question generationside of the visual dialog task.
8
CHAPTER 3: DIVERSE VISUAL QUESTION GENERATION USINGVARIATIONAL AUTOENCODERS
In this chapter, we describe our approach for visual question generation (demonstrated in Fig. 1.1).For this task, we leverage the generative strength of variational autoencoders (VAEs) [9]. We com-bined this with the LSTM based language representations, to obtain a VAE-LSTM approach forthis task.
The remaining chapter has two sections. First, we present our approach and model description.We start the explanation with a summary of VAEs and connect it to the task at hand, visual questiongeneration. This involves explaining how P and Q distributions are modeled using LSTMs. Thedifference between training and inference setups is also highlighted along with implementationlevel details. Second, we present experimental details and results. This includes datasets details,evaluation metrics, and quantitative results. We also present a qualitative analysis of our errormodes.
3.1 APPROACH
3.1.1 Background on Variational Autoencoders
VAEs were first introduced by Kingma and Welling [9] and they were quickly adopted acrossdifferent areas. They are straightforward to train, unlike Generative Adverserial Networks [10]which require a lot of training tricks for convergence [51, 10, 52, 53]. In our description x is thedata being modeled and z is a latent space (which has a gaussian prior). We later connect thisdescription to our approach, where x will be questions and the encoder and decoder would beconditioned on the given image.
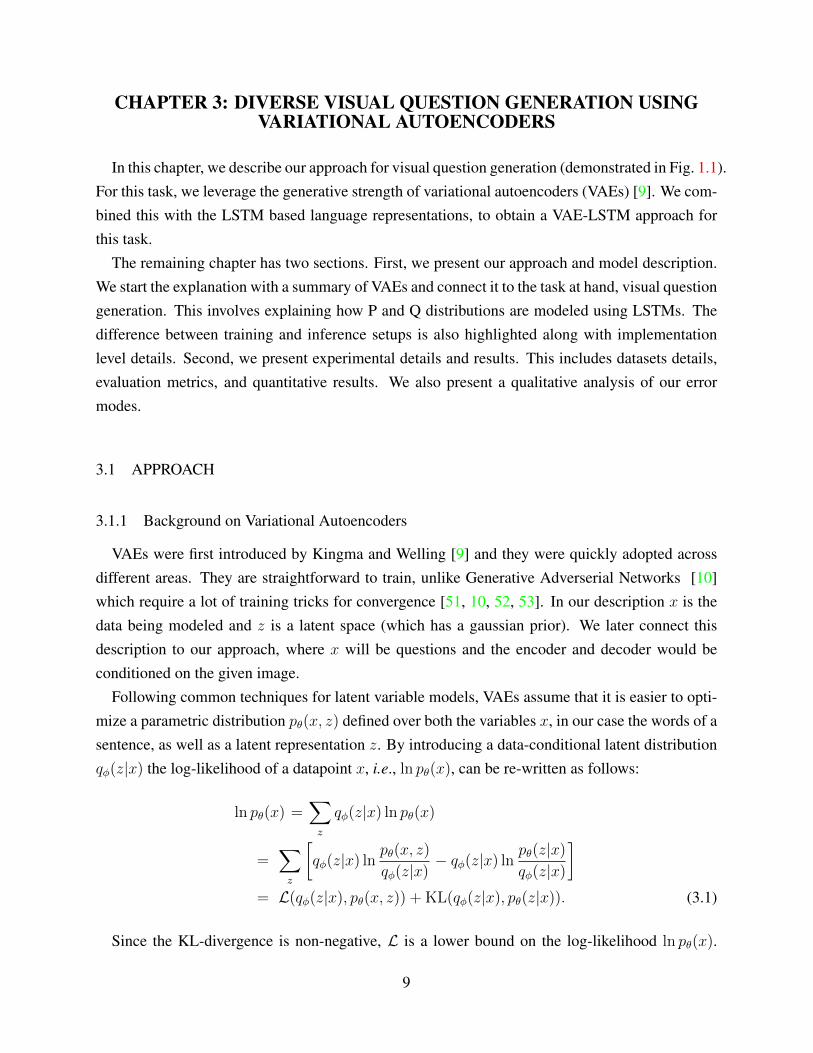
Following common techniques for latent variable models, VAEs assume that it is easier to opti-mize a parametric distribution pθ(x, z) defined over both the variables x, in our case the words of asentence, as well as a latent representation z. By introducing a data-conditional latent distributionqφ(z|x) the log-likelihood of a datapoint x, i.e., ln pθ(x), can be re-written as follows:
ln pθ(x) =∑z
qφ(z|x) ln pθ(x)
=∑z
[qφ(z|x) ln
pθ(x, z)
qφ(z|x)− qφ(z|x) ln
pθ(z|x)qφ(z|x)
]= L(qφ(z|x), pθ(x, z)) + KL(qφ(z|x), pθ(z|x)). (3.1)
Since the KL-divergence is non-negative, L is a lower bound on the log-likelihood ln pθ(x).
9

Note that computation of the KL-divergence is not possible because of the unknown and generallyintractable posterior pθ(z|x). However when choosing a parametric distribution qφ(z|x) with ca-pacity large enough to fit the posterior pθ(z|x), the log-likelihood w.r.t. θ is optimized by insteadmaximizing the lower bound w.r.t. both θ, and φ. Note that the maximization of L w.r.t. φ reducesthe difference between the lower bound L and the log-likelihood ln pθ(x).
Instead of directly maximizing the lower bound L given in Eq. (3.1) w.r.t. θ, φ, dealing with ajoint distribution pθ(x, z) can be avoided via
L(qφ, pθ) =∑z
qφ(z|x) lnpθ(x|z)pθ(z)qφ(z|x)
=∑z
qφ(z|x) lnpθ(z)
qφ(z|x)+∑z
qφ(z|x) ln pθ(x|z)
=−KL(qφ(z|x), pθ(z)) + Eqφ(z|x) [ln pθ(x|z)] . (3.2)
Note that pθ(z) is a prior distribution over the latent space and qφ(z|x) is modeling the intractableand unknown posterior pθ(z|x). Intuitively the model distribution is used to guide the likelihoodevaluation by focusing on highly probable regions.
In a next step the expectation over the model distribution qφ is approximated with N sampleszi ∼ qφ, i.e., after abbreviating KL(qφ(z|x), pθ(z)) with KL(qφ, pθ) we obtain:
minφ,θ
KL(qφ, pθ)−1
N
N∑i=1
ln pθ(x|zi), s.t. zi ∼ qφ. (3.3)
In order to solve this program in an end-to-end manner, i.e., to optimize w.r.t. both the modelparameters θ and the parameters φ which characterize the distribution over the latent space, itis required to differentiate through the sampling process. To this end, Kingma and Welling [9]propose to make use of the ‘reparameterization trick.’ For example, if we restrict qφ(z|x) to be anindependent Gaussian with mean µj and variance σj for each component zj in z = (z1, . . . , zM),then we can sample easily via zij = µj + σj · εi where εi ∼ N (0, 1). The means µj(x, φ) andvariances σj(x, φ) are parametric functions which are provided by the encoder qφ(z|x). A generaloverview of VAEs is provided in Fig. 3.1.
3.1.2 Visual Question Generation
In the following we describe our technique for learning a high-dimensional embedding and forinference in greater detail. We start with the learning setting before diving into the details regardinginference.
10

Figure 3.1: High level VAE overview of our approach.
Learning: As mentioned before, when using a variational autoencoder, choosing appropriate qand p distributions is of crucial importance. We show a high-level overview of our method inFig. 3.1 and choose long short-term memory (LSTM) networks [44] models for the encoder (q-distribution) and decoder (p-distribution). Learning amounts to finding the parameters φ and θof both modules. We detail our choice for both distributions in the following and provide moreinformation regarding the trainable parameters of the model.Q-distribution: The q-distribution encodes a given sentence and a given image signal into a latentrepresentation. Since this embedding is only used during training we can assume images andquestions to be available in the following. Our technique to encode images and questions is basedon LSTM networks. We visualize the computations in Fig. 3.2.
Formally, we compute an F -dimensional feature f(I) ∈ RF of the provided image I using aneural net, e.g., the VGG net introduced by Simonyan and Zisserman [54]. The LSTM unit firstmaps the image feature linearly into its H dimensional latent space using a matrix WI ∈ RH×F .For simplicity we neglect bias terms here and in the following.
We consider a maximum length of T words where each word is represented by a V -dimensional1-hot encoding. Each 1-hot encoding xi ∈ x = (x1, . . . , xT ) selects an E-dimensional wordembedding vector from the matrixWe ∈ RE×V , which is learned. The LSTM unit employs anotherlinear transformation using the matrix We,2 ∈ RH×E to project the word embedding into the Hdimensional space used inside the LSTM cells. We leave usage of more complex embeddings suchas [55, 56] to future work.
Given the F -dimensional image feature f(I) and the E-dimensional word embeddings, theLSTM internally maintains an H-dimensional representation. We found that providing the im-
11

Figure 3.2: Q-distribution: The V -dimensional 1-hot encoding of the vocabulary (blue) gets em-bedded linearly via We ∈ RE×V (purple). Embedding and F -dimensional image feature (green)are the LSTM inputs, transformed to fit the H dimensional hidden space. We transform the finalhidden representation via two linear mappings to estimate mean and log-variance.
age embedding in the first step and each word embedding in subsequent steps to perform best.After having parsed the image embedding and the word embeddings, we extract the final hiddenrepresentation hT ∈ RH from the last LSTM step. We subsequently apply two linear transforma-tions to the final hidden representation in order to obtain the mean µ = WµhT and the log variancelog(σ2) = WσhT of anM -variate Gaussian distribution, i.e.,Wµ ∈ RM×H andWσ ∈ RM×H . Dur-ing training a zero mean and unit variance is encouraged, i.e., we use the prior pθ(z) = N (0, 1) inEq. (3.3).P-distribution: The p-distribution is used to reconstruct a question x given, in our case, the imagerepresentation f(I) ∈ RF , and an M -variate random sample z. During inference the sample isdrawn from a standard normal N (0, 1). During training, this sample is shifted and scaled by themean µ and the variance σ2 obtained as output from the encoder (the reparameterization trick). Forthe p-distribution and the q-distribution, we use the same image features f(I), but learn a differentword embedding matrix, i.e., for the decoder Wd ∈ RE×V . We observe different embeddingmatrices for the encoder and decoder to yield better empirical results. Again we omit the biasterms.
Analogously to the encoder we use an LSTM network for decoding, which is visualized inFig. 3.3. Again we provide the F -dimensional image representation f(I) as the first input signal.Different from the encoder we then provide as the input to the second LSTM unit a randomly drawnM -variate sample z ∼ N (0, 1), which is shifted and scaled by the mean µ and the variance σ2
12

Figure 3.3: P-distribution: Input to the LSTM units are the F -dimensional image feature f(I), theM -dimensional sample z (transformed during training), and the E-dimensional word embeddings.To obtain a prediction we transform the H-dimensional latent space into the V -dimensional logitspi.
during training. Input to the third and all subsequent LSTM units is an E-dimensional embeddingof the start symbol and subsequently the word embeddings Wdxi. As for the encoder, those inputsare transformed by the LSTM units into its H-dimensional operating space.
To compute the output we use the H-dimensional hidden representation hi which we linearlytransform via a V ×H-dimensional matrix into the V -dimensional vocabulary vector of logits, ontop of which a softmax function is applied. This results in a probability distribution p0 over thevocabulary at the third LSTM unit. During training, we maximize the predicted log-probability ofthe next word in the sentence, i.e., x1. Similarly for all subsequent LSTM units.
In our framework, we jointly learn the word-embedding We ∈ RE×V together with the V ×H-dimensional output embedding, the M × H-dimensional encoding, and the LSTM projections tothe H-dimensional operating space. The number of parameters (including the bias terms) in ourcase are 2V E from the word embeddings matrix, one for the encoder and another for the decoder;HV + V as well as 2(HM + M) from the output embedding of the decoder and the encoderrespectively; (FH +H)+ 2(EH +H)+ (MH +H)+ (HH +H) internal LSTM unit variables.Inference: After having learned the parameters of our model on a dataset consisting of pairs ofimages and questions we obtain a decoder that is able to generate questions given an embedding
13

f(I) ∈ RF of an image I and a randomly drawn M -dimensional sample z either from a standardnormal or a uniform distribution. Importantly, for every different choice of input vector z wegenerate a new question x = (x1, . . . , xT ).
Since no groundtruth V -dimensional embedding is available, during inference, we use the pre-diction from the previous timestep as the input to predict the word for the current timestep.
3.1.3 Implementation details
Throughout, we used the 4096-dimensional fc6 layer of the 16-layer VGG model [54] as ourimage feature f(I), i.e., F = 4096. We also fixed the 1-hot encoding of the vocabulary, i.e.,V = 10849, to be the number of words we collect from our datasets (VQA+VQG, detailed inthe next section). We investigated different dimensions for the word embedding (E), the hiddenrepresentation (H), and the encoding space (M ). We found M = 20, H = 512, and E = 512 toprovide enough representational power for training on roughly 400, 000 questions obtained fromroughly 126, 000 images.
We found an initial learning rate of 0.01 for the first 5 epochs to reduce the loss quickly and togive good results. We reduce this learning rate by half every 5 epochs.
3.2 EXPERIMENTS
In the following we evaluate our proposed technique on the VQG dataset [8] and present avariety of different metrics to demonstrate the performance. We first describe the datasets andmetrics, before providing our results. We also provide qualitative visualizations such as sunburstplots in Fig. 3.4.
3.2.1 Datasets
VQA dataset: The images of the VQA dataset [26] are obtained from the MS COCO dataset [57],and divided into 82, 783 training images, 40, 504 validation images and 40, 775 testing images.Each image in the training and validation sets is annotated with 3 questions. The answers providedin the VQA dataset are not important for the problem we address.VQG datasets: The Visual Question Generation [8] dataset consist of images from MS COCO,Flickr and Bing. Each of these sets consists of roughly 5, 000 images and 5 questions per image(with some exceptions). Each set is split into 50% training, 25% validation and 25% test. VQGis a dataset of natural and engaging questions, which goes beyond simple literal description basedquestions.
14

what
is
the
nameof
is
this
a
the
are kind
howare
ofcolor
isthe
VQG-COCO
(a) VQG-COCO
what
is
the
nameof
is
this
a
the
arekind
how
are
ofcolor
isthe
VQG-Flickr
they
man
womanmany
(b) VQG-Flickr
what
is
the
nameof
is
this
a
the
are kind
how
are
ofcolor
is
VQG-Bing
the
man
many
this
(c) VQG-Bing
Figure 3.4: Sunburst plots for diversity: Visualizing the diversity of questions generated for eachof VQG datasets. The ith ring captures the frequency distribution over words for the ith word of thegenerated question. The angle subtended at the center is proportional to the frequency of the word.While some words have high frequency, the outer rings illustrate a fine blend of words similar tothe released dataset [8]. We restrict the plot to 5 rings for easy readability.
The VQG dataset targets the ambitious problem of ‘natural question generation.’ However, dueto its very small size, training of larger scale generative models that fit the high-dimensional natureof the problem is a challenge. Throughout our endeavor we found a question dataset size similarto the size of the VQA dataset to be extremely beneficial.VQA+VQG dataset To address this issue, we combined the VQA and VQG datasets. VQA’ssheer size provides enough data to learn the parameters of our LSTM based VAE model. More-over, VQG adds additional diversity due to the fact that questions are more engaging and natural.The combined training set has 125, 697 images (VQA training + VQA validation + VQG-COCOtraining - VQG-COCO validation - VQG-COCO test + VQG-Flickr training + VQG-Bing train-ing) and a total of 399, 418 questions. We ensured that there is absolutely no overlap betweenthe images we train on and the images we evaluate. Since different images may have the samequestion, the number of unique questions out of all training question is 238, 699.
3.2.2 Evaluation Metrics
BLEU: BLEU, originally designed for evaluating the task of machine translation, was one of thefirst metrics that achieved good correlation with human judgment. It calculates ‘modified’ n-gramprecision and combines them to output a score between 0 to 1. BLEU-4 considers up to 4-gramsand has been used widely for evaluation of existing works on machine translation, generatingcaptions and questions.METEOR: The METEOR score is another machine translation metric which correlates well with
15

human judgment. An F-measure is computed based on word matches. The best among the scoresobtained by comparing the candidate question to each reference question is returned. In our casethere are five reference questions for each image in VQG test sets. Despite BLEU and METEORhaving considerable shortcomings (details in [58]), both are popular metrics of comparison.Oracle-metrics: There is a major issue in directly using machine translation metrics such as BLEUand METEOR for evaluating generative approaches for caption and question generation. Unlikeother approaches which aim to create a caption or question which is similar to the ‘reference,’generative methods like [20, 43] and ours produce multiple diverse and creative results whichmight not be present in the dataset. Generating a dataset which contains all possible questions isdesirable but illusive. Importantly, our algorithm may not necessarily generate questions which areonly simple variations of a groundtruth question as sampling of the latent space provides the abilityto produce a wide variety of questions. [20, 43] highlight this very issue, and combat it by statingtheir results using what [43] calls oracle-metrics. Oracle-BLEU, for example, is the maximumvalue of the BLEU score over a list of k potential candidate questions. Using these metrics wecompare our results to approaches such as [8] which infer one question per image aimed to besimilar to the reference question.Diversity score: Popular machine translation metrics such as BLEU and METEOR provide aninsight into the accuracy of the generated questions. In addition to showing that we performwell on these metrics, we felt a void for a metric which captures the diversity. This metric isparticularly important when being interested in an engaging system. To demonstrate diversity, weevaluate our model on two intuitive metrics which could serve as relevant scores for future workattempting to generate diverse questions. The two metrics we use are average number of uniquequestions generated per image, and the percentage among these questions which have never beenseen at training time. The first metric assesses what we call the generative strength and the latterrepresents the inventiveness of models such as ours.
3.2.3 Quantitative Evaluation
In the following we first evaluate our proposed approach quantitatively using the aforementionedmetrics, i.e., BLEU score, METEOR score and the proposed diversity score. Subsequently, weprovide additional qualitative results illustrating the diversity of our approach. We show results fortwo sampling techniques, i.e., sampling z uniformly and sampling z using a normal distribution.BLEU: BLEU score approximates human judgment at a corpus level and does not necessarilycorrelate well if used to evaluate sentences individually. Hence we state our results for the corpus-BLEU score (similar to [8]). The best performing models presented in [8] have corpus-BLEU of0.192, 0.117 and 0.123 for VQG-COCO, VQG-Flickr and VQG-Bing datasets respectively. To
16

BLEU METEORSampling
Average Oracle Average OracleN1, 100 0.356 0.393 0.199 0.219N1, 500 0.352 0.401 0.198 0.222
U10, 100 0.328 0.488 0.190 0.275U10, 500 0.326 0.511 0.186 0.291U20, 100 0.316 0.544 0.183 0.312U20, 500 0.311 0.579 0.177 0.342
Table 3.1: Accuracy metrics: Maximum (over the epochs) of average and oracle values of BLEUand METEOR metrics. Sampling the latent space by uniform distribution leads to better oraclescores. Sampling the latent space by a normal distribution leads to better average metrics. Inter-pretation in Sec. 3.2.3. Table for VQG-Flickr and VQG-Bing are similar and are included in thesupplementary material.
SamplingGenerative Strength
(%)Inventiveness
(%)N1, 100 1.98 10.76N1, 500 2.32 12.19
U10, 100 9.82 18.78U10, 500 16.14 24.32U20, 100 22.01 19.75U20, 500 46.10 27.88
Table 3.2: Diversity metrics: Maximum (over the epochs) value of generative strength and inven-tiveness on the VQG-COCO test set. Sampling the latent space by a uniform distribution leads tomore unique questions as well as more unseen questions. Table for VQG-Flickr and VQG-Bingare similar and are included in the supplementary material.
illustrate this baseline, we highlight these numbers using black lines on our plots in Fig. 3.5 (a).METEOR: In Fig. 3.5 (b) we illustrate the METEOR score for our model on the VQG-COCOdataset. Similar to BLEU, we compute corpus-level scores as they have much higher correlationwith human judgment. The best performing models presented in [8] have corpus-METEOR of0.197, 0.149 and 0.162 for VQG-COCO, VQG-Flickr and VQG-Bing datasets respectively. Toillustrate this baseline, we highlight these numbers using black lines on our plots in Fig. 3.5 (b).In Tab. 3.1 we compile the corpus and oracle metrics for six different sampling schemes. Thesampling for results listed towards the bottom of the table is less confined. The closer the samplingscheme is to the N (0, 1), the closer is our generated corpus of questions to the reference questionof the dataset. On the other hand, the more exploratory the sampling scheme, the better is the bestcandidate (hence, increasing oracle metrics).Diversity: Fig. 3.6 illustrates the generative strength and inventiveness of our model with different
17

0 5 10 15 20Epoch
0.0
0.1
0.2
0.3
0.4
0.5
0.6BL
EU S
core
(a) Average-BLEU & oracle-BLEU score
0 5 10 15 20Epoch
0.00
0.05
0.10
0.15
0.20
0.25
0.30
0.35
Met
eor s
core
Avg. metrics Oracle metricsN(0,I), 100 ptsN(0,I), 500 ptsU(-10,10), 100 ptsU(-10,10), 500 ptsU(-20,20), 100 ptsU(-20,20), 500 pts
N(0,I), 100 ptsN(0,I), 500 ptsU(-10,10), 100 ptsU(-10,10), 500 ptsU(-20,20), 100 ptsU(-20,20), 500 pts
(b) Average-METEOR & oracle-METEOR scores
Figure 3.5: Accuracy metrics: BLEU and METEOR scores for VQG-COCO. Experiments withvarious sampling procedures and results compared to the performance of the baseline model [8](line in black color). VQG-Flickr and VQG-Bing results are similar and have been included in thesupplementary material.
0 5 10 15 20Epoch
0
10
20
30
40
50
Coun
t/im
age
100, N1500, N1100, U10500, U10100, U20500, U20
(a) Generative strength: Number of uniquequestions averaged over the number of images.
0 5 10 15 20Epoch
0
5
10
15
20
25
30
Perc
enta
ge
100, N1500, N1100, U10500, U10100, U20500, U20
(b) Inventiveness:Unique questions which were never seen in training set
Total unique questions for that image
Figure 3.6: Diversity metrics: Generative strength and Inventiveness, averaged over all the imagesin the VQG-COCO test set. VQG-Flickr and VQG-Bing results are similar and are included in thesupplementary material.
sampling schemes for z. For the best z sampling mechanism of U(−20, 20) using 500 points, weobtained on average 46.10 unique questions per image (of which 26.99% unseen in the trainingset) for COCO after epoch 19; For Flickr, 59.57 unique questions on average (32.80% unseen)after epoch 19; For Bing, 63.83 unique questions on average (36.92% unseen) after epoch 15. InTab. 3.2, even though the training prior over the latent space is a N (0, 1) distribution, sampling
18

Figure 3.7: Recognition and co-occurrence based failure cases: Left: A special aircraft is recog-nized as multiple ‘airplanes’ (two sets of wings instead of one may cause the confusion), therefore,erroneous questions (marked in blue) arise. Right: Due to very frequent co-occurrence of greenvegetable/food/fruit in food images, our VQG model generates questions (marked in green) aboutgreen vegetables even when they are missing. The five small images are few examples of howtraining set food images almost always contain greens.
from the exploratory U (-20,20) distribution leads to better diversity of the generated questions.To further illustrate the diversity of the generated questions we use the sunburst1 plots shown in
Fig. 3.4 for the COCO, Flickr and Bing datasets. Despite the fact that a large number of questionsstart with “what” and “is,” we still observe a quite reasonable amount of diversity.
3.2.4 Qualitative Evaluation
In Fig. 1.1 we show success cases of our model. A range of literal to inferential questions aregenerated by our model, some requiring strong prior (human-like) understanding of objects andtheir interaction. In previous sections we showed that our model does well on metrics of accuracyand diversity. In Fig. 3.7 we illustrate two categories of failure cases. Recognition failures, wherethe pre-learned visual features are incapable of capturing correctly the information required toformulate diverse questions. As illustrated by the image of a complex aircraft which appears
1http://bl.ocks.org/mbostock/4063423
19

similar to two airplanes. Hence, our system generates questions consistent with such a perception.Second are co-occurrence based failures. This is illustrated using the image of fries and a
hot dog. In addition to some correct questions, some questions on green food/fruit/vegetablesinevitably pop up in food images (even for images without any greens). Similarly, questions aboutbirds are generated in some non-bird images of trees. This could be accounted to very frequentco-occurrence of reference questions on greens or birds whenever an image contains food or trees,respectively.To summarize, we combined the advantages of variational autoencoders with LSTM cells to obtaina framework that is able to generate a diverse set of questions given a single input image. Wedemonstrated the applicability of our framework on a diverse set of images and envision it beingapplicable in domains such as computational education, entertainment and for driving assistants &chatbots.
20
CHAPTER 4: VISUAL DIALOG WITH DISCRIMINATIVE QUESTIONGENERATION AND ANSWERING
Models for visual dialog are divided into two categories – discriminative and generative. Fordiscriminative methods, it is assumed that 100 options will be available at inference. Hence,discriminative methods can be trained to relatively scoring options. Evaluation is straightforward,as 100 options in the protocol are directly scored by discriminative models. On the other hand,generative models do not assume options will be available for answering (or questioning). Hence,for their evaluation the text generated is compared (using a notion of similarity) to the 100 optionsin evaluation protocol.
In this chapter, we focus on discriminative visual dialog systems. In contrast, generative meth-ods model a complex output space distribution. Since discriminative frameworks cannot providesuch free-form answers, they are restricted to environments where a small number of answersor questions is sufficient. Beyond focusing on the visual question answering part like [11], wealso provide results for question generation. We argue that this part is at least as important for asuccessful visual dialog system as answering a question.
To this end we develop a unified deep net architecture for both visual question answering andquestion generation. We will demonstrate in Sec. 4.2 that the proposed approach performs wellon both tasks. In the following we first provide an overview of the proposed approach beforewe discuss the developed architecture in greater detail and provide implementation details. Wefinally discuss how we repurpose the visual dialog dataset to obtain a training set for the questiongeneration task.
4.1 APPROACH
4.1.1 Overview
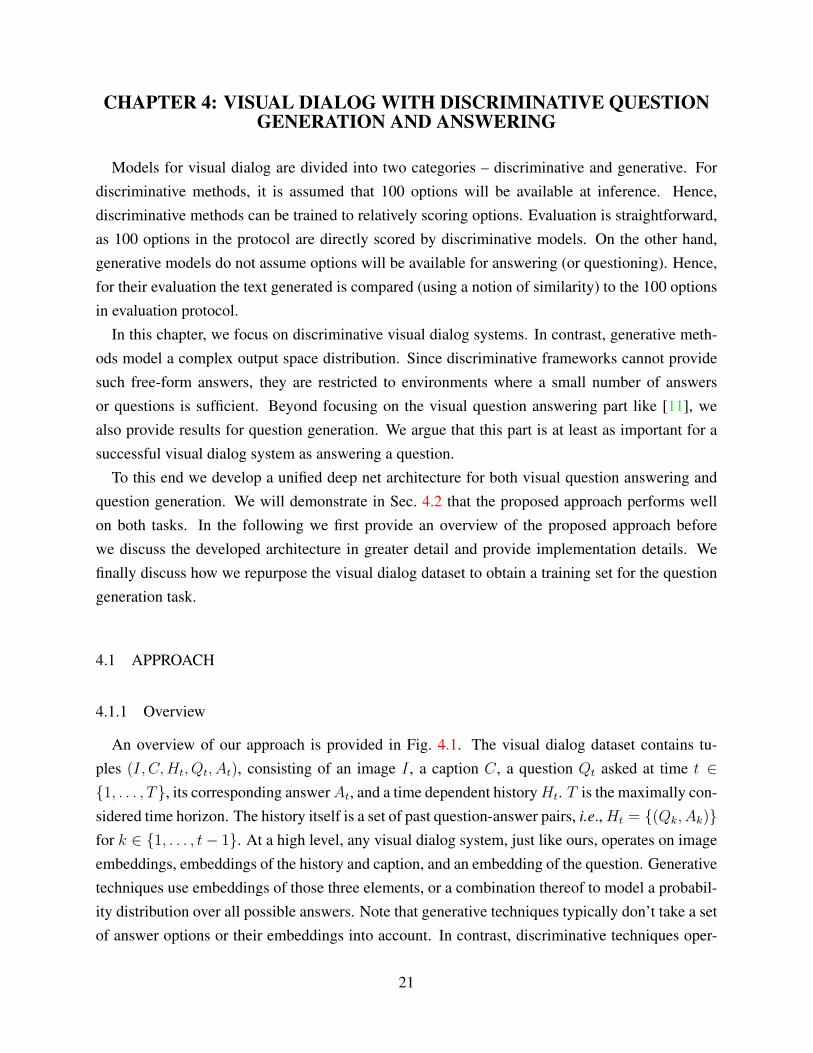
An overview of our approach is provided in Fig. 4.1. The visual dialog dataset contains tu-ples (I, C,Ht, Qt, At), consisting of an image I , a caption C, a question Qt asked at time t ∈{1, . . . , T}, its corresponding answerAt, and a time dependent historyHt. T is the maximally con-sidered time horizon. The history itself is a set of past question-answer pairs, i.e.,Ht = {(Qk, Ak)}for k ∈ {1, . . . , t− 1}. At a high level, any visual dialog system, just like ours, operates on imageembeddings, embeddings of the history and caption, and an embedding of the question. Generativetechniques use embeddings of those three elements, or a combination thereof to model a probabil-ity distribution over all possible answers. Note that generative techniques typically don’t take a setof answer options or their embeddings into account. In contrast, discriminative techniques oper-
21

Figure 4.1: Overview of the proposed approach: Joint similarity scoring of answer option andfusion of all input features.
ate on a set of answers, particularly their embeddings, and assess the fitness of every set memberw.r.t. the remaining data, i.e., the image I , the history Ht, the caption C and the question Qt. Onemember of the answer set constitutes the groundtruth, while other possible answers are assembledto obtain a reasonably challenging task.
4.1.2 Unified Deep Net Architecture
A detailed illustration of our architecture is provided in Fig. 4.2. Using LSTM nets we computeembeddings for the question at hand, the caption and the set of possible answer options. Similarly,to obtain an embedding for a question-answer pair, we use a question and an answer LSTM toencode all question-answer pairs in the history set H . Upon encoding the question and the answerof a question-answer pair in the history via the corresponding LSTM nets, we compute a singleembedding by combining both representations via a fully connected layer. Concatenation of em-beddings for all pairs in the history set H constitutes the history embedding. We then concatenatethe question embedding, the image embedding, the caption embedding, the history embedding,and the answer embedding for each of the possible answer options and employ a similarity net-work to predict a probability distribution over the possible answers. Since we score each optionindependently, our architecture works even if a different number of options are being evaluated attest time. We provide more details for each of the components in the following.
22

Figure 4.2: Architecture of our model for selecting the best answer option from a set of 100candidates. LSTM nets transform all sequential inputs to a fixed size representation. The combinedrepresentations of T −1 previous question-answer pairs are concatenated to obtain the final historyrepresentation. Multi-class cross-entropy loss is computed by comparing a one-hot ground truthvector (based on the correct option) to output probabilities of the answer options.
Question and Answer Embedding: The VisDial dataset questions are truncated to contain amaximum of NQ words. A Stop token is introduced to mark the end of the question. Each word’sV -dimensional one-hot encoding is transformed into a real valued word representation using amatrix WQ ∈ REQ×V . These EQ-dimensional word embeddings are used as input for an LSTMwhich transforms them to LQ-dimensional hidden state representations. The hidden state outputcorresponding to the last Stop token is used as the sentence embedding of the question.
The methodology to obtain the representation for the answer options is identical. Each answeroption is truncated to contain a maximum of NO words. V -dimensional one-hot representationsof the words of an answer are transformed using a word embedding matrix WO ∈ REO×V . TheseEO-dimensional word embeddings when transformed using an LSTM network give rise to an LO-dimensional sentence embedding of the particular answer option at the last LSTM unit. If thequestion has 100 answer options, we extract a sentence embedding for each of the 100 options.Caption Embedding: Similar to question and answer embeddings, captions are truncated to con-tain a maximum of NC words. Then a Stop token is concatenated and these one-hot vectors arefirst transformed using an embedding matrix WC ∈ REC×V before transformation into an LC-dimensional caption embedding using an LSTM net fC(·).Image Representation: To obtain an image representation we make use of pretrained CNN fea-tures to represent images. For a fair comparison with baseline architectures proposed in [11], we
23

use the activations of the second to last layer of the VGG-16 [54] deep net. We normalize theseLI-dimensional activations by dividing via their `2 norm, as also performed in [11].History Embedding: All question-answer pairs (Qk,Ak) before the query time t, i.e., k ∈ {1, . . . , t−1}, serve as history. An embedding matrix Wqh ∈ REqh×V maps one-hot word vectors to real val-ued embeddings. These are transformed by a question-history LSTM fqh(·) to an Lqh-dimensionalsentence embedding. Similarly, the answer-history is encoded via Wqh ∈ REqh×V and fah(·)to obtain an Lah-dimensional sentence embedding. Both the question and answer embeddingare combined using a fully connected layer to obtain an LH-dimensional representation of a pair{(Qk, Ak)}. The number of question-answer pairs before the current query is variable (t − 1 ∈[0, T − 1]). Existing models tackle this issue of variable length history in different ways. Forinstance, Das et al.’s [11] ‘Late Fusion’ (LF) concatenates words of all previous questions and an-swers and transforms it using another LSTM network. They also implement a hierarchical LSTMto address this challenge. Their model performing best in terms of accuracy is based on a memorynetwork which maintains every previous question and answer as a ‘fact entry.’ Lu et al. [12] usean attention based mechanism to combine all previous rounds of history to get a single represen-tation. On the contrary, we found a very simple method to be effective. We introduce an Emptytoken to our vocabulary of words (which already includes the stop token Stop). For all the missingquestion-answer rounds, we pass the [Empty, Stop] sequence to the fqh(·) and fah(·) LSTM nets.Using this we always have T − 1 embeddings of question-answer pairs. A concatenation results inthe (T − 1) · LH-dimensional history representation.Similarity Scoring + Fusion Network: The individual representations of the question, image,caption, history as well as an answer option are concatenated to form an ensemble. This ensembleis represented by an LS = LQ+LI +LC + (T − 1) ·LH +LO dimensional vector. As mentionedbefore, unlike previous methods, we perform similarity scoring and feature fusion jointly. This isachieved using a multi-layer perceptron (MLP). To reduce the number of parameters, the MLP isstructured to have a decreasing number of activations for the intermediate layers before arrivingat a single scalar score for each LS-dimensional representation. During inference we choose theanswer option having the highest score. During learning the answer option scores are transformedinto probabilities using a softmax layer. We report results of architectures with MLP having oneand two hidden layers. The single hidden layer MLP has bLs/2c hidden nodes. The two hiddenlayered MLP has bLs/2c and bLs/4c nodes in its intermediate representation layers.
To simplify training, we employ Batch Normalization [59] layers after every linear layer whichwe found to be more robust. We normalize before the ReLU non-linearity, as suggested in [59].
24

4.1.3 Network Training
To describe training more formally, let Fw(Oi) denote the score for answer option i obtainedfrom the ‘similarity scoring + fusion network,’ and let w denote all the parameters of the architec-ture illustrated in Fig. 4.2. For simplicity we avoid to explicitly mention other inputs such as thequery, the image, etc. While inference chooses the highest scoring answer i∗ = argmaxi Fw(Oi)
given learned parameters w, training optimizes for the parameters w via the multi-class cross-entropy loss:
minw
∑D
ln100∑i=1
expFw(Oi)− Fw(Oi∗)
, (4.1)
where D denotes the dataset containing ground truth information i∗. All our models are trainedusing the Adam optimizer [60] with a learning rate of 10−3.
We experimented with both normal initialization by He et al. [61] and Xavier normal initializa-tion [62] and found the former to work better in our case for both MLP and LSTM weights. Wefound that sharing the weights of the language embedding matrices greatly helps in learning betterword representations. Two hidden layered MLP nets assessing similarity and fusing the represen-tations consistently performed better than a one layered MLP. We use the data splits suggestedin [11] for VisDial v0.9: 80k images for training, 3k image for validation and 40k for test. We usethe validation set to determine when training doesn’t progress any further and report metrics on thetest set. All our models converge in under 5 epochs of training on this dataset, which is illustratedin Fig. 4.3
4.1.4 Implementation Details
The VisDial dataset has ten rounds of question-answer pairs, hence T = 10. NQ, NA and NC
are set to 20, 20 and 40 respectively. Dimensions of all embeddings, i.e., EQ, EO, EC , Eqh andEah are set to 128. LSTM hidden state dimension of query and options, i.e., LQ and LO, are set to512. LSTM hidden state dimension of caption, question-history and answer-history, i.e., LC , Lqhand Lah, are set to 128. All the LSTMs are single layered. In accordance to the baselines of [11],we use pretrained VGG-16 relu7 features for the image embedding, hence, LI = 4096. Note thaton the contrary, [12] utilize 25k dimensional VGG-19 pool5 features. Also, [12] report their resultafter making use of 82k training images which is more than the 80k images suggested in [11] forVisDial v0.9. Finally, [12] utilize deep metric learning and a self-attention mechanism to traina discriminator network which leverages the availability of answer options. We achieve this viaa simple LSTM-MLP approach. However, it must be noted that [12] also investigate generative
25

Figure 4.3: Comparison of our method to state-of-the-art discriminative models–memory networks(MN) [11] and HCIAE [12]. We use the authors’ implementations. HCIAE-D-NP-ATT is the bestperforming discriminative model proposed by [12], which we abbreviate as HCIAE.
models for the VisDial dataset which we don’t explore here.
4.1.5 VisDial-Q Dataset and Evaluation
Das et al. [11] highlight the challenge of evaluating dialog systems and they propose to evaluateindividual responses at each round of the dialog. To this end they create a multiple choice retrievalsetup as a ‘VisDial evaluation protocol.’ As explained earlier, the system is required to choose oneout of 100 answer options for a given question. The image, caption and previous question-answerpairs can be leveraged by the system to help make this choice. However, no surrogate task forassessment of question generation is provided.
To test the questioner side of visual dialog, we therefore create a similar ‘VisDial-Q evaluation
protocol.’ A visual question generation system is required to choose one out of 100 next questioncandidates for a given question-answer pair. To do this it may utilize the image, caption andprevious question-answer pairs. What is left to answer is how these 100 candidates for the nextquestion are selected.
We closely follow the methodology adopted by Das et al. [11] to select 100 answer candidatesfrom the visual dialog dataset of the human question-answer rounds. We select 100 candidatefollow-up questions to a given question-answer (QA) pair as the union of the following four sets:Correct: The next question asked by the human is the ground truth question.Plausible: Plausible questions are follow-up questions to the 50 most similar QA pairs in thedataset. Similar QA pairs are found by comparing concatenated GloVe embeddings [63] of theQA pair being considered with the representation of other QA pairs. Question GloVe embeddings
26

are obtained following [11], i.e., (1) concatenate the GloVe embedding of the first three wordsof the question; (2) average the GloVe embeddings of the remaining words; and (3) concatenateboth vectors. Answer GloVe embeddings are obtained by averaging the GloVe embeddings of allits words. `2 distance computed on the concatenated question and answer GloVe embeddings isused to find nearest neighbor QA pairs. We make sure that a nearest neighbor QA pair is not fromthe same image (same as [11]). Additionally, for the VisDial-Q evaluation, we also ensure thatthe nearest neighbor QA pair isn’t the last (10th) QA round of a dialog, as no human follow-upquestion is available.Popular: Question possibilities also contain the 30 most popular questions of the original dataset.Random: The remaining question options which are left to complete a set of 100 unique candi-dates are filled with random questions from the dataset.
Our intention for creating a set of question options using this methodology is analogous to [11].These candidates encourage an algorithm to distinguish between correct, plausible, and popularcandidates.
At this point it is important to address a strong difference in the nature of evaluating a module forgenerating an answer from a technique producing a question. While answering a given questionbased on options (and some additional information) has fairly little randomness, the questioninganalog is significantly more challenging. That is, for a given QA pair, there could be more than one‘correct’ follow-up question in the options. Despite this inherent ambiguity, objective evaluationof the question generation procedure is equally important. It depicts the questioning system’sability to rank a human generated question. The system should be encourage to rank the humangenerated question in its top ranks, if not at the highest one. Therefore, the ensemble of metricsproposed in [11] and described in Sec. 4.2.2 is even more important than a single Recall@1 basedevaluation.
Our deep net architecture developed for the answering task in Sec. 4.1.2 can be deployed for theVisDial-Q task, with almost no adjustments. Since there exists no follow-up question to the lastQA pair in a dialog of the VisDial dataset, the maximally considered time horizon T is 9 for theVisDial-Q dataset. The ‘query’ for the original visual dialog task is a question whose answer wewish to choose. On the other hand, ‘query’ for the questioning side of visual dialog (VisDial-Q)is a QA pair for which we wish to choose the most relevant follow-up question. For VisDial-Qevaluation, words of the QA pair (concatenation of question and answer words) serve as input tothe ‘query’ LSTM in Fig. 4.2. The options O1, . . . , O100 are now candidate follow-up questions,instead of candidate response answers. All other parameters are identical to the ones mentionedin Sec. 4.1.3 and Sec. 4.1.4.
27

4.2 EXPERIMENTS
In the following we evaluate our proposed architecture on prediction of both answers and ques-tions. To this end, we first provide details about the datasets and evaluation metrics used. We thendiscuss our quantitative assessment before providing qualitative results.
4.2.1 Datasets
We train our models on the VisDial v0.9 dataset [11] which currently contains over 123k image-caption-dialog tuples. Each dialog has 10 question-answer pairs. The images are unique andare obtained from the MSCOCO [57] train and validation split. The dataset was collected byrecording a conversation between two people on Amazon Mechanical Turk. The first person isonly provided the caption to start the conversation, and is tasked to ask questions about the hiddenimage to better understand the scene. The second person has access to both image and caption andis asked to answer the first person’s questions. Both are encouraged to talk in a natural manner,which is markedly different from [26]. Due to this setup, the obtained question-answer pairs haveinherent temporal continuity and are also visually grounded. The VisDial v0.9 train, validationand test sets consists of 80k, 3k and 40k images.
4.2.2 Evaluation Metrics
Many popular metrics like BLEU, ROUGE and METEOR are empirically shown to have lowcorrelation with human judgement of dialog systems [64]. For an objective evaluation of visualdialog systems, [11] suggests metrics for predicted rank of the correct answer option. These areRecall@1, Recall@5, Recall@10, Mean Reciprocal Rank, and Mean Rank of the ground truthanswer. Recall@k is the percentage of questions for which the correct answer option is rankedin the top k predictions of a model. Mean Rank is the empirical average of the rank allotted by amodel to the ground truth answer option. Mean Reciprocal Rank is the empirical average of 1/rankallotted by a model to the ground truth answer option. Lower values for Mean Rank and highervalues for all the other metrics are desirable.
4.2.3 Quantitative Evaluation
In the following we provide a quantitative assessment of our approach. We first discuss resultsfor the question answering task before focusing on question generation.
28
1 2 3 4 5Epoch
5.0
5.5
6.0
6.5
7.0
7.5
8.0M
ean
Rank
Q-only Q+I only Q+I+HLF-QSF-Q-1SF-Q-se-1SF-Q-se-2
LF-QISF-QI-1SF-QI-se-1SF-QI-se-2
HCIAESF-QIH-1SF-QIH-se-1SF-QIH-se-2
(a) Mean rank
1 2 3 4 5Epoch
68
70
72
74
76
78
Reca
ll@5
(in %
)
(b) Recall@5
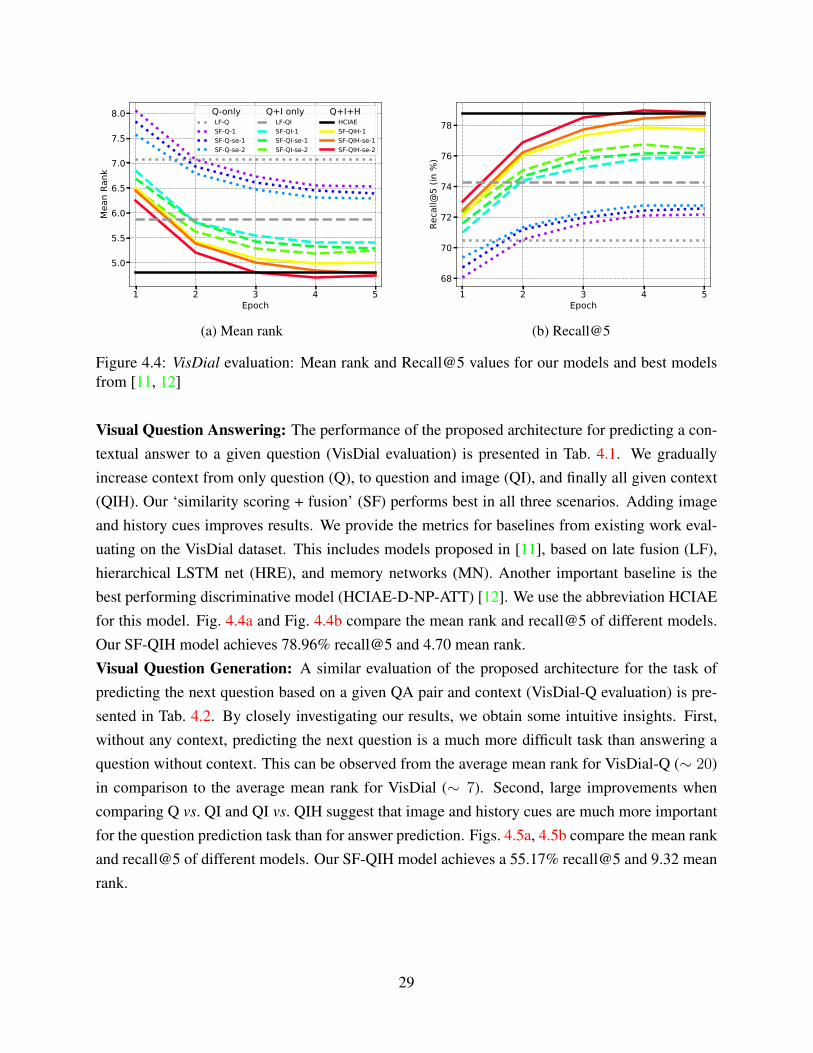
Figure 4.4: VisDial evaluation: Mean rank and Recall@5 values for our models and best modelsfrom [11, 12]
Visual Question Answering: The performance of the proposed architecture for predicting a con-textual answer to a given question (VisDial evaluation) is presented in Tab. 4.1. We graduallyincrease context from only question (Q), to question and image (QI), and finally all given context(QIH). Our ‘similarity scoring + fusion’ (SF) performs best in all three scenarios. Adding imageand history cues improves results. We provide the metrics for baselines from existing work eval-uating on the VisDial dataset. This includes models proposed in [11], based on late fusion (LF),hierarchical LSTM net (HRE), and memory networks (MN). Another important baseline is thebest performing discriminative model (HCIAE-D-NP-ATT) [12]. We use the abbreviation HCIAEfor this model. Fig. 4.4a and Fig. 4.4b compare the mean rank and recall@5 of different models.Our SF-QIH model achieves 78.96% recall@5 and 4.70 mean rank.Visual Question Generation: A similar evaluation of the proposed architecture for the task ofpredicting the next question based on a given QA pair and context (VisDial-Q evaluation) is pre-sented in Tab. 4.2. By closely investigating our results, we obtain some intuitive insights. First,without any context, predicting the next question is a much more difficult task than answering aquestion without context. This can be observed from the average mean rank for VisDial-Q (∼ 20)in comparison to the average mean rank for VisDial (∼ 7). Second, large improvements whencomparing Q vs. QI and QI vs. QIH suggest that image and history cues are much more importantfor the question prediction task than for answer prediction. Figs. 4.5a, 4.5b compare the mean rankand recall@5 of different models. Our SF-QIH model achieves a 55.17% recall@5 and 9.32 meanrank.
29

1 2 3 4 5Epoch
10.0
12.5
15.0
17.5
20.0
22.5
25.0
Mea
n Ra
nk Q-only Q+I only Q+I+HSF-Q-1SF-Q-se-1SF-Q-se-2
SF-QI-1SF-QI-se-1SF-QI-se-2
SF-QIH-1SF-QIH-se-1SF-QIH-se-2
(a) Mean rank
1 2 3 4 5Epoch
20
25
30
35
40
45
50
55
Reca
ll@5
(in %
)
(b) Recall@5
Figure 4.5: VisDial-Q evaluation: Mean rank and Recall@5 values for our models.
Figure 4.6: Joint unrolling of questioning and answering modules on test images. The VQGmodule chooses the most relevant next question based on previous QA pairs and context.
4.2.4 Qualitative Evaluation
In this section we discuss qualitative results. Instead of presenting two separate qualitativeevaluations of our architecture on the answering and questioning side of visual dialog, we provide ajoint analysis. After completing the answering task of choosing the best option for a given question,we provide this QA pair to our pretrained question generation module. The newly generatedquestion is then again put up for discriminative answering by the answering module. Hence we‘generate’ dialog using our discriminative models. Fig. 4.6 summarizes a few of those unrolledexamples. A few arrangements are necessary to jointly unroll our discriminative questioning andanswering modules, since answer options and next question options are available for only datasetdialogs, while we are ‘generating’ (i.e., selecting) new sequences. Hence we need to create options
30

Model MRR R@1 R@5 R@10 MeanQuery only
LF-Q [11] 0.5508 41.24 70.45 79.83 7.08SF-Q-1 0.5619 42.11 72.12 81.39 6.55
SF-Q-se-1 0.5651 42.32 72.54 81.83 6.39SF-Q-se-2 0.5664 42.45 72.75 81.98 6.32
Query + Image onlyLF-QI [11] 0.5759 43.33 74.27 83.68 5.87
SF-QI-1 0.5940 45.49 75.95 85.19 5.40SF-QI-se-1 0.5964 45.72 76.25 85.64 5.29SF-QI-se-2 0.6010 46.19 76.73 85.95 5.18
Query + Image + Caption + HistoryLF-QIH [11] 0.5807 43.82 74.68 84.07 5.78
HRE-QIH [11] 0.5868 44.82 74.81 84.36 5.66MN-QIH [11] 0.5965 45.55 76.22 85.37 5.46HCIAE [12] 0.6222 48.48 78.75 87.59 4.81SF-QIH-1 0.6101 47.04 77.69 86.78 5.00
SF-QIH-se-1 0.6207 48.19 78.66 87.53 4.79SF-QIH-se-2 0.6242 48.55 78.96 87.75 4.70
Table 4.1: VisDial evaluation metrics. ‘-1’ and ‘-2’ denote one and two hidden MLP layers respec-tively. ‘-se’ denotes shared embedding matrices for all LSTMs.
Model MRR R@1 R@5 R@10 MeanQuery only
SF-Q-1 0.1909 9.18 26.18 38.87 23.03SF-Q-se-1 0.1936 9.57 26.20 38.66 22.99SF-Q-se-2 0.1950 9.70 26.44 38.67 22.92
Query + Image onlySF-QI-1 0.2953 16.82 41.58 56.27 14.57
SF-QI-se-1 0.2970 17.06 41.60 56.05 14.48SF-QI-se-2 0.3021 17.38 42.32 57.16 14.03
Query + Image + Caption + HistorySF-QIH-1 0.3877 25.03 53.03 68.33 10.09
SF-QIH-se-1 0.4028 26.51 54.74 69.95 9.54SF-QIH-se-2 0.4060 26.76 55.17 70.39 9.32
Table 4.2: VisDial-Q evaluation metrics. ‘-1’ and ‘-2’ denote one and two hidden layers in MLPrespectively. ‘-se’ denotes shared embedding matrices for all LSTMs.
on the fly, by choosing from a set of questions and answers of nearest neighbor images. Weuniformly sample one of the top 10 ranking questions chosen by the question module to add somemore diversity. We again emphasize that these dialogs are ‘generated’ by choosing from a set of
31

options, which differs from truly generative approaches.Based on the observed empirical results we conclude that our models capture cues from all three
contexts, image, caption and history. There are questions pertaining to partially visible objects,which can be attributed to the caption cue. The same is true for objects visible in the images whicharen’t mentioned in the history/caption text. We experimented with different number of rounds ofinitial history – 1, 2, 3 and 5. In all cases, our models choose relevant follow-up questions andfairly correct answers. Since there are no groundtruth options for these predicted dialog sequences,we can’t report quantitative metrics for this dynamic setup where our models communicate witheach other.
To summarize, we introduced the questioning side of visual dialog and also proposed a VisDial-Q evaluation protocol to quantitatively assess this task. We also developed a discriminative methodfor the answering and questioning side of visual dialog. Our approach outperforms existing base-lines which often use complex architectures. Finally, we showed how to combine both discrimina-tive methods to obtain a system for visual dialog.
32

CHAPTER 5: CONCLUSION
In this work we proposed a composition of approaches for advancing visual questioning agents.We looked at the specific cases of visual question generation and visual dialog.
On the visual question generation side, we combined the generative strength of variational au-toencoder with LSTM language representations. In the future we plan to use more structuredreasoning for this task and also look into convolutional methods [65, 66, 67, 68, 69, 70, 71, 72].
On the visual dialog side, we introduced a reformulation of the visual dialog dataset for a moreeffective evaluation dialog agents. We introduces a simple baseline which improved over existingcomplex models. We also demonstrated how questioning and answering models can communicateto create dialog sequences. Going forward we plan to combine visual dialog and textual ground-ing [73, 74, 75, 76].
These works have helped later works to understand language and vision tasks better [23, 77, 37,78]. Wang et al. [23] improved our VAE-LSTM model but introducing Gaussian Mixture model(GMM) and Additive Gaussian (AG) priors to the latent space. Li et al. [77] establish VQG as adual task of VQA question generation, and utilize it to boost VQA performance.
We see visual questioning playing a key role in building AI agents that communicate. Recentadvances towards combining language-vision with navigation & robotics [79, 80, 81] stand tobenefit from better conversational abilities. Das et al. [79] and Gordon et al. [80] introduce taskswhere agents have to travel in an unseen room to answer a given question. Combined with ques-tioning, interactive agents which seamlessly participate in a dialog are a plausible next step for thecommunity.
33

REFERENCES
[1] U. Jain∗, Z. Zhang∗, and A. G. Schwing, “Creativity: Generating Diverse Questions usingVariational Autoencoders,” in CVPR, 2017, ∗ equal contribution. iv, 4
[2] U. Jain, S. Lazebnik, and A. G. Schwing, “Two can play this Game: Visual Dialog withDiscriminative Question Generation and Answering,” in CVPR, 2018. iv, 4
[3] Y. Bengio, E. Thibodeau-Laufer, G. Alain, and J. Yosinski, “Deep Generative StochasticNetworks trainable by Backprop,” in JMLR, 2014. 1
[4] Y. LeCun, Y. Bengio, and G. E. Hinton, “Deep learning,” Nature, 2015. 1
[5] A. Krizhevsky, I. Sutskever, , and G. E. Hinton, “Imagenet classification with deep convolu-tional neural networks,” in NIPS, 2012. 1
[6] I. Sutskever, O. Vinyals, and Q. V. Le, “Sequence to sequence learning with neural networks,”in NIPS, 2014. 1
[7] G. E. Hinton, L. Deng, D. Yu, G. E. Dahl, A.-R. Mohamed, N. Jaitly, A. Senior, V. Van-houcke, P. Nguyen, T. N. Sainath, and B. Kingsbury, “Deep Neural Networks for AcousticModeling in Speech Recognition: The Shared Views of Four Research Groups,” IEEE SignalProcessing Magazine, 2012. 1
[8] N. Mostafazadeh, I. Misra, J. Devlin, M. Mitchell, X. He, and L. Vanderwende, “Generatingnatural questions about an image,” in ACL, 2016. 1, 6, 7, 14, 15, 16, 17, 18
[9] D. P. Kingma and M. Welling, “Auto-Encoding Variational Bayes,” in ICLR, 2014. 1, 9, 10
[10] I. Goodfellow, J. Pouget-Abadie, M. Mirza, B. Xu, D. Warde-Farley, S. Ozair, A. Courville,and Y. Bengio, “Generative Adversarial Networks,” in NIPS, 2014. 1, 9
[11] A. Das, S. Kottur, K. Gupta, A. Singh, D. Yadav, J. M. Moura, D. Parikh, and D. Batra,“Visual Dialog,” in CVPR, 2017. 2, 3, 6, 7, 21, 23, 24, 25, 26, 27, 28, 29, 31
[12] J. Lu, A. Kannan, , J. Yang, D. Parikh, and D. Batra, “Best of both worlds: Transferringknowledge from discriminative learning to a generative visual dialog model,” NIPS, 2017. 3,7, 24, 25, 26, 29, 31
[13] G. Kulkarni, V. Premraj, V. Ordonez, S. Dhar, S. Li, Y. Choi, A. C. Berg, and T. L. Berg,“Babytalk: Understanding and generating simple image descriptions,” 2011. 5
[14] S. Li, G. Kulkarni, T. L. Berg, A. C. Berg, and Y. Choi, “Composing simple image descrip-tions using web-scale n-grams,” in CoNLL, 2011. 5
[15] M. Mitchell, X. Han, J. Dodge, A. Mensch, A. Goyal, A. Berg, K. Yamaguchi, T. Berg,K. Stratos, and H. Daume III, “Midge: Generating image descriptions from computer visiondetections,” EACL, 2012. 5
34

[16] P. Kuznetsova, V. Ordonez, A. C. Berg, T. L. Berg, and Y. Choi, “Collective generation ofnatural image descriptions,” in ACL, 2012. 5
[17] P. Kuznetsova, V. Ordonez, T. Berg, and Y. Choi, “Treetalk: Composition and compressionof trees for image descriptions,” 2014. 5
[18] T. Mikolov, M. Karafiat, L. Burget, J. Cernocky, and S. Khudanpur, “Recurrent neural net-work based language model,” in INTERSPEECH, 2010. 5
[19] J. Mao, W. Xu, Y. Yang, J. Wang, and A. L. Yuille, “Deep Captioning with MultimodalRecurrent Neural Networks (m-RNN),” CoRR, vol. abs/1412.6632, 2014. 5
[20] O. Vinyals, A. Toshev, S. Bengio, and D. Erhan, “Show and tell: A neural image captiongenerator,” in CVPR, 2015. 5, 6, 16
[21] K. Xu, J. Ba, R. Kiros, K. Cho, A. Courville, R. Salakhudinov, R. Zemel, and Y. Bengio,“Show, attend and tell: Neural image caption generation with visual attention,” in ICML,2015. 5
[22] A. Karpathy and L. Fei-Fei, “Deep visual-semantic alignments for generating image descrip-tions,” in CVPR, 2015. 5
[23] L. Wang, A. G. Schwing, and S. Lazebnik, “Diverse and Accurate Image Description Using aVariational Auto-Encoder with an Additive Gaussian Encoding Space,” in Proc. NIPS, 2017.5, 33
[24] M. Malinowski and M. Fritz, “A Multi-World Approach to Question Answering about Real-World Scenes based on Uncertain Input,” in NIPS, 2014. 6
[25] M. Ren, R. Kiros, and R. Zemel, “Exploring models and data for image question answering,”in NIPS, 2015. 6
[26] S. Antol, A. Agrawal, J. Lu, M. Mitchell, D. Batra, C. L. Zitnick, and D. Parikh, “VQA:Visual question answering,” in ICCV, 2015. 6, 14, 28
[27] H. Gao, J. Mao, J. Zhou, Z. Huang, L. Wang, and W. Xu, “Are you talking to a machine?Dataset and Methods for Multilingual Image Question Answering,” in NIPS, 2015. 6
[28] Y. Zhu, O. Groth, M. Bernstein, and L. Fei-Fei, “Visual7W: Grounded Question Answeringin Images,” in CVPR, 2016. 6
[29] J. Johnson, B. Hariharan, L. van der Maaten, L. Fei-Fei, C. L. Zitnick, and R. Girshick,“Clevr: A diagnostic dataset for compositional language and elementary visual reasoning,”in CVPR, 2017. 6
[30] J. Lu, J. Yang, D. Batra, and D. Parikh, “Hierarchical question-image co-attention for visualquestion answering,” in NIPS, 2016. 6
[31] Z. Yang, X. He, J. Gao, L. Deng, and A. Smola, “Stacked attention networks for imagequestion answering,” in CVPR, 2016. 6
35

[32] J. Andreas, M. Rohrbach, T. Darrell, and D. Klein, “Deep compositional question answeringwith neural module networks,” in CVPR, 2016. 6
[33] A. Das, H. Agrawal, C. L. Zitnick, D. Parikh, and D. Batra, “Human attention in visualquestion answering: Do humans and deep networks look at the same regions?” in EMNLP,2016. 6
[34] A. Fukui, D. H. Park, D. Yang, A. Rohrbach, T. Darrell, and M. Rohrbach, “Multimodalcompact bilinear pooling for visual question answering and visual grounding,” in EMNLP,2016. 6
[35] K. J. Shih, S. Singh, and D. Hoiem, “Where to look: Focus regions for visual questionanswering,” in CVPR, 2016. 6
[36] H. Xu and K. Saenko, “Ask, attend and answer: Exploring question-guided spatial attentionfor visual question answering,” in ECCV, 2016. 6
[37] I. Schwartz, A. G. Schwing, and T. Hazan, “High-Order Attention Models for Visual Ques-tion Answering,” in Proc. NIPS, 2017. 6, 33
[38] H. Ben-younes, R. Cadene, M. Cord, and N. Thome, “Mutan: Multimodal tucker fusion forvisual question answering,” in ICCV, 2017. 6
[39] M. Malinowski, M. Rohrbach, and M. Fritz, “Ask your neurons: A neural-based approach toanswering questions about images,” in ICCV, 2015. 6
[40] L. Ma, Z. Lu, and H. Li, “Learning to answer questions from image using convolutionalneural network,” in AAAI, 2016. 6
[41] C. Xiong, S. Merity, and R. Socher, “Dynamic memory networks for visual and textual ques-tion answering,” in ICML, 2016. 6
[42] Y. Goyal, T. Khot, D. Summers-Stay, D. Batra, and D. Parikh, “Making the V in VQA matter:Elevating the role of image understanding in Visual Question Answering,” in CVPR, 2017. 6
[43] A. K. Vijayakumar, M. Cogswell, R. R. Selvaraju, Q. Sun, S. Lee, D. Crandall, and D. Ba-tra, “Diverse Beam Search: Decoding Diverse Solutions from Neural Sequence Models,” inAAAI, 2018. 6, 7, 16
[44] S. Hochreiter and J. Schmidhuber, “Long short-term memory,” Neural Computation, 1997.6, 11
[45] J. Chung, C. Gulcehre, K. Cho, and Y. Bengio, “Empirical evaluation of gated recurrentneural networks on sequence modeling,” 2014. 6
[46] E. Jang, S. Gu, and B. Poole, “Categorical reparameterization with gumbel-softmax,” inhttps://arxiv.org/abs/1611.01144, 2016. 7
[47] K. Gimpel, D. Batra, G. Shakhnarovich, and C. Dyer, “A Systematic Exploration of Diversityin Machine Translation,” in EMNLP, 2013. 7
36

[48] D. Batra, P. Yadollahpour, A. Guzman-Rivera, and G. Shakhnarovich, “Diverse M-Best So-lutions in Markov Random Fields,” in ECCV, 2012. 7
[49] A. Jabri, A. Joulin, and L. van der Maaten, “Revisiting visual question answering baselines,”in ECCV, 2016. 7
[50] A. Das, S. Kottur, J. M. Moura, S. Lee, and D. Batra, “Learning cooperative visual dialogagents with deep reinforcement learning,” in ICCV, 2017. 7
[51] T. Salimans, I. Goodfellow, W. Zaremba, V. Cheung, A. Radford, and X. Chen, “ImprovedTechniques for Training GANs,” in NIPS, 2016. 9
[52] A. Radford, L. Metz, and S. Chintala, “Unsupervised representation learning with deep con-volutional generative adversarial networks,” in ICLR, 2016. 9
[53] Y. Burda, R. Grosse, and R. R. Salakhutdinov, “Importance Weighted Autoencoders,” inICLR, 2016. 9
[54] K. Simonyan and A. Zisserman, “Very deep convolutional networks for large-scale imagerecognition,” in ICLR, 2015. 11, 14, 24
[55] L. Wang, Y. Li, and S. Lazebnik, “Learning Deep Structure-Preserving Image-Text Embed-dings,” in CVPR, 2016. 11
[56] Y. Gong, L. Wang, M. Hodosh, J. Hockenmaier, and S. Lazebnik, “Improving Image-Sentence Embeddings Using Large Weakly Annotated Photo Collections,” in ECCV, 2014.11
[57] T.-Y. Lin, M. Maire, S. Belongie, J. Hays, P. Perona, D. Ramanan, P. Dollar, and C. L. Zitnick,“Microsoft coco: Common objects in context,” in ECCV, 2014. 14, 28
[58] R. Vedantam, C. Lawrence Zitnick, and D. Parikh, “Cider: Consensus-based image descrip-tion evaluation,” in CVPR, 2015. 16
[59] S. Ioffe and C. Szegedy, “Batch normalization: Accelerating deep network training by reduc-ing internal covariate shift,” in ICML, 2015. 24
[60] D. Kingma and J. Ba, “A method for stochastic optimization,” in CVPR, 2017. 25
[61] K. He, X. Zhang, S. Ren, and J. Sun, “Delving deep into rectifiers: Surpassing human-levelperformance on imagenet classification,” in ICCV, 2015. 25
[62] X. Glorot and Y. Bengio, “Understanding the difficulty of training deep feedforward neuralnetworks,” in AISTATS, 2010. 25
[63] J. Pennington, R. Socher, and C. D. Manning, “Glove: Global vectors for word representa-tion,” in EMNLP, 2014. 26
37

[64] C.-W. Liu, R. Lowe, I. V. Serban, M. Noseworthy, L. Charlin, and J. Pineau, “How not toevaluate your dialogue system: An empirical study of unsupervised evaluation metrics fordialogue response generation,” in EMNLP, 2016. 28
[65] L.-C. Chen∗, A. G. Schwing∗, A. L. Yuille, and R. Urtasun, “Learning Deep Structured Mod-els,” in ICML, 2015, ∗ equal contribution. 33
[66] A. G. Schwing and R. Urtasun, “Fully Connected Deep Structured Networks,” inhttps://arxiv.org/abs/1503.02351, 2015. 33
[67] B. London∗ and A. G. Schwing∗, “Generative Adversarial Structured Networks,” in NIPSWorkshop on Adversarial Training, 2016, ∗ equal contribution. 33
[68] O. Meshi, M. Mahdavi, and A. G. Schwing, “Smooth and Strong: MAP Inference with LinearConvergence,” in NIPS, 2015. 33
[69] A. G. Schwing, T. Hazan, M. Pollefeys, and R. Urtasun, “Globally Convergent Parallel MAPLP Relaxation Solver using the Frank-Wolfe Algorithm,” in ICML, 2014. 33
[70] A. G. Schwing, T. Hazan, M. Pollefeys, and R. Urtasun, “Globally Convergent Dual MAPLP Relaxation Solvers using Fenchel-Young Margins,” in NIPS, 2012. 33
[71] A. Deshpande, J. Aneja, L. Wang, A. Schwing, and D. Forsyth, “Diverse and controllableimage captioning with part-of-speech guidance,” https://arxiv.org/abs/1805.12589, 2018. 33
[72] J. Aneja, A. Deshpande, and A. Schwing, “Convolutional image captioning,” CVPR, 2018.33
[73] B. A. Plummer, L. Wang, C. M. Cervantes, J. C. Caicedo, J. Hockenmaier, and S. Lazeb-nik, “Flickr30k entities: Collecting region-to-phrase correspondences for richer image-to-sentence models,” in Proc. ICCV, 2015. 33
[74] B. A. Plummer, L. Wang, C. M. Cervantes, J. C. Caicedo, J. Hockenmaier, and S. Lazeb-nik, “Flickr30k entities: Collecting region-to-phrase correspondences for richer image-to-sentence models,” IJCV, 2017. 33
[75] R. A. Yeh, J. Xiong, W.-M. Hwu, M. Do, and A. G. Schwing, “Interpretable and GloballyOptimal Prediction for Textual Grounding using Image Concepts,” in Proc. NIPS, 2017. 33
[76] R. A. Yeh, M. Do, and A. G. Schwing, “Unsupervised Textual Grounding: Linking Words toImage Concepts,” in Proc. CVPR, 2018. 33
[77] Y. Li, N. Duan, B. Zhou, X. Chu, W. Ouyang, and X. Wang, “Visual Question Generation asDual Task of Visual Question Answering,” in https://arxiv.org/abs/1709.07192, 2017. 33
[78] D. Massiceti, N. Siddharth, P. K. Dokania, and P. H. Torr, “Flipdial: A generative model fortwo-way visual dialogue,” 2018. 33
[79] A. Das, S. Datta, G. Gkioxari, S. Lee, D. Parikh, and D. Batra, “Embodied Question Answer-ing,” in CVPR, 2018. 33
38

[80] D. Gordon, A. Kembhavi, M. Rastegari, J. Redmon, D. Fox, and A. Farhadi, “Iqa: Visualquestion answering in interactive environments,” in CVPR, 2018. 33
[81] Y. Bisk, K. J. Shih, Y. Choi, and D. Marcu, “Learning interpretable spatial operations in arich 3d blocks world,” https://arxiv.org/abs/1712.03463, 2017. 33
39