by atul s. kulkarni graduate student, university of ...kulka053/presentation_full.pdf · atul s....
TRANSCRIPT

ByAtul S. Kulkarni
Graduate Student,University of Minnesota Duluth
Under The Guidance ofDr. Richard Maclin

OutlineProblem Statement
Background
Proposed Solution
Experiments & Results
Related Work
Future Work
Conclusion
Q & A

Problem Statement Given a set of users with their previous ratings for a set of
movies, can we predict the rating they will assign to a movie they have not previously rated?
Netflix puts it as “The Netflix Prize seeks to substantially improve the accuracy of
predictions about how much someone is going to love a movie based on their movie preferences. Improve it enough and you win one (or more) Prizes. Winning the Netflix Prize improves our ability to connect people to the movies they love.” – www.netlfixprize.com
So what do they want?
10% improvement to their existing system.
They are paying $1 Million for this.

Problem Statement Similarly, “which movie will you like” given that you
have seen X-Men, X-Men II, X-Men : The Last Stand and users who saw these movies also liked “X-Men Origins : Wolverine”?
Answer:?

•Dataset
•Background for the problem
•Background for the Solution

Background - Dataset Netflix Prize Dataset
Netflix released data for this competition
Contains nearly 100 Million ratings
Number of users (Anonymous) = 480,189
Number of movies rated by them = 17,770
Training Data is provided per movie
To verify the model developed without submitting the predictions to Netflix “probe.txt” is provided
To submit the predictions for competition “qualifying.txt” is used

Background - Dataset Data in the training file is per movie
It looks like thisMovie#
Customer#,Rating,Date of Rating
Customer#,Rating,Date of Rating
Customer#,Rating,Date of Rating
- Example 4:
1065039,3,2005-09-06
1544320,1,2004-06-28
410199,5,2004-10-16

Background - Dataset Data points in the “probe.txt”
looks like this (Have answers)
Movie#
Customer#
Customer#
1:
30878
2647871
1283744
Data in the qualifying.txt looks like this (No answers)
Movie#
Customer#, DateofRating
Customer#, DateofRating
1:
1046323,2005-12-19
1080030,2005-12-23
1830096,2005-03-14

Background – Dataset stats Total ratings possible =
480,189 (user) * 17,770 (movies) = 8532958530 (8.5 Billion)
Total available = 100 Million
The User x Movies matrix has 8.4 Billion entries missing
Sparse Data

Background of the problem Recommender Systems
Examples: Yahoo, Google, youtube, Amazon.
Recommend item that you might like.
The recommendation is made based on past behavior.
Collaborative Filtering [Gábor, 2009]
What is it?
Who collaborates and what is filtered?
How can it be applied in this contest?

Background of the problem Earlier systems implemented in 1990s.
GroupLens (Usenet articles) [Resnick, 1997]
Siteseer (Cross linking technical papers)[Resnick, 1997]
Tapestry (email filtering) [Goldberg, 1992]
Earlier solutions provided for users to rate the item.
Two major divisions of methods
Model based – fit a model to the training data.
Memory based – Nearest Neighbor Methods.

Background for the Solution K-Nearest Neighbor (K-NN) method.
Memory Based method.
Measures Distance between the query instance and every instance in the training set.
Find the K training instances with the least distance from query instance.
Using these K instances, average their rating for this movie for these training instances.
Distances can be measured using the following formulae.
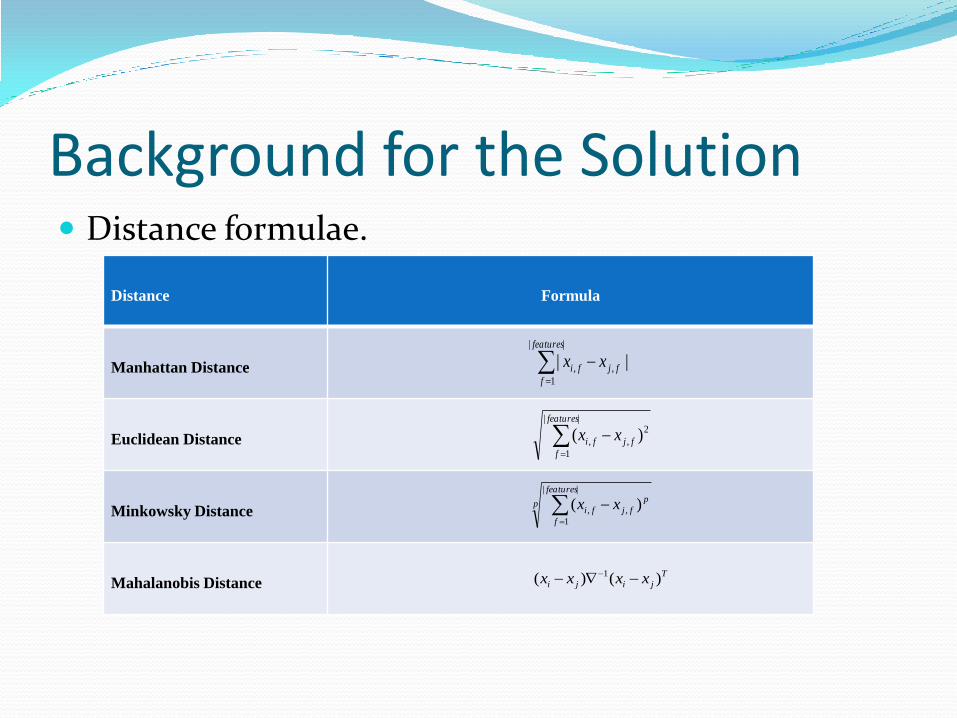
Background for the Solution Distance formulae.
Distance Formula
Manhattan Distance
Euclidean Distance
Minkowsky Distance
Mahalanobis DistanceT
jiji xxxx )()( 1
p
features
f
p
fjfi xx
||
1
,, )(
||
1
2
,, )(features
f
fjfi xx
||
1
,, ||features
f
fjfi xx

Background for the Solution How important is distance measure?
Curse of Dimensionality.
Example: what if we were to characterize the movie by it actors, directors, writers, genre, and then all of its CREW?
What is the problem?
What if some attributes are more dominant than others?
Example: Cost of home are much larger quantities than person’s height.

Background of the Solution What if I was very conservative about my rating and
someone else was too generous?
I rate the movie I like the most as 3 and the least as 1.
someone else rates his/her high at 5 and high at 3.
So am I like this person?
Difficult to say.
We are comparing two people with very high personal biases. Which will result in obvious flawed similarity measure.
Solution? Normalization of the data.
Background for the Solution Normalization
What is that?
How do we do it?
How will it change my ratings? Won’t I loose the original rating?
We will calculate
“Mean rating” for every user over the movies he / she has rated
Also calculate standard deviation for the user’s rating.
From every rating we will subtract the user’s mean rating and divide it by their standard deviation.

Background for the Solution Should all members of the neighborhood contribute
equally to the prediction?
Not always, we can argue that people who are similar to you, i.e. have least distance from you should contribute more than farther ones.
This is done by weighing the prediction by the instance’s distance from the query instance.

Background for the Solution Clustering
Idea is to group the items together based on their attributes.
Data is typically unlabeled.
Similarity is measured using the distance between the two points.
Example: Consider going in to a comic book shop and putting together comics from a pile of comics that are similar.
Types:
Partitional Clustering: K-Means
Hierarchical clustering: Agglomerative Clustering

Background for the Solution K-Means clustering [MacQueen, 1967]
Randomly select K instances as cluster centers.
Label every data point with its nearest cluster centers.
Re-compute the cluster centers.
Repeat the above two steps until no instances change clusters or certain iterations have gone by.
How is it related to our discussion today?

•K – Nearest Neighbor Algorithm
•Clustering Based Nearest Neighbor Algorithm

Proposed Solution K-Nearest Neighbor approach (Overview)
Given a query instance q(movieId, UserId)
normalize the data before processing.
Find the distance of this instance with all the users who rated this movie.
Of the these users select the K users that are nearest to the query instance as its neighborhood.
Average the rating of the users form this neighborhood for this particular movie.
This is the predicted rating for the query instance.

Proposed Solution - Example Example: (Representative data, not real)
Matrix
Star
Wars
Dark
knight Rocky
Sita
Aur
Gita
Star
Trek Cliffhanger A.I. MI X-Men
Jim 1 3 1 5 2 1 1
Sean 2 3 2 4 5 3
John 3 4 5 3 4
Sidd 4 3 4 2
Penny 5 2 2 5 1
Pete 5 ? 4 4

Proposed Solution - Example calculate the Mean and Standard Deviation vectors.
meanRating standardDeviation
Jim 2 1.527525232
Sean 3.166666667 1.169045194
John 3.8 0.836660027
Sidd 3.25 0.957427108
Penny 3 1.870828693
Pete 4.333333333 0.577350269

Proposed Solution - Example Normalized data
MatrixStar
Wars
Dark
knightRocky
Sita
Aur
Gita
Star
TrekCliffhanger A.I. MI X-Men
Jim -0.65 0.65 -0.65 1.96 0 -0.65 -0.7
Sean -1 -0.14 -1 0.71 1.57 -0.14
John -1 0.24 1.434 -1 0.24
Sidd 0.783 -0.26 0.78 -1.3
Penny 1.069 -0.53 -0.53 1.07 -1.1
Pete 1.15 ? -0.6 -0.58

Proposed Solution - Example So now we have a query instance q(Pete, Sita Aur Gita)
i.e. we wish to evaluate how much will Pete like movie “Sita Aur Gita” on a scale of 1 - 5.
To do this we need to indentify Pete’s two neighbors who rated this movie. (2-NN case).
Users who rated the movie Sita Aur Gita are.
candidate_users
Jim
Sidd
Penny

Proposed Solution - Example Users with their distance and the 2 neighbors in the
neighborhood are
2 Nearest Neighbors are Jim and Sidd.
Users Distance
Jim 0.500046868
Sidd 1.360699721
Peny 1.646395237

Proposed Solution - Example The average of the ratings by Jim and Sidd to movie
“Sita Aur Gita” is “0.7956”.
So is our prediction “0.7956” correct? Not yet.
This prediction is in normalized form.
We need to bring it back to Pete’s prediction level. How?
Multiply by Standard Deviation of Pete’s ratings.
Add Pete mean rating to this product.
(0.7956 * 0.5773) + 4.3333 = 4.7925
So predicted rating for Pete is 4.7925.

Proposed Solution – C-K-NN Clustering based Nearest Neighbor appraoch
Obtain for every movie its genre from external sources. (IMDB in our case)
Create for every user a vector representing each genre as one cell.
In that cell we count number of movies that users has rated for the genre. (We have one such vector for each user.)
Cluster the users as per the genres of the movie they have rated.
Cluster centers of these clusters represent the collective opinion of the users in that cluster about the movies of that particular genre. We call them “Super Users”
Proposed Solution – C-K-NN For each super user we predict rating of all the movies
of that genre as the average of the ratings of the users that rated the movie.
When presented with query point q(movieID, userID).
We find all the genre for that movie.
For each genre we calculate distance of the user from cluster centers for the genre.
We select the nearest K cluster centers and average the rating of these cluster centers for the movie to predict movie rating for this genre.
We average per genre predicted rating and get the predicted ratings for q.
Proposed Solution – Example (C-K-NN)
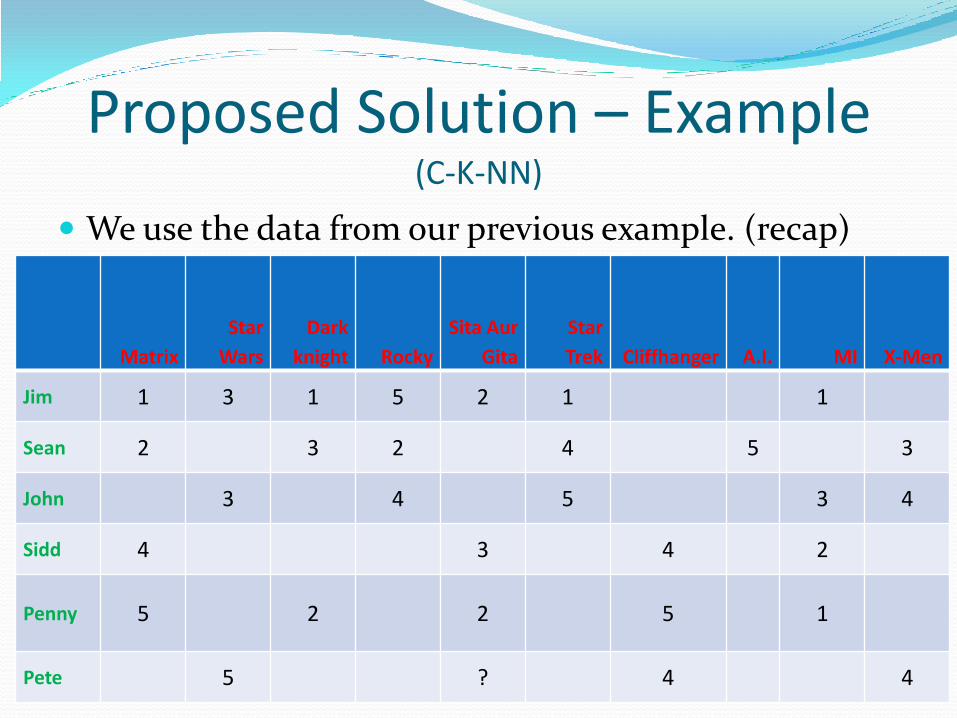
We use the data from our previous example. (recap)
Matrix
Star
Wars
Dark
knight Rocky
Sita Aur
Gita
Star
Trek Cliffhanger A.I. MI X-Men
Jim 1 3 1 5 2 1 1
Sean 2 3 2 4 5 3
John 3 4 5 3 4
Sidd 4 3 4 2
Penny 5 2 2 5 1
Pete 5 ? 4 4

Proposed Solution – Example (C-K-NN)
We find genre for every movie.
Action Adventure Crime Drama Fantasy Sci-Fi Sport Thriller
Matrix 1 1 1 1
Star Wars 1 1 1 1
Dark Knight 1 1 1
Rocky 1 1Sita Aur
Gita 1 1
Star Trek 1 1
Cliffhanger 1 1 1
A.I. 1 1 1
MI 1 1 1
X-Men 1 1 1

Proposed Solution – Example (C-K-NN)
Convert User – Movie Data to User – Genre
Action Adventure Crime Drama Fantasy Sci-Fi Sport Thriller
Jim5 4 1 1 1 2 1 3
Sean5 3 1 1 0 4 1 3
John4 3 0 0 1 3 1 2
Sidd3 4 0 1 0 1 0 3
Penny4 4 1 1 0 1 0 4
Pete3 2 0 0 1 2 0 2

Proposed Solution – Example (C-K-NN)
We cluster users in to two clusters.
Action Adventure Crime Drama Fantasy Sci-Fi Sport Thriller
Jim1 1 1 1 1 1 1 1
Sean1 2 1 2 2 2 1
John1 2 2 2 1 2
Sidd2 1 2 1 1
Penny1 1 2 1 1 1
Pete2 2 1 1 2

Proposed Solution – Example (C-K-NN)
The query point as last time is q(Pete, Sita Aur Gita)
Per genre cluster look like (Genres of “Sita Aur Gita”)
Adventure Drama
1 2
Matrix 2.5 3.5
Star Wars 3 5
Sita Aur Gita 2.5 2
Star Trek 3 4
Cliffhanger 4 4.5
A.I. 5
MI 2 1
1 2
Sita Aur Gita 2 3
A.I. 5

Proposed Solution – Example (C-K-NN)
Distance of Pete from Cluster centers of Adventure
Distance of Pete from Cluster centers of Drama
Not applicable as Pete does not rate any movie from that genre.
We try to find one (K=1) nearest cluster for Adventure genre. That is cluster two.
1 2
Pete 2 0.5
Proposed Solution – Example (C-K-NN)
Hence, the rating for the query point q(Pete, Sita AurGita) calculated by taking the rating of cluster two of adventure genre.
Our prediction is: 2 for this movie.
What if Pete had rated one of the movies from drama genre?
We would predict the rating for Drama genre as well for Pete
Then, average the predicted rating for the two genre to get the final rating.


Experiments – Setup Dataset used – Netflix Prize Dataset.
Experiments performed on Randomly selected 1121 movies covering 60045 users.
These data instances are chosen form the probe file from the Netflix Dataset.
We have the ratings for these instances in the training data.
These instances are treated as Hold out set in the experiments.

Experiments – Setup We normalize the data for the K-NN method
Predictions so done are converted back to the de-normalized form
We test the same set of movie, user pairs on both methods
Standard K-Nearest Neighbor
Clustered-K-Nearest Neighbor

Experiments - Setup This is a regression problem, hence we want to know if
we are off the expected value, how off are we?
Hence, Test Metric used is
Root Mean Square Error (RMSE):
Absolute Average Error (AAE):
Time taken.

Experiments - Implementation K-NN
Implemented C / C++.
Classes converted to Structure.
Difficult to manage the massive dataset in the memory.
Size of the program makes it difficult to run in C++
Comparison to every user needs a lot of fine tuning of the code to achieve a reasonable performance
K-NNs inherent problem
Ease of implementation vs. speed is important trade off
Using maps, vectors only adds storage speed added is negated by this.

Experiments - Implementation C-K-NN
Implemented using Perl, Matlab, Python, MySQL.
Perl’s hashes of hashes came to rescue
Ease of token / string processing was most helpful
Complex logic hence easy to express in Perl (Regex help)
Python Interfaces with IMDB (IMDbPY), MySQL has local database of IMDB.
Matlab does the clustering (K-Means)
Fine tuning of algorithm and ample available memory negates the slow / interpreted nature of the languages.

Experiments - Results Result on described dataset
Method Absolute Average Error Root Mean Square Error Time (Minutes)
K-NN 0.5087 0.67164 8640 *
C-K-NN 0.6894 0.88995 9
Netflix (Ladder Board
Topper)
NA 0.8596 NA
Netflix Current System1 NA 0.9514 NA

Experiments - ResultsRMSE Comparisons Time taken
0
0.1
0.2
0.3
0.4
0.5
0.6
0.7
0.8
0.9
1
K-NN C-K-NN Netflix (Current Topper)
Netflix (Current System)
Comparison of the RMSE and Absolute Average Error
RMSE
Absolute Average Error
0
1000
2000
3000
4000
5000
6000
7000
8000
9000
K-NN C-K-NN
Time in Minutes
Time in Minutes

Experiments - Results
0
2000
4000
6000
8000
10000
12000
0 0.1 0.2 0.3 0.4 0.5 0.6 0.7 0.8 0.9 1 1.1 1.2 1.3 1.4 1.5 1.6 1.7 1.8 1.9 2 2.1 2.2 2.3 2.4 2.5 2.6
Distribution of the Absolute Average Error for K-NN and C-K-NN methods
Number of Movies with error for standard K-NN method
Number of Movies with error for C-K-NN method


Related Work Methods already applied to this problem are
Matrix Factorization Methods –
Regularized Singular Value Decomposition [Paterek, 2007][Webb, 2007]
Baises with Regularized SVD [Paterek, 2007]
Probabilistic Latent Semantic Analysis – pLSA [(Hofmann, 2004]
Nearest Neighbor Methods [Bell and Koren, 2007]
Alternate Least Squares [Bell and Koren, 2007]
Post processing of SVD features. [Paterek, 2007]


Future Work K-NN method
Different values of K could experimented
Distributed processing of this problem
Distance weighing the contributions from neighbors
C-K-NN Trying different # of clusters
Dates provided with the ratings could be used in clustering along with genre
More information form IMDB or other sources might included
Application of Movie clustering and then predicting the rating for users is also possible

Conclusions We presented results of two methods to solve the
Netflix Prize Problem including a novel based clustering method
First method, a standard K-Nearest Neighbor method although gets lower RMSE value is very slow in prediction A function of comparison with every user who rated this
movie
Second method, clusters the users based on the genre of the movies they rated and creates super users from these clusters

Conclusions Standard K-NN method performs slightly better
compared to the Clustering based method on the Root Mean Square Error metric but is extremely slow
Our clustering based method has higher Root Mean Square Error than Standard K-NN method but is extremely fast and practical for large scale method implementations
It also shows promise of being accurate for many predictions

