business intelligence at albert heijn - pvkouuid:d695c745-042a-4bc3... · supplier buyer...
TRANSCRIPT

Business Intelligenceat Albert Heijn
Information for
Egbert DijkstraDirector Business IntelligenceInformation Management Europe
Zaandam, April 2009
Information forCompetitive Advantage
2008
Personal background
n 2008 - Ahold Europe – Responsible for BI Strategy & Analytics
n 2006 - 2008 Ahold Global – Director Business Intelligence
n 1997 - 2006 Albert Heijnn Manager Business Intelligencen Implementation Albert Heijn Bonuscard
Member of IT Management Team
Business Intelligence – Information for Competitive Advantage - April 2009 Slide 2
n Member of IT Management Team
n 1990 - 1997 Vroom&Dreesmannn Program manager BI / Category Managementn Cobol Programmer, System Designer
n Studies: Politics – Free University Amsterdam.

2008 Sales: € 9 billion
Sales growth year on year
12,3%12,9%12,1%
Characteristics Albert Heijn
Business Intelligence – Information for Competitive Advantage - April 2009 Slide 3
4,7%
9,2%
10,6%
2006 2007 2008 2008Identical
2009 Q1 2009 Q1Identical
12 million weekly customers8,5 million loyalty cards100 million ticket-line items per week.

Characteristics Albert Heijn
Market leader in the Netherlands60.000 employeesFounder of Royal Ahold
825 Stores in total 200 are run by franchisees
Business Intelligence – Information for Competitive Advantage - April 2009 Slide 4
200 are run by franchisees
4 Types of stores§ Everyday Supermarket § Albert Heijn XL – 4.000 square meters§ AH-to-Go - Convenience stores§ Albert - internet delivery.

Business Intelligence – Information for Competitive Advantage - April 2009 Slide 5

Business Intelligence – Information for Competitive Advantage - April 2009 Slide 6

Information as a corporate asset
§ Today companies offer similar products, using comparable technologies
§ There is growing understanding that Information is key factor in achieving competitive advantage
§ So, there is a need for better & faster business insight compared to
Business Intelligence – Information for Competitive Advantage - April 2009 Slide 7
§ So, there is a need for better & faster business insight compared to our competitors
§ As a result, Information must be regarded as a corporate asset.

Information at Albert Heijn in 2000: stand-alone solutions
Supplier BuyerReplenish-mentLogisticsMerchan-
diser Marketing Store Customer
Business Intelligence – Information for Competitive Advantage - April 2009 Slide 8Slide 8
Operational Environment
MerchandisingSales
FinanceLogistics
StockWMS
Item
HR
Etc.
CognosPowerPlay
SASMainframe
BOOracle
MarketExpert
SASMainframeSAS Unix
BOOracle
Nielsen/IRI Weather

Supplier BuyerReplenish-mentLogisticsMerchan-
diser Marketing Store Customer
Information at Albert Heijn in 2000: stand-alone solutions
Business Intelligence – Information for Competitive Advantage - April 2009 Slide 9Slide 9
Operational Environment
MerchandisingSales
FinanceLogistics
StockWMS
Item
HR
Etc.
Many Informational “Solutions”
CognosPowerPlay
SASMainframe
BOOracle
MarketExpert
SASMainframeSAS Unix
BOOracle
Nielsen/IRI Weather

Supplier Buyer Merchandiser Logistics Marketing Replenishment Store Customer
Covering & supporting total value chain
Today: one copy of the truth
Business Intelligence – Information for Competitive Advantage - April 2009 Slide 10Slide 10
One Informational Environment
Operational Environment
MerchandisingSales
FinanceLogistics
StockWMS
Item
HR
Etc.Nielsen/IRI Weather
Consistent, Single view of business over Multiple Dimensions
Adding Value through Integration of Information
Providing History and Performance
The answer to any question – instantly

Today’s situation“Pallas” - Goddess of wisdom
§ One informational environment – one copy of the truth§ Sourcing 75% of transactional systems – real-time or batch§ History (8 years data) and detail § Standardized reporting & analysis functionality§ No more legacy, no more stove-pipe BI solutions
§ An Informational System “in it’s own right”
§ Servicing all business processes and all departments§ From operational to strategic support§ Internal & external (internet)
Business Intelligence – Information for Competitive Advantage - April 2009 Slide 11
§ Internal & external (internet)
§ Available & used 24/7
§ Usage on a weekly level§ 2.200 actual individual internal users§ 170.000 reports (in total 2008: 7,8 million)§ 60.000 customers
§ Total investment: € 30 mio.

§ The strategic approach concerning BI was driven by:
§ Differentiation strategy;
§ Increasing business need for more detailed, accurate, timely and consistent information;
Reasoning for BI-development
Business Intelligence – Information for Competitive Advantage - April 2009 Slide 12
§ Increasing awareness about the value of information;
§ Understanding that further proliferation of multiple non-integrated, and costly stove-pipe BI solutions was not the way to go.

Pallas - Basic Architecture
Operational Source
Operational Source
ODS
MOLAP
Flat FileFlat FileStandardReporting
Ad-HocReporting
One central repository
• all data from all sources• In real-time or batch • 100% of the data • on the lowest level
Specific data marts per process layer
Tuned & tools depending on specific business need
Business Intelligence – Information for Competitive Advantage - April 2009 Slide 13
near real time
automatic input to operational process
Enterprise Data WarehouseMulti-subject oriented; total value chain
Operational
Source
SourceSource
Operational Source
ODSOperational Source
RelationalData Mart
Transaction
Repository Analysis
DataMining
Procedures & Organisation
Meta Data Layer

Oracle§ # Databases: 16
§ # Tables: 4.189
§ # Columns: 59.381
MicroStrategy (Reporting)§ # metrics (facts): 1.600
§ # reports & documents: 1.350
§ # weekly users: 2.300
Impression size & complexity Pallas
Essbase (Analysis)Powercenter ETL
Business Intelligence – Information for Competitive Advantage - April 2009 Slide 14
Essbase (Analysis)§ # metrics (facts): 450
§ # Cubes: 21
§ # Users: 150
Powercenter ETL§ # folders: 177
§ # mappings: 2.179
§ # workflows: 1.512
“Pallas” is responsible for app. 50% of the company’s total IO
User data: 20 TB, adding 300 GB per month - Metadata: 220 GB

PredictionWhat mighthappen?
Available functionality HIGH
Complexity Advanced Analytics
On top of that: three ad-hoc services:
• “Quick Service” – data provided within 30 minutes
• “Analytical Service” – data&analysis when needed
• Direct data Access by analytical power users
Business Intelligence – Information for Competitive Advantage - April 2009 Slide 15
happen?
AnalysisWhy did ithappen ?
ReportingWhat
happened ?
MonitoringWhat´s happening
now ?
Complexity
Query, reporting & search tools
Dashboards, scorecards
Olap and visualization tools
Essbase
HIGHLOW Business Value

Spin-off
§ Given the architecture and presence of data in Pallas additional solutions are cheap and fast to implement
§ Dedicated Data Mart for Albert.NL € 4.000§ Historical data for EMS Ranking tool € 10.000§ PI Ratio Analysis € 3.200
Business Intelligence – Information for Competitive Advantage - April 2009 Slide 16
§ Ad-hoc questions (1.500 Quick Service calls in 2008) can be answered within minutes§ The answer is available when needed§ Against minimal cost.

Number of items
TimeProduct Location
So, let’s give an example: sales
Payment type
Checkout type
detailsdetails
details
detailsdetails
35.897.821.577
Business Intelligence – Information for Competitive Advantage - April 2009 Slide 17
Number of itemssales price
purchase price
Place in Store
CashierCustomer
Promotion Weather
detailsdetails
details
details details
35.897.821.577
Functional Coverings (1)
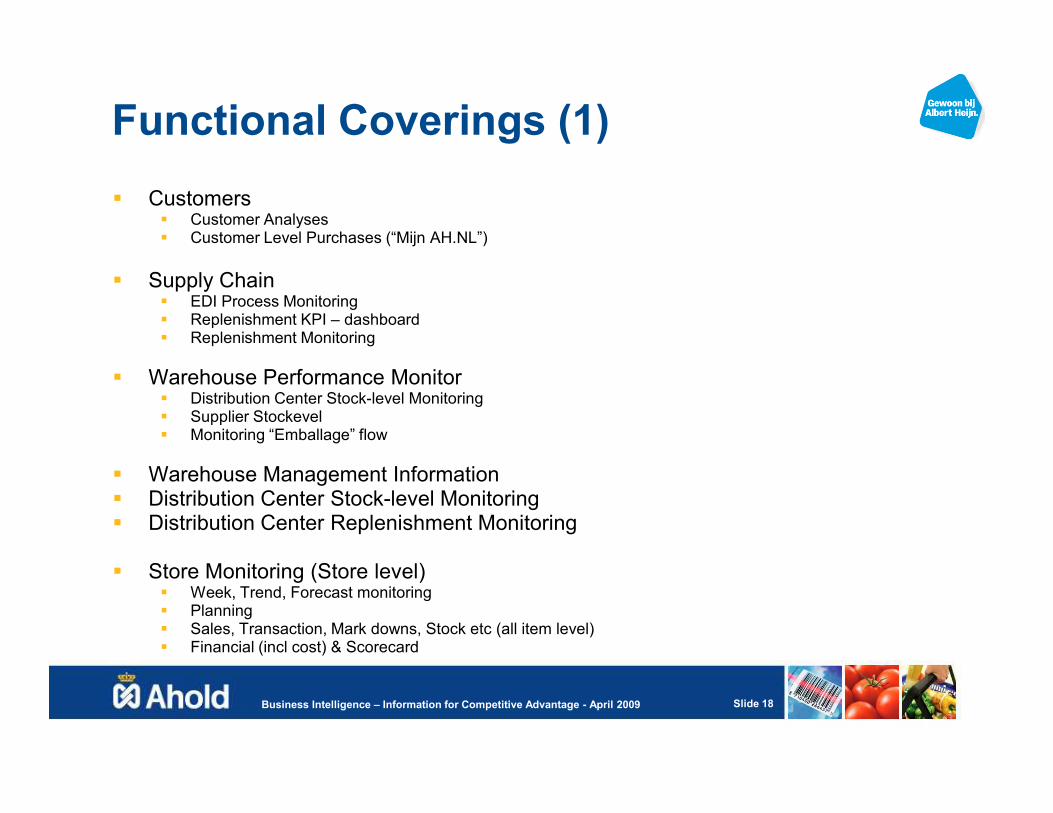
§ Customers§ Customer Analyses§ Customer Level Purchases (“Mijn AH.NL”)
§ Supply Chain§ EDI Process Monitoring§ Replenishment KPI – dashboard§ Replenishment Monitoring
§ Warehouse Performance Monitor§ Distribution Center Stock-level Monitoring
Business Intelligence – Information for Competitive Advantage - April 2009 Slide 18
§ Distribution Center Stock-level Monitoring§ Supplier Stockevel§ Monitoring “Emballage” flow
§ Warehouse Management Information§ Distribution Center Stock-level Monitoring§ Distribution Center Replenishment Monitoring
§ Store Monitoring (Store level)§ Week, Trend, Forecast monitoring§ Planning§ Sales, Transaction, Mark downs, Stock etc (all item level)§ Financial (incl cost) & Scorecard

Functional Coverings (2)
§ Merchandising§ Sales Reporting§ Forecasting§ Category Performance Improvement§ Supplier Performance§ Promotion Analysis§ Market Analysis
§ Information Management§ Daily and YTD IT Production overview§ IT Server (Hardware) Monitoring§ IT Heldesk Calls Reporting
Business Intelligence – Information for Competitive Advantage - April 2009 Slide 19
§ IT Heldesk Calls Reporting
§ Warehouse Execution - Operational§ Employee§ Production§ Warehouse Logistics§ Transport§ Replenishment
§ Warehouse Transport Monitoring – Operational
§ AH Masterdata (Store and Article information) – operational

Functional Coverings (3)
§ HR Reporting & analysis§ Competition information (Nielsen, IRI) § External Information (Weather, CBS)§ Employee Discount Calculation§ Shelf Optimization§ Supplier Access (Pallas For Internet)§ Store Location Analysis § Monitoring quality stock-level management§ Supplier Contract Management Monitoring
Business Intelligence – Information for Competitive Advantage - April 2009 Slide 20
§ Ahold Real Estate Reportal§ Gall&Gall Sales Reporting§ Albert.nl Sales Reporting
§ Pallas Metadata§ Calls & incidents§ Usages abd Servicve Reporting§ Timelines & availability§ Data Quality & Performance

Now it´s time to climb the top...
Realize all potential value Albert Heijn will take action in order to become a real analytical champion
Business Intelligence – Information for Competitive Advantage - April 2009 Slide 21
Foundation is now in place80% of sources, mature and stableenvironment, Supporting all businessProcesses.

AdvancedAnalyticsWhat might
Pallas Functionality HIGH
Complexity
Forecasting, Statistics, Modeling
Now the focus is on these areas
• Predictive modelling• Optimization techniques• Visual Analysis • Automation of Decisions
Business Intelligence – Information for Competitive Advantage - April 2009 Slide 22Slide 22
What mighthappen?
AnalysisWhy did ithappen ?
ReportingWhat
happened ?
MonitoringWhat�s happening
now ?
Complexity
Query, reporting & search
Dashboards, scorecards
Olap and visualization tools
HIGHLOW Business Value

From “one copy of the truth” to “one copy of the future”
TodayYesterday Tomorrow
Reporting
Descriptive Analysis
Monitoring Analytics
Predictive modellingOptimization
Business Intelligence – Information for Competitive Advantage - April 2009 Slide 23Slide 23
OptimizationAutomation of Decisions
Visual Analysis
“Analytics” predicts what will happen tomorrow. The better the prediction, the better the actions of today are in line with what will
actually happen. The better the business results will be.

§ No more: “We could have known this”§ “Analytics” as core capability§ Intelligent use of information has
become explicit, instead of implicit§ Do we think, or do we know?
Our Ambition: An Analytical Culture
Business Intelligence – Information for Competitive Advantage - April 2009 Slide 24
§ Fact-based decision making at every level of the organization.

Analytics - characteristics§ People with the right skills
§ Expertise in math, statistics, data analysis§ Speaking also the language of the business§ Doing their own internal marketing§ Open mindset
§ Enterprise approach, cross-functional (not departmental) § Strong leadership
Business Intelligence – Information for Competitive Advantage - April 2009 Slide 25
§ Strong leadership
§ Mature business intelligence environment§ Using internal and external data§ Structured and non-structured data§ Common technology and tools.

Almost all business area’s will profit
§ Product introductions§ Reduction of customer churn§ Marketing/media effectively§ Forecasting finance§ Fraud detection§ Workforce Planning§ Assortment differentiation§ Loyalty management/Consumer Insight § Price optimization
Business Intelligence – Information for Competitive Advantage - April 2009 Slide 26
§ Price optimization§ Promotion Management § Mark Downs§ Predict cross-sell or up-sell opportunities by customer segment§ Replenishment forecasting§ Supply Chain Optimization§ Employee turnover§ Inventory Management DC’s § Workforce analytics§ ….
Fact-based decision making at every level of the organization to drive superior performance
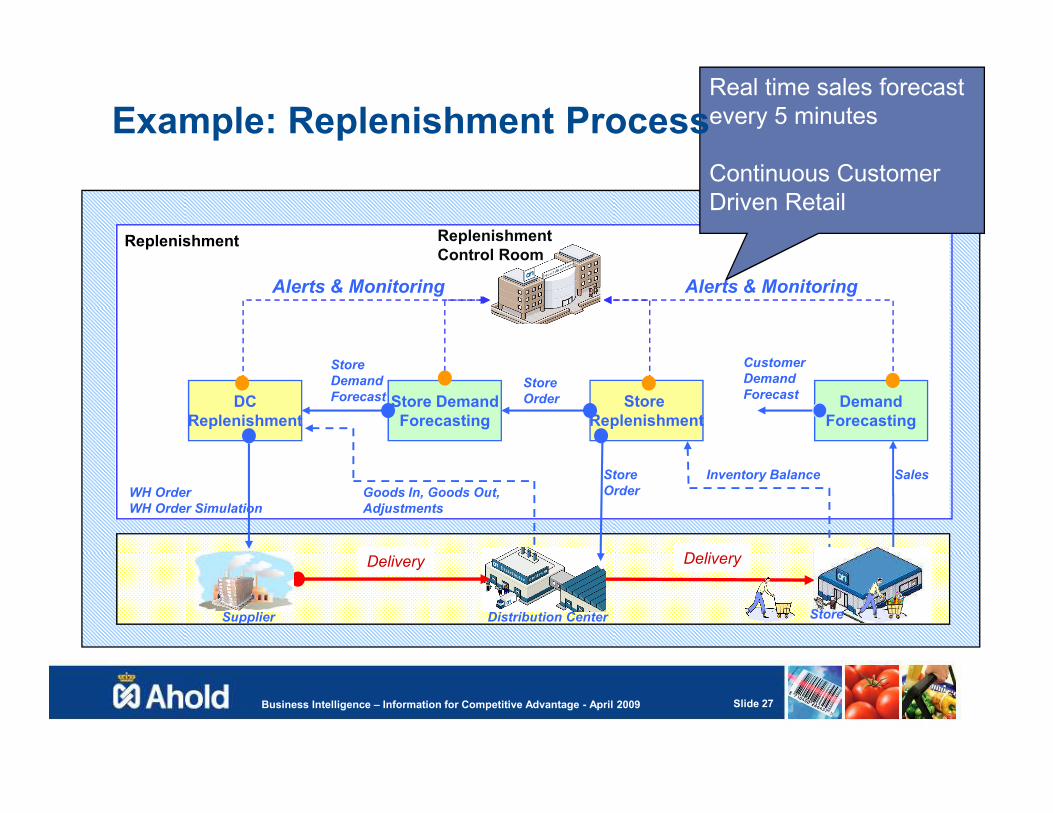
Replenishment
CustomerDemandForecast
Alerts & Monitoring
DCStore Order DemandStore Demand Store
Store Demand Forecast
ReplenishmentControl Room
Alerts & Monitoring
Real time sales forecast every 5 minutes
Continuous Customer Driven Retail
Example: Replenishment Process
Business Intelligence – Information for Competitive Advantage - April 2009 Slide 27
Distribution Center
Delivery Delivery
Store
SalesStoreOrderWH Order
WH Order Simulation
DCReplenishment
DemandForecasting
Store DemandForecasting
Store Replenishment
Goods In, Goods Out, Adjustments
Inventory Balance
Distribution Center StoreSupplier

Monitored by KPI’s over five dimensions
• AH-total, region, store• Assortmentgroup to article• year, period, week, day • Responsible manager• Format
Business Intelligence – Information for Competitive Advantage - April 2009 Slide 28
• Format

Thank You